Community Pharmacist-Provided Wellness and Monitoring Services in an Employee Wellness Program: A Four-Year Summary


Abstract
1. Introduction
2. Objective
3. Methods
3.1. Study Design
3.2. Intervention
3.3. Practice Innovation
3.4. Evaluation
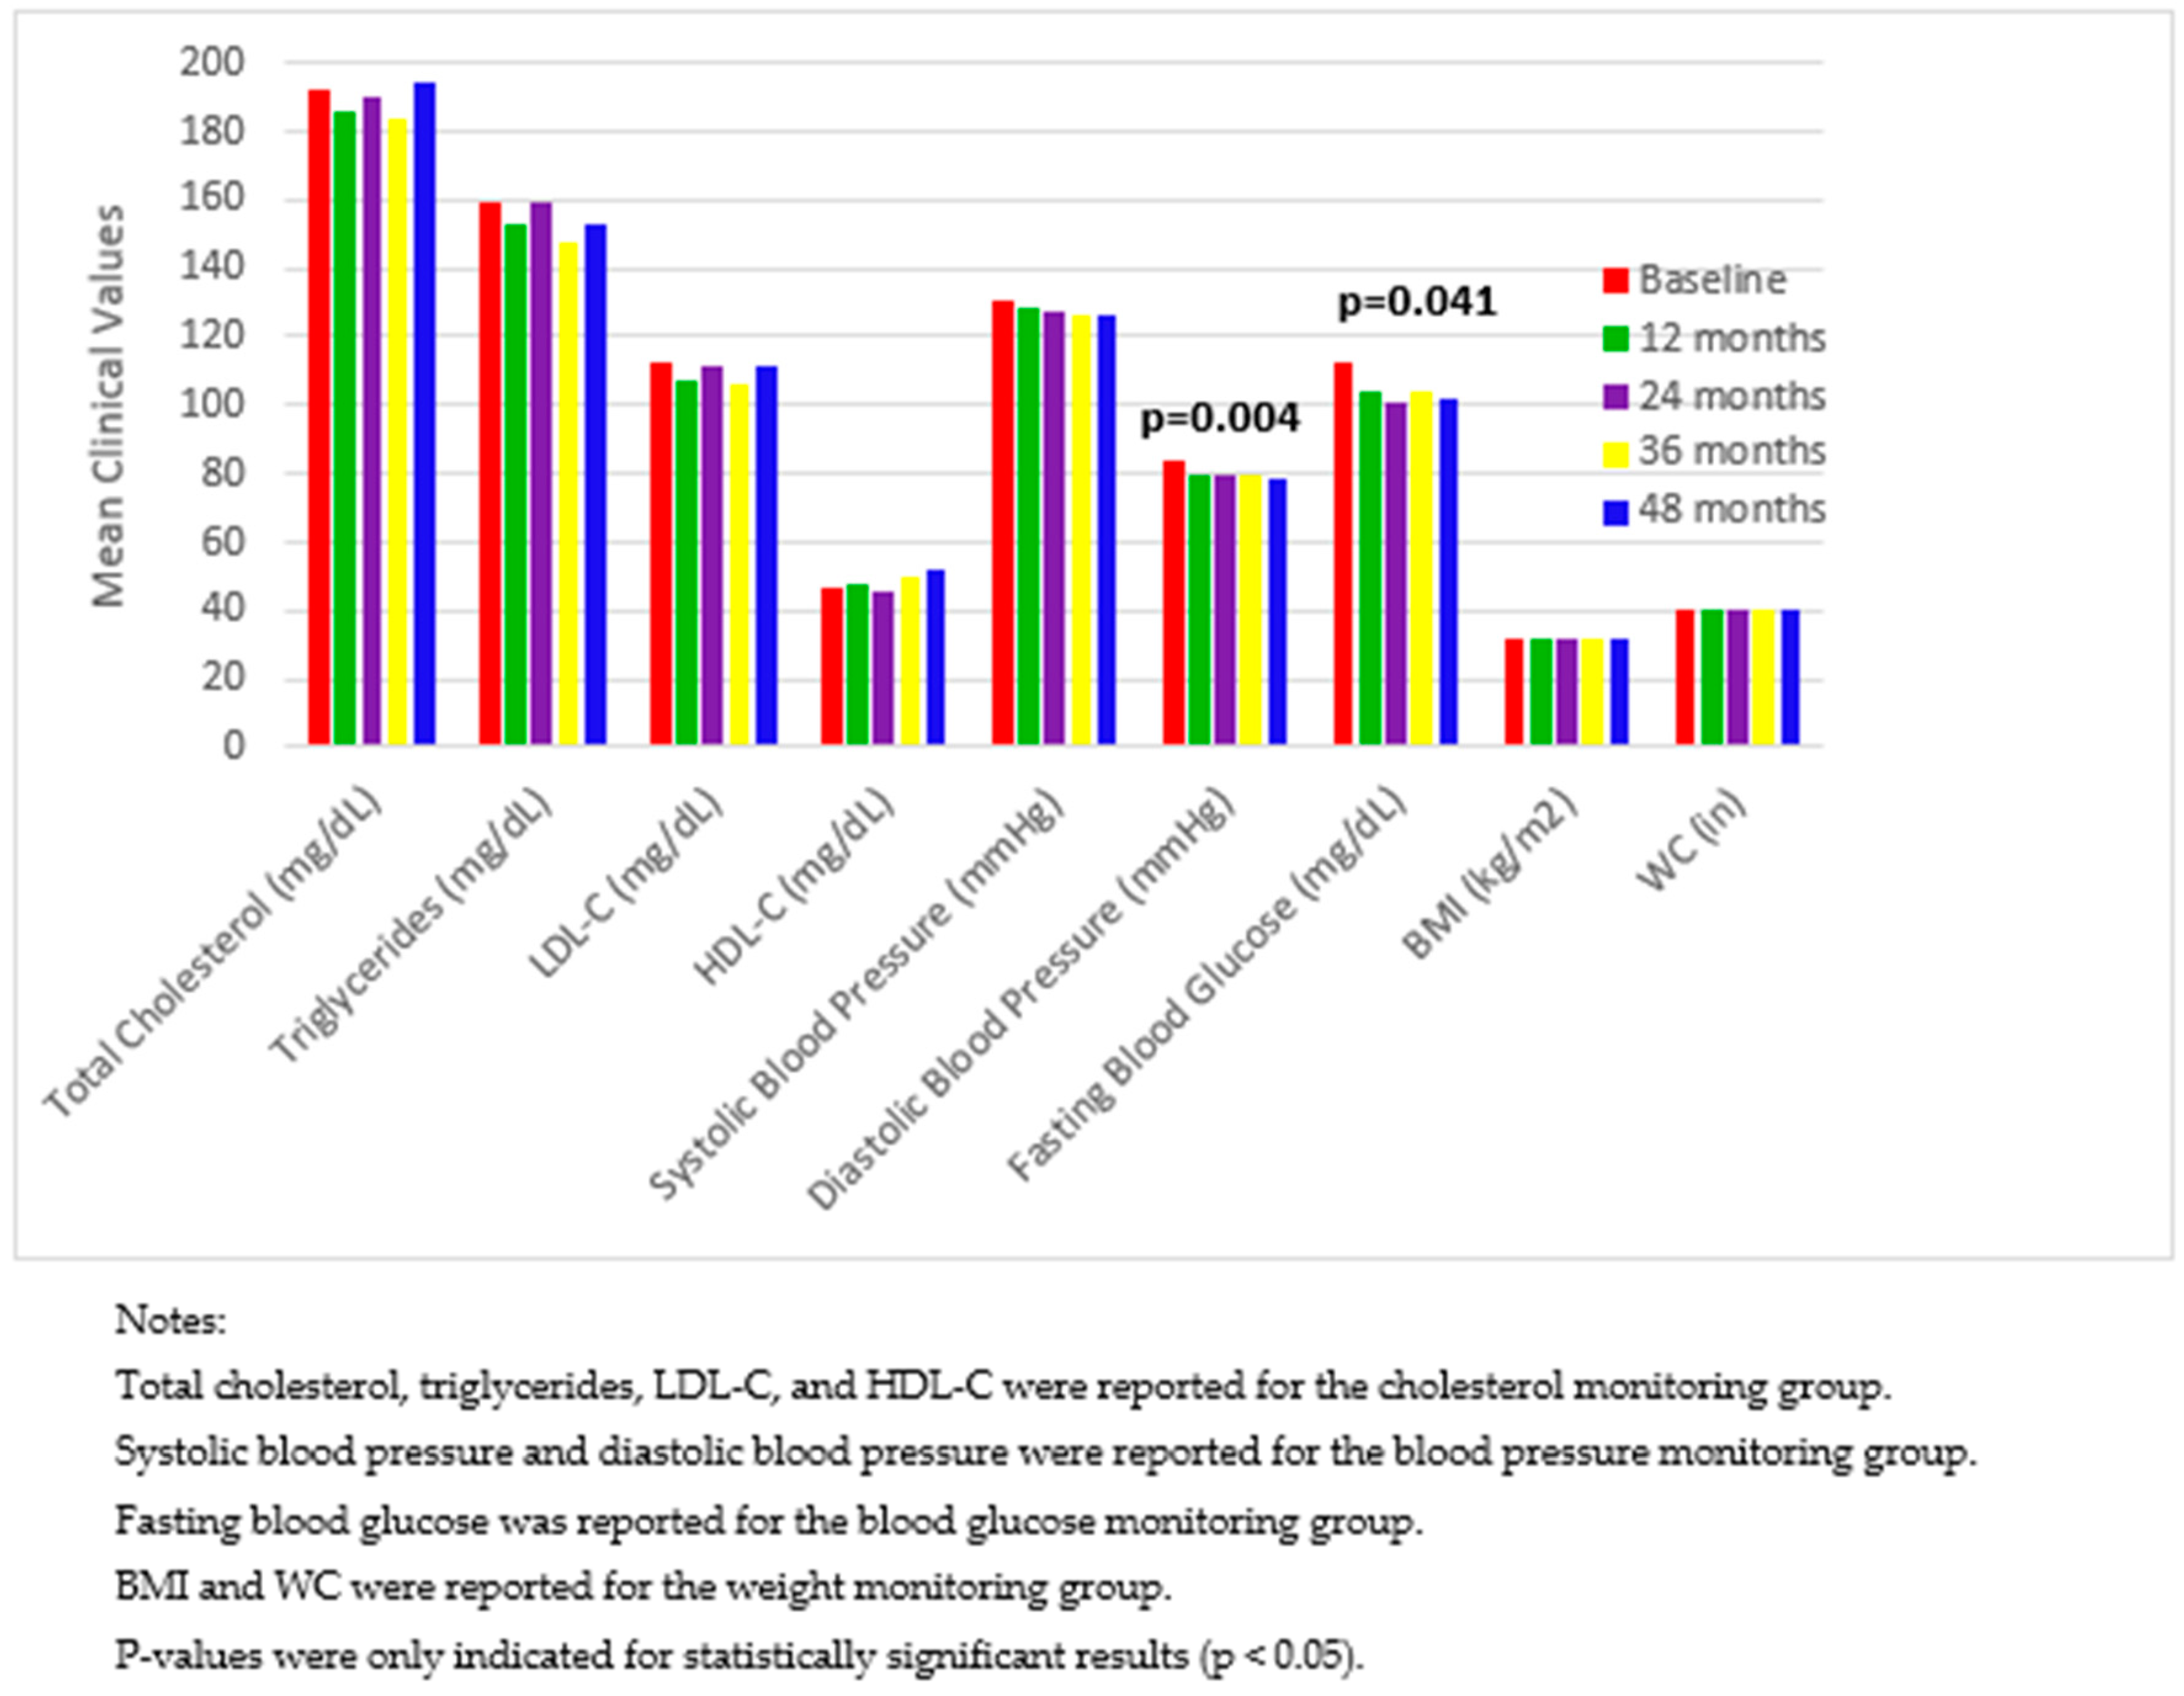
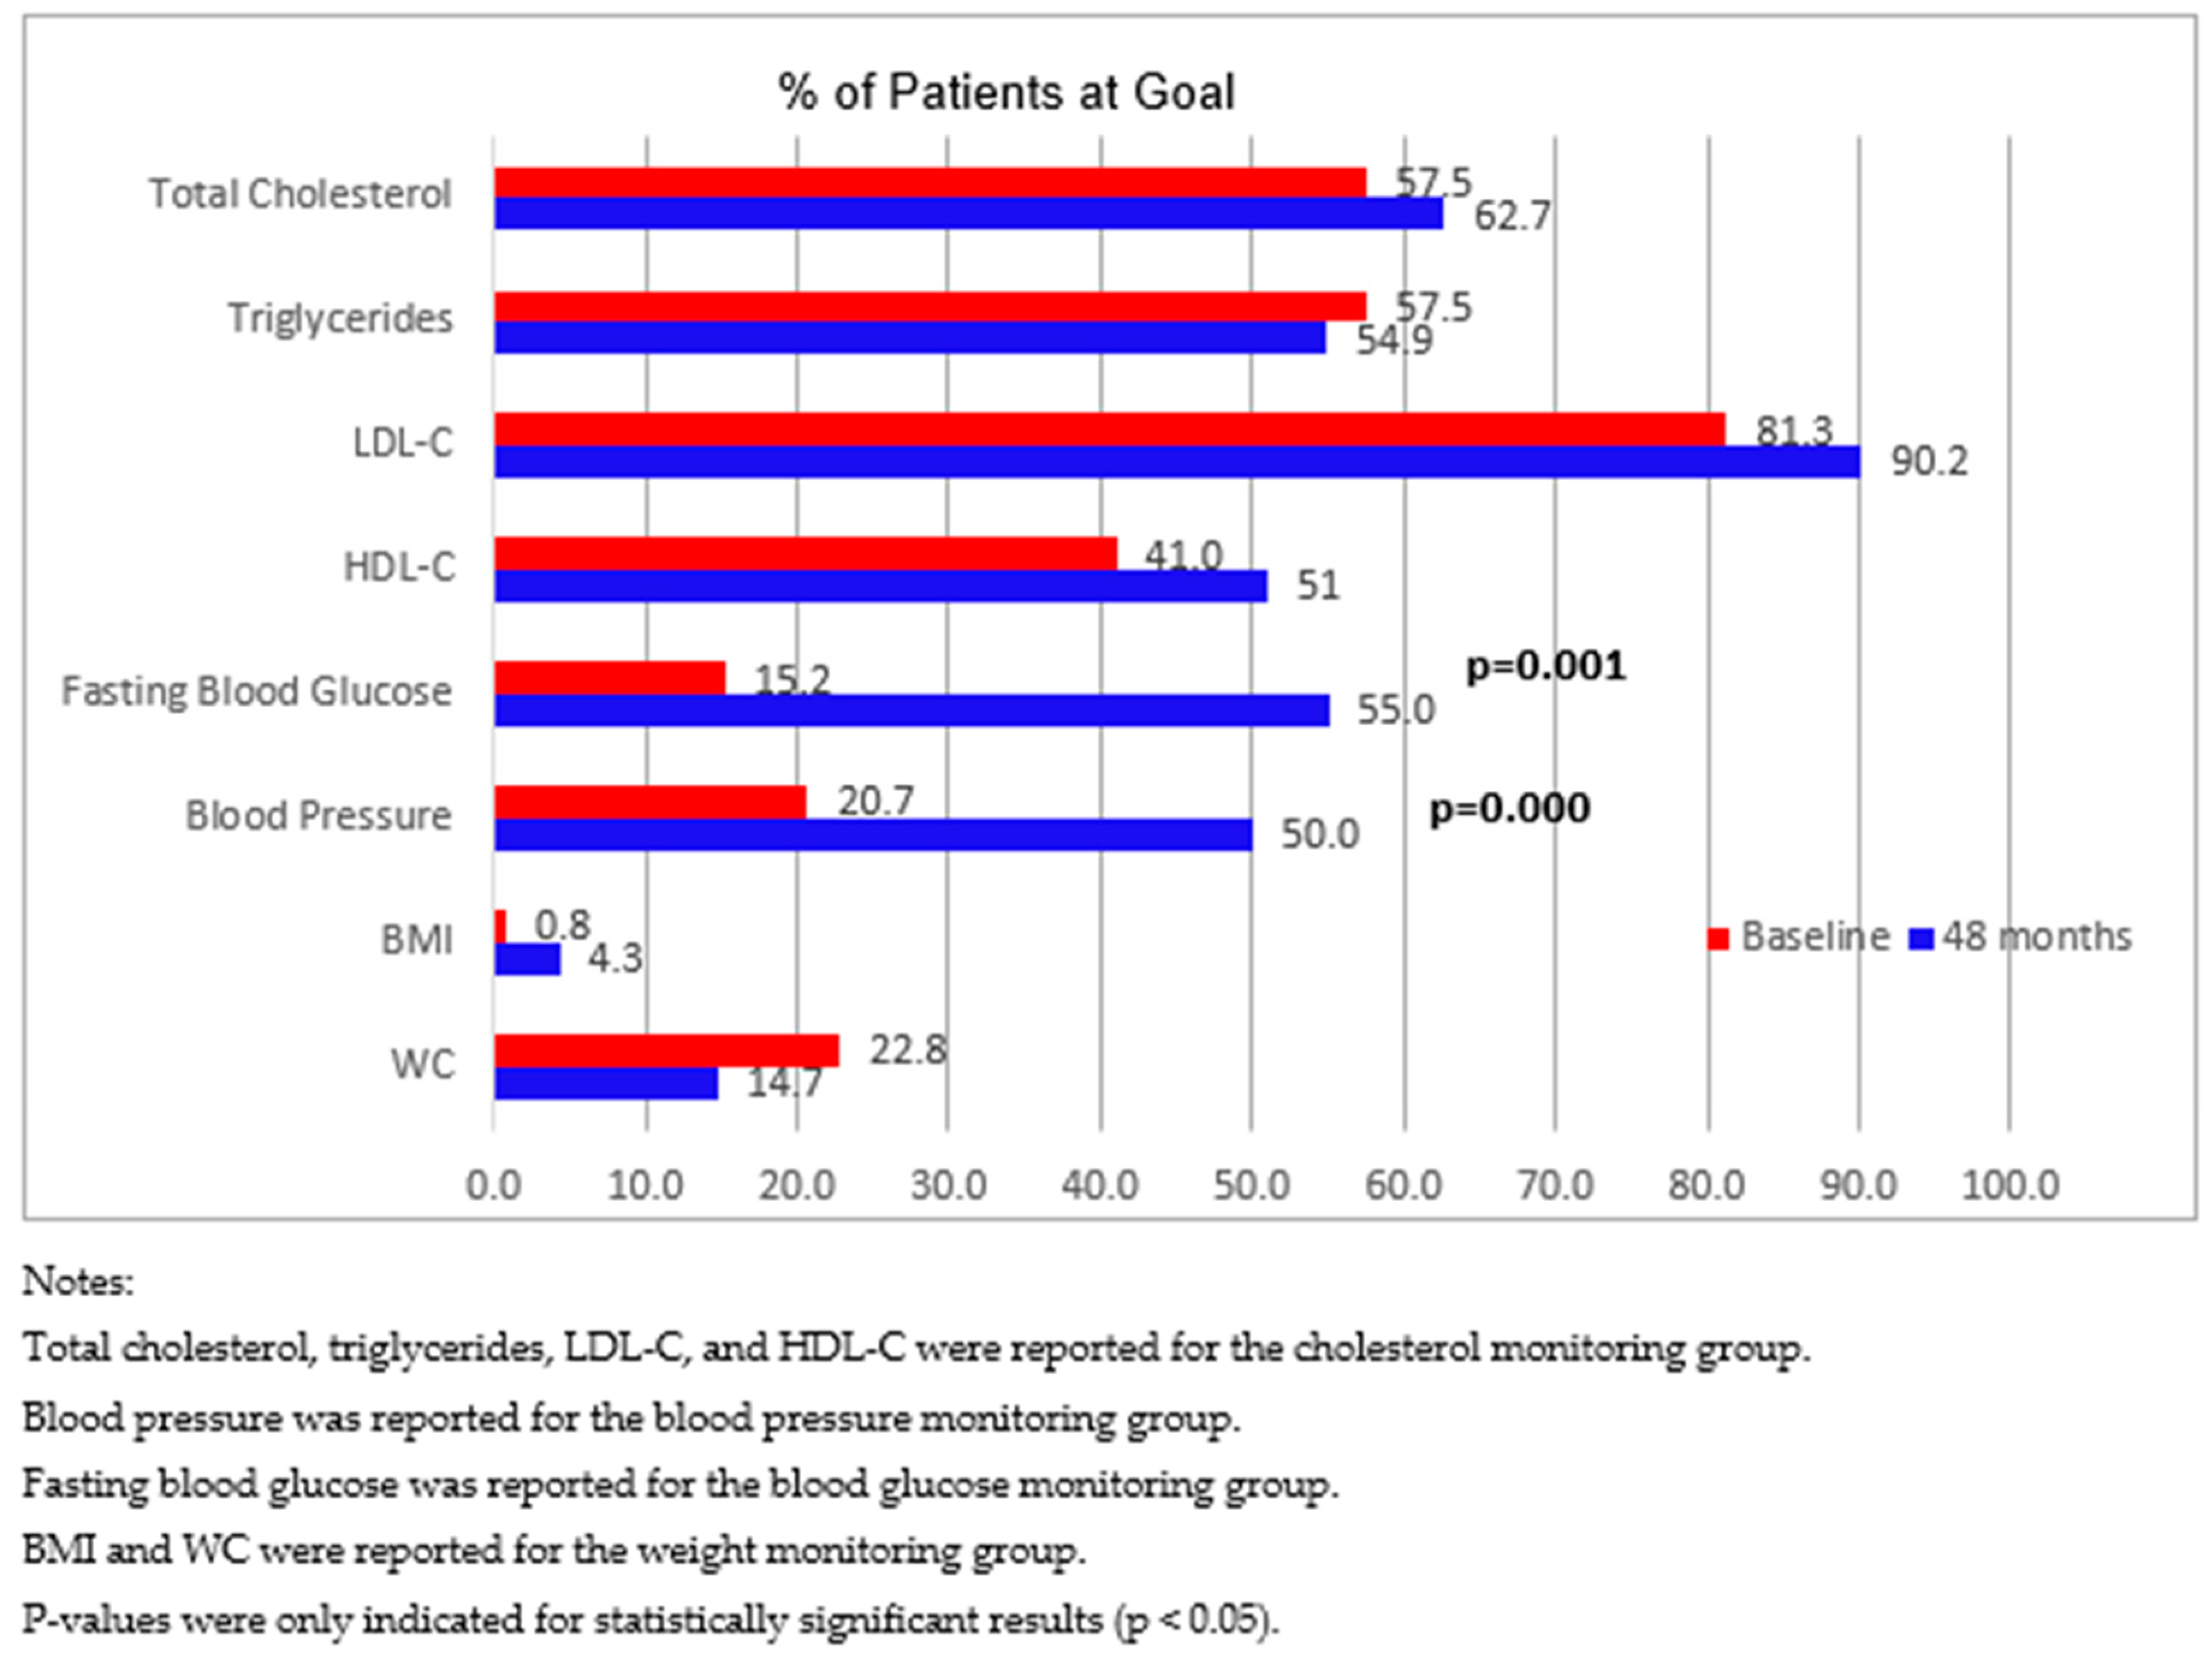
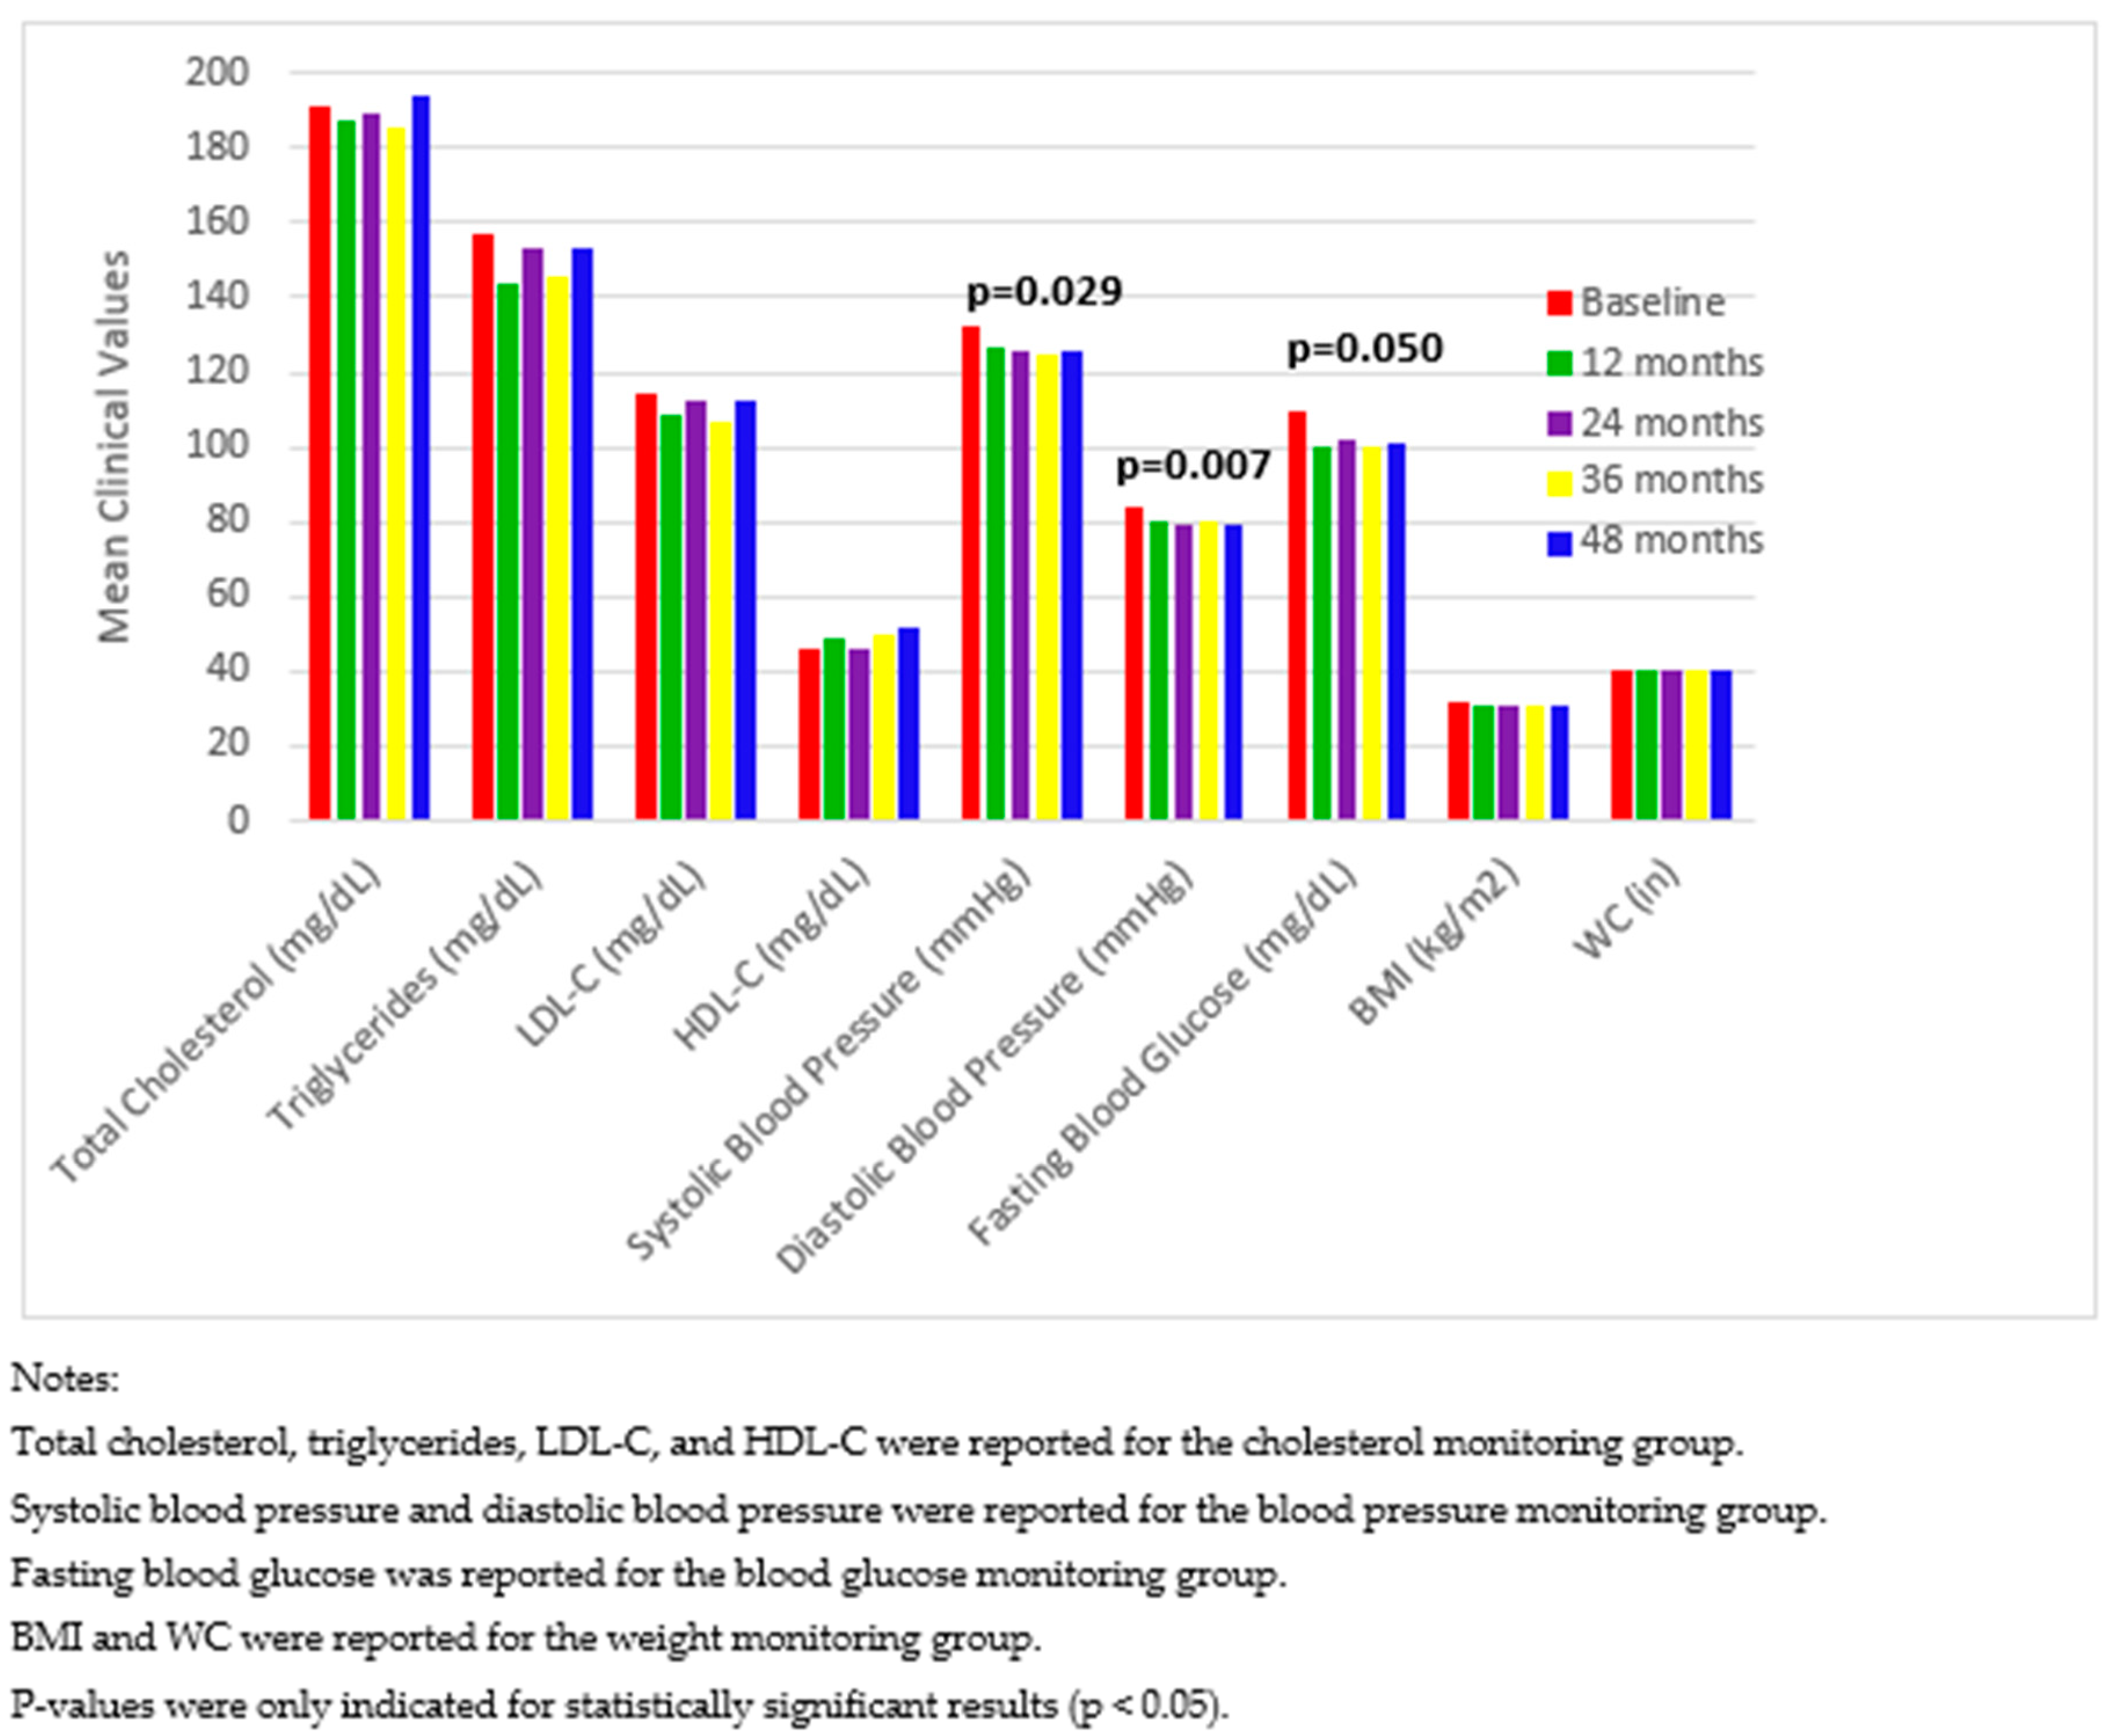
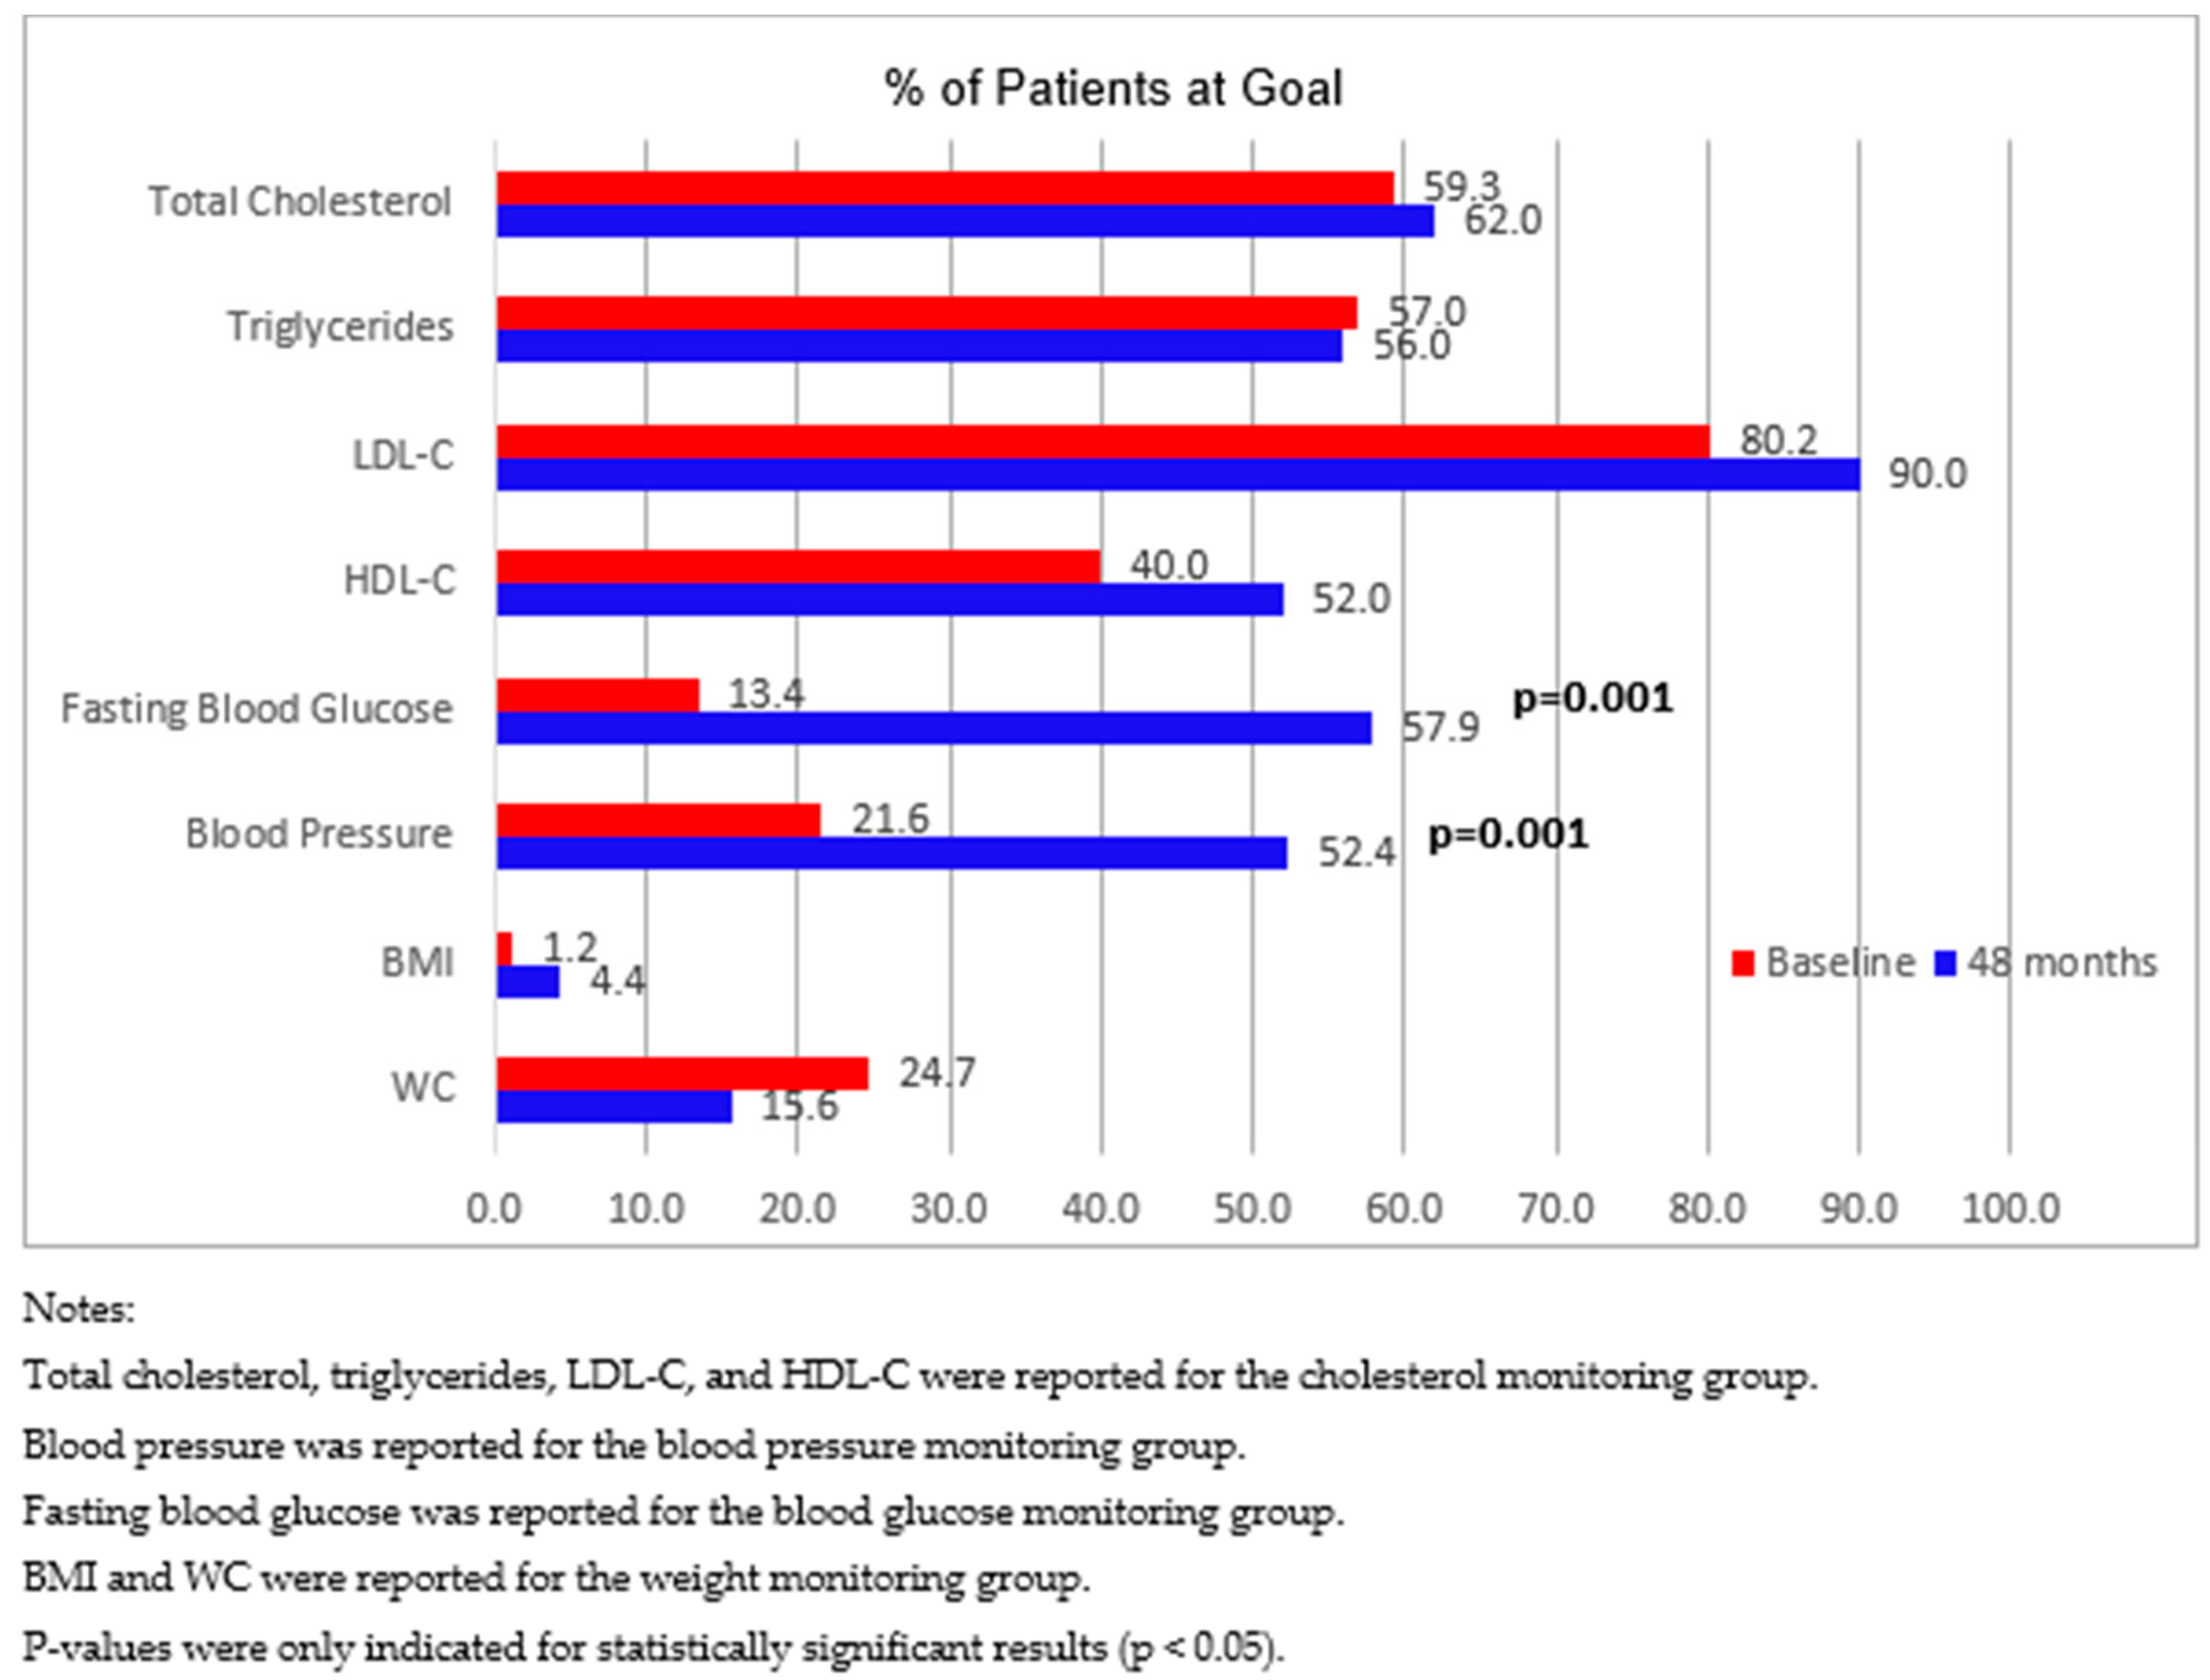
4. Results
5. Discussion
6. Conclusions
Author Contributions
Funding
Conflicts of Interest
References
- National Center for Chronic Disease Prevention and Health Promotion (NCCDPHP); Centers for Disease Control and Prevention. About Chronic Diseases. 2018. Available online: https://www.cdc.gov/chronicdisease/about/index.htm (accessed on 1 March 2019).
- Department of Health and Human Services; Agency for Healthcare Quality and Research. Multiple Chronic Conditions Chartbook. 2014. Available online: https://www.ahrq.gov/sites/default/files/wysiwyg/professionals/prevention-chronic-care/decision/mcc/mccchartbook.pdf (accessed on 1 March 2019).
- Asay, G.R.B.; Roy, K.; Lang, J.E.; Payne, R.L.; Howard, D.H. Absenteeism and employer costs associated with chronic diseases and health risk factors in the US workforce. Prev Chronic Dis. 2016, 13, E141. [Google Scholar] [CrossRef] [PubMed]
- Bright, D.R.; Terrell, S.L.; Rush, M.J.; Kroustos, K.R.; Stockert, A.L.; Swanson, S.C.; DiPietro, N.A. Employee Attitudes Toward Participation in a Work Site-Based Health and Wellness Clinic. J. Pharm. Pract. 2012, 25, 530–536. [Google Scholar] [CrossRef] [PubMed]
- Dalal, K.; Khoury, A.; Nyce, S. Demonstrating high performance at an on-site corporate health center. Benefits Q. 2014, 30, 55–67. [Google Scholar] [PubMed]
- Berdine, H.J.; O’Neil, C.K. Development and implementation of a pharmacist-managed university-based wellness center. J. Am. Pharm. Assoc. 2007, 47, 390–397. [Google Scholar] [CrossRef] [PubMed]
- Borah, B.J.; Egginton, J.S.; Shah, N.D.; Wagie, A.E.; Olsen, K.D.; Yao, X.; Lopez-Jimenez, F. Association of Worksite Wellness Center Attendance with Weight Loss and Health Care Cost Savings. J. Occup. Environ. Med. 2015, 57, 229–234. [Google Scholar] [CrossRef] [PubMed]
- Fanous, A.M.; Kier, K.L.; Rush, M.J.; Terrell, S. Impact of a 12-week, pharmacist-directed walking program in an established employee preventive care clinic. Am. J. Health Pharm. 2014, 71, 1219–1225. [Google Scholar] [CrossRef]
- Williams, L.C.; Day, B.T. Medical Cost Savings for Web-Based Wellness Program Participants from Employers Engaged in Health Promotion Activities. Am. J. Health Promot. 2011, 25, 272–280. [Google Scholar] [CrossRef]
- Nishita, C.; Cardazone, G.; Uehara, D.L.; Tom, T. Empowered diabetes management: Life coaching and pharmacist counseling for employed adults with diabetes. Health Educ. Behav. 2012, 40, 581–591. [Google Scholar] [CrossRef]
- Johnson, C.L.; Nicholas, A.; Divine, H.; Perrier, D.G.; Blumenschein, K.; Steinke, D.T. Outcomes from DiabetesCARE: A pharmacist-provided diabetes management service. J. Am. Pharm. Assoc. 2008, 48, 722–730. [Google Scholar] [CrossRef]
- Wilson, J.B.; Osterhaus, M.C.; Farris, K.B.; Doucette, W.R.; Currie, J.D.; Bullock, T.; Kumbera, P. Financial Analysis of Cardiovascular Wellness Program Provided to Self-Insured Company from Pharmaceutical Care Provider’s Perspective. J. Am. Pharm. Assoc. 2005, 45, 588–592. [Google Scholar] [CrossRef]
- Yoder, V.G.; Dixon, D.L.; Barnette, D.J.; Beardsley, J.R.; Pawloski, P.; Cusick, D.; Amborn, L. Short-term outcomes of an employer-sponsored diabetes management program at an ambulatory care pharmacy clinic. Am. J. Health Pharm. 2012, 69, 69–73. [Google Scholar] [CrossRef] [PubMed]
- Pinto, S.L.; Bechtol, R.A.; Partha, G. Evaluation of outcomes of a medication therapy management program for patients with diabetes. J. Am. Pharm. Assoc. 2012, 52, 519–523. [Google Scholar] [CrossRef] [PubMed]
- Divine, H.; Nicholas, A.; Johnson, C.L.; Perrier, D.G.; Steinke, D.T.; Blumenschein, K. PharmacistCARE: Description of a pharmacist care service and lessons learned along the way. J. Am. Pharm. Assoc. 2008, 48, 793–802. [Google Scholar] [CrossRef] [PubMed]
- Kraemer, D.F.; Kradjan, W.A.; Bianco, T.M.; Low, J.A. A randomized study to assess the impact of pharmacist counseling of employer-based health plan beneficiaries with diabetes: The EMPOWER study. J Pharm. Pract. 2012, 25, 169–179. [Google Scholar] [CrossRef] [PubMed]
- Iyer, R.; Coderre, P.; McKelvey, T.; Cooper, J.; Berger, J.; Moore, E.; Kushner, M. An employer-based, pharmacist intervention model for patients with type 2 diabetes. Am. J. Health Pharm. 2010, 67, 312–316. [Google Scholar] [CrossRef] [PubMed][Green Version]
- Shimp, L.A.; Kucukarslan, S.N.; Elder, J.; Remington, T.; Wells, T.; Choe, H.M.; Lewis, N.J.; Kirking, D.M. Employer-based patient-centered medication therapy management program: Evidence and recommendations for future programs. J. Am. Pharm. Assoc. 2012, 52, 768–776. [Google Scholar] [CrossRef] [PubMed]
- Johannigman, M.J.; Leifheit, M.; Bellman, N.; Pierce, T.; Marriott, A.; Bishop, C.; Johannigmn, M.J. Medication therapy management and condition care services in a community-based employer setting. Am. J. Health Pharm. 2010, 67, 1362–1367. [Google Scholar] [CrossRef]
- Theising, K.M.; Fritschle, T.L.; Scholfield, A.M.; Hicks, E.L.; Schymik, M.L. Implementation and Clinical Outcomes of an Employer-Sponsored, Pharmacist-Provided Medication Therapy Management Program. Pharmacother. J. Hum. Pharmacol. Drug Ther. 2015, 35, e159–e163. [Google Scholar] [CrossRef]
- Wittayanukorn, S.; Westrick, S.C.; Hansen, R.A.; Billor, N.; Braxton-Lloyd, K.; Fox, B.I.; Garza, K.B. Evaluation of Medication Therapy Management Services for Patients with Cardiovascular Disease in a Self-Insured Employer Health Plan. J. Manag. Care Pharm. 2013, 19, 385–395. [Google Scholar] [CrossRef]
- Schramm, A.M.; DiDonato, K.L.; May, J.R.; Hartwig, D.M. Implementation of a financially incentivized weight loss competition into an already established employee wellness program. Innov. Pharm. 2014, 5. [Google Scholar] [CrossRef]
- Cranor, C.; Bunting, B.; Christensen, D.B. The Asheville Project: Long-term clinical and economic outcomes of a community pharmacy diabetes care program. J. Am. Pharm. Assoc. 2009, 49, 164–170. [Google Scholar] [CrossRef]
- Fera, T.; Bluml, B.M.; Ellis, W.M. Diabetes Ten City Challenge: Final economic and clinical results. J. Am. Pharm. Assoc. 2009, 49, 383–391. [Google Scholar] [CrossRef]
- May, C.S.; Russell, C.S. Health Coaching: Adding Value in Healthcare Reform. Glob. Adv. Health Med. 2013, 2, 92–94. [Google Scholar] [CrossRef] [PubMed]
- DiDonato, K.L.; May, J.R.; Lindsey, C.C. Impact of wellness coaching and monitoring services provided in a community pharmacy. J. Am. Pharm. Assoc. 2013, 53, 14–21. [Google Scholar] [CrossRef] [PubMed]
- Expert Panel on Detection, Evaluation, and Treatment of High Blood Cholesterol in Adults. Executive summary of the Third Report of the National Cholesterol Education Program (NCEP) Expert Panel on Detection, Evaluation, and Treatment of High Blood Cholesterol in Adults (Adult Treatment Panel III). JAMA 2001, 285, 2486–2497. [Google Scholar] [CrossRef] [PubMed]
- Chobanian, A.V.; Bakris, G.L.; Black, H.R.; Cushman, W.C.; Green, L.A.; Izzo, J.L., Jr.; Jones, D.W.; Materson, B.J.; Oparil, S.; Wright, J.T., Jr.; et al. The seventh report of the Joint National Committee on Prevention, Detection, Evaluation, and Treatment of High Blood Pressure: The JNC 7 (Express) Report. JAMA 2003, 289, 2560–2572. [Google Scholar] [CrossRef]
- American Diabetes Association. Standards of Medical Care in Diabetes 2010. Diabetes Care 2010, 33, S11–S61. [Google Scholar] [CrossRef] [PubMed]
- NHLBI Obesity Education Initiative Expert Panel on the Identification, Evaluation, and Treatment of Overweight and Obesity in Adults. Clinical Guidelines on the Identification, Evaluation, and Treatment of Overweight and Obesity in Adults; Publication No. 98-4083; National Institutes of Health: Bethesda, MD, USA, 1998.
- Stelter, N.; DiDonato, K.L. Health Coaching. In Pharmacotherapy Self-Assessment Program (PSAP) Book 2 (CNS/Pharmacy Practice), 8th ed.; American College of Clinical Pharmacy: Lenexa, KS, USA, 2015. [Google Scholar]
- Kivelä, K.S.; Elo, S.; Kyngäs, H.; Kääriäinen, M. The effects of health coaching on adult patients with chronic diseases: A systematic review. Patient Educ. Couns. 2014, 97, 147–157. [Google Scholar] [CrossRef]
- Keller, P.A.; Lehmann, D.R.; Milligan, K.J. Effectiveness of Corporate Well-Being Programs. J. Macromark. 2009, 29, 279–302. [Google Scholar] [CrossRef]
- Whelton, P.K.; Carey, R.M.; Aronow, W.S.; Casey, D.E.; Collins, K.J.; Himmelfarb, C.D.; DePalma, S.M.; Gidding, S.; Jamerson, K.A.; Jones, D.W.; et al. 2017 ACC/AHA/AAPA/ABC/ACPM/AGS/APhA/ASH/ASPC/NMA/PCNA Guideline for the Prevention, Detection, Evaluation, and Management of High Blood Pressure in Adults: A Report of the American College of Cardiology/American Heart Association Task Force on Clinical Practice Guidelines. Hypertension 2017, 71, e13–e115. [Google Scholar]
- Bluml, B.M.; McKenney, J.M.; Cziraky, M.J. Pharmaceutical Care Services and Results in Project ImPACT: Hyperlipidemia. J. Am. Pharm. Assoc. (1996) 2000, 40, 157–165. [Google Scholar] [CrossRef]
- Bunting, B.A.; Smith, B.H.; Sutherland, S.E. The Asheville Project: Clinical and economic outcomes of a community-based long-term medication therapy management program for hypertension and dyslipidemia. J. Am. Pharm. Assoc. 2008, 48, 23–31. [Google Scholar] [CrossRef] [PubMed]
- Grundy, S.M.; Stone, N.J.; Bailey, A.L.; Beam, C.; Birtcher, K.K.; Blumenthal, R.S.; Braun, L.T.; de Ferranti, S.; Faiella-Tommasino, J.; Forman, D.E.; et al. 2018 AHA/ACC/AACVPR/AAPA/ABC/ACPM/ADA/AGS/APhA/ASPC/NLA/PCNA Guideline on the Management of Blood Cholesterol: A Report of the American College of Cardiology/American Heart Association Task Force on Clinical Practice Guidelines. J. Am. Coll. Cardiol. 2019, 73, 3168–3209. [Google Scholar] [CrossRef] [PubMed]
- American Diabetes Association. 2. Classification and Diagnosis of Diabetes: Standards of Medical Care in Diabetes-2018. Diabetes Care 2018, 41 (Suppl. 1), S13–S27. [Google Scholar] [CrossRef] [PubMed]
- Jones, D.; Molitor, D.; Reif, J. What Do Workplace Wellness Programs Do? Evidence from the Illinois Workplace Wellness Study. NBER Working Paper #24229. 2018. Available online: https://www.nber.org/papers/w24229 (accessed on 1 July 2019).


| Characteristic | Healthy Group | Cholesterol Monitoring Group | Blood Pressure Monitoring Group | Blood Glucose Monitoring Group | Weight Monitoring Group | All Participants |
|---|---|---|---|---|---|---|
| N | 26 | 134 | 117 | 46 | 129 | 200 |
| Age, years | ||||||
| Mean ± SD (Range) | 30.7 ± 11.8 (19–55) | 40.3 ± 13.4 (19–69) | 42.3 ± 13.1 (21–69) | 46.2 ± 11.7 (19–69) | 39.9 ± 12.9 (19–69) | 38.4 ± 13.2 (19–69) |
| Gender, n (%) | ||||||
| Male | 4 (15.4%) | 30 (22.4%) | 32 (27.4%) | 14 (30.4%) | 30 (23.3%) | 44 (22.0%) |
| Female | 22 (84.6%) | 104 (77.6%) | 85 (72.6%) | 32 (69.6%) | 99 (76.7%) | 156 (78.0%) |
| Race, n (%) | ||||||
| Caucasian | 25 (96.2%) | 128 (95.5%) | 110 (94.0%) | 43 (93.5%) | 122 (94.6%) | 190 (95.0%) |
| African Amer. | 0 (0.0%) | 2 (1.5%) | 4 (3.4%) | 2 (4.3%) | 2 (1.6%) | 4 (2.0%) |
| Hispanic/Latino | 1 (3.8%) | 2 (1.5%) | 1 (0.9%) | 0 (0.0%) | 2 (1.6%) | 3 (1.5%) |
| Amer. Indian or Alaskan Native | 0 (0.0%) | 1 (0.7%) | 1 (0.9%) | 0 (0.0%) | 1 (0.8%) | 1 (0.5%) |
| Not Specified | 0 (0.0%) | 1 (0.7%) | 1 (0.9%) | 1 (2.2%) | 2 (1.6%) | 2 (1.0%) |
| Education, n (%) | ||||||
| High school or less | 5 (19.2%) | 33 (24.6%) | 26 (22.2%) | 14 (30.5%) | 27 (21.0%) | 42 (21.0%) |
| Some college | 4 (15.4%) | 43 (32.1%) | 35 (29.9%) | 13 (28.3%) | 41 (31.8%) | 61 (30.5%) |
| College grad | 6 (23.1%) | 26 (19.4%) | 26 (22.2%) | 8 (17.4%) | 27 (20.9%) | 40 (20.0%) |
| Post-grad/ Professional | 11 (42.3%) | 30 (22.4%) | 28 (23.9%) | 11 (23.9%) | 31 (24.0%) | 53 (26.5%) |
| Not Specified | 0 (0.0%) | 2 (1.5%) | 2 (1.7%) | 0 (0.0%) | 3 (2.3%) | 4 (2.0%) |
© 2019 by the authors. Licensee MDPI, Basel, Switzerland. This article is an open access article distributed under the terms and conditions of the Creative Commons Attribution (CC BY) license (http://creativecommons.org/licenses/by/4.0/).
Share and Cite
Liu, Y.; Guthrie, K.D.; May, J.R.; DiDonato, K.L. Community Pharmacist-Provided Wellness and Monitoring Services in an Employee Wellness Program: A Four-Year Summary. Pharmacy 2019, 7, 80. https://doi.org/10.3390/pharmacy7030080
Liu Y, Guthrie KD, May JR, DiDonato KL. Community Pharmacist-Provided Wellness and Monitoring Services in an Employee Wellness Program: A Four-Year Summary. Pharmacy. 2019; 7(3):80. https://doi.org/10.3390/pharmacy7030080
Chicago/Turabian StyleLiu, Yifei, Kendall D. Guthrie, Justin R. May, and Kristen L. DiDonato. 2019. "Community Pharmacist-Provided Wellness and Monitoring Services in an Employee Wellness Program: A Four-Year Summary" Pharmacy 7, no. 3: 80. https://doi.org/10.3390/pharmacy7030080
APA StyleLiu, Y., Guthrie, K. D., May, J. R., & DiDonato, K. L. (2019). Community Pharmacist-Provided Wellness and Monitoring Services in an Employee Wellness Program: A Four-Year Summary. Pharmacy, 7(3), 80. https://doi.org/10.3390/pharmacy7030080