Article

Thirty Years on: A Bibliometric Analysis of L2 Vocabulary Research Published in 2020

1
Applied Linguistics, Swansea University, Singleton Park, Swansea SA2 8PP, UK
2
Department of Education, University of Oxford, 15 Norham Gardens, Oxford OX2 6PY, UK
Languages 2024, 9(6), 190; https://doi.org/10.3390/languages9060190
Submission received: 12 March 2024 / Revised: 2 May 2024 / Accepted: 5 May 2024 / Published: 22 May 2024

Abstract

:
This paper presents an author co-citation analysis of the research on L2 vocabulary acquisition that was published in the 2020 calendar year. The most significant influence at this time is Paul Nation—cited in 85% of the publication set—but a number of other important influences can also be identified, notably, Laufer, Hulstijn, Schmitt and Webb. This paper draws some comparisons with data from 1990, and speculates on how “research fronts” might be identified in an author co-citation data set.

1. Introduction

Over the last few years, I have published a number of papers that sketched the development of L2 vocabulary research. These analyses have included a series of maps that illustrate the co-citation patterns linking the authors who are cited in the research outputs. So far, I have produced a set of maps covering the period 1982–1991. Summaries of this work, and maps covering each of the 10 years in the period under consideration, can be found on my web-site: https://www.lognostics.co.uk/maps (accessed on 1 May 2024).
A typical map of this sort is shown in Figure 1, based on the co-citations found in the 78 papers that make up the 1990 data set.
The map consists of a set of labelled nodes and a set of edges. The nodes identify the 65 most cited authors in the 1990 data set. The edges show the pattern of co-citation among these authors. Thick edges show a high level of co-citation, thinner edges indicate fewer co-citations. Each author is connected with the author they are most frequently co-cited with. So, for example, the strongest co-citation links in this map are Gairns and Redman (cluster III), co-cited seven times in this data set, and Carter and McCarthy, co-cited six times in the data set (cluster I). A factor analysis of these data identifies ten clusters in the map, which we can interpret as “invisible colleges” (cf. Price 1965; Crane 1972)—groups of researchers who were influencing particular themes in the L2 vocabulary research activity that was published in 1990. Cluster II, for example, is a group of psycholinguists whose work is often cited in the context of bilingual lexical performance; Cluster V is a group of L1 reading researchers whose work is often cited in the context of L2 reading research; Cluster IX is a set of word lists that are frequently cited in the context of L2 readability schemes. (See (Meara 2022, 2023) for a more detailed discussion of this map).
Readers who are familiar with the early research literature on vocabulary acquisition will easily recognise that the mapping captures the main trends in the research at the time. They will also feel that the map probably looks very different from the sort of map that we might expect to emerge from an analysis of more recent data. Only three of the significant influences in the current research (Nation, Laufer, Meara) play a significant role in this map, and this raises some interesting questions about the way L2 vocabulary research has developed over the last thirty years. What new research clusters have emerged since 1990? At what point in the timeline do other significant figures begin to appear? How does their research cluster with the work of earlier researchers? What new research themes are they associated with? What impact do these new themes have on the field as a whole?
A number of colleagues have pointed out that these early maps are mainly of historical interest, however, and some (notably Norbert Schmitt) have argued that it would be much more interesting to apply the same methodology to the more recent research output. This paper is an attempt to address this interest. It provides an analysis of the relevant research published in 2020. To cut a long story very short, the 2020 research output map does indeed look very different from the research that was published in the 1990, and it is interesting to reflect on why these differences appear in the data, and how we should understand them.

2. The Background to the 2020 Research

Before we proceed to the 2020 data, it is worthwhile providing some contextual background that will place this research in perspective.
Figure 2 shows the number of L2 vocabulary-related research outputs identified in the Vocabulary Acquisition Research Group Archive (VARGA: Meara n.d.) during the period 1980–2023. The figure shows that relatively few papers appeared in the early years of this time span. It also shows that the number of outputs increases steadily, reaching 200 annual publications by 1993, exceeding 300 annual publications in 2010, and breaking the 400 publications barrier two years later in 2012. Looking at the raw figures, it is tempting to suggest that the number of research outputs is in decline following a peak in 2018. However, I think this interpretation of the data is incorrect. Not all publications are logged immediately after their first appearance, and it often takes several years for publications that are published in obscure journals to emerge from hiding. At the time of writing (December 2023), the VARGA database identifies a total of 318 relevant publications published in 2020 (240 journal articles, 67 book chapters, seven books/monographs, three theses, and one computer program). The VARGA database does not systematically monitor theses, so the three works of this type that have been recorded for 2020 probably under-represent this type of output by a significant factor. Based on the number of publications appearing in the period 2015–2019, my estimate is that the figure of 318 publications appearing in 2020 represents approximately 75% of the number of publications we might expect to find, indicating that approximately a hundred publications remain to be found. This means that the analysis that follows should be considered as an interim analysis that identifies the main trends in 2020, but it remains liable to revision if some radically new sources reveal themselves at a later date.
The interim data set is fairly typical of the research that has appeared in recent years. The vast majority of the sources identified appear as journal articles or chapters in books—307 works in total. In the interest of space, I have not listed all the 2020 sources in this paper, but curious readers can find a list of the 2020 publications and their type in the VARGA data base. https://www.lognostics.co.uk/varga/ (accessed on 1 May 2024).
A superficial analysis of the 2020 publications reveals that 493 unique authors contributed to the 2020 outputs. The vast majority of these authors contributed to only a single publication, but a handful of authors contributed to two or more publications (see Table 1). The outstandingly prolific author in 2020 is Webb, who contributed to 10 outputs. A total of 4 authors contributed to four outputs (Dang, Kyle, Peters, and Zhang) and 14 authors contributed to three outputs (Coxhead, Laufer, Lee, McLean, Miralpeix, Pellicer-Sanchez, Reynolds, Rodgers, Stoeckel, Teng, Tremblay, Uchihara, and Yanigasawa). A further 35 authors each contributed to two papers in 2020.
It is worth noting here that the number of authors identified in the 2020 data set is considerably larger than the number of authors appearing in the 1990 data described earlier. Only 94 authors were identified in the 1990 data set, and only 8 of those authors contributed to more than one paper. The most prolific authors in 1990 were Laufer and Meara, who both contributed four papers to the data set. In contrast, five authors published four or more studies in 2020. These figures underline the massive growth in output that has taken place between 1990 and 2020.
A much cited paper by Lotka (Lotka 1926) argued that mature scientific fields usually show a relationship between the number of authors contributing a single paper to a data set and the number of authors contributing to two or more outputs. This conjecture is usually referred to as Lotka’s Law, expressed as
A = N/n2
where N = the number of authors contributing to a single output;
  • n = the number of outputs an author contributes to;
  • and A = the expected number of authors contributing to this many papers.
Thus, if we have 439 authors who contribute to just one output, then we can expect to find 439/4 = 109 authors who contribute to two papers. The bottom line in Table 1 shows how many authors we would expect to find contributing to N papers. The table suggests that the L2 vocabulary research data for 2020 deviates quite markedly from Lotka’s model. The field as a whole appears to be excessively reliant on authors who make a single contribution to the oeuvre. The proportion of authors contributing to a single output in this data is almost 90%—a considerably higher proportion than we noted in the earlier data. This feature is one that has been noted in my analyses of earlier data sets, but it is surprising to see it persisting in the 2020 data. In my earlier analyses, I suggested that the discrepancy might be a characteristic feature of a relatively new and relatively small research field, but the discrepancy reported here between Lotka’s estimate and the actual publication data seems to be widening rather than decreasing as we might have expected. The reasons for this are unclear.

3. Counting the Citations

Obviously, the fact that an author publishes a lot of papers does not tell us whether this work is influential or not, but we can begin to assess the importance of authors’ contributions to the field by examining the way their work is cited in the research literature. Most published work is cited only sporadically, but a few authors are widely cited by other researchers, and can be regarded as significant influences in the field. In this section, we move beyond the superficial analysis reported above and look at the citations found within a subset of the 2020 publications. This subset is made up of 238 journal articles and 65 book chapters. I extracted from these outputs a list of all the names who appeared as authors of papers cited in the data set. This process resulted in a list of 10,873 sources, an astonishingly large number. As usual, most of these sources are cited only once, but a small number of authors are cited many times in the data set. These data are summarised in Table 2 and Table 3. Table 2 shows the number of sources who are cited N times in the 2020 data set. Table 3 lists the significant influences in the 2020 data set, along with the number of papers they are cited in.
A number of points are worth making here.
Firstly, and most obviously, there is something of a mismatch between the list of Prolific Authors in the 2020 data, and the list of significant influences at this time. Only four authors figure in both lists (Coxhead, Laufer, Pellicer-Sanchez, and Webb). The best explanation for this is that the list of significant influences is biased towards authors who have published over a long period, and therefore have a lot of work that can be cited, while the list of Prolific Authors identifies active, younger authors whose work may not yet have had time to be cited. Laufer and Coxhead are the best counter-examples to this description: both of these authors have an extensive publication list and published three papers in 2020. Among the most-cited authors in 2020, several important figures have only two outputs in this year (notably Cobb, Nation, Schmitt, and Meara), while Read and Milton contributed to only one publication each. The remaining authors in the Most-Cited Sources list authored no papers in 2020, suggesting that their contribution to the field might be historical rather than on-going. The obvious case of this is SD Krashen, whose main work appeared in the 1990s, but is still strongly cited in the literature.
A second, but less obvious point is the extent to which “grade inflation” has become a significant factor in L2 vocabulary research. In the 1990 data (see Figure 1), only 118 relevant papers were identified, and it was relatively easy for an author to be identified as a significant influence. The most cited source at this time was Meara, who was cited in only 19 papers, 16% of the total output for that year. In contrast, 84 authors were cited at least 19 times in the 2020 data. Nation, the most cited author in the 2020 data, is cited in 206 papers—67% of the total output for that year—an astonishingly high figure, and more than 10 times the number of works that cited Meara in 1990. One hundred and twenty authors were cited in at least three papers in 1990, but most of them produced no L2 vocabulary-related outputs. In 2020, 462 sources were cited three or more times. This means that it is very much harder for an author to be identified as a significant influence in 2020 than it was in 1990.
A third point to make at this stage, one that we will take up again later, is that many of the significant influences in 1990 fail to appear in the Prolific Authors List and the Most-Cited Sources list in 2020.

4. The Co-Citation Analysis

So far, we have been discussing some relatively superficial characteristics of the 2020 data. In this section, we move onto a more detailed consideration of the patterns of co-citation within the data set. This kind of analysis can be traced back to a series of influential papers published by Small (e.g., Small 1973), suggesting that authors who are frequently cited alongside each other can help us to identify thematic trends in a body of research. In L2 vocabulary research, for example, one important strand of research concerns the structure of a bilingual speaker’s mental lexicon, and recent research in this area will almost always cite pioneering work by de Groot, van Hell, Kroll, and Green. These four authors form the core of a cluster of researchers who tend to be co-cited in this context. The question we are interested in is what clusters can we identify in the 2020 research?
Author co-citation analysis, the main analysis tool used in this paper, traditionally makes a number of simplifying assumptions. The most straightforward assumption is that our analysis is based on two main types of research output: journal articles and chapters appearing in edited volumes. Monographs, theses, and non-standard reports are eliminated from the analysis on the grounds that the way references are used in work of this type tends to be very different from the way they are used in journal papers and similar reports. As we have seen in the previous section, the full 2020 data set contains seven books, three theses, and a computer program which are not included in the analysis that follows.
The second assumption traditionally made in author co-citation analyses is that the structure of the field is best captured by looking at a small number of sources who are most frequently cited in the data set. Conventionally, this number is set at about 100 sources—an arbitrary figure, largely driven by a need to keep the data manageable and easy to visualise.
The first step of the analysis involves identifying a set of authors who meet this inclusion criterion. With the 2020 data set, we can get close to this conventional figure by choosing to work with the 104 sources that are cited in at least 17 papers. (Note, though, that if we had adopted this criterion for the 1990 data set, only one source would have qualified—another example of the grade inflation that we noted in the previous section.)
The next step involves drawing up a large matrix which shows the number of times each of the 104 authors is co-cited with each of the other authors in the matrix. Once these data are in place, they can be submitted to a standard mapping program which converts the matrix to a two-dimensional mapping. In the analyses that follow, I used the Gephi program to perform this conversion (Bastian et al. 2009). Normally, this results in a mapping which looks like Figure 1, but, as we will see, the 2020 data set has some characteristics that make it difficult to process.
Figure 3 illustrates the main problem with this data set. This figure is a spanning tree which shows the strongest co-citation links between the most frequently cited 51 sources in the data set. Each of the 51 sources is cited at least 25 times in the data set. Each node is connected to the tree by its strongest co-citation link—the weakest link in the figure is the link between Nation and Kroll, which occurs only 14 times in the data set; all the other links are stronger than this. The ten strongest links in the spanning tree are listed in Table 4.
Gephi’s analysis of these data suggests that we can identify four clusters in this data set—the clusters focussed on Nation, Schmitt, Webb, and Paribakht, respectively. However, this spanning tree mapping is very unusual, in that we have three very small clusters and one enormous cluster focussed on Nation. This large cluster includes 37 of the 51 most-cited sources in the 2020 data set—73% of all the sources that appear in the figure.1 The most striking feature of this main cluster is that it has very little internal structure. Of the 37 members of this cluster, 36 members are maximally co-cited with Nation: the only source who does not fit this pattern is Goldstein (most often co-cited with Laufer). It is possible to identify some sub-clusters within the largest cluster, and I have arranged the nodes in Figure 3 to reflect a speculative interpretation of these sub-clusters. However, even where the focus of a sub-cluster is relatively clear—as with the sub-cluster whose main focus is on eye-tracking (Pellicer-Sanchez, Peters, de Smedt, and Elgort)—the sources are still more strongly co-cited with Nation than they are with each other. The smaller cluster focussed around Schmitt accounts for a further 16% of the sources, bringing the tally of sources counted in the two main clusters to 89% of the total.
Clearly, the 2020 map is structurally very different from the 1990 map shown in Figure 1, where the clusters are smaller. Here, Nation’s influence is so dominant that it prevents the more detailed structure of the co-citations from becoming apparent. However, we can get around this problem by arguing that Nation’s influence in the 2020 data is so all-pervasive that it does not actually make a distinctive contribution to the structure of the data set. This means that we might be able to ignore Nation, and explore the co-citation patterns in the rest of the data. Essentially, this involves building a “donut map” which ignores the massive impact of dominant sources like Nation, and allows weaker relationships to emerge from his shadow, as it were. Figure 4 shows the results of an analysis of this sort.
The donut map of the 2020 data set is fairly easy to interpret. The core of the map consists of six very significant influences. The predominant influence is Schmitt, followed closely by Laufer. Hulstijn, Webb, Cobb, and Meara make up the rest of this core, but the co-citations between all six of these influences are very strong. This core is surrounded by a group of lesser influences. Waring, Horst, Read, NC Ellis, Pellicer-Sanchez, Paribakht, Wesche, Beglar, Peters, Coxhead, and D Schmitt make up this group of less central authors. Their co-citation links are more focussed than those of the central core.
Gephi identified nine clusters in the 2020 data set, together with one isolated source (de Bot). These clusters are described below.
The largest cluster, Cluster A, is focussed on Schmitt. This cluster contains 20 members, many of whom are closely associated with Nottingham University. The cluster seems to include a number of sub-clusters. McCarthy, Carter, Biber, and Sinclair appear in my earlier analyses as a distinct cluster dealing with formal descriptions of lexis and corpus analysis. Chamot, Oxford, and Dornyei make up a sub-cluster that deals with motivation and strategies. Wray and Gyllstad represent a research strand that deals with collocations and multi-word lexical items. (Note, though, that the VARGA database does not systematically monitor research on multi-word items, so the analysis may be underestimating the importance of this research strand.)
Cluster B, with 19 members focussed on Laufer and Hulstijn, looks to be mainly concerned with implicit and explicit vocabulary acquisition in a variety of contexts.
Cluster C, with 14 members focussed on Webb, consists of a subgroup of sources working on word lists (Davies, Gardiner, Coxhead, and the historically important West), and the degree of coverage provided by these word lists. It also includes Diane Schmitt and Clapham, whose work with Norbert Schmitt provides a standard assessment tool for measuring vocabulary mastery that is based on frequency counts.
Cluster D, with 12 members focussed on Pellicer-Sánchez, seems to be a methodologically motivated cluster, whose members use eye-tracking to study L2 reading.
Cluster E, also with 12 members, is also a characterised by a distinctive methodology. This cluster seems to be mainly concerned with lexical inferencing, but it also contains a sub-cluster that uses word-association methods in an attempt to assess vocabulary depth. This cluster is particularly associated with the research group at Swansea University.
Cluster F, with 10 members focussed on Cobb, is also concerned with vocabulary uptake from reading, though Cobb’s web-site is an important methodological resource in a number of disparate areas.
Cluster G, a smaller cluster with only seven members, is another methodological cluster, this one concerned with ways of assessing change in vocabulary knowledge. Wesche and Paribakht’s Vocabulary Knowledge Scale is the standard tool here (cf. Wesche and Paribakht 1996).
Cluster H, with only three members, is a group of L1 reading researchers whose work has seriously influenced the thinking of L2 vocabulary research.
Cluster I, again with only three members, is the remains of a psycholinguistics research tradition dealing with the structure of bilingual lexicons. This tradition played a very significant role in earlier periods of L2 vocabulary research, but by 2020 this role seems to be diminishing in this map, and the members of this cluster have become detached from the main L2 vocabulary research clusters. There are some weaker links with other nodes, but they are not strong enough to appear in Figure 3.
De Bot appears in Figure 3 as a detached singleton with no connections to the rest of the network. This, again, is the result of the filters applied to the data: de Bot is substantially cited in the 2020 data set (17 times), but he is most frequently co-cited with authors who do not appear in the list of most-cited sources.
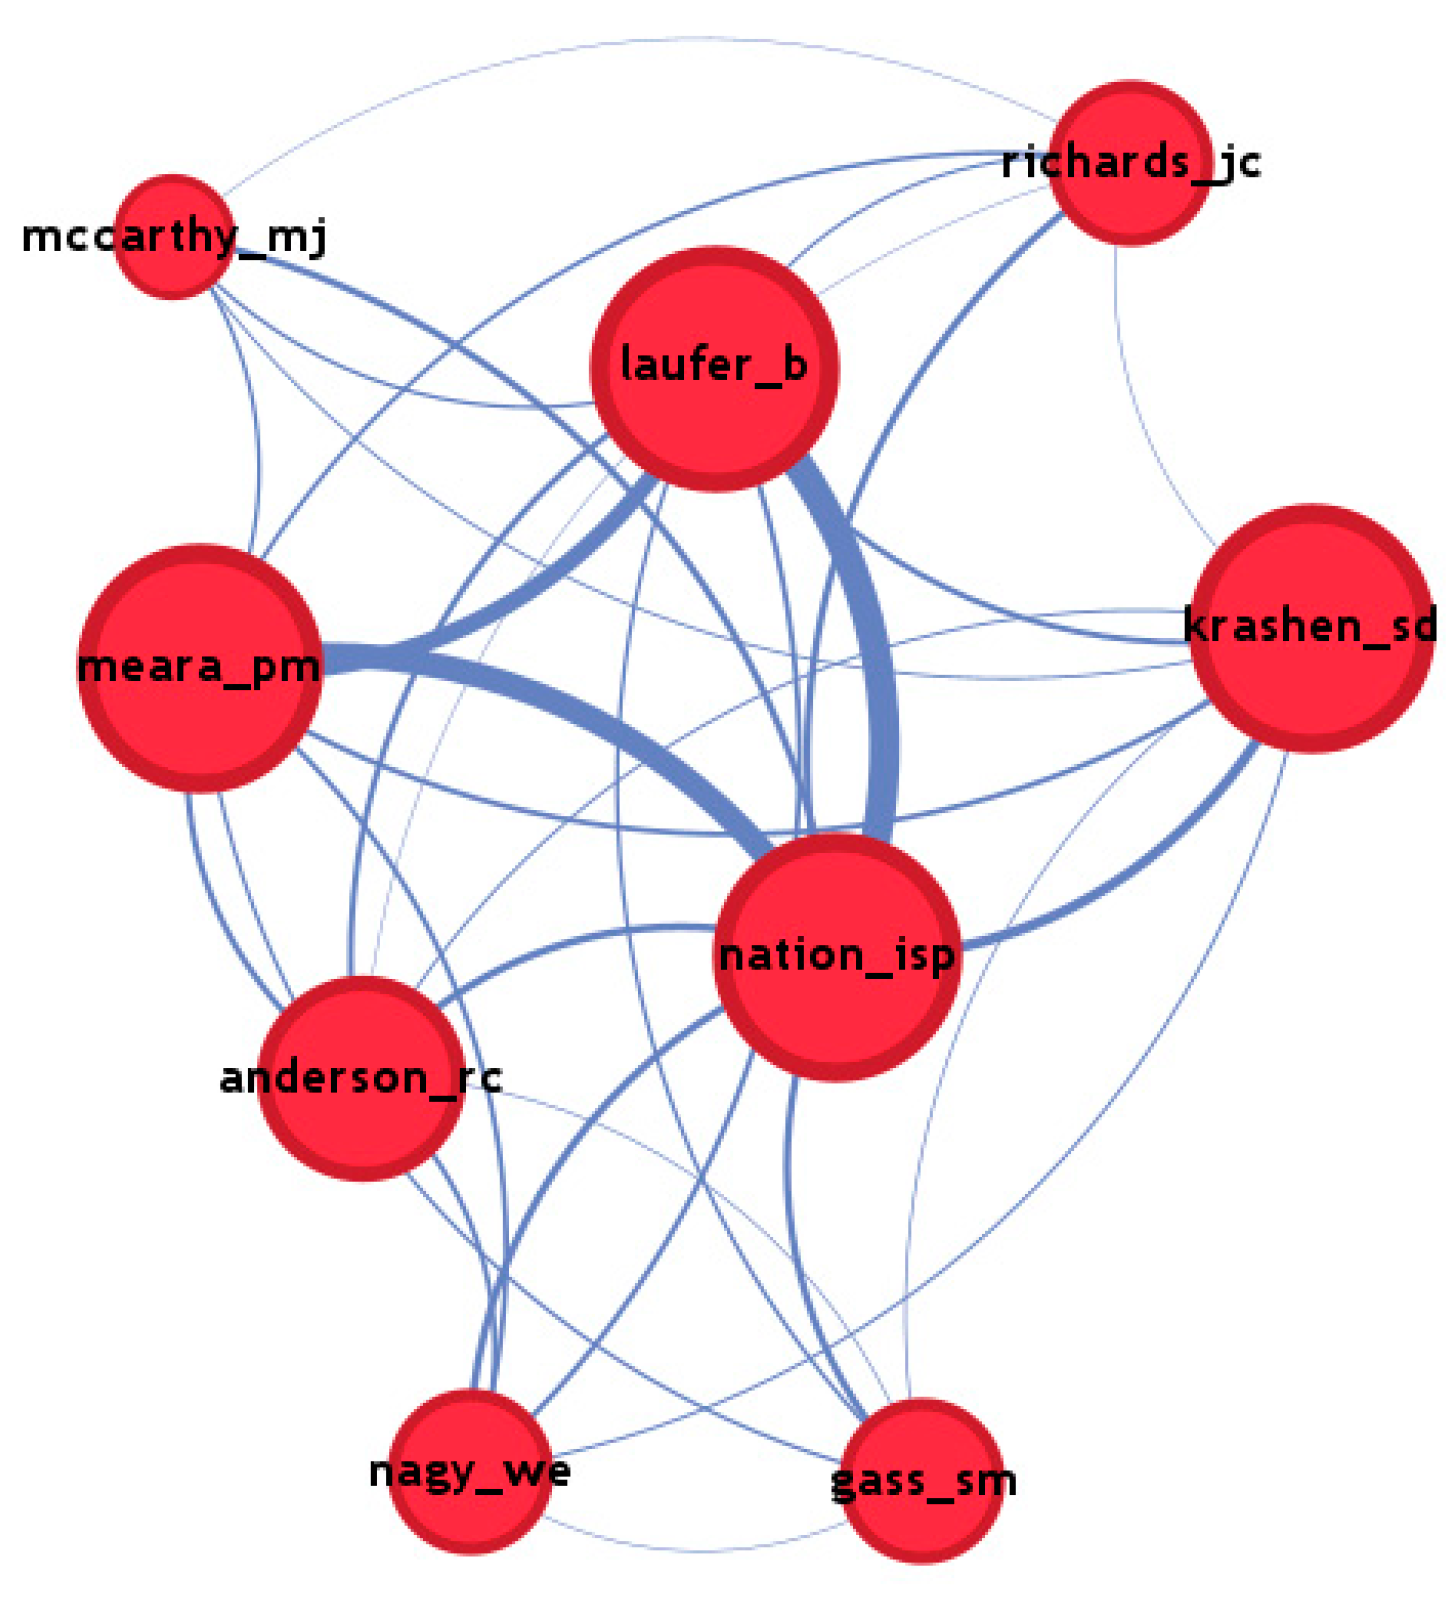
A number of points emerge from this analysis. Firstly, only nine significant influences survived from 1990 through to 2020. All nine sources were still co-cited in the 2020 data set, and some were very strongly co-cited (See Figure 5). The core of this map is the Laufer–Meara–Nation triangle. Anderson and Nagy are part of an L1 reading theme, while Krashen is mainly cited for his claims about incidental L2 vocabulary acquisition from reading. McCarthy is the main survivor from the corpus linguistics theme that dominated L2 vocabulary research in the early 1990s. Richards is mostly cited for his classic work on what it means to know a word (Richards 1976). Gass is mostly cited here for her recent work on subtitled input and eye-tracking.
Clearly, the majority of the significant influences who appear in the 2020 map are relatively recent new-comers (See Table 5). I do not yet have enough data to determine exactly when these new sources rose to prominence, but it is probably safe to say that Schmitt, Hulstijn, Read, and Cobb first become important sources in the 1990s, while most of the other new sources have a much shorter bibliometric history.
The second point to emerge from the analysis is that a number of significant influences who appeared in the 1990 data set can no longer lay claim to this role in the 2020 data. Some of these authors continue to be cited in the 2020 data, but their influence is a pale shadow of what it was. Corder, Schouten-van Parreren, Palmberg, and Levenston—all very significant influences in the 1990 data set—are cited only once in 2020, for example. Kellerman and Stevick are cited only twice. An interesting case is Aitchison. She was cited five times in the 1990 data set. In the 2020 data set she is cited 14 times: far more frequently than she was cited in 1990 but slightly fewer times than the stricter threshold I have used for the 2020 map (another example of the grade inflation trend that I mentioned earlier.)
This leads us to ask what areas of interest present in the 1990 map no longer have a presence in the 2020 map. I think we can identify six main areas that were important in 1990, but seem to be less important in 2020. The most obvious loss is the disappearance of all the members of Cluster III, Cluster IV, and Cluster VI in the 1990 map (see Figure 1). These clusters contain a number of sources whose main interest was the practical applications of vocabulary theory to teaching—Gairns and Redman, and Rudzka, Ostyn, Channell, and Putseys are particularly important in this context. Also important is the disappearance of the Scandinavian research group—Palmberg, Phillipson, Haastrup, Faerch, and Kasper—that strongly influenced the 1990s research on lexical inferencing. Transfer and lexical errors (Kellerman, Ringbom, and Corder) no longer seem to play a role in the 2020 research. L1 vocabulary development (HH Clark and R Brown) was an important influence in 1990 but not, it seems, in 2020. None of the members of the psycholinguistics cluster (Cluster II in Figure 1) met the inclusion threshold for the 2020 map, although this strand of research is represented by three new sources (de Groot, van Hell, and Kroll) in 2020.
What replaces these historical concerns? Figure 6 shows a spanning tree analysis of the new sources in the 2020 map, and we can begin to answer this question by identifying the clusters which emerge in this map.
This map, again, is relatively easy to interpret. The spine of the map runs from left to right, from Hulstijn through Schmitt to Webb and Cobb. Gephi found 10 clusters in this data set, but once again we have the problem that a single node dominates the map and prevents the finer structure from emerging. Schmitt and Webb seem to play the same role here as Nation did in Figure 3. Gephi did manage to find some interpretable clusters in this tree, but these clusters are mostly formed of sources who co-author a small number of frequently cited papers (Wesche and Paribakht 1996; Hulstijn et al. 1996; and Cobb and Horst 2019, for example). It is possible to disaggregate the single massive cluster dominated by Schmitt and Webb, and I have reflected this in the way I have drawn the map. However, the dominant position of Schmitt suggests that what we have here is another case where a donut map makes more sense than the straightforward spanning tree. Figure 7 shows a donut map of the newcomers with Schmitt’s co-citations and Webb’s co-citations excluded from the analysis.
This mapping is extremely easy to interpret. The core of the map is a set of highly interconnected hubs. The most significant influence in the map is Hulstijn, followed closely by NC Ellis, Cobb, Horst, Read, Pellicer-Sanchez, and Peters. The strongest co-citation links between these central hubs are listed in Table 6.
Gephi’s analysis suggests that there are 11 clusters in this data set, and they can be straightforwardly identified as the main research trends in the 2020 data set.
Cluster A, the largest cluster focussed on Hulstijn and NC Ellis, seems to consist of two smaller clusters, one comprised mainly of psychologists whose work has strongly influenced research on L2 word recognition, the other dealing more specifically with word recognition by bilinguals.
Cluster B, focussed on John Read, looks like a group of sources interested in depth of vocabulary knowledge. This cluster also contains a sub-cluster that focusses on word-associations.
Cluster C, focussed on Pellicer-Sanchez, contains a number of sources who use eye-tracking as their main methodology.
Cluster D, focussed on Coxhead, is largely concerned with word lists and analyses of corpora for L2 vocabulary teaching.
Cluster E, focussed on Horst and Waring, is mainly concerned with vocabulary acquisition from reading.
Cluster F is strongly influenced by the coh-metrix approach to learner output.
Cluster G is concerned with modified input for L2 learning.
Cluster H is mainly focussed on measures of vocabulary size.
Cluster I is an L2 reading cluster.
Cluster J is a set of sources that uses Wesche and Paribakht’s Vocabulary Knowledge Scale as a way of assessing the partial learning of words.
Finally, Cluster K, focussed on Oxford, is a set of sources whose main interest is learning strategies.
Most readers who are familiar with the current L2 vocabulary research would probably agree that this map does capture the main trends in the research quite well. However, we need to bear in mind that a lot of data were eliminated in order for us to reach this plausible conclusion. See Section 5 below.
An alternative, more nuanced conclusion is that the current research can be seen to be made up of four main components: we have a core of historically important sources closely associated with Nation; a more recent core of very significant sources (Schmitt and Webb) that is very widely co-cited in the more recent research but not in the earlier research; a number of new sources that act as hubs for a cluster; a number of other, but less influential, sources. This last group can be split into two smaller groups: a group of older sources that were significant in earlier maps, whose influence appears to be waning (Corder and Krashen are good examples of this), and a small group of genuinely new sources whose importance is on the rise.
What the maps cannot tell us is what kind of temporal trajectory is being followed by these sources. Clearly the maps do not tell us anything in detail about what is going on between the two snapshots taken in 1990 and 2020. Some of the research trends identified in the maps are recent and genuinely new (eye-tracking, for example). Others are long-standing interests, but the sources that allow them to be identified have changed (de Groot, van Hell, and Kroll, for example, replacing Kirsner and colleagues investigating the way bilingual lexicons are organised). The thirty-year gap between 1990 and 2020 is very large in research terms, covering several generations of research students. Clearly, more work is needed to clarify how the field is developing between these two snapshots (Meara 2020).

5. The Other Research

So far, I have discussed the broad patterns of author co-citations in the 2020 data set, with a particular focus on the role of Nation in shaping the overall structure of this research. I have also noted that this discussion was based on an analysis of the most frequently cited 104 authors in the 2020 data. It will be obvious, however, that restricting the analysis in this way means that we are not taking any account of the many other sources that are not cited to the same extent. Figure 7, for example, takes no account of the sources in the 2020 data set that are cited fewer than 17 times. The data set actually contains 2601 sources that are cited more than once, so the mapping in Figure 7 is based on only 4% of the data available for analysis. In contrast, the 1990 map shown in Figure 1 captured nearly 23% of all the co-citations that appeared twice or more in the data set, and this makes it much easier to justify the inclusion threshold—only the very weakest of co-citation links were ignored in the 1990 map. Clearly, this problem becomes more serious as the data sets get larger, and the inclusion threshold that gives us about 100 sources excludes an ever-increasing proportion of the data set.
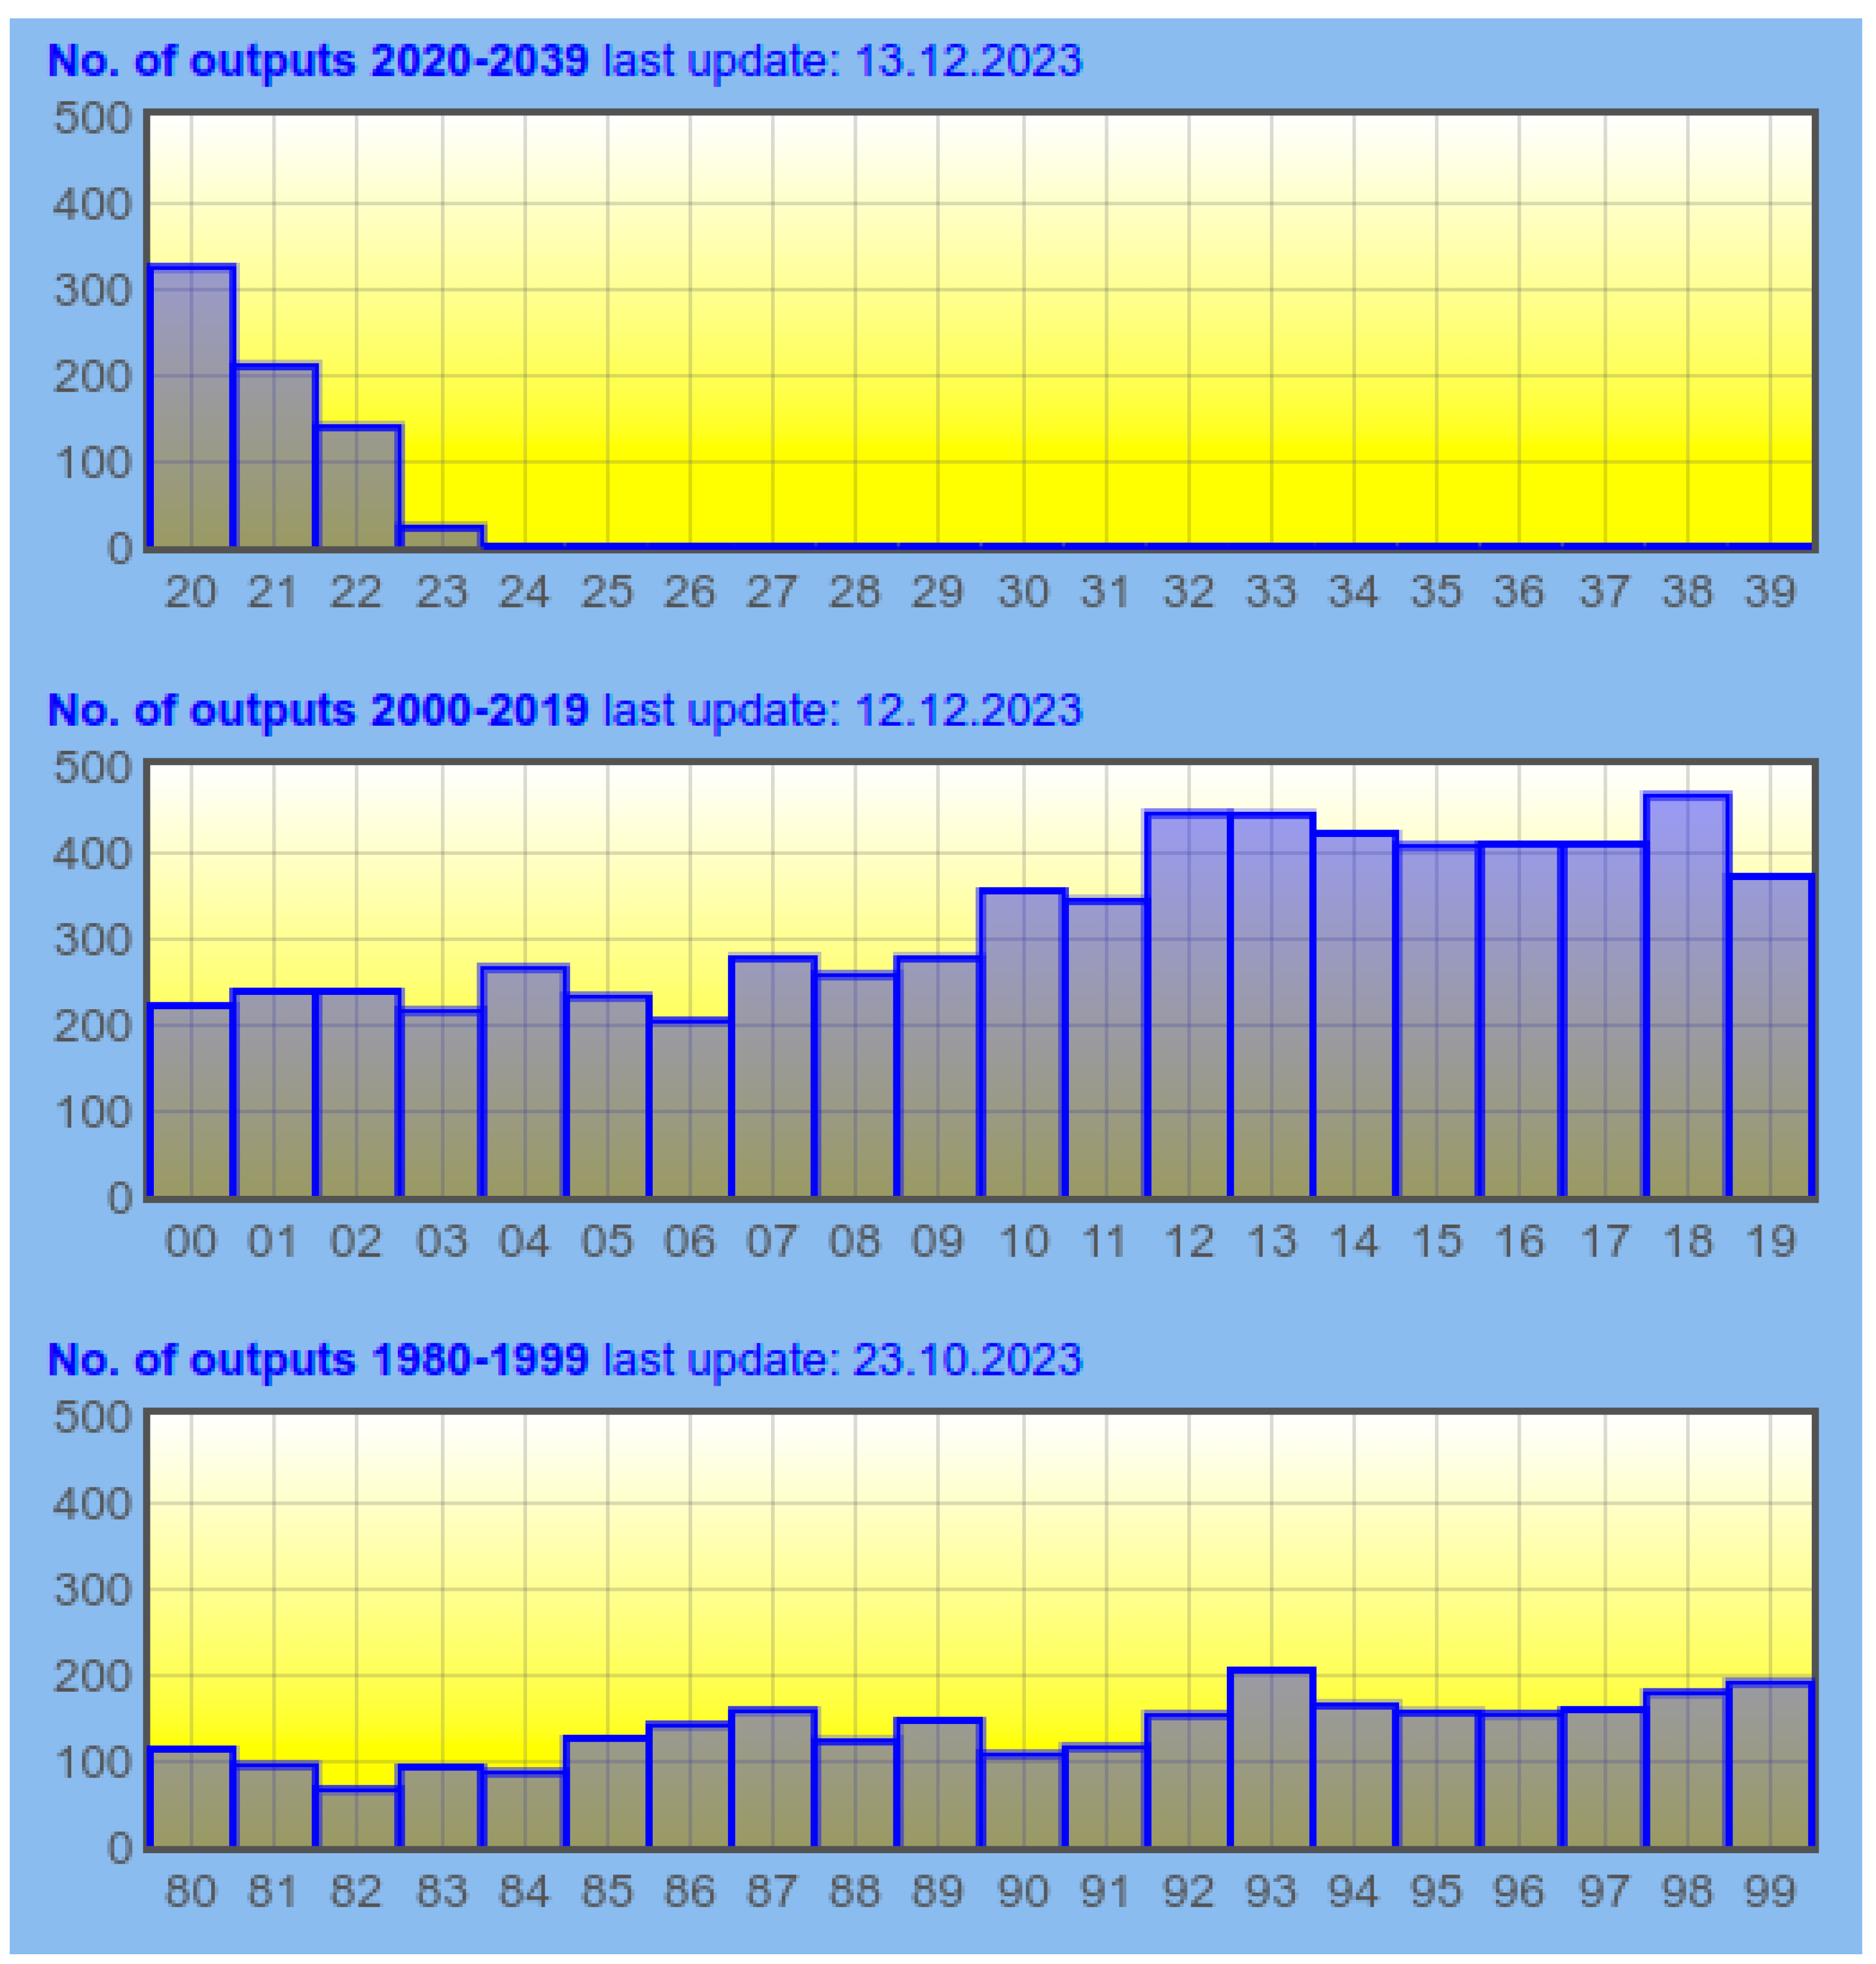
This difficulty seems to arise because of the grade inflation factor. A particular factor is that the average number of research outputs cited by a typical paper has exploded since 1990. In 1990, the average number of sources cited in a paper was 25—though many papers cited fewer than 10 sources. By 2020, this figure had increased to 74, with 17 papers citing more than 150 authors, and one paper (Sulpizio et al. 2020) citing 673 authors! Partly, of course this increase comes about simply because there is more research available to be cited, a significant increase in the number of papers with multiple authors, and the increasing appearance of meta-analyses, but this is not the whole story. As the number of research outputs increases, the co-citation statistics are dominated by derivative research, papers that largely duplicate things we know already, do not use innovative methodologies, and do not push the boundaries of theory. This type of research tends to cite “the usual suspects”, sources that lend a certain amount of legitimacy to a paper, but are not necessarily engaged with. The result is that the co-citation maps become overwhelmed by a canonical list of sources that are widely cited, but are not truly reflective of the current research fronts. These features do not entirely invalidate the analysis that I have presented in this paper, but they do suggest that research fronts in L2 vocabulary research might be more elusive and harder to recognise than we had expected.
This raises the question whether the conventional practice of working with only the most frequently cited sources in a data set, producing mappings which take into account only a hundred of these sources, needs to be rethought. Perhaps we should be looking for research clusters that meet common objective criteria, rather than the arbitrary thresholds that underpin maps like Figure 7?
I have not yet managed to find a methodology that could automatically identify and extract less frequently cited but still interesting clusters in very large data sets. However, anyone familiar with the entire 2020 oeuvre will realise that there are a number of themes running through this work which look as though they might be embryonic themes—themes that are not cited often enough for them to appear in the main mappings, yet nonetheless capture some important growing topics of interest in L2 vocabulary research. I have listed some of these themes in Table 7, along with some papers published in 2020 which exemplify them. Several of these themes represent a substantial amount of research output: the gaming theme, for instance, appears in at least 10 papers in 2020. Gaming does not appear explicitly in Figure 7. Had these papers appeared in 1990, however, they would easily have met the threshold for inclusion in the 1990 map, and gaming would have appeared in Figure 1 as a very significant research cluster.
Space does not allow me to follow up this idea here, and we cannot investigate the characteristics of these sub-threshold clusters in any detail. However, I will be reporting an analysis that tries to establish objective criteria for identifying clusters of this sort in a follow-up paper. In the meantime, there is one set of research papers which can be objectively identified and analysed using the same approach that we used in the previous section. This is a subset of the 2020 data set that does not cite Nation among its sources. This work is not marginal, but its relationship to the work that does cite Nation means that it tends to get overlooked. It is instructive to examine how this work differs from the work we have discussed so far.
The 2020 data set contains a subset of 74 papers which unusually do not cite Nation among their references. These 74 papers do cite other sources, however—5214 in total, of which 4468 are cited only once. The distribution of these papers is summarised in Table 8. The most frequently cited sources in this subset of the data are Schmitt (19 citations); Kroll (12 citations); van Hell (11 citations); and Bates, Brysbaert, Laufer, and Perfetti (10 citations each). The overall distribution of these citations is shown in Table 9. What is striking here is the fact that only two of the very significant influences that we identified in the larger 2020 data set appear in this smaller set (Schmitt and Laufer).
Figure 8 shows this smaller data set as a spanning tree mapping. The map is made up of 61 sources that are co-cited at least five times in the reduced data set; each node is connected by an edge to the node it is most frequently co-cited with. The spine of this mapping is the set of co-citations that link van Hell, Kroll, Bates, Brysbaert, and Schmitt. The strongest links in the mapping are reported in Table 9.
Gephi’s analysis found eight clusters in this data set.
Cluster A, dominated by van Hell, is made up of sources that are interested in bilingual lexicons, and use word recognition as their main methodological tool. Cluster B, dominated by Kroll, shares many of the same concerns as Cluster A, but seems to be more concerned with productive vocabulary, whereas Cluster A focusses on receptive vocabulary. Cluster B also makes use of more formal models, notably the Bilingual Interactive Activation model (Dijkstra et al. 1998). Cluster C is a set of statistical sources that identify methodological features in Cluster A and Cluster B. Cluster D, dominated by Brysbaert, also seems to be a methodological cluster. Brysbaert has published a large set of vocabulary size tests for several different languages, and a number of norms lists which are routinely used by the sources in Cluster A and Cluster B. The other members of this cluster seem to be interested mainly in reading behaviour. This theme is also picked up in Cluster F, a group of sources whose main interest is reading behaviour in young bilingual speakers. Cluster E is a much reduced set of the influences who appear in Figure 6. The striking feature here is how small this cluster is, and how few co-citation links there are between this cluster and the rest of the map. Cluster F is a small, detached cluster of Canadian researchers who mainly work on English/French bilinguals. The detached status of this cluster starkly emphasises the dominance of English language research in all the maps we have discussed so far in this report.
Almost all of the sources identified in Figure 8 will be unfamiliar to researchers working in the more mainstream L2 vocabulary tradition. Figure 8 strongly suggests that the research clusters identified in Figure 7 are only part of a much more complicated research endeavour. Yes, the main bulk of the 2020 research clusters around a small number of very significant sources, that most researchers in the Applied Linguistics tradition would immediately recognise, but there exists alongside these sources at least one other “invisible college”, a set of clusters which is numerically large, intellectually coherent, but to a large extent independent of the main research trends identified in Figure 7. The data suggest that we have two quite separate research traditions here, one where researchers see their roots in Applied Linguistics research, the other looking more towards psychology. There is very little direct contact between these two traditions, with almost no overlap in the sources that they cite, despite a shared set of research questions, particularly an interest in L2 reading behaviour. There is clearly a case for encouraging closer collaboration between the two traditions.

6. Conclusions

This paper has presented an interim analysis of the L2 vocabulary research published in 2020. The introduction to this paper raised a number of questions about how L2 vocabulary research developed between 1990 and 2020. Not all these questions were answered by the data that I have reported so far, however. The two snapshots discussed suggest that there have been some major changes between 1990 and 2020—particularly the enormous growth in research outputs, the huge increase in the number of researchers active in the field, and the appearance of several new research themes. With only two data points, it is not possible to present the kind of fine-grained analysis that we would really like. Work of this type requires much more data than are currently available. In broad terms, however, we have noted some major changes in the field. Almost all of the authors who appear in the 1990 map have been replaced by a new generation of researchers, and some well-established figures no longer appear to be influential in 2020. The field as a whole is still driven by practical concerns (making L2 vocabulary learning effective, and research into teaching methods), but much of this work is not cited often enough for it to appear in the bibliometric maps. Most of the clusters identified in the 2020 map were also present in the 1990 map, but some have become less central in the intervening years: the distinctive Scandinavian approach to vocabulary acquisition that we identified in the 1990 map seems to have disappeared, and the concern with word frequency identified by cluster IX in Figure 1 no longer seems to be important in the more recent maps. The Carter/McCarthy corpus sub-cluster in Figure 1 seems to have morphed into to a more general concern with phraseology (Cluster D in Figure 7). The more recent maps show a heightened use of standardised research tools (notably Wesche and Paribakht’s Vocabulary Knowledge Scale and the several re-workings of Nation’s Levels Tests). Some methodological innovations are also apparent—notably, the appearance of eye-tracking research. An important recent development is the appearance of a lot of neuro-linguistic research that uses clinical methods such as fMRI scanning and event-related potential (ERP) studies. This work is not yet cited often enough for it to appear as a separate cluster in the significant influences map, but it is clearly a trend that will play a large role in future maps.
The main characteristic of the 2020 data set is the dominant position of Paul Nation: Nation is particularly strongly cited by authors whose main interest lies in vocabulary teaching, but not exclusively so. Among the top 104 most frequently cited authors, nearly all are co-cited with Nation. On the other hand, we also have a small number of authors who do not cite Nation in their own papers, notably sources working on L2 word recognition and some aspects of L2 reading. These sources have all the characteristics of an “invisible college”—they make up a rich, strongly structured set of influences with a distinctive approach to L2 vocabulary acquisition. However, they do not have much of a presence in our main analysis of the 2020 data set, and they are not easily identifiable as a thematic cluster in Figure 6.
This is not a new phenomenon. Most of my earlier maps—covering research before 1990—included a cluster of sources that would probably identify themselves as psychologists rather than linguists, and there has always been a tendency for these sources not to be co-cited with mainstream L2 research. Sadly, there have been few attempts to bridge the growing gap between these two traditions. (One early, but largely unsuccessful attempt at bridge building can be found in Schreuder and Weltens 1993). In the 2020 data set, it looks as though the psycholinguistic theme in L2 vocabulary research is continuing to develop as an independent research tradition which has only tenuous connections with the mainstream Applied Linguistics approach to L2 vocabulary research. Given that both traditions are concerned with a set of common interests, this cannot be a good thing, and there must be a strong case for a closer collaboration in future.
One particularly important characteristic of the psycholinguistic research is the way that it uses formal models of L2 lexical processing. Mainstream Applied Linguistics L2 vocabulary research relies much more heavily on informal, metaphorical models, such as Aitchison’s “gigantic multi-dimensional cobweb” metaphor (Aitchison 1987, p. 72). Serious modelling is almost completely absent from the mainstream Applied Linguistics research, but the maps I have presented here suggest that modelling approaches might provide a way to inject some important new ideas into the field by forging new co-citation links between otherwise disparate research clusters.
Finally, this paper has pointed out some problems that appear when we try to conduct historical research using co-citation methods. “Grade inflation” over a 30-year period is a serious issue which makes it difficult to draw direct comparisons between work produced in the 1990s and more recent research. It is also unclear whether some of the operating assumptions developed by earlier researchers can be easily applied to the much larger data sets that are typical in more recent research. In particular, we noted that the practice of drawing maps based on the most-cited 100 sources becomes increasingly contentious when more and more sources are ignored because an arbitrary inclusion threshold has been adopted. I think this problem might be resolved by developing a set of objective criteria for identifying clusters in the citation data sets, but work of this sort lies beyond the scope of this paper. Much the same might be said for the spanning tree maps that I have used in this report. These trees are easy to read and interpret, but this simplicity is achieved at a cost: the spanning trees display only the very strongest links in the data set, and they do not display the weaker links that exist between sources. This means that they tend to prioritise the status quo rather than the cutting edge of research. Spanning trees may not be a good solution to the problem of how to map the complexities of a rapidly developing field rather than a static one. Again, a solution to this problem lies outside the scope of this paper. I would be happy to share my extensive data sets with any colleagues who can think of a better solution.

Funding

This research received no external funding.

Institutional Review Board Statement

This research did not involve human beings or animals.

Informed Consent Statement

Not applicable.

Data Availability Statement

No new data were created or analyzed in this study. Data sharing is not applicable to this article.

Conflicts of Interest

The author declares no relevant conflicts of interest.

Note

1
Sharp-eyed readers will notice that I have included only 51 sources in this mapping, rather than the conventional 100. I did try to draw convincing maps using 104 nodes, but almost all the additional nodes were most strongly co-cited with Nation, and the resulting tree was almost impossible to read.

References

  1. Aitchison, Jean. 1987. Words in the Mind. Oxford: Blackwell. [Google Scholar]
  2. Akbarian, Is’haaq, Fatemeh Farajollahi, and Rosa Maria Jiménez Catalán. 2020. EFL learners’ lexical availability: Exploring frequency, exposure, and vocabulary level. System 91: 1–12. [Google Scholar] [CrossRef]
  3. Alexiou, Thomai, and James Milton. 2020. Pic-Lex: A new tool of measuring receptive vocabulary for very young learners. In Advancing English Language Education. Edited by Wafa Zoghbor and Thomaï Alexiou. Dubai: Zayed University Press, pp. 103–13. [Google Scholar]
  4. Andrä, Christian, Brian Mathias, Anika Schwager, Manuela Macedonia, and Katharina von Kriegstein. 2020. Learning foreign language vocabulary with gestures and pictures enhances vocabulary memory for several months post-learning in eight-year-old school children. Educational Psychology Review 32: 815–50. [Google Scholar] [CrossRef]
  5. Aotani, Noriko, and Shin’ya Takahashi. 2020. An analysis of Japanese EFL learners’ lexical network changes. Frontiers in Education 5. [Google Scholar] [CrossRef]
  6. Bahari, Akbar. 2020. Game-based collaborative vocabulary learning in blended and distance L2 learning. Journal of Open, Distance and e-Learning 35: 1–22. [Google Scholar] [CrossRef]
  7. Bastian, Mathieu, Sebastien Heymann, and Mathieu Jacomy. 2009. Gephi: An open source software for exploring and manipulating networks. Proceedings of the International AAAI Conference on Web and Social Media 3: 361–62. [Google Scholar] [CrossRef]
  8. Baten, Kristof, Silke van Hiel, and Ludovic de Cuypere. 2020. Vocabulary development in a CLIL context: A comparison between French and English L2. Studies in Second Language Learning and Teaching 10: 307–36. [Google Scholar] [CrossRef]
  9. Benatti, Ruben. 2020. CLIL courses: Teaching Italian language and culture in Turkmenistan. In Current Perspectives on Vocabulary Learning and Teaching. Edited by Nuray Alagozlu and Vedat Kiymazarslan. Newcastle: Cambridge Scholars Publishing, pp. 161–79. [Google Scholar]
  10. Chen, Jianlin, and Hong Liu. 2020. The effect of the non-task language when trilingual people use two languages in a language switching experiment. Frontiers in Psychology 11. [Google Scholar] [CrossRef] [PubMed]
  11. Cobb, Tom, and Marlise Horst. 2019. Bringing home the Word. Canadian Modern Language Review 75: 285–98. [Google Scholar] [CrossRef]
  12. Crane, Diana. 1972. Invisible Colleges: Diffusion of Knowledge in Scientific Communities. Chicago: University of Chicago Press. [Google Scholar]
  13. Dang, Thi Ngoc Yen. 2020. Corpus-based word lists in second language vocabulary research, learning and teaching. In The Routledge Handbook of Vocabulary Studies. Edited by Stuart Webb. Abingdon: Routledge, pp. 288–303. [Google Scholar]
  14. Denison, Clint, and Imogen Custance. 2020. Vocabulary learning using student-created class vocabulary lists. Vocabulary Learning and Instruction 9: 1–8. [Google Scholar] [CrossRef]
  15. Dijkstra, Ton, Walter van Heuven, and Jonathan Grainger. 1998. Simulating cross-language competition with the Bilingual Interactive Activation Model. Psychologica Belgica 38: 177–96. [Google Scholar] [CrossRef]
  16. Efeoglu, Gulumser, Gulru Yukesel, and Suat Baran. 2020. Lexical cross-linguistic influence: A study of three multilingual learners of L3 English. International Journal of Multilingualism 17: 535–51. [Google Scholar] [CrossRef]
  17. Enayati, Fatemeh, and Abbas Pourhosein Gilakjani. 2020. The impact of computer assisted language learning (CALL) on improving intermediate EFL Learners vocabulary learning. International Journal of Language Education 4: 96–112. [Google Scholar] [CrossRef]
  18. Gudmundson, Anna. 2020. The mental lexicon of multilingual adult learners of Italian L3: A study of word association behavior and cross-lingual semantic priming. In Third Language Acquisition. EuroSLA Studies 3. Edited by Camilla Bardel and Laura Sanchez. Berlin: Language Sciences Press, pp. 67–110. [Google Scholar] [CrossRef]
  19. Herrera Caldas, Veronica, Erzsebet Bekes, and Carmen Cajamarca. 2020. Effective vocabulary acquisition strategies employed by Ecuadorian teachers. Asian Journal of English Language Studies 8: 159–88. [Google Scholar]
  20. Hulstijn, Jan, Merel Hollander, and Tine Greidanus. 1996. Incidental vocabulary learning by advanced foreign language students: The influence of marginal glosses, dictionary use and the reoccurrence of unknown words. Modern Language Journal 80: 327–39. [Google Scholar] [CrossRef]
  21. Kambakis-Vougiouklis, Penelope, and Eirene Katsarou. 2020. Exploring the role of self-regulation capacity and self-esteem on vocabulary learning strategy use by Greek university learners. Asian EFL Journal 27: 123–46. [Google Scholar]
  22. Lafleur, Louis. 2020. The indirect spaced repetition concept. Vocabulary Learning and Instruction 9: 9–16. [Google Scholar] [CrossRef]
  23. Lee, Hansol, Mark Warschauer, and Jang Ho Lee. 2020. Toward the establishment of a data-driven learning model: Role of learner factors in corpus-based second language vocabulary learning. The Modern Language Journal 104: 345–62. [Google Scholar] [CrossRef]
  24. Liu, Yushuan, and Janet van Hell. 2020. Learning novel word meanings: An ERP study on lexical consolidation in monolingual, inexperienced foreign language learners. Language Learning 70: 45–74. [Google Scholar] [CrossRef]
  25. Lotka, Alfred J. 1926. The frequency distribution of scientific productivity. Journal of the Washington Academy of Sciences 16: 317–24. [Google Scholar]
  26. Masrai, Ahmed. 2020. Exploring the impact of individual differences in aural vocabulary knowledge, written vocabulary knowledge and working memory capacity on explaining L2 learners’ listening comprehension. Applied Linguistics Review 11: 423–47. [Google Scholar] [CrossRef]
  27. Meara, Paul. 2020. The emergence of a First Paradigm in vocabulary research: The bibliometrics of System. Vocabulary Learning and Instruction 9: 1–32. [Google Scholar] [CrossRef]
  28. Meara, Paul. 2022. Ground Zero: A bibliometric analysis of L2 vocabulary research 1986–1990. Linguistics Beyond and Within 8: 133–51. [Google Scholar] [CrossRef]
  29. Meara, Paul. 2023. Shifting sands: A bibliometric analysis of L2 vocabulary research in 1991. Linguistics Beyond and Within 9: 112–32. [Google Scholar] [CrossRef]
  30. Meara, Paul. n.d. VARGA: The Vocabulary Acquisition Research Group Archive. Available online: https://www.lognostics.co.uk/varga/ (accessed on 20 December 2023).
  31. Nahavandi, Zohreh, Mona Tabatabaee-Yazdi, and Aynaz Samir. 2020. Verbal and non-verbal fluid intelligence as predictors of vocabulary knowledge. Journal of English Language Research 1: 12–21. [Google Scholar]
  32. Nordlund, Marie, and Cathrine Norberg. 2020. Vocabulary in EFL teaching materials for young learners. International Journal of Language Studies 14: 89–116. [Google Scholar]
  33. Obermeier, Andrew. 2020. Exploring the effectiveness of deliberate computer-assisted language learning. Vocabulary Learning and Instruction 9: 24–38. [Google Scholar] [CrossRef]
  34. Price, Derek J. de Solla. 1965. Networks of Scientific Papers. Science 149: 510–15. [Google Scholar] [CrossRef] [PubMed]
  35. Richards, Jack C. 1976. The role of vocabulary teaching. TESOL Quarterly 10: 77–89. [Google Scholar] [CrossRef]
  36. Sararoodi, Ashraf, and Mohammed Farvardin. 2020. The effect of input spacing on EFL learners’ vocabulary knowledge. Language Literacy: Journal of Linguistics, Literature and Language Teaching 4: 255–62. [Google Scholar] [CrossRef]
  37. Sasao, Yosue. 2020. Measuring the ability to learn words. In The Routledge Handbook of Vocabulary Studies. Edited by Stuart Webb. Abingdon: Routledge, pp. 419–32. [Google Scholar]
  38. Schreuder, Rob, and Bert Weltens, eds. 1993. The Bilingual Lexicon. Amsterdam: Benjamins. [Google Scholar]
  39. Small, Harry. 1973. Co-citation in the scientific literature: A new measure of the relationship between two documents. Journal of the American Society for Information Science 24: 265–69. [Google Scholar] [CrossRef]
  40. Spätgens, Tessa, and Rob Schoonen. 2020. The structure of developing semantic networks: Evidence from single and multiple nominal word associations in young monolingual and bilingual readers. Applied Psycholinguistics 41: 1141–69. [Google Scholar] [CrossRef]
  41. Sulpizio, Simone, Nicola Del Maschio, Davide Fedeli, and Jubin Abutalebi. 2020. Bilingual language processing: A meta-analysis of functional neuroimaging studies. Neuroscience and Biobehavioral Reviews 108: 834–53. [Google Scholar] [CrossRef] [PubMed]
  42. Tai, Tzu-Yu, Howard Hao-Jan Chen, and Graeme Todd. 2020. The impact of a virtual reality app on adolescent EFL learners’ vocabulary learning. Computer Assisted Language Learning 35: 892–917. [Google Scholar] [CrossRef]
  43. Talib, Pawan. 2020. An introduction of corpora for ESL learners: A data driven learning about academic vocabulary. Zanco Journal of Humanity Sciences 24: 243–53. [Google Scholar]
  44. Thompson, Christopher, and Sam von Gillern. 2020. Video-game based instruction for vocabulary acquisition with English language learners: A Bayesian meta-analysis. Educational Research Review 30: 100332. [Google Scholar] [CrossRef]
  45. Wesche, Marjorie, and T. Sima Paribakht. 1996. Assessing vocabulary knowledge: Depth vs. breadth. Canadian Modern Language Review 53: 13–40. [Google Scholar] [CrossRef]
  46. Zeller, Jan. 2020. Code-switching does not equal code-switching. An event-related potentials study on switching From L2 German to L1 Russian at prepositions and nouns. Frontiers in Psychology 11: 1387. [Google Scholar] [CrossRef] [PubMed]
  47. Zhang, Penchong, and Susan Graham. 2020. Vocabulary learning through listening: Comparing L2 explanations, teacher codeswitching, contrastive focus-on-form and incidental learning. Language Teaching Research 24: 765–84. [Google Scholar] [CrossRef]
  48. Zhang, Yuanyue, Yao Lu, Lijuan Liang, and Baiguo Chen. 2020. The effect of semantic similarity on learning ambiguous words in a second language: An event-related potential study. Frontiers in Psychology 11: 1633. [Google Scholar] [CrossRef]
Figure 1. The 1990 co-citation data set shown as a spanning tree. Each node represents an author. Edges show the strongest co-citation connections between authors; e.g., in this tree, Carter and McCarthy are strongly co-cited, while Stevick and Gairns are co-cited only a few times.
Languages 09 00190 g001
Figure 2. The number of L2 vocabulary-related research papers published in the years 1980–2023.
Languages 09 00190 g002
Figure 3. A spanning tree showing the 51 most-cited sources in the 2020 data set. The map shows the strongest connections between the nodes.
Languages 09 00190 g003
Figure 4. The 2020 data set without co-citations involving Nation. The figure contains 103 nodes, each co-cited at least 17 times on the data set. Edges with strength less than 25 have been removed in the interests of clarity. Nodes are sized according to the number of co-citation links they share in.
Languages 09 00190 g004
Figure 5. The nine significant influences who appear in both the 1990 data set and the 2020 data set.
Languages 09 00190 g005
Figure 6. A spanning tree analysis of the new sources who appear in the 2020 map. Each source is connected to the source it is most frequently co-cited with.
Languages 09 00190 g006
Figure 7. The new entries in the 2020 data set: donut mapping with Schmitt and Webb excluded. Threshold for inclusion: 25 co-citations. Only edges with weight greater than 20 are shown.
Languages 09 00190 g007
Figure 8. A co-citation map based on the 61 sources in the 2020 data set that do not cite Nation. Each source is cited at least five times in the data set.
Languages 09 00190 g008
Table 1. The number of authors contributing to N outputs in 2020.
Outputs10987654321
Authors 20201 41335439
Lotka estimate457912182749109
Table 2. The number of cases who are cited N times in the 2020 data set.
No. Citations12–1011–2021–3031–4041–5051–6061–7071–8081–9091–100100+
No Cases8142254514232148220105
Table 3. The 20 most cited sources in the 2020 data set.
SourceCited in N PapersSourceCited in N Papers
ISP Nation206R Waring50
N Schmitt173A Coxhead48
B Laufer128TS Paribakht48
PM Meara108D Schmitt48
S Webb107JL Milton46
JH Hulstijn84A Pellicer-Sanchez46
T Cobb68SD Krashen45
J Read65M Horst44
NC Ellis59W Grabe40
D Beglar53MB Wesche40
Table 4. The 10 strongest co-citation links in Figure 3. Note that all of these links involve Nation and one other source.
LinksWeight LinksWeight
1Nation–Schmitt1566Nation–Cobb65
2Nation–Laufer1227Nation–Read61
3Nation–Webb1038Nation–NC Ellis50
4Nation–Meara1019Nation–Beglar50
5Nation–Hulstijn7910Nation–Waring48
Table 5. The most significant influences in the 1990 data set and the 2020 data set.
1990 onlyAitchison, JR Anderson, R Brown, Carter, Channell, AD Cohen, Corder, Elley, Faerch, Feldman, Francis, Gairns, Haastrup, Jain, Kasper, Kellerman, M King, Kirsner, Levenston, Lockhart, Ostyn, Palmberg, Putseys, Redman, Rudzka Schouten_van Parreren, MC Smith, Swain, Wallace, West
Both yearsRC Anderson, Gass, Krashen, Laufer, McCarthy, Meara, Nagy, Nation, Richards;
2020 onlyBarcroft, Beglar, Boers, Brysbaert, Clapham, Cobb, Coxhead, Desmet, Elgort. NC Ellis.
R Ellis, Grabe, Horst, Hulstijn, Milton, Nagy, Nassaji, Oxford, Paribakht, Pellicer-Sanchez, Peters, DD Qian, J Read, Sasao, Schmidt, N Schmitt, van Zeeland, Waring, Webb, Wesche
Table 6. The 15 strongest co-citation links in Figure 7.
LinksWeight LinksWeight LinksWeight
1Cobb–Horst406Cobb–Waring3111Cobb–Read27
2Paribakht–Wesche397Hulstijn–Waring2912Cobb–Pellicer-S.27
3Cobb–Hulstijn388Horst–Waring2913Beglar–Read27
4NC_Ellis–Hulstijn379Hulstijn–Peters2814Hulstijn–Paribakht27
5Clapham–D_Schmitt3510Horst–Hulstijn2715Peters–Pellicer-S.27
Table 7. A set of topics which frequently occur in the 2020 data set, but fail to meet the threshold for inclusion in the main analysis.
TopicExamples in the 2020 Outputs
Technology and apps(Enayati and Gilakjani 2020); (Tai et al. 2020); (Obermeier 2020)
Data-driven approaches(Talib 2020); (Lee et al. 2020); (Dang 2020)
Listening vocabulary(Masrai 2020); (Zhang and Graham 2020)
Gestures(Andrä et al. 2020)
Vocabulary Networks(Aotani and Takahashi 2020); (Spätgens and Schoonen 2020)
CLIL(Baten et al. 2020); (Benatti 2020)
Neurolinguistic Approaches(Zhang et al. 2020); (Zeller 2020); (Liu and van Hell 2020)
Gaming approaches(Bahari 2020); (Thompson and Gillern 2020)
Trilingual speakers(Chen and Liu 2020); (Efeoglu et al. 2020); (Gudmundson 2020)
Young learners(Alexiou and Milton 2020); (Nordlund and Norberg 2020)
Availability(Akbarian et al. 2020)
Learner Autonomy(Denison and Custance 2020); (Kambakis-Vougiouklis and Katsarou 2020)
Spaced learning(Sararoodi and Farvardin 2020); (Lafleur 2020)
Good vocabulary learners(Sasao 2020); (Nahavandi et al. 2020)
Teaching strategies(Herrera Caldas et al. 2020)
Table 8. The number of cases who are cited N times in the not-Nation 2020 data set.
No. Citations20191817161514131211
No. Cases 1 11
No. Citations10987654321
No. Cases4349632551524784468
Table 9. The strongest co-citation links in Figure 8.
LinksWeight LinksWeight LinksWeight
1Bates–Bolkert86Kroll–Stewart611Schmitt–Webb6
2Bates–Machler77Costa–van Hell6
3Scheepers–Tily78Kroll–van Hell6
4Bolkert–Walker69Bates–Brysbaert6
5Barr–Tily610Dijkstra–v Heuven6
Disclaimer/Publisher’s Note: The statements, opinions and data contained in all publications are solely those of the individual author(s) and contributor(s) and not of MDPI and/or the editor(s). MDPI and/or the editor(s) disclaim responsibility for any injury to people or property resulting from any ideas, methods, instructions or products referred to in the content.

