Article

Quartz: A Template for Quantitative Corpus Data Visualization Tools

1
Department of Translation and Interpreting, University of Granada, 18002 Granada, Spain
2
Geneva Centre of Humanitarian Studies, University of Geneva and Geneva Graduate Institute, 1205 Genève, Switzerland
3
Department of Organizational Behavior, Faculty of Business and Economics (HEC Lausanne), University of Lausanne, 1015 Lausanne, Switzerland
*
Author to whom correspondence should be addressed.
Languages 2024, 9(3), 81; https://doi.org/10.3390/languages9030081
Submission received: 10 December 2023 / Revised: 7 February 2024 / Accepted: 11 February 2024 / Published: 28 February 2024
(This article belongs to the Special Issue Terminology in the Digital World)

Abstract

:
Quantitative data visualization is an important element of corpus linguistics, and visualization tools are commonly available in corpus management systems (CMSs) or developed for custom tasks. Nonetheless, the implementation and advancement of visualization methods can be a challenge, both for individual projects and collectively. This article introduces a web application template that integrates with the Sketch Engine application programming interface (API) to encourage the development of new visualization tools that can provide advanced visualization features while directly communicating with the CMS. The application template, written in Python and called Quartz, is described and implemented for the Humanitarian Encyclopedia as part of ongoing efforts to conduct analyses of humanitarian concepts. The application’s features, purpose, and limitations are described, and an example case study utilizing the software is offered, focusing on usage patterns of the concept localization in the humanitarian domain. Some of the challenges of improving visualization techniques for corpus-based analysis are discussed, including data interoperability and the role of visualization in data exploration.

1. Introduction

1.1. Recurrent Challenges with Visualizing Corpus Data

A basic feature of corpus linguistics software deals with the computation of the frequency of a query in a corpus. This is fundamental for both hypothesis-testing and exploratory statistical approaches for linguistic research (Gries 2022). To facilitate these approaches, corpus management systems (CMSs, as opposed to the more common “content management system”) such as AntConc, english-corpora.org, LancsBox, and Sketch Engine (SkE) incorporate some degree of descriptive statistics, including tabular data and visualizations (Anthony 2023; Brezina and Platt 2023; Davies 2020; Kilgarriff et al. 2014). While these and other tools offer various solutions to understand corpora with quantitative data, data visualization is an ongoing methodological challenge for corpus linguists.
Interacting with visualizations has been thought of as a key aspect of corpus-based methodologies. Arguments for this perspective include the iterative, exploratory nature of corpus-based analysis, the need to simplify large quantities of data, and the value of making corpus-based techniques more accessible (Rayson et al. 2016). New techniques are commonly developed while improving existing software, introducing specialized tools and demonstrating third-party visualization suites. Various recurrent needs are apparent in the software development processes of such projects and their associated literature (Anthony 2018; Caple et al. 2019; Luz and Sheehan 2020; Rayson et al. 2016; Säily and Suomela 2017):
  • Comparing large, complex datasets (including multiple corpora);
  • Filtering data with multiple variables;
  • Utilizing a variety of visualization types, from bar charts to innovative methods;
  • Balancing easy interpretation with the limits of visualization types;
  • Increasing the interactivity of visualizations;
  • Speeding up hypothesis development and testing;
  • Reducing technical barriers to users;
  • Linking text and quantitative data in interfaces;
  • Increasing the standardization of formats and procedures;
  • Incorporating statistical procedures;
  • Connecting several tools, i.e., via application programming interface (API);
  • Developing publicly available tools adaptable to other projects.
Despite the shared nature of these objectives across corpus software, no single solution can meet every research community’s needs and interests (Anthony 2022, p. 121). This on the one hand encourages a diverse ecosystem of corpus tools, both general and specialized. On the other hand, users may have to prioritize some features while sacrificing others when selecting tools to conduct research. Common limitations also exist, with the status quo regarding data visualization in CMSs as having room for improvement: “One of the reasons why corpus linguists do not opt to use more advanced visualization techniques perhaps lies in the fact that they are not offered in many popular corpus analysis tools” (Anthony 2018, p. 207).
Any lack of advanced visualization techniques in full-featured corpus software surely has several causes, but one might be the interoperability problem of corpus linguistics. That is to say, most corpus software is similar but not easily compatible. Poor data interoperability can slow the implementation of new features and the communication of data across methods (Anthony and Evert 2019; Rayson 2018). Without universal standards for these tools, visualization tasks logically also suffer from fragmentation and redundancy because they must be reinvented within each code base.
Consequently, while both innovations and incremental progress are apparent in the management of data visualization for corpus linguistics tools, new ad hoc solutions to meet specific research goals are continuously needed. As prominent authors have proposed, cooperative efforts will be needed to overcome some of the field’s systemic technical challenges (Anthony and Evert 2019; Rayson 2018). Future contributions to the corpus software ecosystem would then do well to take this reality into account: one of shared needs and challenges for the collective progress of visualization tools.
With the above factors in mind, this article introduces an open-source visualization tool that amounts to a template web application for the development of new visualization features. It is written in Python and functions as a portable interface that communicates with SkE’s API. The software, called Quartz, is available on GitHub1 and can be utilized as a template to create custom web applications for a variety of corpus research purposes, while encouraging the sharing and open improvement of methods. This article describes an implementation of Quartz as a web app for the Humanitarian Encyclopedia (HE) as part of previous research efforts to improve corpus visualization methods for concept analysis tasks in the humanitarian domain.

1.2. Analysis and Visualization Goals for the Humanitarian Encyclopedia

HE2 is a platform with the aim of offering detailed entries on 129 humanitarian concepts, such as gender-based violence and accountability. It constitutes a domain-specific terminological resource serving experts and the wider humanitarian community. The encyclopedia’s content is primarily derived from corpus-based methods utilizing SkE, with visualization taking an important role (Chambó and León-Araúz 2021). Visualization methods are used both to explore data and present results, and beyond being a feature of the encyclopedia, they play a role in operationalizing the study of conceptual variation, in this case for the humanitarian domain (Chambó and León-Araúz 2023b).
While the objectives and structure of HE have been described in detail in the aforementioned works, one of its key endeavors is to provide detailed corpus-based analyses on humanitarian concepts that can be subject to variation and disagreement. The encyclopedia aims to contribute to the collective understanding of concepts that are central to humanitarian action but can be vaguely defined or are contextualized differently by diverse global actors. For example, the entry on gender-based violence includes semantic knowledge extracted from reports by humanitarian organizations with differing views on when it may be appropriate to include boys and men as affected groups of this form of violence. The knowledge extraction process yielded a range of factors to consider, which could include the organization’s mission, funding sources, ideological positions, target communities, and the types of disasters it responds to. Since interactive visualization techniques help capture and present variation among such wide-ranging factors, developing the capabilities of the CMS and visualization methods have become central to such research at HE. The value of these tools in turn has been the impetus for developing more powerful and efficient techniques, as described below.
The visualization of data for HE has expanded since its inception, from utilizing default SkE features (Figure 1) to a range of chart types built with third-party software, including the Tableau visual analytics platform (Figure 2), Flourish, and the ggplot package in R. SkE’s bar charts for text type frequencies are more rudimentary but are generated automatically and integrated with the query system (nearby buttons allow navigating to concordances for a data sample). The Tableau charts, which have been described in detail in previous work (Chambó and León-Araúz 2021), were designed to increase interactivity: related charts are accessible via tabs; data points are selectable, hoverable, and sortable; and the presentation of data benefits from the various design capabilities of standalone visualization software.
That said, several needs remained unmet while integrating visualization into the concept analysis procedure, needs often inherited from the more general challenges with data visualization in corpus linguistics, as enumerated in Section 1. Particularly, a central issue is that a workflow that relies on manually exporting data from a CMS has the consequence of separating data visualization from data exploration (given that CMSs tend to have a limited set of visualization features). It is both difficult to scale and makes visualization more peripheral to the iterative process of analyzing patterns in corpus text types. Manually transferring data between software ultimately relegated visualization to being more of a final step than a continuous aspect of the methodology.
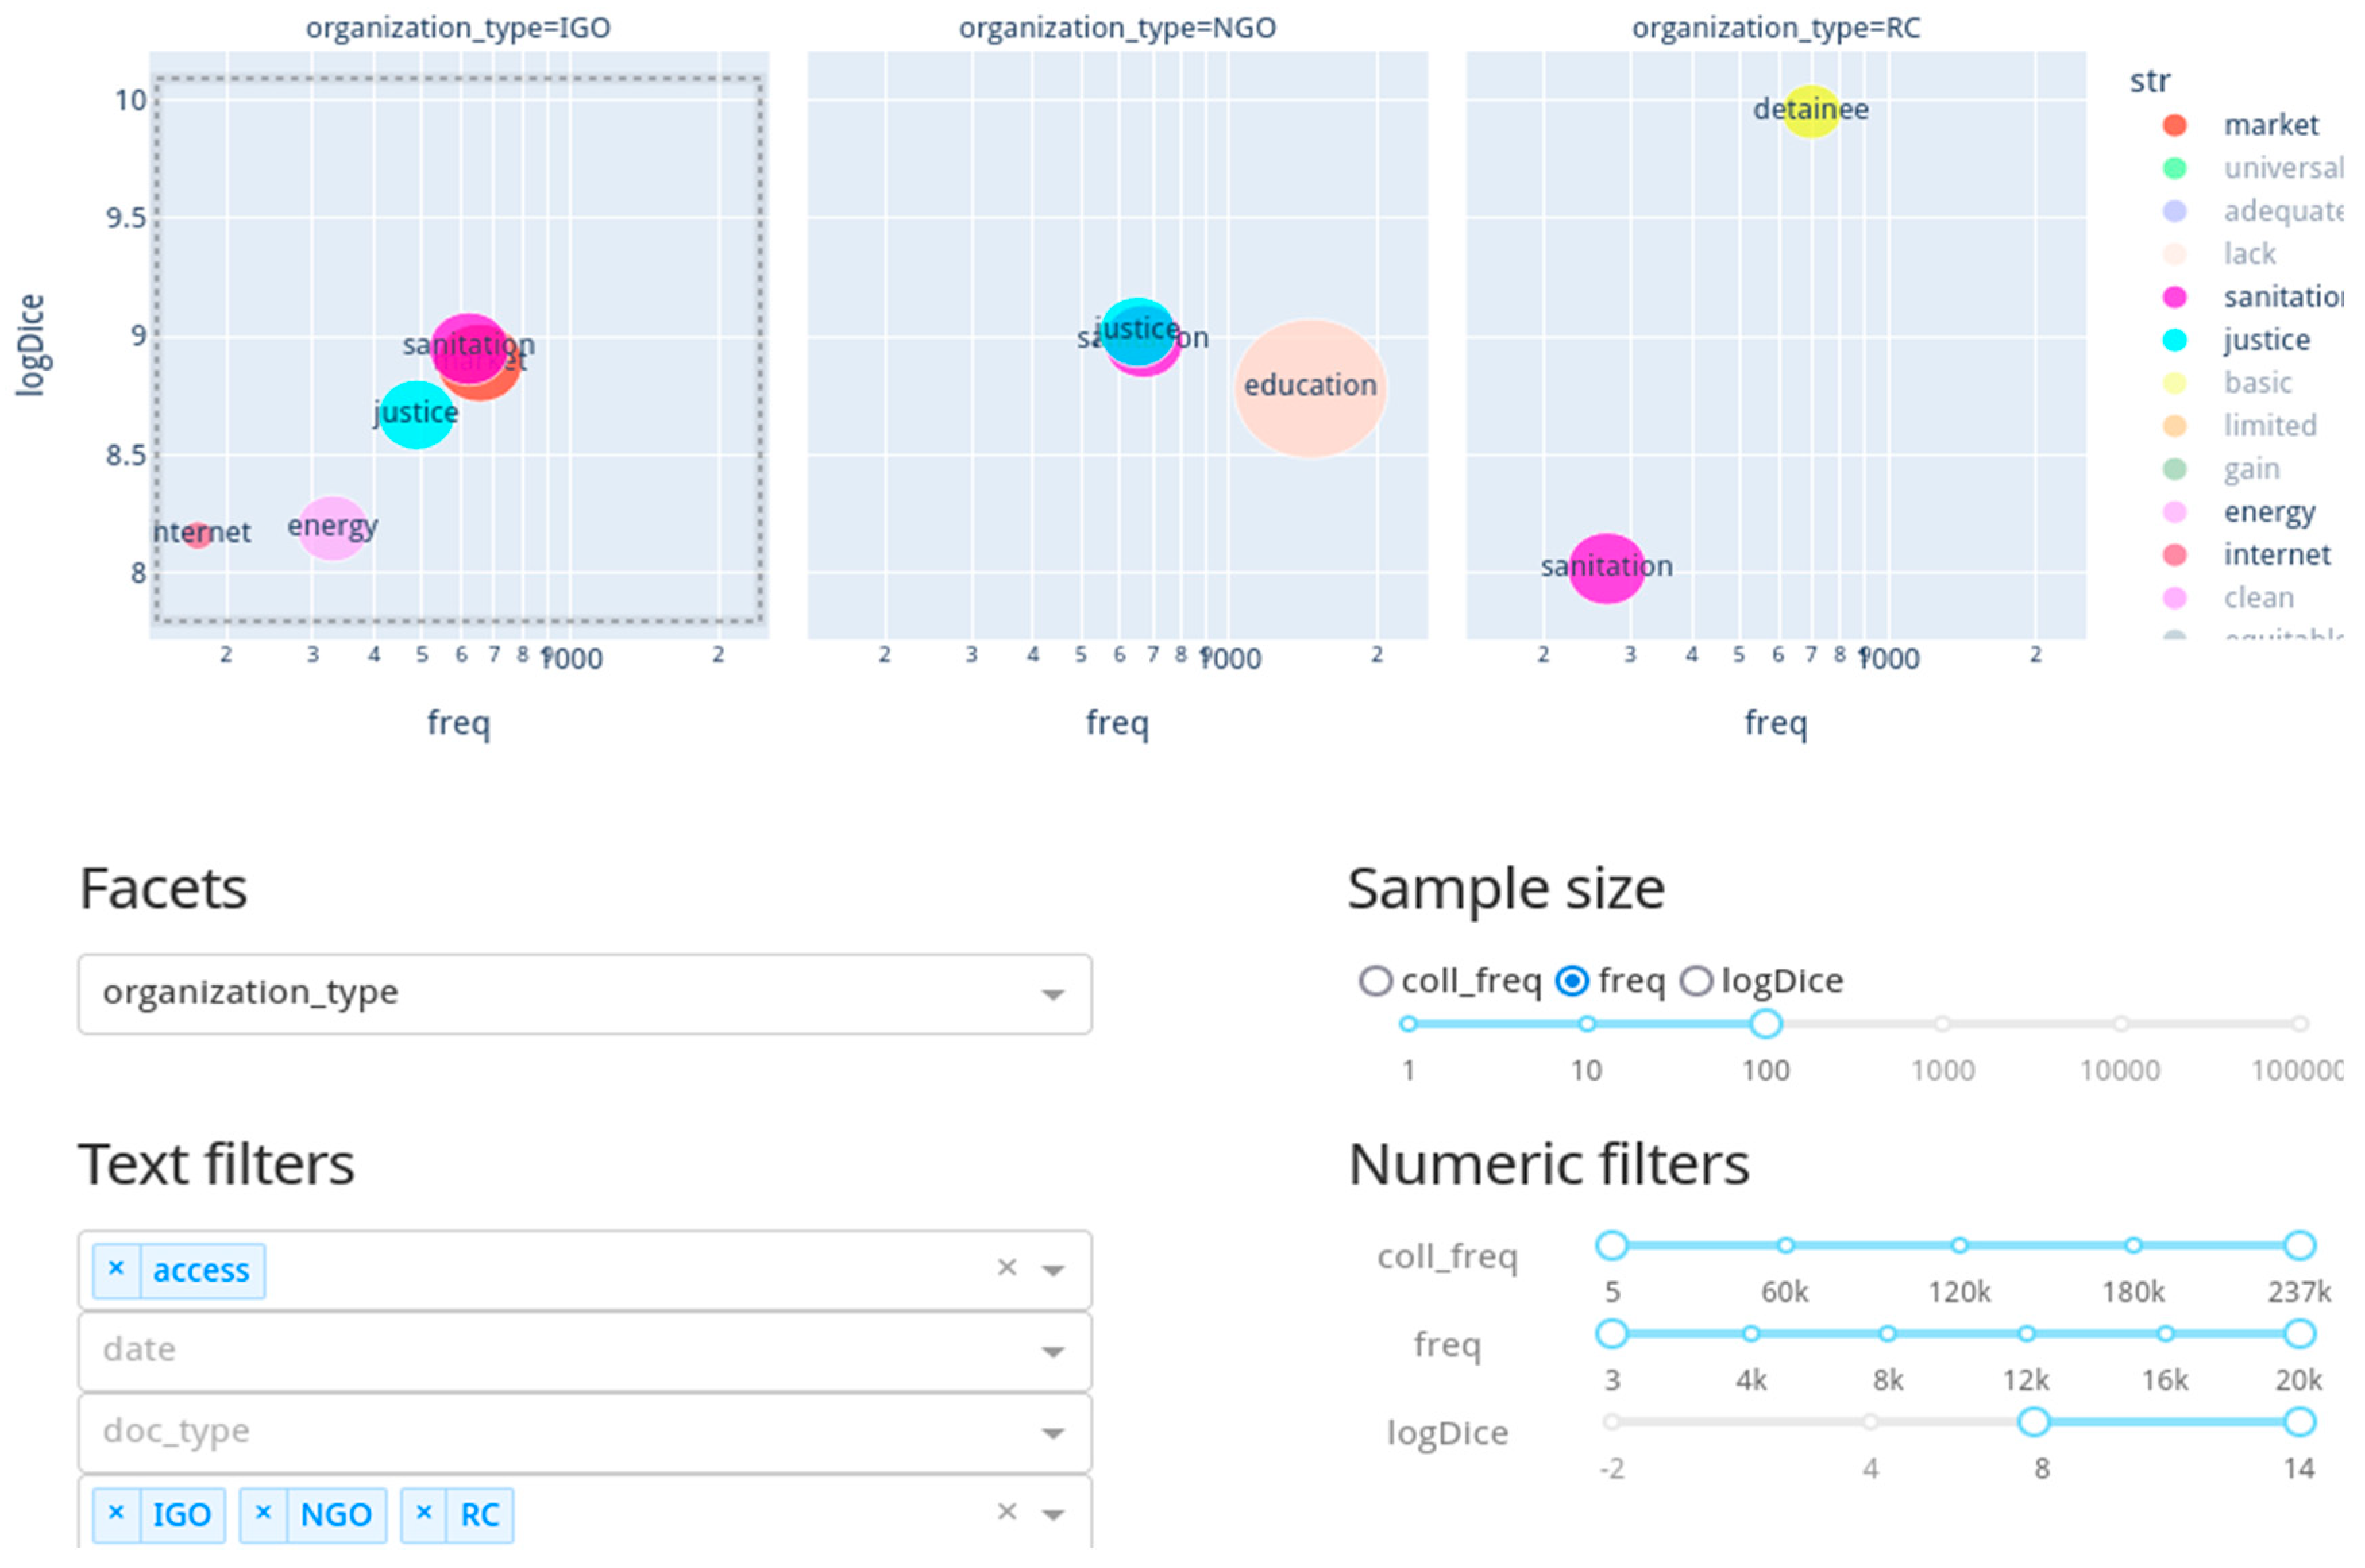
To begin the process of automating visualizations, an API-based approach was developed to aggregate SkE frequency data on a large scale (Isaacs and León-Araúz 2023). This resulted in a pilot web application (Figure 3) for exploring collocation data from hundreds of thousands of data points based on queries of HE concepts. Interactive elements such as dropdowns, sliders, and radio buttons offered greater control for research purposes, but filtering data became cumbersome, and the intent of the application was too technical for conveying results to a wide audience. This underscored the challenge of creating a tool adequate for conducting specialized research yet easy to interact with and comprehensible to lay users.
Previous efforts with expanding HE data visualization thus advanced while pointing to underlying difficulties. Refining the chosen concept analysis methodology or a similar one required addressing several technical needs together. The following list delineates some features identified for the design of a more effective corpus-based visualization tool. These items were taken into consideration and addressed partially or fully in the process of developing Quartz, the web application described in the following section.
  • Integration with at least one corpus management system, keeping visualization available throughout data exploration and analysis;
  • Visualization as a modality of data exploration, where clicking quantitative data points opens the corresponding query and concordance viewer;
  • Automatic drawing of visualizations with every query, utilizing a corpus software’s full query syntax;
  • Comparing multiple queries with side-by-side visualizations;
  • Querying any corpus available to the software, with comparisons of multiple corpora based on comparable text types;
  • Filtering of data points (corpus attribute values), as well as cross-filtering (i.e., viewing the frequency of a query by attribute B within a point of attribute A);
  • Open-source, modular design that allows for the addition of new visualization types and adaptation to new research avenues;
  • Portability, to facilitate implementation on multiple servers;
  • Navigation to any visualization via URL query string;
  • Exportation of visualized data in tabular format;
  • Incorporation of frequency statistics (absolute, relative, etc.);
  • Features for advanced and lay users in one interface.

2. Materials and Methods

A web application for visualizing corpus data was designed to manage research and data presentation needs for HE, redesigning and expanding the aforementioned pilot app. Called Quartz (in acknowledgment of SkE’s interface, Crystal), it is written in Python using the Dash framework, with Plotly visualizations and Docker containerization. It communicates with SkE or NoSketch Engine (NoSkE) servers (Kilgarriff et al. 2014; National Laboratory for Digital Heritage, Eötvös Loránd University Department of Digital Humanities 2023; Rychlỳ 2007) via an API wrapper (Isaacs 2022).
The web application provides a generic interface (it can be utilized for any type of corpus-query-based analysis) with superficial integration with the CMS: Quartz executes API calls to extract and visualize data from a SkE server and generates URLs leading back to said server when users select data points. This is an approach to resolve the problem of having data exploration and visualization being isolated due to technical limitations, as noted earlier. The general workflow can be summarized as such: download the source code; define a configuration file (as described in the following paragraph); establish API communications with a SkE server; deploy the web application; make queries via the search interface; view the automatically generated visualizations; adjust settings as needed; click on data points to explore data; navigate back to concordances in the CMS for specific data points via hyperlinks; continue the analysis procedure.
A configuration file defines variables indicating available corpora and how they are interacted with, e.g., which attributes may be queried or compared between corpora. This establishes how the application communicates with the CMS and processes source data (hypothetically, any SkE server and its corpora). Table 1 shows an example configuration for the HE’s internal corpus of humanitarian texts, where three attributes are comparable (date, type, organization type), three attributes are ignored (filename, word count, id), and labels are provided for enabled attributes. Visualizations display comparable attributes from several corpora in the same chart whenever they share the same label (another corpus sharing the “year” attribute label would be queried alongside the HE corpus).
Quartz is designed as a web application template, meaning that its source code can be cloned and modified to develop features for separate methodologies and projects. This open, configurable format was chosen as a means to address the siloing of visualization methods that can occur across the CMS ecosystem. To meet HE’s needs, the template was cloned and modified as an embedded visualization app for the HE website, called the HE Dashboard. Figure 4 shows the main interface, with a query for violence against women, including its abbreviation VAW. The query string entered by users gets converted to corpus query language (CQL) using a syntax similar to SkE’s “simple” query format (Jakubíček et al. 2010), as shown in (1); queries can also be written directly in CQL, preventing the visualization tool from becoming a bottleneck in the querying process. On execution, data are requested from the SkE server, cached, and visualized.
[lc=“violence” | lemma_lc=“violence”][lc=“against” |
lemma_lc=“against”][lc=“women” | lemma_lc=“women”]|[lc=“VAW” |
lemma_lc=“VAW”]
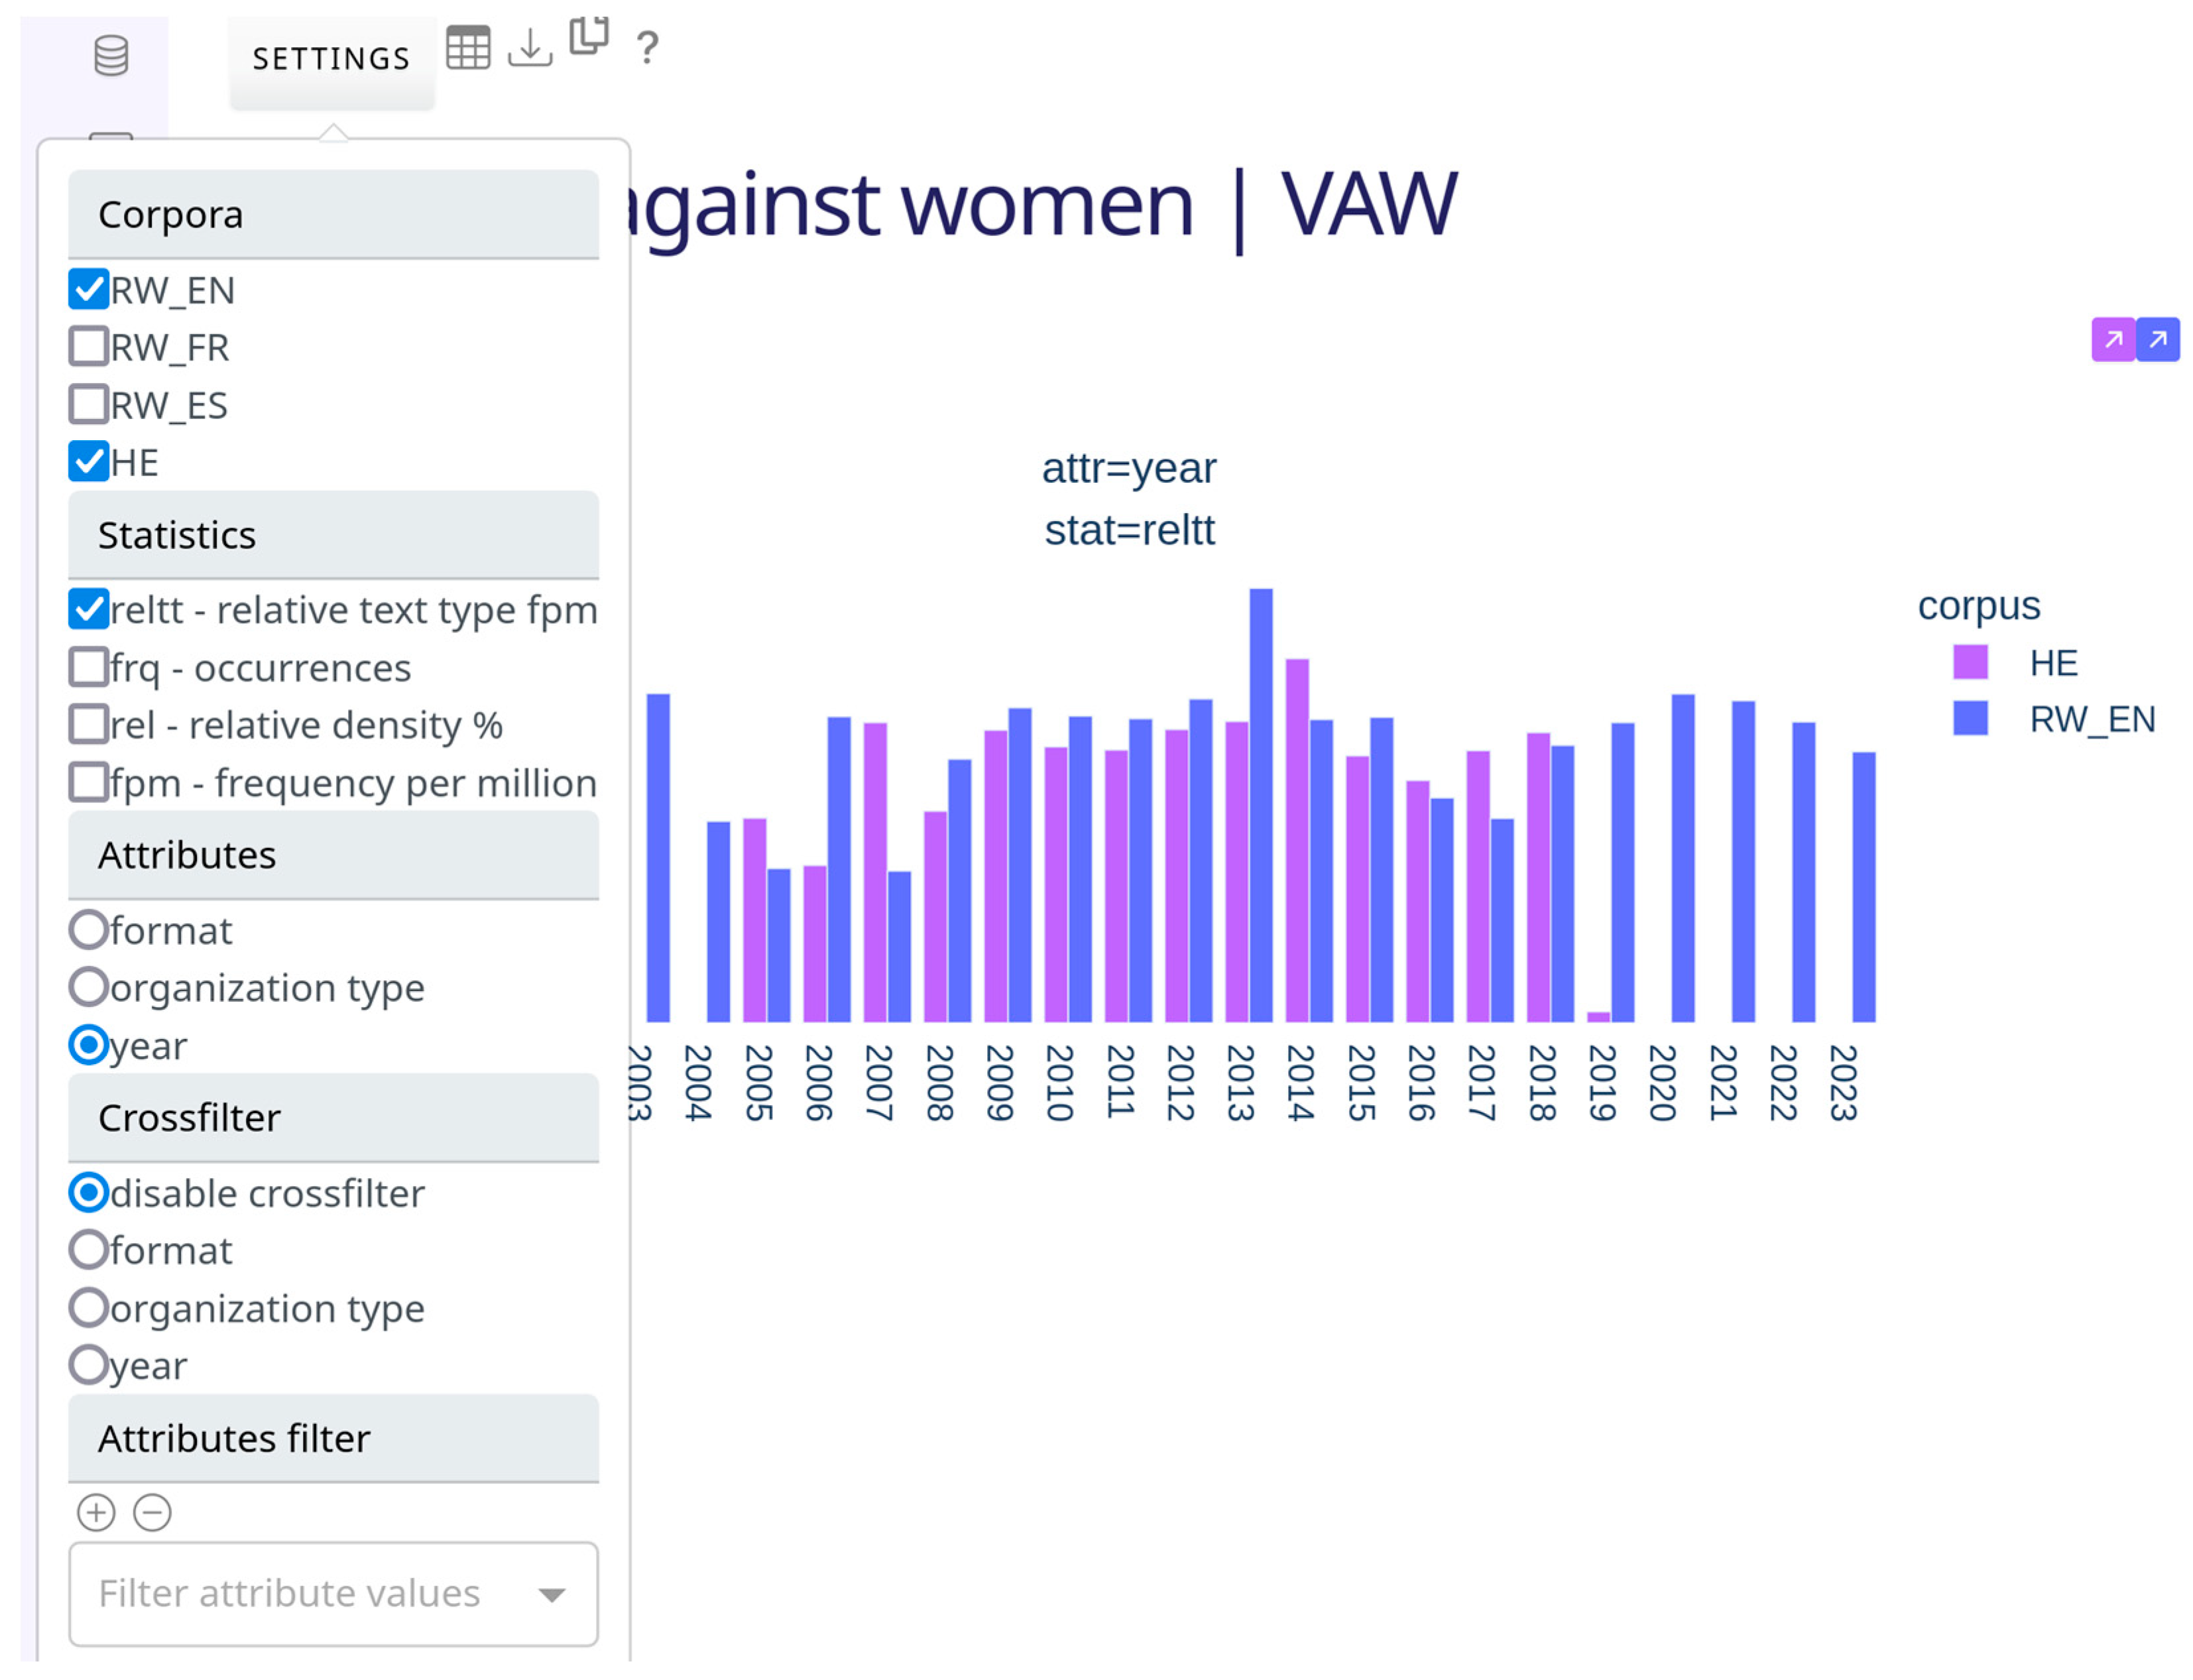
Figure 4 also shows the implementation of several of the desired features established in Section 1.2. Two corpora are queried together, in this case the encyclopedia’s internal corpus (HE), and a corpus of English ReliefWeb documents (RW_EN) developed in previous work (Isaacs 2023). Frequency data for each corpus are displayed in the same chart, in this case the relative per million frequency by text type (RELTT) calculated internally by SkE. The selected attribute (text type) is the document’s year of publication, which corresponds to class.DATE in HE and doc.date__original__year in RW_EN.
Each chart is interactive, including Plotly’s default interaction types (select, zoom, hide, etc.). When a point is selected, color-coded hyperlink buttons appear in the top right corner (here, purple and blue with white angled arrows) leading to the SkE concordance view for each corpus. This functionality fulfills the goal of searching multiple corpora simultaneously with visualizations while still maintaining access to the concordance viewer. Next to the Settings button are others for showing a table of summary statistics, downloading data, copying a URL to the current visualization, and viewing the user manual. Variables that control the query and displayed visualization can be modified via the Settings window, visible in Figure 5 on the left side and appearing over the chart as a pop-up element, including the active corpora, frequency statistics, and corpus attribute. Attribute values can also be filtered with the “Attributes filter” dropdown, e.g., to hide values that are not shared by corpora or outliers deemed unnecessary for presentation purposes.
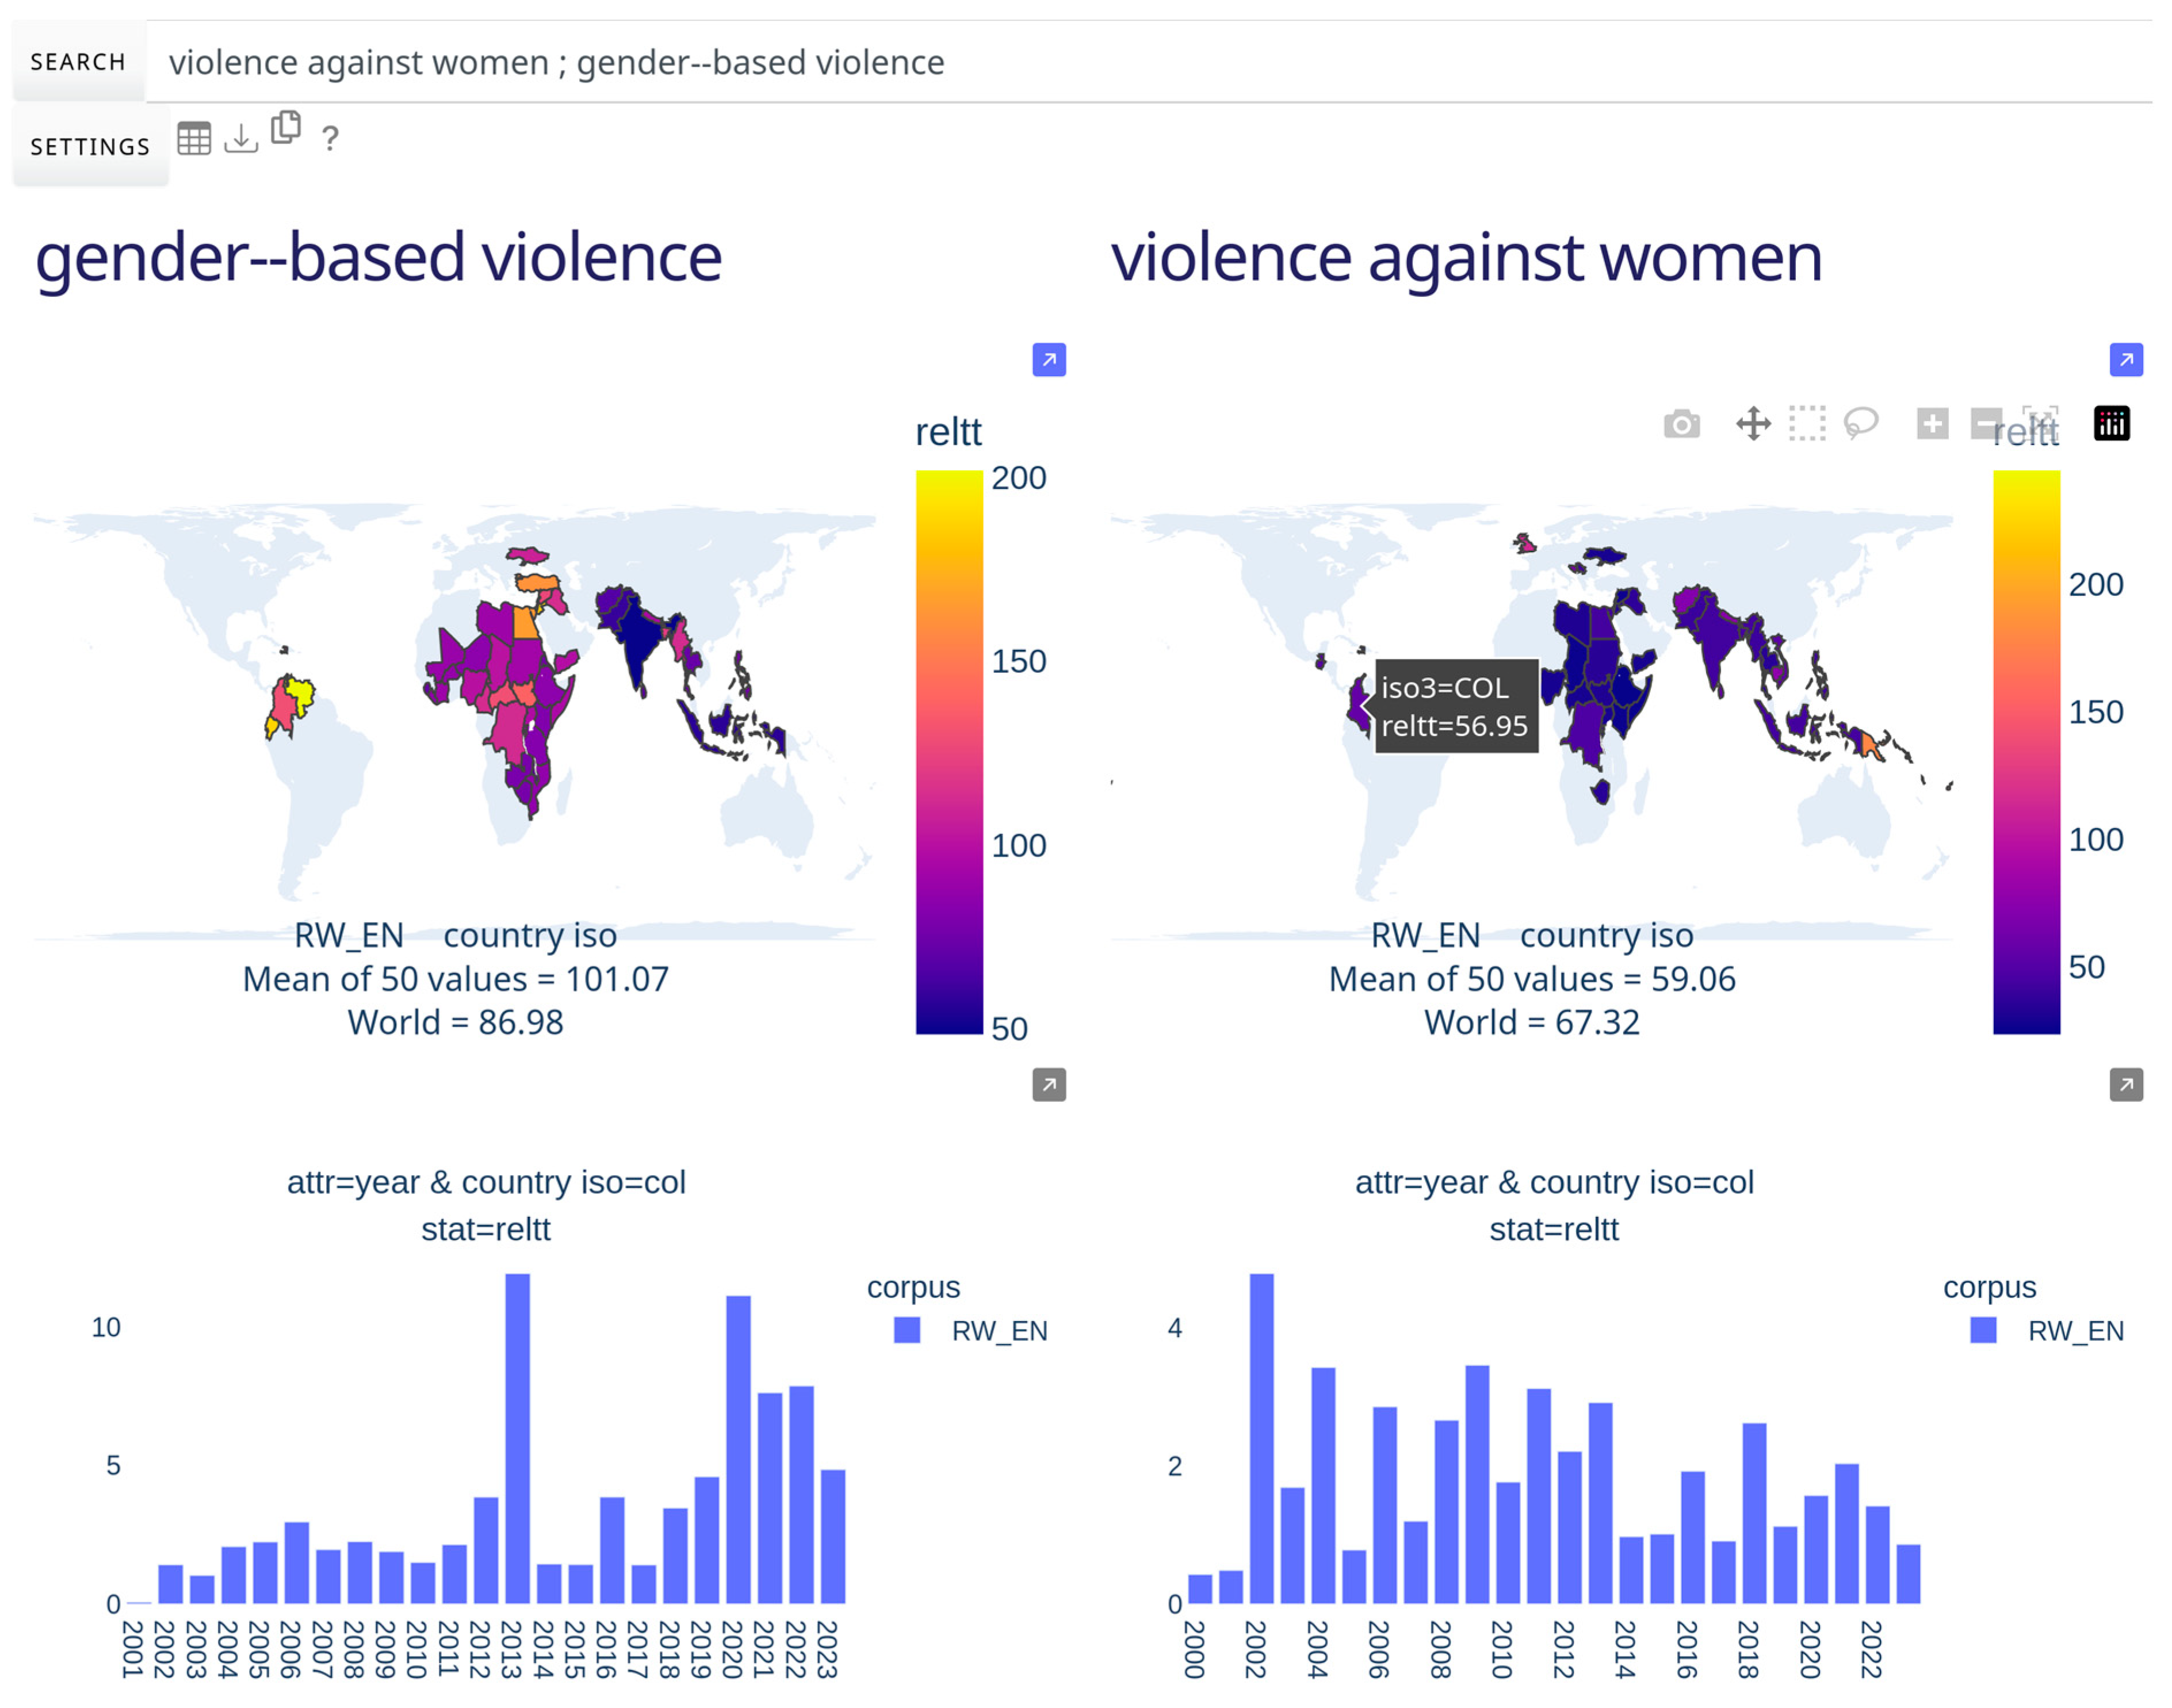
More advanced visualizations can include the comparison of two queries side by side, data-specific chart types, and cross-filter visualizations when data points are selected (i.e., secondary visualizations generated upon interaction with the primary visualization). These are visible in Figure 6, where frequencies for the Country ISO text type for RW_EN are rendered as choropleth maps comparing the queries gender--based violence and violence against women. When a data point is selected in a map, a bar chart is then drawn below, showing the cross-filter of the main attribute with another (in Figure 6, the RELTT frequency by year for Colombia). The visualization, consisting of four interactive charts with external links to SkE concordances, could be a point of departure for an analysis on trends of humanitarians’ usage of the two highly related concepts that together constitute an important area of focus for humanitarian actors. The methodology attempts to condense a variety of corpus data while remaining integrated with the CMS. Likewise, the underlying code provides a structured, reproducible format to prototype new visualization methods with the CMS using a preexisting architecture.
The query and visualization interfaces shown in Figure 4, Figure 5 and Figure 6 are a single page (“Query”) on the web app, which also includes a page dedicated to visualizing the makeup of corpora (“Corpora”) and another with detailed documentation (“User Guide”). The documentation can also be conveniently accessed as a pop-up layer on the “Query” page, as with the Settings window. The multi-page interface can be modified, as in the HE Dashboard implementation, e.g., to adapt the Query page or add additional visualization pages. However, managing these pages, features, and variables invariably leads to complications. Since some corpus attributes have thousands of values, an upper limit is necessary to restrict computational demands. While the RW_EN corpus contains data for all countries, only the top 50 attribute values are collected in Figure 6. A user’s screen size also imposes limits on the number of simultaneous queries and visible charts allowed. More intuitive layouts and other chart types could better serve needs according to the task. And, while this visualization is shareable as a URL with a query string, not all interactive elements can be saved (mouse clicks are not simulated, so the state of a modified chart is lost). Whether technical or otherwise, a range of considerations could improve visualization layouts and make the application template robust.

3. Results

To demonstrate the utility of Quartz to applied humanitarian research, a case study was conducted on the concept of localization in the HE and RW_EN corpora. This simulated the initial phase of an HE concept analysis (localization being one of the encyclopedia’s pending entries) and was also situated as part of broader HE research on the concept. Data exploration and trend identification were the main objectives. Following are a brief review of the appearance of localization in the humanitarian domain, a description of its frequencies in the RW_EN and HE corpora, the identification of trends based on several visualizations, and lastly, an initial exploration of concordances that would merit attention for knowledge extraction and conceptual analysis.
Emerging literature examining the concept shows that localization and its usage in the humanitarian domain is of interest to applied linguists and humanitarians alike (Barbelet et al. 2021). Humanitarian scholars and practitioners generally trace the origins of its use by humanitarians to the World Humanitarian Summit in 2016 (WHS). Localization was discussed in the lead-up to this event and became a central humanitarian policy objective, as stated in the summit’s outcome document, the Grand Bargain (Roepstorff 2020). Given this recent chronology, the appearance of localization should be broadly reflected in humanitarian corpora such as RW_EN and HE.
Generally speaking, localization is the process of shifting decision-making, leadership, and resource allocation closer to affected populations during humanitarian response. It emphasizes that local organizations and communities have a unique understanding of their own needs, which should guide humanitarian response to be more contextually relevant and efficient. It has been defined as “a process of recognising, respecting and strengthening the leadership by local authorities and the capacity of local civil society in humanitarian action, in order to better address the needs of affected populations and to prepare national actors for future humanitarian responses” (Fabre and Gupta 2017, p. 1). However, who is considered a local actor, how localization should be enabled, or who should actually carry out the response are still questions that remain controversial, thus contributing to the concept’s fuzziness.
The query string localisation|localization was searched with the HE-adapted version of Quartz in the HE and RW_EN corpora. In the app’s configuration, the date attributes for the corpora were designated as comparable: HE year values included 2005–2019 (with partial data for 2019) and RW_EN included 2000–2023 (2023 also being incomplete). Cross-filters were applied on the data for the year attribute to explore variation in the organization type, organization subtype, and source text types. For select subsets of the data, the original concordance lines were viewed on the NoSkE server to further analyze discursive trends underlying the frequency distributions.
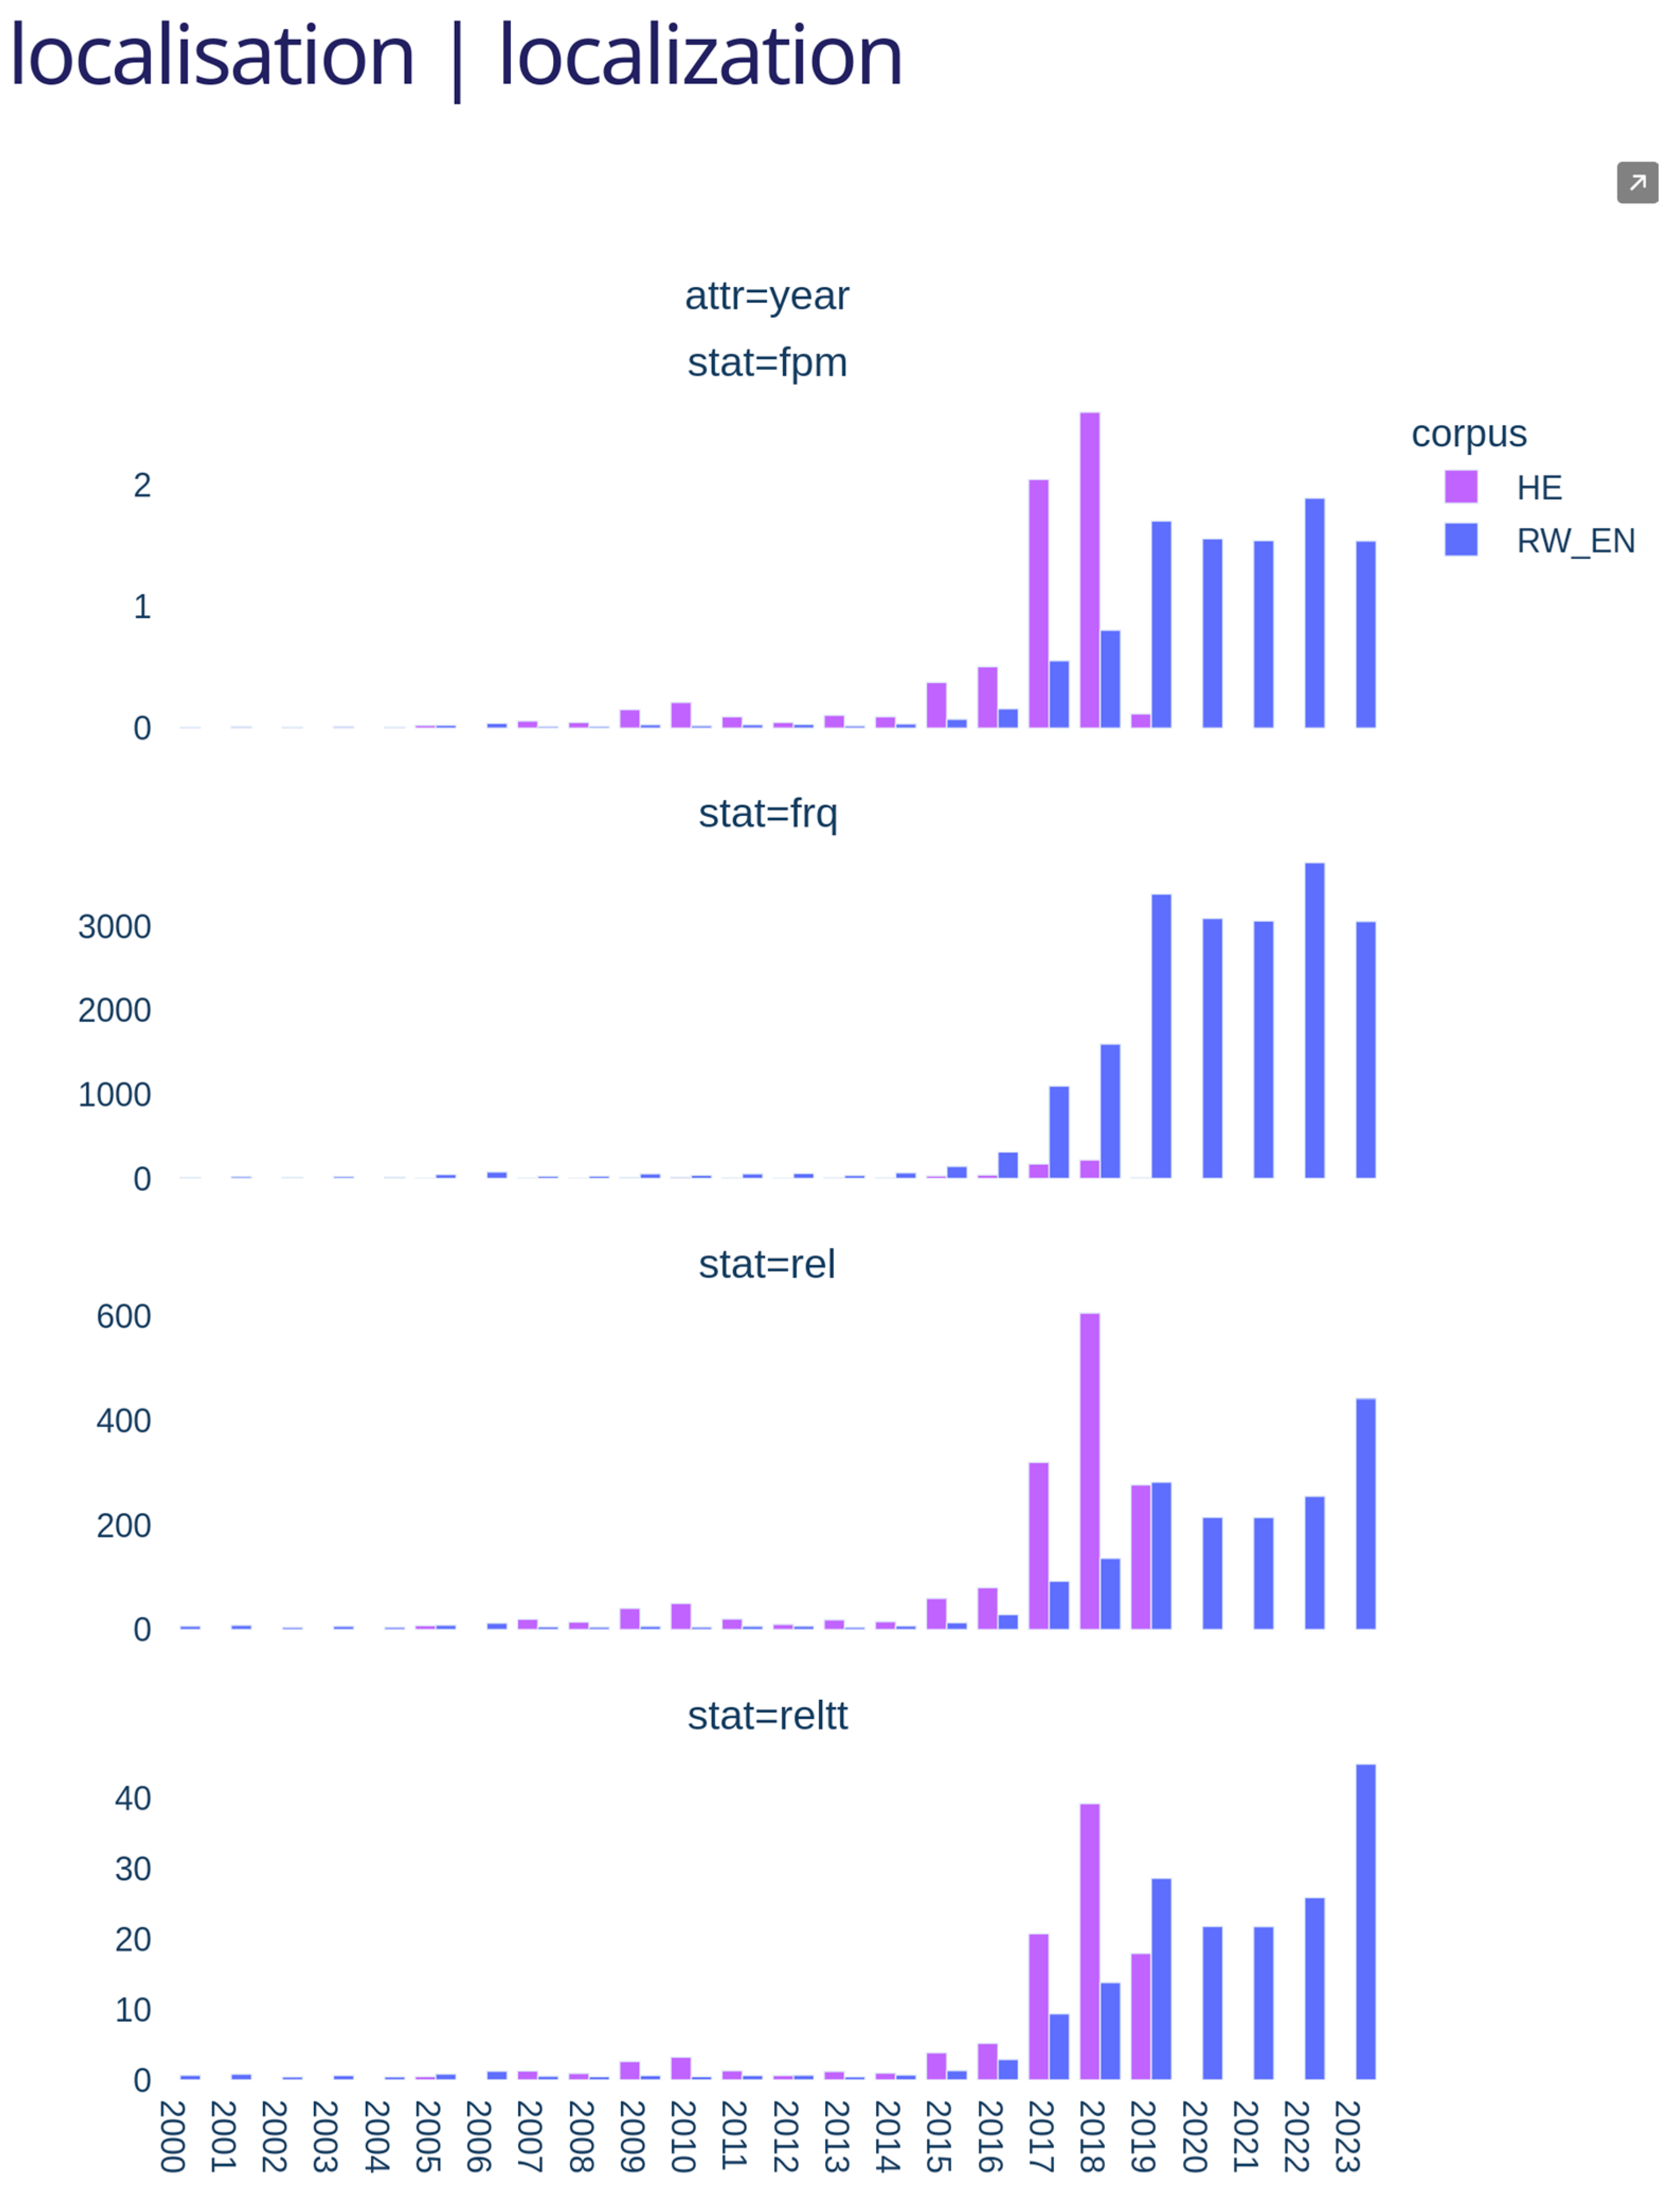
Table 2 reports summary statistics for the query, as displayed in Quartz. This offers supplementary information for each corpus, including the counts of attributes (how many year values exist). The absolute frequency in the corpus is included, along with the sum of occurrences for attribute values. These two numbers are identical if the attribute can only have a single value, as seen in Table 2, though the sum of attribute values can also exceed the total frequency when an attribute accepts multiple values (i.e., publication year is by definition one value, whereas in RW_EN, a document can have multiple contributing authors). Other SkE frequency measurements are given, either for the whole corpus or as means calculated from all attribute values. Figure 7 depicts the charts corresponding to these data, with the frequency statistics labeled as provided by the SkE API: FPM is frequency per million, FRQ is absolute frequency, REL is relative frequency (a percentage), and RELTT is relative text type frequency per million.
The increased usage of localization in absolute frequency is most visible with the RW_EN corpus (the second facet of Figure 7). The year 2016 experienced a small increase compared to previous years, followed by much larger increases from 2017 to 2019, with consistently high values thereafter. The HE corpus also shows an increase in 2016, although the Y-axis scale does not facilitate comparisons for HE values. The three other metrics exhibit the same upward pattern, with some small increases prior to 2016 and large ones in 2017 and thereafter (note that the 2019 value for the HE corpus represents incomplete data and should be disregarded). The upward trend shown in Figure 7 aligns with the hypothesis that the emergence of this term among humanitarians is associated with the 2016 WHS and ensuing Grand Bargain commitments on localization. Of course, this does not necessarily imply that the concept immediately enjoyed a consolidated, consensual definition, as shown later.
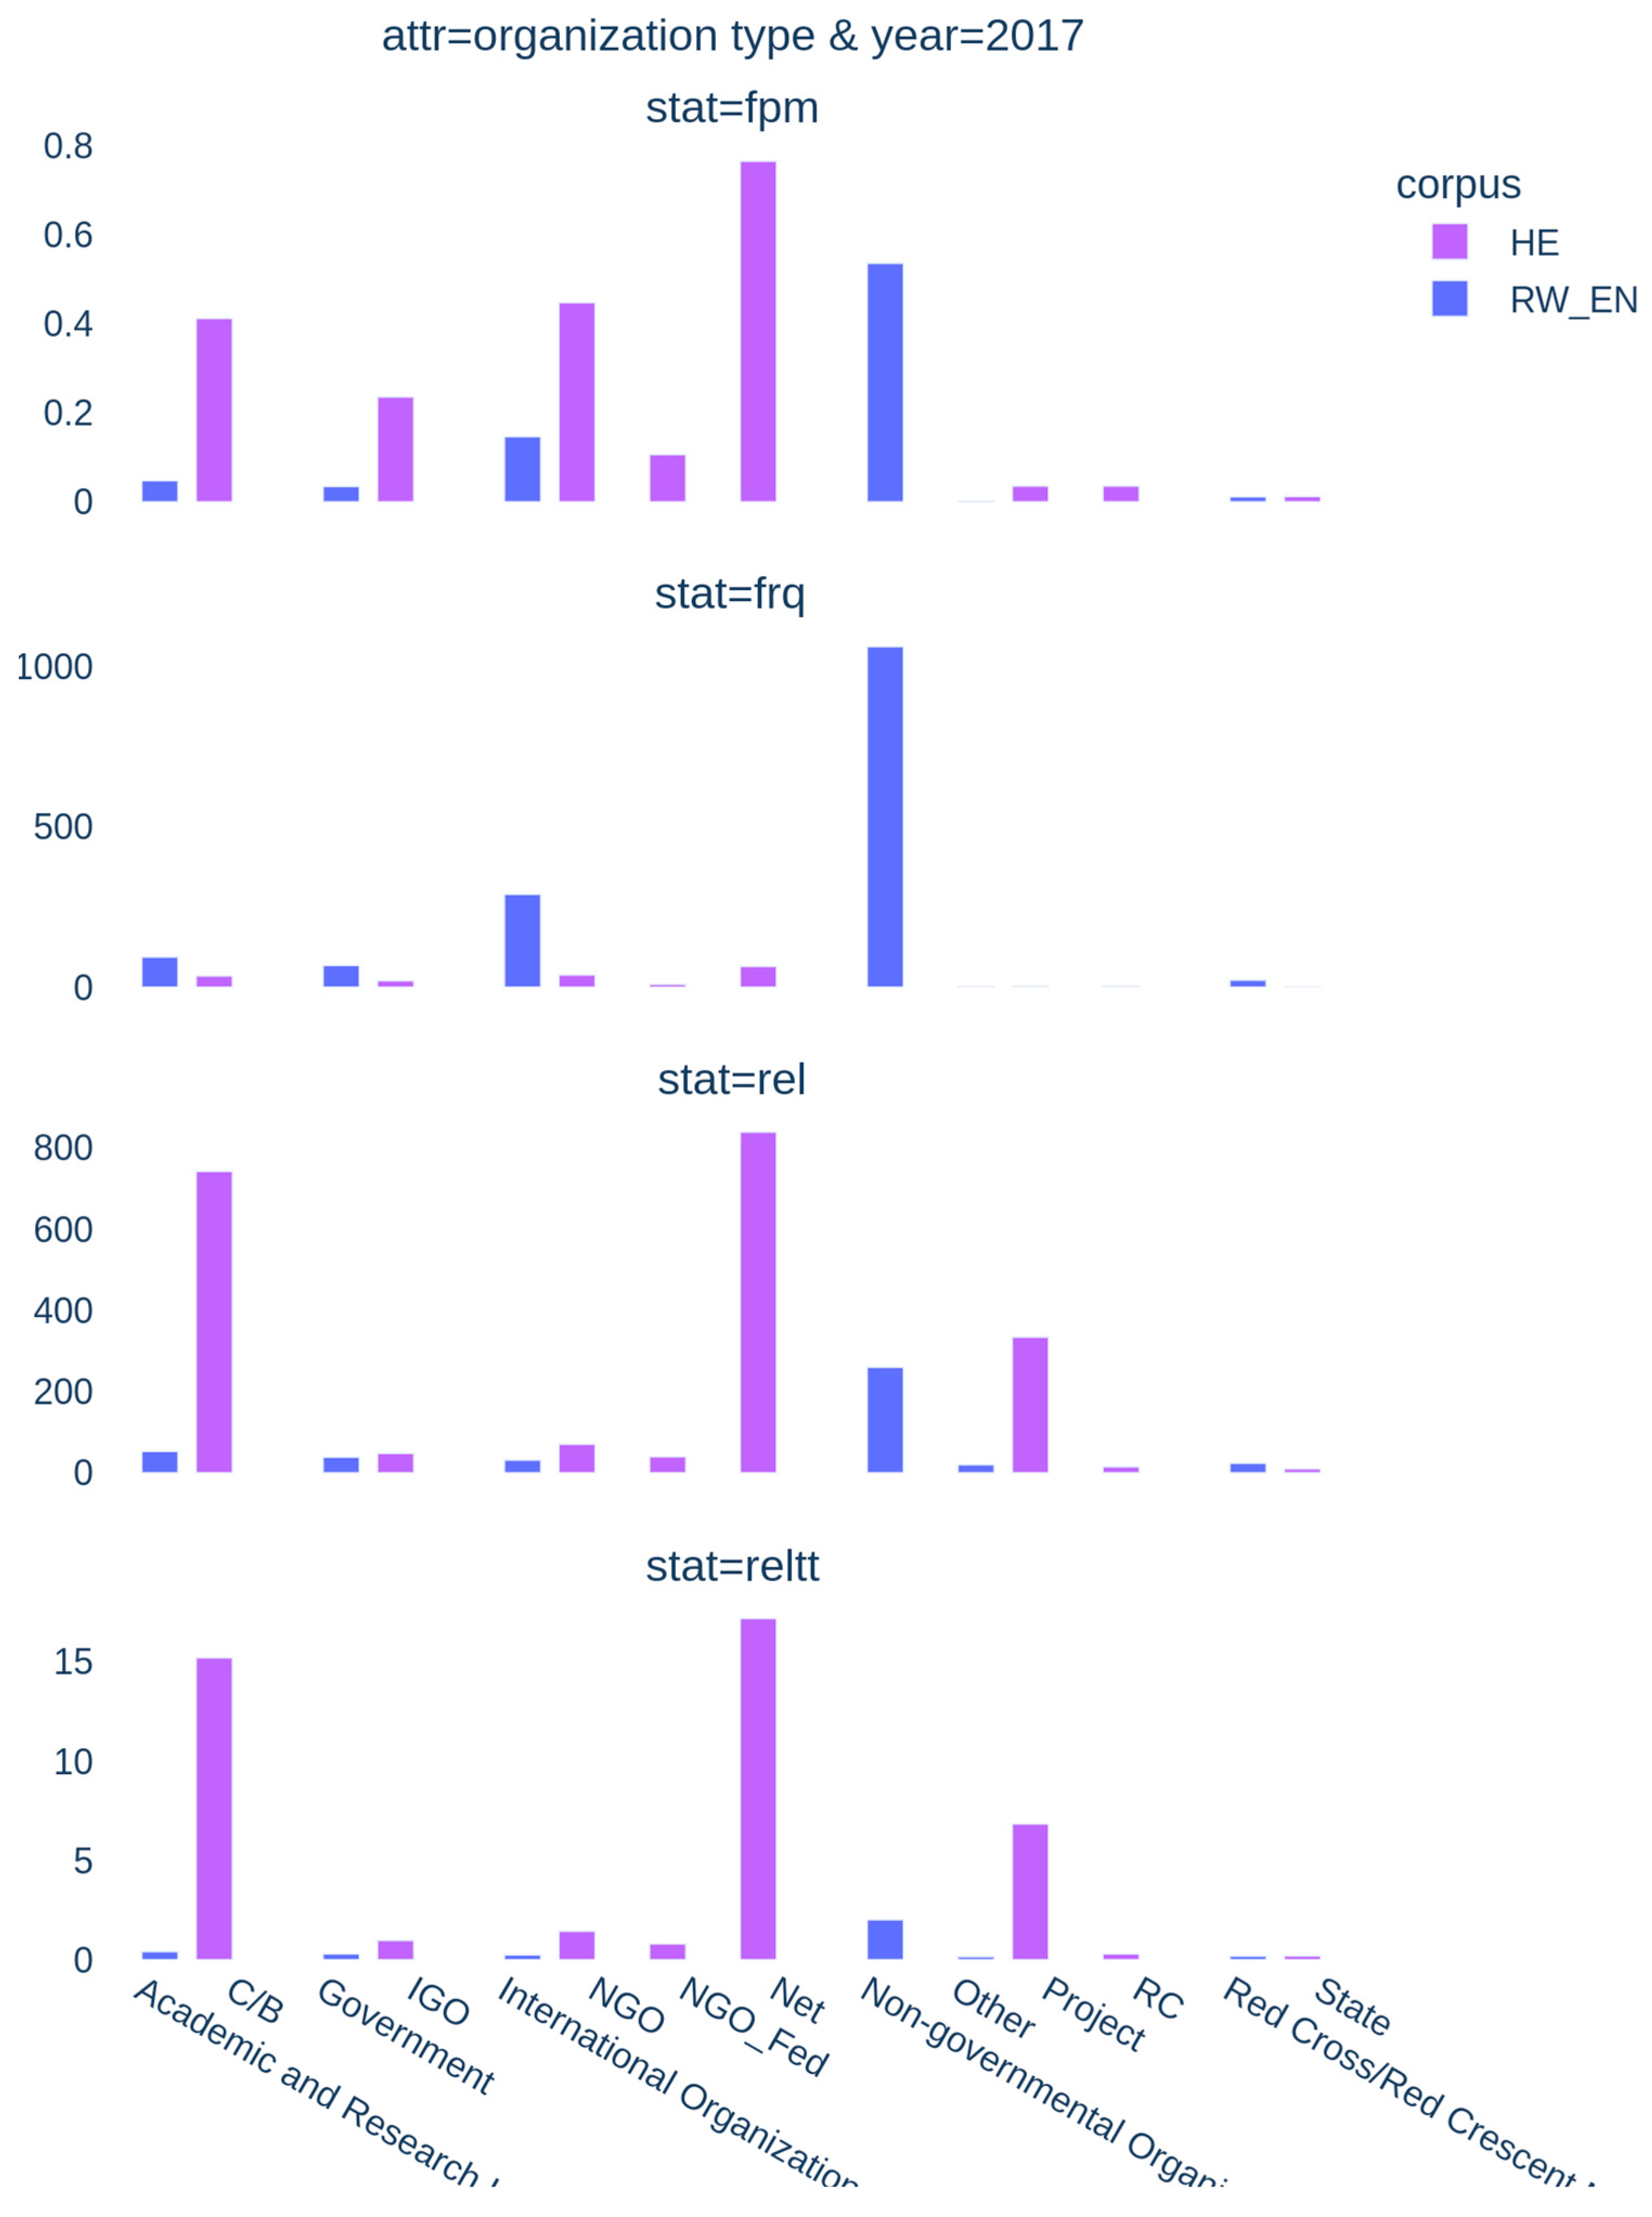
Figure 8 displays a cross-filter of frequencies for the query by organization type for 2017. Unlike Figure 7, where years share the same label, the organization type attribute values for the two corpora are not completely aligned: they were left unmodified, although categories can be considered comparable if not identical (e.g., RC in the ReliefWeb corpus aligns with Red Cross/Red Crescent in HE). The absolute frequency was highest for non-governmental organizations (NGOs) in RW_EN, followed by international organizations. Similarly, the absolute frequency was highest in HE for network organizations, followed by NGOs. The same rank orders are mostly reflected in the relative metrics, with the exception of two categories in the HE corpus. Regarding relative frequency, the term is also prominent in the corporations/business and project organization types.
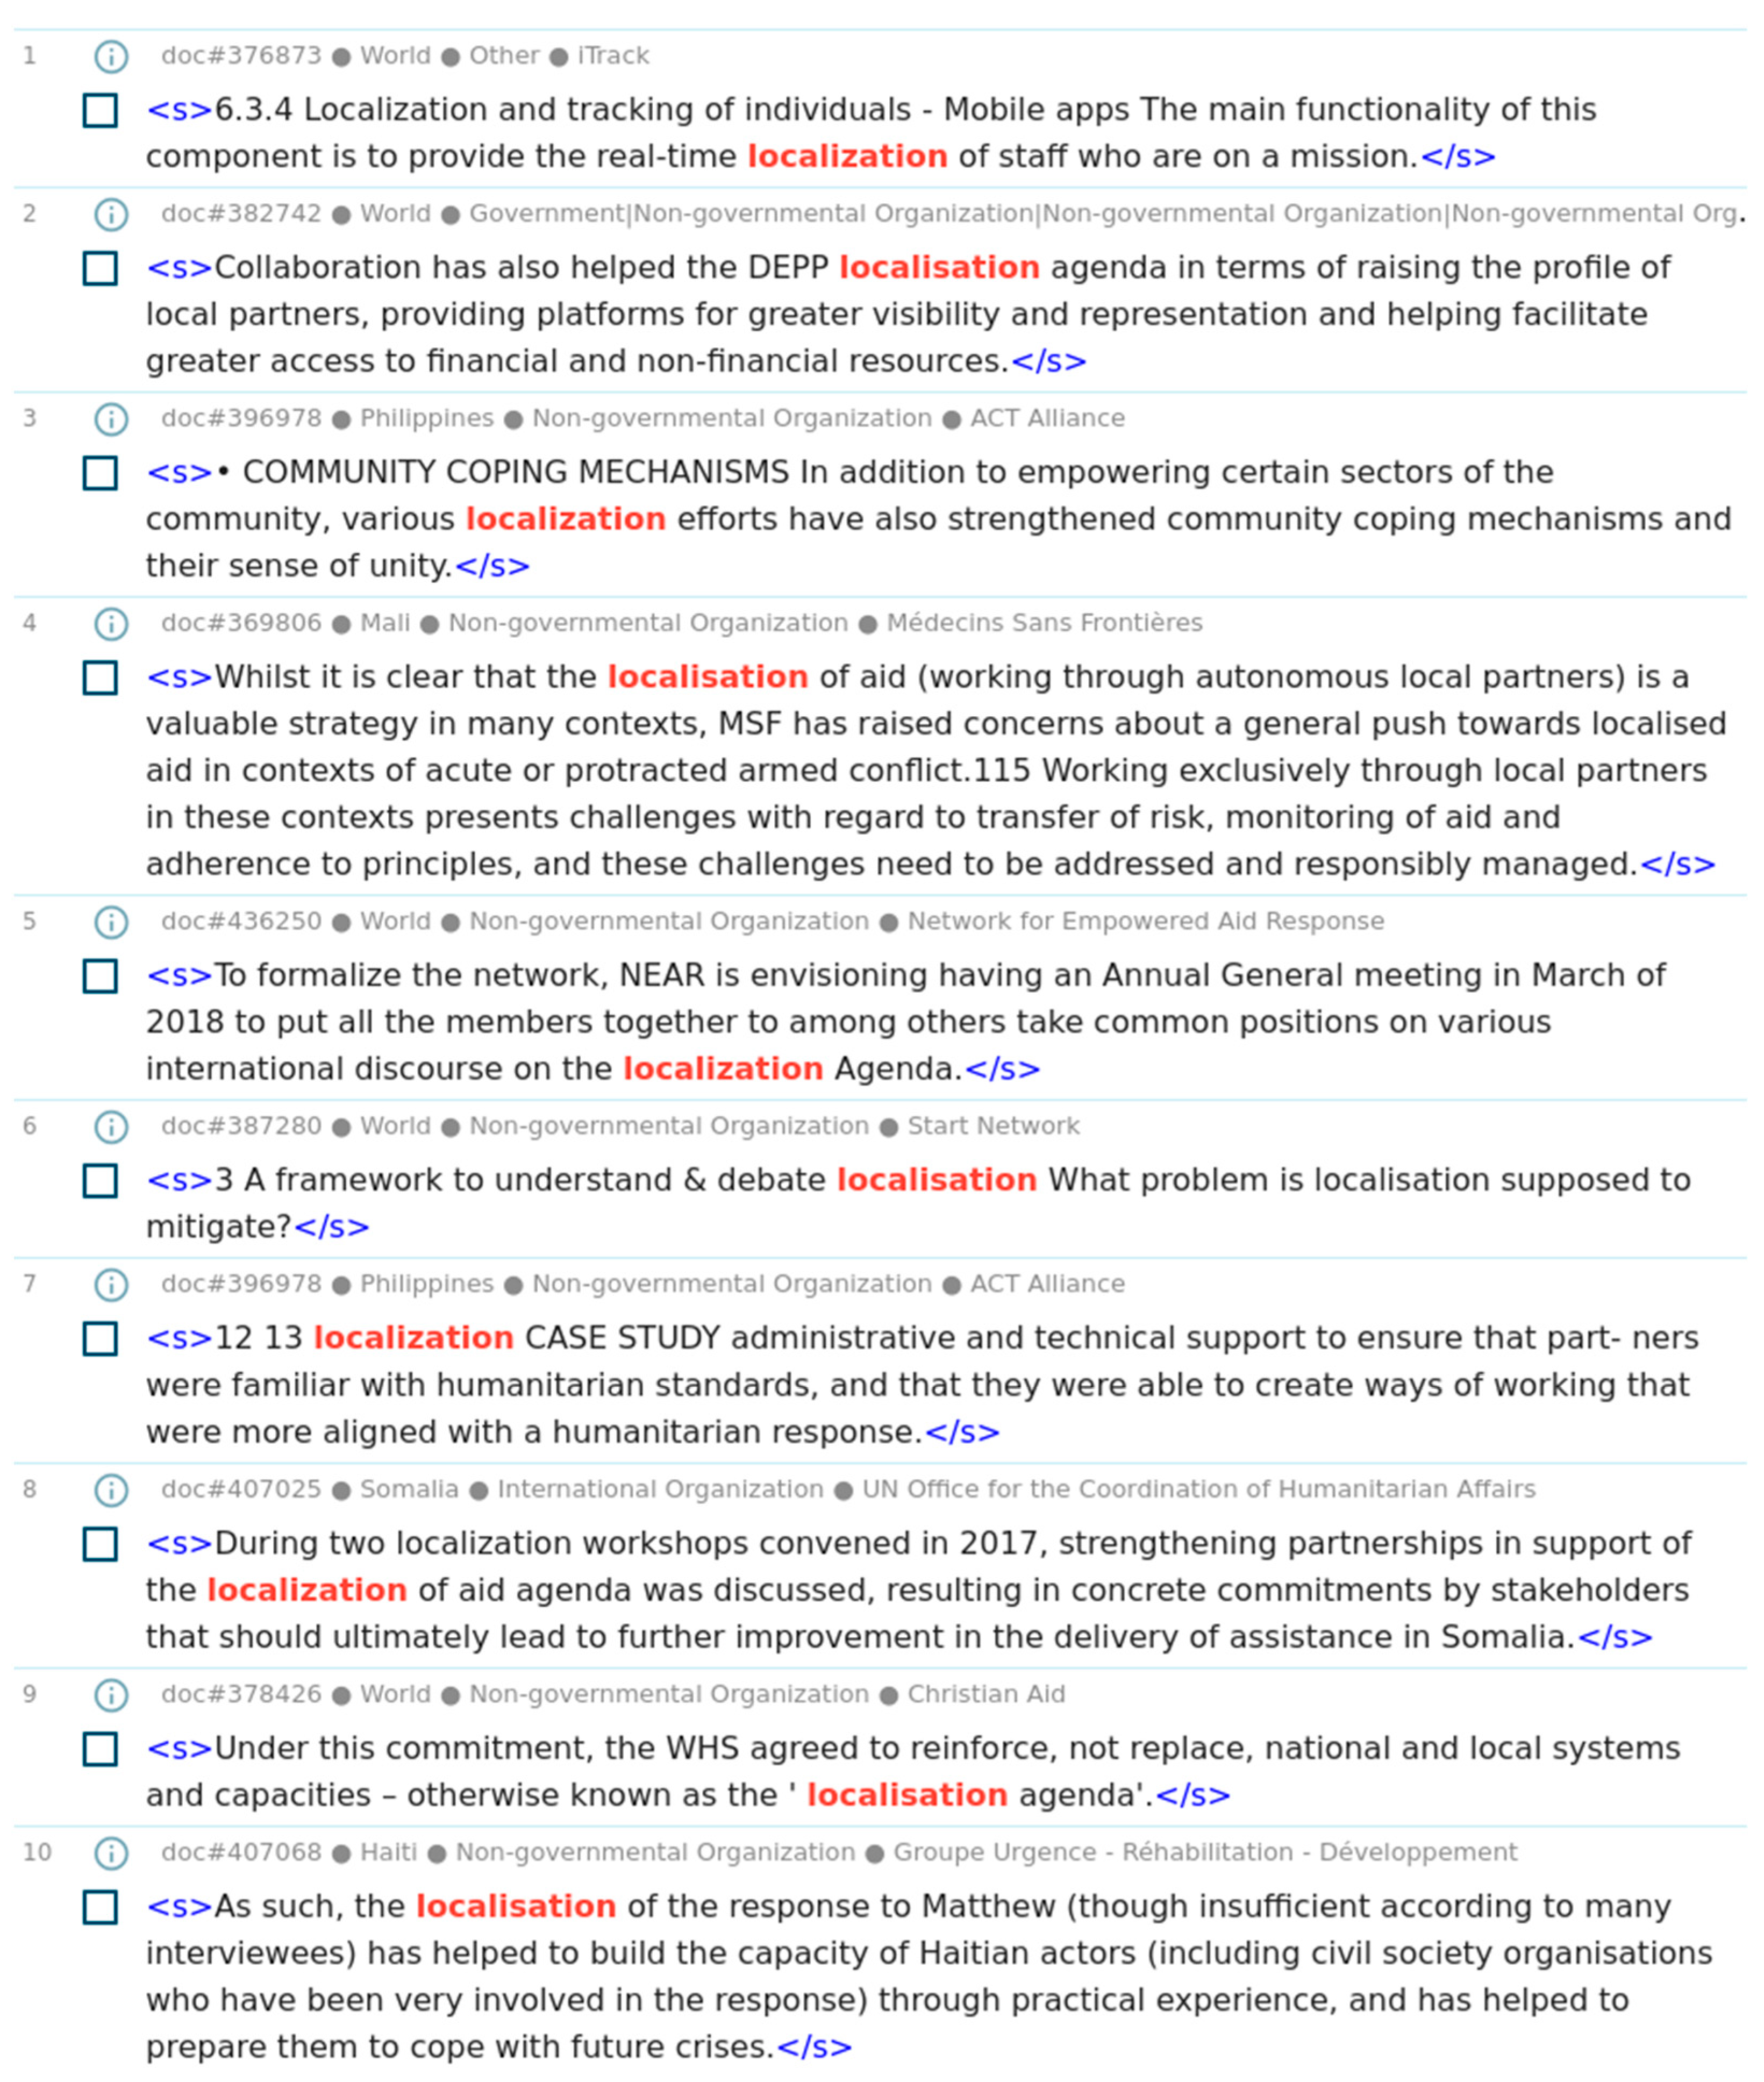
Figure 8 suggests that, in absolute frequency, NGOs and international organizations drove the increase in the use of localization in 2017. Nonetheless, a qualitative analysis based on concordances offers more insight. Figure 9 displays a random sample of 10 concordances from RW_EN for 2017, with additional metadata displayed above the line (docID, year, organization type, source name). Multiple contexts have localization modified by the noun agenda, amounting to a multiword term that appears in 7.2% of occurrences for localization (1445). Such concordances describe how the humanitarian community defines and views this agenda. Line 9, doc#378426, mentions the WHS, which should have close proximity to occurrences of localization given the stated hypothesis about the term’s origin in the domain. Line 5, doc#436250, explains how NEAR (a network of humanitarian organizations from the Global South) needs to take common positions to strengthen their influence on “international discourse on the localization Agenda.” This may suggest power is at stake in the discourse and debates surrounding localization. While not a definitive result, the sample provides useful empirical indications that the textual data being visualized by the app is highly relevant to questions of interest for conceptual analysis.
As well as being more frequent among NGOs, localization seems to be more controversial in this organization type than in international organizations: see the sample of extended concordances from RW_EN in Table 3. In contrast, international organizations focus on the positive consequences of localization, framing it as part of humanitarian strategies, commitments, and efforts; no controversial statements were found when applying a filter for this organization type. NGOs (Table 3 and the summarizing list below) regard localization as an ill-defined concept that is subject to different interpretations and that can worsen humanitarian aid delivery if badly managed.
  • “there is no single definition of localization”;
  • “localization has become the buzzword in 2017”;
  • “the localization agenda is a Pandora’s Box of issues”;
  • “not only is localisation a vague concept, it is also an ongoing and difficult debate”;
  • “there is not yet a globally accepted definition of aid localization”;
  • “the fundamental issue is between a technical or a political interpretation”;
  • “the ongoing debate over localisation is complicated by the multitude of different understandings of the concept”;
  • “could potentially create or worsen tensions between local and international actors”;
  • “‘localisation’ as ‘decentralisation’ actually turns into an incentive to accelerate the ‘multi-nationalisation’ of INGOs”;
  • “localization is counterproductive and likely to produce sub-optimal results for the effective delivery of aid to people in need of immediate relief” in armed conflicts”.
Subsequent analysis beyond this case study would require further investigation into the range of perspectives on localization by organization type (including cross-filtering by organization and geographical location) and any reporting on its implementation under various conditions. For example, contexts in Table 3 suggest that some organizations highlight the lack of definitional consensus, while others tend to focus on the adverse effects of localization or the ways in which it could be operationalized.

4. Discussion

A preliminary case study utilizing the web application Quartz was conducted for localization in two humanitarian domain corpora. Visualizations generated initial evidence relevant to the hypothesis that in the humanitarian world, the term emerged around 2016 in relation to the WHS that year. Disaggregated data exploration, such as cross-filtering, showed that increases in the usage of localization were predominantly driven by non-governmental and international organizations. The web application’s integration with a NoSkE server provided direct access to concordances, including a random sample with qualitative evidence about the nature of the discourse underlying quantitative frequencies. This offered an efficient means to conceptualize localization, including definitional elements (localization as an agenda), diachronic variation (trends correlating to the WHS), and examples of its contested nature.
The case study showed the practical relevance of some of the application template’s technical features. For example, displaying all types of frequency metrics in a faceted chart that included multiple corpora helped situate the term in the domain’s discourse. While localization has experienced increased usage in written texts, the frequency data alone do not prove that it has become more “important” or “central” to humanitarian discourse. A more detailed analysis, including further inspection of the makeup of the corpora over time, is needed to make robust claims. A multivariate dataset visualized with Quartz could also be exported in tabular format to perform further statistical analyses and modeling.
A more detailed examination of concordances could be orchestrated by refining a series of cross-filters. This approach would enhance the feasibility of conducting a more complete conceptual analysis (Chambó and León-Araúz 2023a) by making the data more manageable, since the qualitative analysis of tens of thousands of occurrences would be infeasible. Advanced visualizations can simplify the observation of variations and commonalities that would be outside of the scope of a single CMS window (i.e., requiring more operations for side-by-side comparison). Rather than extracting data to be visualized separately from the CMS, the data can be filtered during the visualization process, e.g., by year and organization type, while making concordances accessible via hyperlinks to the CMS.
The immediate goal of developing Quartz was to facilitate conceptual analyses for HE, which is one example of a project aided by computational terminology methods. Part of the necessity for this work might lie in the need for terminologists to adapt software with broad lexicographical purposes to their specific needs. While the software introduced here is designed to be as widely useful as possible to practitioners of corpus linguistics, for future work, it is necessary to also emphasize the technical challenges of working with terms in specialized domains. For the humanitarian community, having powerful yet accessible corpus linguistics visualization tools could be helpful, for example, in aiding humanitarian situation analysis and response; such work is considered a current need for humanitarian actors (Shamoug et al. 2023; Tamagnone et al. 2023).
Whether visualization tools and methods are primarily centralized or decentralized in the corpus linguistics community, open-source code and software designed for modification can reduce technological siloing. Quartz is an example of a configurable, open visualization tool that integrates with one type of popular corpus software. This is possible because SkE offers a full API schema, but in the future, a more complete visualization tool would accept data from multiple systems and thereby facilitate some degree of interoperability. Exporting and importing data between corpus software and visualization tools may always be necessary, but a more integrated approach could benefit data exploration and the scalability of a methodology.
A related discussion in corpus linguistics literature is the role and adoption of statistical methods (Larsson et al. 2022), which surely influences the design of corpus visualization tools. The tool shown here merely reports descriptive statistics, but more complex methods could be integrated. Automatically reporting the results of statistical tests, however, gives users an added responsibility to know whether a visualization is a genuine argument for the statistical validity of their hypotheses. This must be considered carefully given the possibilities for misapplying quantitative methods in corpus linguistics (Kilgarriff 2005; Koplenig 2019). As a visualization tool offers more automated features for quantitative data manipulation, the tension rises between visualization as an exploratory method and one of statistical confirmation.

5. Conclusions

The Quartz template web application for corpus visualization tasks was introduced with the immediate goal of facilitating the analysis of humanitarian concepts for the Humanitarian Encyclopedia, a collaborative platform that provides detailed entries focusing on humanitarian conceptual variation. A preliminary analysis of localization was presented for the humanitarian domain, focusing on temporal and organization type metadata in the Humanitarian Encyclopedia’s corpus and another of ReliefWeb reports. Frequency data from the corpora were visualized with Quartz, and a sample of concordances were provided as an initial inquiry into the fuzziness of localization and the challenges humanitarian organizations face with its implementation.
The software presented was designed to address current knowledge extraction challenges faced by humanitarian actors and researchers of the humanitarian domain. To do so, it provided an interface that integrates with Sketch Engine servers, executing API calls to extract data and present it with advanced visualization types, which aimed to address technical challenges with data visualization for corpus software. One goal was to merge the phases of data exploration and visualization, phases which can become separated when conducting specialized analyses that require prior data exportation. The described features addressed limitations previously encountered by analysts, such as comparing queries side by side via interactive charts and the ability to navigate to concordances for a selected data point by integrating with mature corpus software. The use of cross-filters, i.e., secondary visualizations generated by selecting data points in a primary visualization, made extensive corpus data more manageable and its qualitative analysis (in this case, conceptual analysis) more feasible.
More longstanding difficulties for data visualization in the field were also considered. In particular, one issue with advancing visualization features may be the lack of interoperability between the most-used corpus management software. The template web application was proposed as an independent modality for simplifying and encouraging the development of advanced visualization features. As an iterative process, this can be improved in the future by experimentation with other corpus software that provides an API. More interfaces and features can be provided, and the visualization development procedure can be standardized to lower the technical resources required to prototype and share novel visualization techniques.

Author Contributions

Conceptualization, L.I., A.O. and P.L.-A.; methodology, L.I. and A.O.; software, L.I.; validation, P.L.-A.; formal analysis, L.I., A.O. and P.L.-A.; investigation, L.I., A.O. and P.L.-A.; resources, L.I., A.O. and P.L.-A.; data curation, L.I, A.O. and P.L.-A.; writing—original draft preparation, L.I., A.O. and P.L.-A.; writing—review and editing, L.I., A.O. and P.L.-A.; visualization, L.I.; supervision, P.L.-A.; project administration, L.I.; funding acquisition, P.L.-A. and A.O. All authors have read and agreed to the published version of the manuscript.

Funding

This research was funded by the Regional Government of Andalusia (Spain) as part of project PROYEXCEL_00369 (VariTermiHum).

Institutional Review Board Statement

Not applicable.

Informed Consent Statement

Not applicable.

Data Availability Statement

The software presented here is available under a GPL3+ license. Please contact the authors regarding the accessibility of compiled ReliefWeb English and Humanitarian Encyclopedia corpora. ReliefWeb corpora can be produced independently with the methodology described in Isaacs (2023).

Acknowledgments

This research was conducted as part of the Humanitarian Encyclopedia project at the Geneva Centre of Humanitarian Studies.

Conflicts of Interest

The authors declare no conflicts of interest.

Correction Statement

This article has been republished with a minor correction to the correspondence contact information. This change does not affect the scientific content of the article.

Notes

1
https://github.com/engisalor/quartz, accessed on 9 December 2023.
2
https://humanitarianencyclopedia.org, accessed on 9 December 2023.

References

  1. Anthony, Laurence. 2018. Visualization in corpus-based discourse studies. In Corpus Approaches to Discourse: A Critical Review. Edited by Charlotte Taylor and Anna Marchi. London: Routledge, pp. 197–224. [Google Scholar]
  2. Anthony, Laurence. 2022. What can corpus software do? In The Routledge Handbook of Corpus Linguistics, 2nd ed. Edited by Anne O’Keeffe and Michael J. McCarthy. London: Routledge, pp. 103–125. [Google Scholar]
  3. Anthony, Laurence. 2023. AntConc (4.2.4) [Computer Software]. Waseda University. Available online: https://www.laurenceanthony.net/software/antconc/ (accessed on 19 February 2024).
  4. Anthony, Laurence, and Stefan Evert. 2019. Embracing the concept of data interoperability in corpus tools development. Paper presented at the Corpus Linguistics 2019 Conference, Cardiff, UK, July 23–27. [Google Scholar]
  5. Barbelet, Veronique, Gemma Davies, Josie Flint, and Eleanor Davey. 2021. Interrogating the Evidence Base on Humanitarian Localisation: A Literature Study. HPG Literature Review. London: ODI. [Google Scholar]
  6. Brezina, Vaclav, and William Platt. 2023. #LancsBox X (3.0.0) [Computer Software]. Lancaster University. Available online: https://lancsbox.lancs.ac.uk/ (accessed on 19 February 2024).
  7. Caple, Helen, Laurence Anthony, and Monika Bednarek. 2019. Kaleidographic: A data visualization tool. International Journal of Corpus Linguistics 24: 245–61. [Google Scholar] [CrossRef]
  8. Chambó, Santiago, and Pilar León-Araúz. 2021. Visualising lexical data for a corpus-driven encyclopaedia. Paper presented at the 2021 Electronic Lexicography in the 21st Century Conference (eLex 2021), virtual, July 5–7; pp. 29–55. [Google Scholar]
  9. Chambó, Santiago, and Pilar León-Araúz. 2023a. Corpus-driven conceptual analysis of epidemic and coronavirus for the Humanitarian Encyclopedia: A case study. Terminology 29: 180–223. [Google Scholar] [CrossRef]
  10. Chambó, Santiago, and Pilar León-Araúz. 2023b. Operationalising and representing conceptual variation for a corpus-driven encyclopaedia. Paper presented at the 2023 Electronic Lexicography in the 21st Century conference (eLex 2023), Brno, Czech Republic, June 27–29; pp. 587–612. [Google Scholar]
  11. Davies, Mark. 2020. English-Corpora.org: A Guided Tour. Available online: https://www.english-corpora.org/pdf/english-corpora.pdf (accessed on 19 February 2024).
  12. Fabre, Cyprien, and Manu Gupta. 2017. Localising the Response: Putting Policy into Practice. The Commitments into Action Series; Paris: OECD, World Humanitarian Summit. [Google Scholar]
  13. Gries, Stefan Th. 2022. How to use statistics in quantitative corpus analysis. In The Routledge Handbook of Corpus Linguistics, 2nd ed. Edited by Anne O’Keeffe and Michael J. McCarthy. London: Routledge, pp. 168–81. [Google Scholar]
  14. Isaacs, Loryn. 2022. Sketch Grammar Explorer (v0.5.5) [Computer Software]. Zenodo. Available online: https://zenodo.org/records/6812335 (accessed on 9 December 2023).
  15. Isaacs, Loryn. 2023. Humanitarian reports on ReliefWeb as a domain-specific corpus. Paper presented at the 2023 Electronic Lexicography in the 21st Century conference (eLex 2023), Brno, Czech Republic, June 27–29; pp. 248–69. [Google Scholar]
  16. Isaacs, Loryn, and Pilar León-Araúz. 2023. Aggregating and visualizing collocation data for humanitarian concepts. Paper presented at the 2nd International Conference on Multilingual Digital Terminology Today (MDTT 2023), Lisbon, Portugal, June 29–30. [Google Scholar]
  17. Jakubíček, Miloš, Adam Kilgarriff, Diana McCarthy, and Pavel Rychlý. 2010. Fast syntactic searching in very large corpora for many languages. Paper presented at the 24th Pacific Asia Conference on Language, Information and Computation (PACLIC 2010), Sendai, Japan, November 4–7; pp. 741–47. [Google Scholar]
  18. Kilgarriff, Adam. 2005. Language is never, ever, ever, random. Corpus Linguistics and Linguistic Theory 1: 263–76. [Google Scholar] [CrossRef]
  19. Kilgarriff, Adam, Vít Baisa, Jan Bušta, Miloš Jakubíček, Vojtěch Kovář, Jan Michelfeit, Pavel Rychlý, and Vít Suchomel. 2014. The Sketch Engine: Ten years on. Lexicography 1: 7–36. [Google Scholar] [CrossRef]
  20. Koplenig, Alexander. 2019. Against statistical significance testing in corpus linguistics. Corpus Linguistics and Linguistic Theory 15: 321–46. [Google Scholar] [CrossRef]
  21. Larsson, Tove, Jesse Egbert, and Douglas Biber. 2022. On the status of statistical reporting versus linguistic description in corpus linguistics: A ten-year perspective. Corpora 17: 137–57. [Google Scholar] [CrossRef]
  22. Luz, Saturnino, and Shane Sheehan. 2020. Methods and visualization tools for the analysis of medical, political and scientific concepts in Genealogies of Knowledge. Palgrave Communications 6: 1–20. [Google Scholar] [CrossRef]
  23. National Laboratory for Digital Heritage, Eötvös Loránd University Department of Digital Humanities. 2023. NoSketch Engine Docker (5.0.0) [Computer Software]. Available online: https://github.com/ELTE-DH/NoSketch-Engine-Docker (accessed on 19 February 2024).
  24. Rayson, Paul. 2018. Increasing interoperability for embedding corpus annotation pipelines in Wmatrix and other corpus retrieval tools. Paper presented at the LREC 2018 Workshop: 6th Workshop on the Challenges in the Management of Large Corpora, Miyazaki, Japan, May 7; pp. 33–36. [Google Scholar]
  25. Rayson, Paul, John Mariani, Bryce Anderson-Cooper, Alistair Baron, David Gullick, Andrew Moore, and Steve Wattam. 2016. Towards interactive multidimensional visualisations for corpus linguistics. Journal for Language Technology and Computational Linguistics 31: 27–49. [Google Scholar] [CrossRef]
  26. Roepstorff, Kristina. 2020. A call for critical reflection on the localisation agenda in humanitarian action. Third World Quarterly 41: 284–301. [Google Scholar] [CrossRef]
  27. Rychlỳ, Pavel. 2007. Manatee/Bonito—A modular corpus manager. Paper presented at the First Workshop on Recent Advances in Slavonic Natural Language Processing (RASLAN 2007), Brno, Czech Republic, December 14–16; pp. 65–70. [Google Scholar]
  28. Säily, Tanja, and Jukka Suomela. 2017. types2: Exploring word-frequency differences in corpora. In Studies in Variation, Contacts and Change in English 19. Edited by Turo Hiltunen, Joe McVeigh and Tanja Säily. Helsinki: VARIENG, vol. 19. [Google Scholar]
  29. Shamoug, Aladdin, Stephen Cranefield, and Grant Dick. 2023. SEmHuS: A semantically embedded humanitarian space. Journal of International Humanitarian Action 8: 3. [Google Scholar] [CrossRef] [PubMed]
  30. Tamagnone, Nicolò, Selim Fekih, Ximena Contla, Nayid Orozco, and Navid Rekabsaz. 2023. Leveraging domain knowledge for inclusive and bias-aware humanitarian response entry classification. Paper presented at the Thirty-Second International Joint Conference on Artificial Intelligence (IJCAI 2023), Macau, China, August 19–25; pp. 6219–27. [Google Scholar] [CrossRef]
Figure 1. Integrated bar chart for text types in Sketch Engine.
Languages 09 00081 g001
Figure 2. Bar chart with tabs for text types using Tableau.
Languages 09 00081 g002
Figure 3. Pilot web application with Plotly (Isaacs and León-Araúz 2023, p. 5).
Languages 09 00081 g003
Figure 4. HE Dashboard interface.
Languages 09 00081 g004
Figure 5. Settings window.
Languages 09 00081 g005
Figure 6. Comparing two queries with cross-filters.
Languages 09 00081 g006
Figure 7. Frequency statistics by year.
Languages 09 00081 g007
Figure 8. Frequency statistics by organization type in 2017.
Languages 09 00081 g008
Figure 9. Random concordances from RW_EN for 2017. The search term appears in red, sentence boundaries are in blue, and metadata are listed at the top of each item in gray.
Languages 09 00081 g009
Table 1. Configuration file (YAML file format).
he19:
  name: HE
  color: “#AB63FA”
  comparable:
   - class.DATE
   - class.TYPE
   - class.ORGANIZATION_TYPE
  label:
   class.DATE: year
   class.ID: id
   class.ORGANIZATION_SUBTYPE: organization subtype
   class.ORGANIZATION_TYPE: organization type
   class.REGION: publication region
   class.TYPE: format
  exclude:
   - doc.filename
   - doc.wordcount
   - doc.id
Table 2. Summary statistics for the query localisation|localization.
RW_ENHEStatistic
2414Attributes (count of year values)
20,125551Corpus absolute frequency
20,125551Sum of attribute frequency
10.156.49Corpus FPM
74.17110.13Mean relative frequency %
7.537.14Mean relative text type FPM
0.420.46Mean FPM
838.5439.36Mean absolute frequency
Table 3. Contexts with localization filtered by year (2017) and organization type (NGOs).
There is no single definition of ‘localisation’ but for the purpose of this research, it refers to a series of measures which different constituent parts of the international humanitarian system should adopt in order to re-balance the system more in favour of national actors, so that a re-calibrated system works to the relevant strengths of its constituent parts and enhances partnership approaches to humanitarian action.Catholic Agency for Overseas Development
The term ‘localisation’ has become the buzzword of 2017, a subject that has taken on a new dimension due to the commitments made as part of the Grand Bargain agreed at the World Humanitarian Summit in May 2016.Trócaire—Groupe Urgence
The research found that the localisation ‘agenda’ is a Pandora’s Box of issues linked to the political economy of aid and North/South relations. If badly managed, it could potentially create or worsen tensions between local and international actors.Trócaire—Groupe Urgence
The fundamental issue is between a technical or a political interpretation of ‘localisation’. A technical interpretation puts the emphasis on ‘proximity’ to the crisis-area. If international agencies and their decision-making can ‘decentralise’, then localisation will have been achieved. The political interpretation sees it as a ‘shifting the power’, from international to national actors. Problematically, the discussions and working groups on different aspects of ‘localisation’ are currently all concentrated in Western capitals like Geneva, New York and London. There is very little participation and input from ‘national’ actors.All India Disaster Mitigation Institute
‘Transformers’ are concerned that ‘localisation’ as ‘decentralisation’ actually turns into an incentive to accelerate the ‘multi-nationalisation’ of INGOs: creating more and more ‘national’ offices and national ‘affiliates’, that sooner or later will also compete in fundraising from the domestic market.Start Network
Within the TSC Project there were differing opinions as to what constituted localisation reflecting the Start Network’s own research that “not only is localisation a vague concept, it is also an ongoing and difficult debate”Start Network
While MSF has seen many examples of the important humanitarian contributions that national and local actors make, it has also witnessed a number of constraints and challenges that confront these actors when delivering humanitarian assistance, especially in situations of armed conflict. These limitations, which have been largely ignored by the localisation agenda, are examined from both a conceptual and practical point of view in: Schenkenberg, E. 2016.Médecins sans Frontières
There is not yet a globally accepted definition of aid localization. To frame the discussion around the different components of this concept, the following common definition emerged: Aid localisation is a collective process involving different stakeholders that aims to return local actors, whether civil society organisations or local public institutions, to the centre of the humanitarian system with a greater role in humanitarian response.Trócaire—Groupe Urgence
However, until now localisation had not been afforded a broad definition, whilst international agreements focused only on financial targets. The new framework published today takes a deeper and more critical view of localisation, looking at the quality (not just the quantity) of funding, partnerships and participation, capacity development, and the influence of local and national organisations.Start Network
For example, Médecins Sans Frontières (MSF) argues that localisation is counterproductive and “likely to produce sub-optimal results for the effective delivery of aid to people in need of immediate relief” in armed conflicts. The main argument is that local and national NGOs would not be able to deliver impartial humanitarian aid to conflict-affected populations.ActionAid
The ongoing debate over localisation is complicated by the multitude of different understandings of the concept. This plurality is the result of several factors, namely the vagueness of the concept, a lack of clarity regarding the problem it is supposed to mitigate, and sometimes even institutional interest.Start Network
Disclaimer/Publisher’s Note: The statements, opinions and data contained in all publications are solely those of the individual author(s) and contributor(s) and not of MDPI and/or the editor(s). MDPI and/or the editor(s) disclaim responsibility for any injury to people or property resulting from any ideas, methods, instructions or products referred to in the content.