Article

Utterance-Final Voice Quality in American English and Mexican Spanish Bilinguals

by
Claudia Duarte-Borquez
,
Maxine Van Doren
and
Marc Garellek
*
Department of Linguistics, UC San Diego, San Diego, CA 92093-0108, USA
*
Author to whom correspondence should be addressed.
Languages 2024, 9(3), 70; https://doi.org/10.3390/languages9030070
Submission received: 13 September 2023 / Revised: 1 February 2024 / Accepted: 4 February 2024 / Published: 21 February 2024
(This article belongs to the Special Issue Prosody in Shared Linguistic Spaces of the Spanish-Speaking World)

Abstract

:
We investigate utterance-final voice quality in bilinguals of English and Spanish, two languages which differ in the type of non-modal voice usually encountered at ends of utterances: American English often has phrase-final creak, whereas in Mexican Spanish, phrase-final voiced sounds are breathy or even devoiced. Twenty-one bilinguals from the San Diego-Tijuana border region were recorded (with electroglottography and audio) reading passages in English and Spanish. Ends of utterances were coded for their visual voice quality as “modal” (having no aspiration noise or voicing irregularity), “breathy” (having aspiration noise), “creaky” (having voicing irregularity), or “breathy-creaky” (having both aspiration noise and voicing irregularity). In utterance-final position, speakers showed more frequent use of both modal and creaky voice when speaking in English, and more frequent use of breathy and breathy-creaky voice when speaking in Spanish. We find no role of language dominance on the rates of these four voice qualities. The electroglottographic and acoustic analyses show that all voice qualities, even utterance-final creak, are produced with increased glottal spreading; the combination of distinct noise measures and amplitude of voicing can distinguish breathy, creaky, and breathy-creaky voice qualities from one another, and from modal voice.

1. Introduction

The ends of phrases and utterances, before the speaker takes a breath, are associated with many changes in phonation. For example, f0 declination, pitch lowering over the course of an utterance (or utterance-medial phrase), is commonly observed across languages (Ladd 2001). Here we focus on another type of change in phonation that commonly occurs utterance-finally—a change in the quality of phonation. The subject of this paper is on changes in voice quality and vocal fold vibratory patterns that occur as voicing nears its close. We address this subject among bilingual speakers of American English and Mexican Spanish who live in the San Diego-Tijuana border area between the United States and Mexico.
Changes in voice quality at the end of an utterance are attested in many languages. The reader is likely to be familiar with “phrase-final creak”, also called “vocal fry” (especially in the singing pedagogy and clinical voice literature) among other names (Garellek 2022). Phrase-final creak refers to ends of phrases, especially utterances (Redi and Shattuck-Hufnagel 2001), that are produced with creaky voice or with creak so irregular that the “quasi-”periodic vibration assumed for voicing is called into question. Phrase-final creak is common across varieties of English, but is also attested in other languages, including Spanish (Garellek 2022; González et al. 2022).
Ends of phrases and (particularly) utterances can also be produced with breathy voice or with so much vocal fold spreading that voiceless breath (Esling et al. 2019; Laver 1980) occurs. To draw an explicit parallel with phrase-final creak, here we refer to this voice quality as “phrase-final breath”. Spanish is one such language that exhibits this pattern, as voiced sounds typically undergo gradient aspiration (breathiness and devoicing) utterance-finally. For instance, in his narrow phonetic transcription of the North Wind and the Sun passage recorded for the Illustration of the IPA for Mexico City Spanish, Avelino (2018) transcribes half of immediately phrase-final vowels (i.e., those not followed by a coda) as voiceless or deleted. He also documents a single case of a creaky phrase-final vowel, which implies to us that both phrase-final creak and phrase-final breath occur, even if the latter is more common.
Research on bilingual speech production has shown that bilingual speakers generally produce language-specific speech patterns, if still somewhat different from those of their monolingual peers (Sundara et al. 2006). Previous research has also shown that language dominance plays an important role in accounting for bilingual speakers’ production patterns (Olson 2013; Piccinini and Arvaniti 2019; Simonet 2010). This is because bilingual speakers must activate and suppress their languages depending on context (Green 1998), and the degree to which this occurs depends in large part on their language dominance (Piccinini 2016). In this paper, we describe utterance-final changes in voice quality among bilingual speakers of English and Spanish, and explore the roles of dominance and language mode in structuring the variation in voice quality that we find. If phrase-final creak is a feature of American English, and phrase-final breath a feature of Mexican Spanish, then we predict that bilingual speakers of these languages should use more creak in English and more breath in Spanish. We also expect that more English-dominant speakers will use more creak in their Spanish, due to the influence from their more dominant language.

1.1. Phrase-Final Breath and Phrase-Final Creak

Although we define the phenomenon “phrase-final breath” for the first time here, it is widely documented, if not analyzed explicitly. We assume that phrase-final breath is likely to be particularly common utterance-finally—more so than at ends of utterance-medial phrases—because utterances are followed by respiratory inspiration (the intake of breath), for which the vocal folds spread widely. Therefore, coarticulation with an upcoming intake of breath could be considered the source of utterance-final breath.
Characteristics of phrase-final breath include breathy-to-voiceless productions of voiced sounds, including sonorant consonants and vowels. Crucially for our study, these patterns are attested in Mexican Spanish (Avelino 2018; Dabkowski 2018), but phrase-final breath is found across other varieties of Spanish, such as Salvadoran Spanish (Salgado 2023). The characteristics of phrase-final breath have also been documented in Peninsular Spanish since at least Navarro Tomás (1918), who describes partial or near full devoicing in prepausal position of [n] (§111, p. 86), [l] (§114, p. 89), a lenited variant of the rhotic in coda position which he calls the ‘R fricativa’ (§116, p. 92), as well as [ð]; with respect to the latter, he writes (§104, p. 79): “La d final absoluta, seguida de pausa se pronuncia particularmente debil y relajada [...] las vibraciones laringeas cesan casi al mismo tiempo que se forma el contacto linguodental, y además, la corriente espirada, preparando la pausa siguiente, suele ser tan tenue que de hecho la articulación resulta casi muda”.1
In contrast to the more limited work on phrase-final breath, phrase-final creak has been studied in detail, particularly for English; see recent discussions by Dallaston and Docherty (2020); Davidson (2020); and Garellek (2022). Creak, though commonly discussed in English, is also increasingly found in Spanish. For example, González et al. (2022) analyzed the occurrence of creaky voice in 10 speakers from a variety of Spanish-speaking countries (Argentina, Bolivia, Colombia, Cuba, Peru, Puerto Rico, Spain, and Venezuela), and found that creaky voice was pervasive in word-final position. They also found that creak was more common among men than women, and with low vowels. Bolyanatz (2023) investigated the use of creaky voice in interview speech among 18 speakers of Chilean Spanish, and argued that 40% of highly creaky utterances are used for discourse-related purposes such as signaling conversational turns or uncertainty.
In utterance-final position, creak is phonetically expected: the end of an utterance has low subglottal pressure (Ladefoged and McKinney 1963), and this makes voicing harder to sustain, leading to irregular vibrations and a creaky quality. Additionally, ends of utterances are often low in pitch, and speakers may produce creaky voice as a means of achieving a low pitch (Garellek et al. 2013). Therefore, utterance-final creak can reflect an unintended byproduct of voicing instability, or it can be an intended target used to produce a low pitch. Additionally, it is also clear that, at least in some varieties of English, creak is used to convey various kinds of social-indexical meaning, especially those surrounding gender, sexual orientation, and region (Becker et al. 2022; Eckert and Podesva 2021; Lang 2023; Podesva and Callier 2015).
It is important to stress here that, while creaky voice is typically characterized by increased glottal (and laryngeal) constriction (Esling et al. 2019; Garellek 2022), very low and/or irregular f0 can alone cue creak, whereas increased glottal constriction alone is unlikely to do so (Keating et al. 2015, 2023). Additionally, we know from research by Slifka (2000, 2006) that utterance-final creak in English can be produced with increased glottal spreading rather than constriction. Most recently, Keating et al. (2023) call this subtype of creaky voice “spread-glottis creak”. The upshot is that increased glottal constriction is neither necessary nor sufficient for the realization of creaky voice quality, and utterance-final creak need not be constricted. When utterance-final creak is spread-glottis, it shows acoustic correlates of both breathiness (i.e., aspiration noise) as well as creak (i.e., voicing irregularity).
Thus, whether an utterance ends in creak, breath, or both will depend on a variety of factors. The presence of an upcoming breath means that the ends of utterances will always have a low subglottal pressure, which favors irregular voicing and thus creak. However, if a speaker initiates vocal fold spreading (in anticipation of inhalation) while still speaking, their utterance will end with breathiness (possibly in conjunction with creak). The speaker’s final pitch will also affect the voice quality that is produced, because changes to f0 affect vocal fold contact and regularity. Variation in voice quality is therefore motivated by a complex interaction between how the end of an utterance is articulated (e.g., with a very low pitch) and how and when the upcoming gestures are realized (e.g., intake of breath). Moreover, both of these factors are linguistically controlled, as f0 and coarticulatory patterns vary significantly across languages (Farnetani and Recasens 2010; Jun 2005). In this study then, we expect that the voice quality patterns of English–Spanish bilinguals will vary by language according to what is considered typical for the given language. Given how common phrase-final creak appears to be in American English, we expect bilinguals to use more creak in their English than in their Spanish, although it remains to be determined whether that creak is produced with a spread vs. constricted glottis. Considering that phrase-final breath has been documented in Spanish but not in English, we expect bilingual speakers to use more breath in their Spanish than in their English. However, these expectations are tampered by several facts. First, there is virtually no research on the voice quality used in English and Spanish in the San Diego-Tijuana area, specifically for bilinguals. (However, overall voice quality patterns have been documented for English spoken in San Diego by Bird and Garellek (2019).) Second, the fact that phrase-final breath has been described (if not systematically documented) in Spanish but not in English does not imply that phrase-final breath does not also occur in English. Overall then, we can only assume here that, on the one hand, phrase-final creak is an important feature of American English but a less-important feature of Mexican Spanish (given the lack of research showing its use as a sociolinguistic feature in that language); on the other hand, phrase-final breath is documented for Mexican Spanish (but might be a feature that is below the level of consciousness), but has yet to be documented for American English.

1.2. Voice Quality among English–Spanish Bilinguals

There is limited research on how bilingual speakers’ voice quality can vary by language in general, let alone in English–Spanish bilinguals, and previous work shows some conflicting conclusions. Some earlier work has claimed that bilingual voices can differ according to language. For example, Todaka (1993) argued that female English–Japanese bilinguals used a breathier voice quality in Japanese compared to English, but no such differences occur for men. Bruyninckx et al. (1994) argued that Catalan-Spanish bilinguals use different voice qualities in each language, as measured by the long-term average spectrum. In contrast, Johnson and Babel (2023) argue that Cantonese-English bilinguals’ voice quality, as measured using parameters from the psychoacoustic model by Kreiman et al. (2014), remains fairly constant across languages.
The research on English–Spanish bilinguals has revealed limited language-specific differences in voice quality, particularly in the use of creaky voice. In Gibson et al. (2017), the authors compared the frequency of creaky voice across three study groups: English speakers, Spanish speakers, and bilingual English–Spanish speakers. All groups were from El Paso, Texas (and thus spoke American English and US and/or Mexican Spanish), had exposure to both English and Spanish, but were placed in the respective groups according to self-rated frequency of language use. Speakers in the bilingual group had relatively balanced use of both languages (roughly 30–60% of the time, per self reports). Participants were asked to repeat nonwords in English and Spanish. Trained listeners then identified creaky syllables in the participants’ productions. The authors found that creaky voice was more frequent in English compared to Spanish across all groups.
Similarly, Cantor-Cutiva et al. (2023) investigated production of creaky voice in Latin-American Spanish-English bilinguals. Participants were separated into two groups: Native English vs. Native Spanish based on self-reported L1 and accentedness ratings by listeners. Participants were recorded in both languages, and recordings were analyzed for percent creak (over the entire utterance for all productions) using listener judgment and automatic creak detection. The results revealed an interaction between native language group and spoken language. Overall, both native language groups produced more creaky voice in English compared to Spanish. However, English speakers had a higher percentage of creaky voice in both Spanish and English productions.
To investigate the effect of language dominance on use of creaky voice in Spanish, Kim (2017) compared voice quality in two groups of English–Spanish bilinguals (Mexican Spanish heritage speakers and English-speaking L2 Spanish learners) to native Mexican Spanish speakers. Speakers produced declarative sentences in Spanish, and the author measured H1–H2 as an acoustic measure of creaky voice over the course of the utterance as well as utterance-finally. A lower value of H1–H2 was interpreted as increased creakiness. The author found that overall, heritage and L2 Spanish speakers (particularly females) had lower H1–H2 utterance-finally compared to native Spanish speakers, although some individual variability was noted. The results were taken to mean that creaky voice quality can transfer from the dominant language to a non-dominant language–in this case, from English to Spanish.
In sum, the results from these studies suggest that English–Spanish bilinguals demonstrate differences in voice quality between languages, with creaky voice occurring more frequently in their English than in their Spanish. Additionally, initial evidence suggests that language dominance may play a role in the use of creaky voice; specifically, English dominant speakers have demonstrated a transfer of creakiness to their less dominant language, Spanish.

1.3. The Current Study

The current study has four main goals. Our first goal is to determine whether English–Spanish bilinguals use more utterance-final creak in English, and more utterance-final breath in Spanish. This is motivated by the fact that utterance-final creak is more widely documented in English compared to Spanish, and in English at least it indexes sociolinguistic meaning (Kendall et al. 2023). In contrast, utterance-final breath is documented in Spanish but not (to our knowledge) in English. However, we also acknowledge the relative lack of empirical research on San Diego and Tijuana English and Spanish, and as such that this hypothesis is motivated from patterns described and/or documented for American English and Mexican Spanish more broadly.
Our second goal is to document the occurrence of spread-glottis creak as a particular form of utterance-final voicing, based on the occurrence of acoustic characteristics of both breath (aspiration noise) and creak (irregular voicing). Given that spread-glottis creak shares characteristics of both utterance-final breath and utterance-final creak, we expect it to occur in both languages. Our third goal is to determine whether each type of utterance-final voice quality varies as a function of a speaker’s language dominance; that is, which language is used more often by a speaker (Montrul 2015). In particular, we ask whether more English-dominant speakers are less likely to use utterance-final breath than less English-dominant ones. Finally, our fourth goal is to explore the articulatory and acoustic characteristics of utterance-final breath and creak in more detail for our target population of English–Spanish bilingual speakers of the San Diego-Tijuana area.
The current study builds on and extends previous findings in the following ways. First, language dominance is identified using a standardized method of assessment, the MINT-Sprint (Garcia and Gollan 2022). In addition, our visual ratings of voice quality include “breathy-creaky” ratings, allowing for the possibility that a token has characteristics of both breathiness and creakiness. Finally, the current study employs objective measures including acoustic analysis and electroglottography (EGG) in order to further characterize any differences in voice quality.

2. Methods

In this section we describe the process of the data collection that includes the participants’ background information and the procedure for the study’s reading materials.

2.1. Participants

English–Spanish bilinguals living in the San Diego area were recruited through the UCSD community and through personal contacts. To qualify for participation in the study, speakers had to be able to speak and read in English and Spanish, and had to have lived in either Southern California, USA (defined as including San Diego, Imperial, Los Angeles, Riverside, Orange, Santa Barbara, and San Bernardino counties) and/or Baja California, Mexico, until at least the age of 14. Additionally, speakers had to self-declare that they had no history of learning, fluency, or voice disorders. Participants either received course credit or were compensated $25 for their participation.
We recorded 22 participants in total; 1 was excluded on the basis of having very frequent reading disfluencies. Of the remaining 21 participants, 4 were men and 17 were women (none self-identified differently); all 21 participants self-identified as Hispanic/Latinx. Demographic details of the participants included in the analysis are summarized in Table 1, which also includes language dominance score (described below).

2.2. Procedure

Administration of the experiment was done by the first author, who is a bilingual speaker from the San Diego-Tijuana border area. For all but one speaker, the study was conducted in English (the study was conducted in Spanish for speaker F12, as that participant was known to the experimenter, and the two converse predominantly in Spanish).
The experiment was held in the UCSD Phonetics Laboratory. Participants were explained the purpose of each of the consent forms and the study more generally before signing. Upon signing of the consent forms, participants proceeded to complete a language background questionnaire written in English. The questionnaire included fields for participants to self-identify their gender and ethnicity; where they grew up (from birth until the age of 7, and between ages 7 and 14); their proficiency on a Likert scale from 1 (almost none) to 7 (native-like) in speaking, reading, writing, and understanding both English and Spanish; percentage of time that English and Spanish were used growing up (from birth to high school) vs. are used currently. All but one participant (F12) favored English over Spanish on the majority of measures.
Participants were recorded in a sound-attenuated booth using a Shure SM10A head-mounted microphone in Audacity at a sampling rate of 44,100 Hz. Simultaneous EGG recordings (as a second channel in a stereo audio recording) were collected at the same sampling rate using a two-channel Glottal Enterprises electroglottograph (Model EG2), with a high-pass filter of 20 Hz. The recording, which lasted approximately 4 minutes per language, involved reading the folk tale Little Red Riding Hood (Spanish Caperucita Roja) in both languages.2 This text was chosen as it is well known in both languages and is written in a colloquial style that could be read even by speakers with weaker reading proficiency in their non-dominant language. The order of presentation (English vs. Spanish first) was counterbalanced across participants. The text was presented using Google Slides, with 2–4 sentences per slide. Participants were asked to read the text as naturally as possible, and click the right-arrow button on the keyboard to proceed to the next slide until they finished each of the narratives.
Following the recording, participants proceeded to complete the MINT Sprint picture-naming task (Garcia and Gollan 2022) in both English and Spanish. The MINT (both the shorter MINT Sprint and longer original) task is widely used to provide a gradient assessment of language dominance among bilingual speakers. The MINT test was completed in two phases. For the first phase, speakers were asked to name the pictures that appear on their screen as fast and as accurately as possible. If participants missed or could not name some of the pictures in the first phase, they were able to do so in the second phase. Only the first phase was timed. The language dominance scores (quoted as in Garcia and Gollan (2022) as English accuracy minus Spanish accuracy) are shown in Table 1. Higher values indicate more English-dominant speakers, with most of the speakers ranging from balanced to English-dominant according to their MINT scores.

2.3. Data Processing and Analysis

The recordings were segmented and annotated using Praat (Boersma and Weenink 2024). Since we focused our analysis on utterance-final voicing, we relied on the presence of breaths to determine the boundaries between utterances. A breath was identified by a period of voiceless, largely broadband, and weak noise that occurs between long chunks of speech. Any silent pause longer than 1000 ms was also considered an utterance boundary, even without a visible intake of breath.
Next, the utterance-final voicing was segmented. The voiced interval included the utterance-final sonorant rhyme—vowels plus any sonorant onsets and codas. If the preceding consonant was an obstruent, then the “voicing” interval began after that obstruent. For example, if the Spanish utterance ended in casa ['kasa], then only that final vowel was segmented as the voicing interval. The vowel was segmented from the start to end of clear first and second formants, regardless of whether voicing was in fact present. This means that utterance-final vowels that were voiced were segmented based on formants excited by voicing, whereas devoiced vowels were segmented based on formants excited by aspiration noise (Garellek et al. 2023). (We included the latter, as vowel devoicing is known to occur widely in Spanish, and thus serves as one way of distinguishing voice quality in the two languages.) An example of the segmentation for a final voiceless vowel in Spanish bosque ['βoske̥] is shown in the right panel of Figure 1, and other examples with (partially) voiced final rhymes can be seen in Figure 2.
If instead the final rhyme was preceded by a sonorant, then the voiced interval went leftward up to but excluding the previous syllable. Thus, for Spanish cama (["kama]), the [ma] syllable was included in the voiced interval. Abrupt changes in voicing amplitude were used to delimit the segmental boundaries between vowels and sonorants. Earlier but adjacent sonorous portions in the utterance-final word were excluded so that the intervals would correspond to just one syllable’s rhyme.
We excluded any utterance-final rhymes if the target word was preceded by, contained, or ended in a disfluency. Disfluencies included abrupt cutoffs, restarts, perceptually overlong prolongations around or including the target words, inserted filler word, or mispronunciations. In total, 3692 were analyzed (on average 175 tokens per speaker).

2.3.1. Coding Voice Qualities

After the utterance-final rhymes were extracted, the clips were judged for visual evidence of non-modal voice quality. The third author labeled each utterance-final segment for aspiration noise (i.e., presence of broadband noise) and for voicing irregularity, both of which had to last for at least 50 ms to count for subsequent analyses. This was done in part to ensure that the segments labeled for non-modal phonation would likely be perceptible, but mainly to ensure that the subsequent voice analyses would be based on non-modal stretches that can be robustly estimated both articulatorily and acoustically.
Voicing irregularity was assessed following the criteria from Keating et al. (2023): any segment with a sudden drop in f0, irregular f0 (to the point where f0 jittered significantly or could not be measured), or with multiple pulsing was deemed to be irregular. Utterance final rhymes containing only an aspiration segment were coded as “breathy”, while those containing only a segment with voicing irregularity were coded as “creaky”. Rhymes with both an aspiration and voicing irregularity segment were coded as “breathy-creaky”. In some tokens, the aspiration segment and voicing irregularity segment overlapped (partially or in full), meaning that aspiration noise was seen even during irregular pulsing. In other cases of “breathy-creaky” tokens, however, the two segments were non-overlapping. Finally, tokens with neither an aspiration nor an irregular voicing segment were coded as “modal”.
Note that, as the categorization was based on visual information, it is quite possible that a token that was coded as, say, “breathy” (for having aspiration noise in the signal) could in fact sound modal; presumably in such a case, the non-modal phonation that is seen is not strong enough to affect the auditory quality.
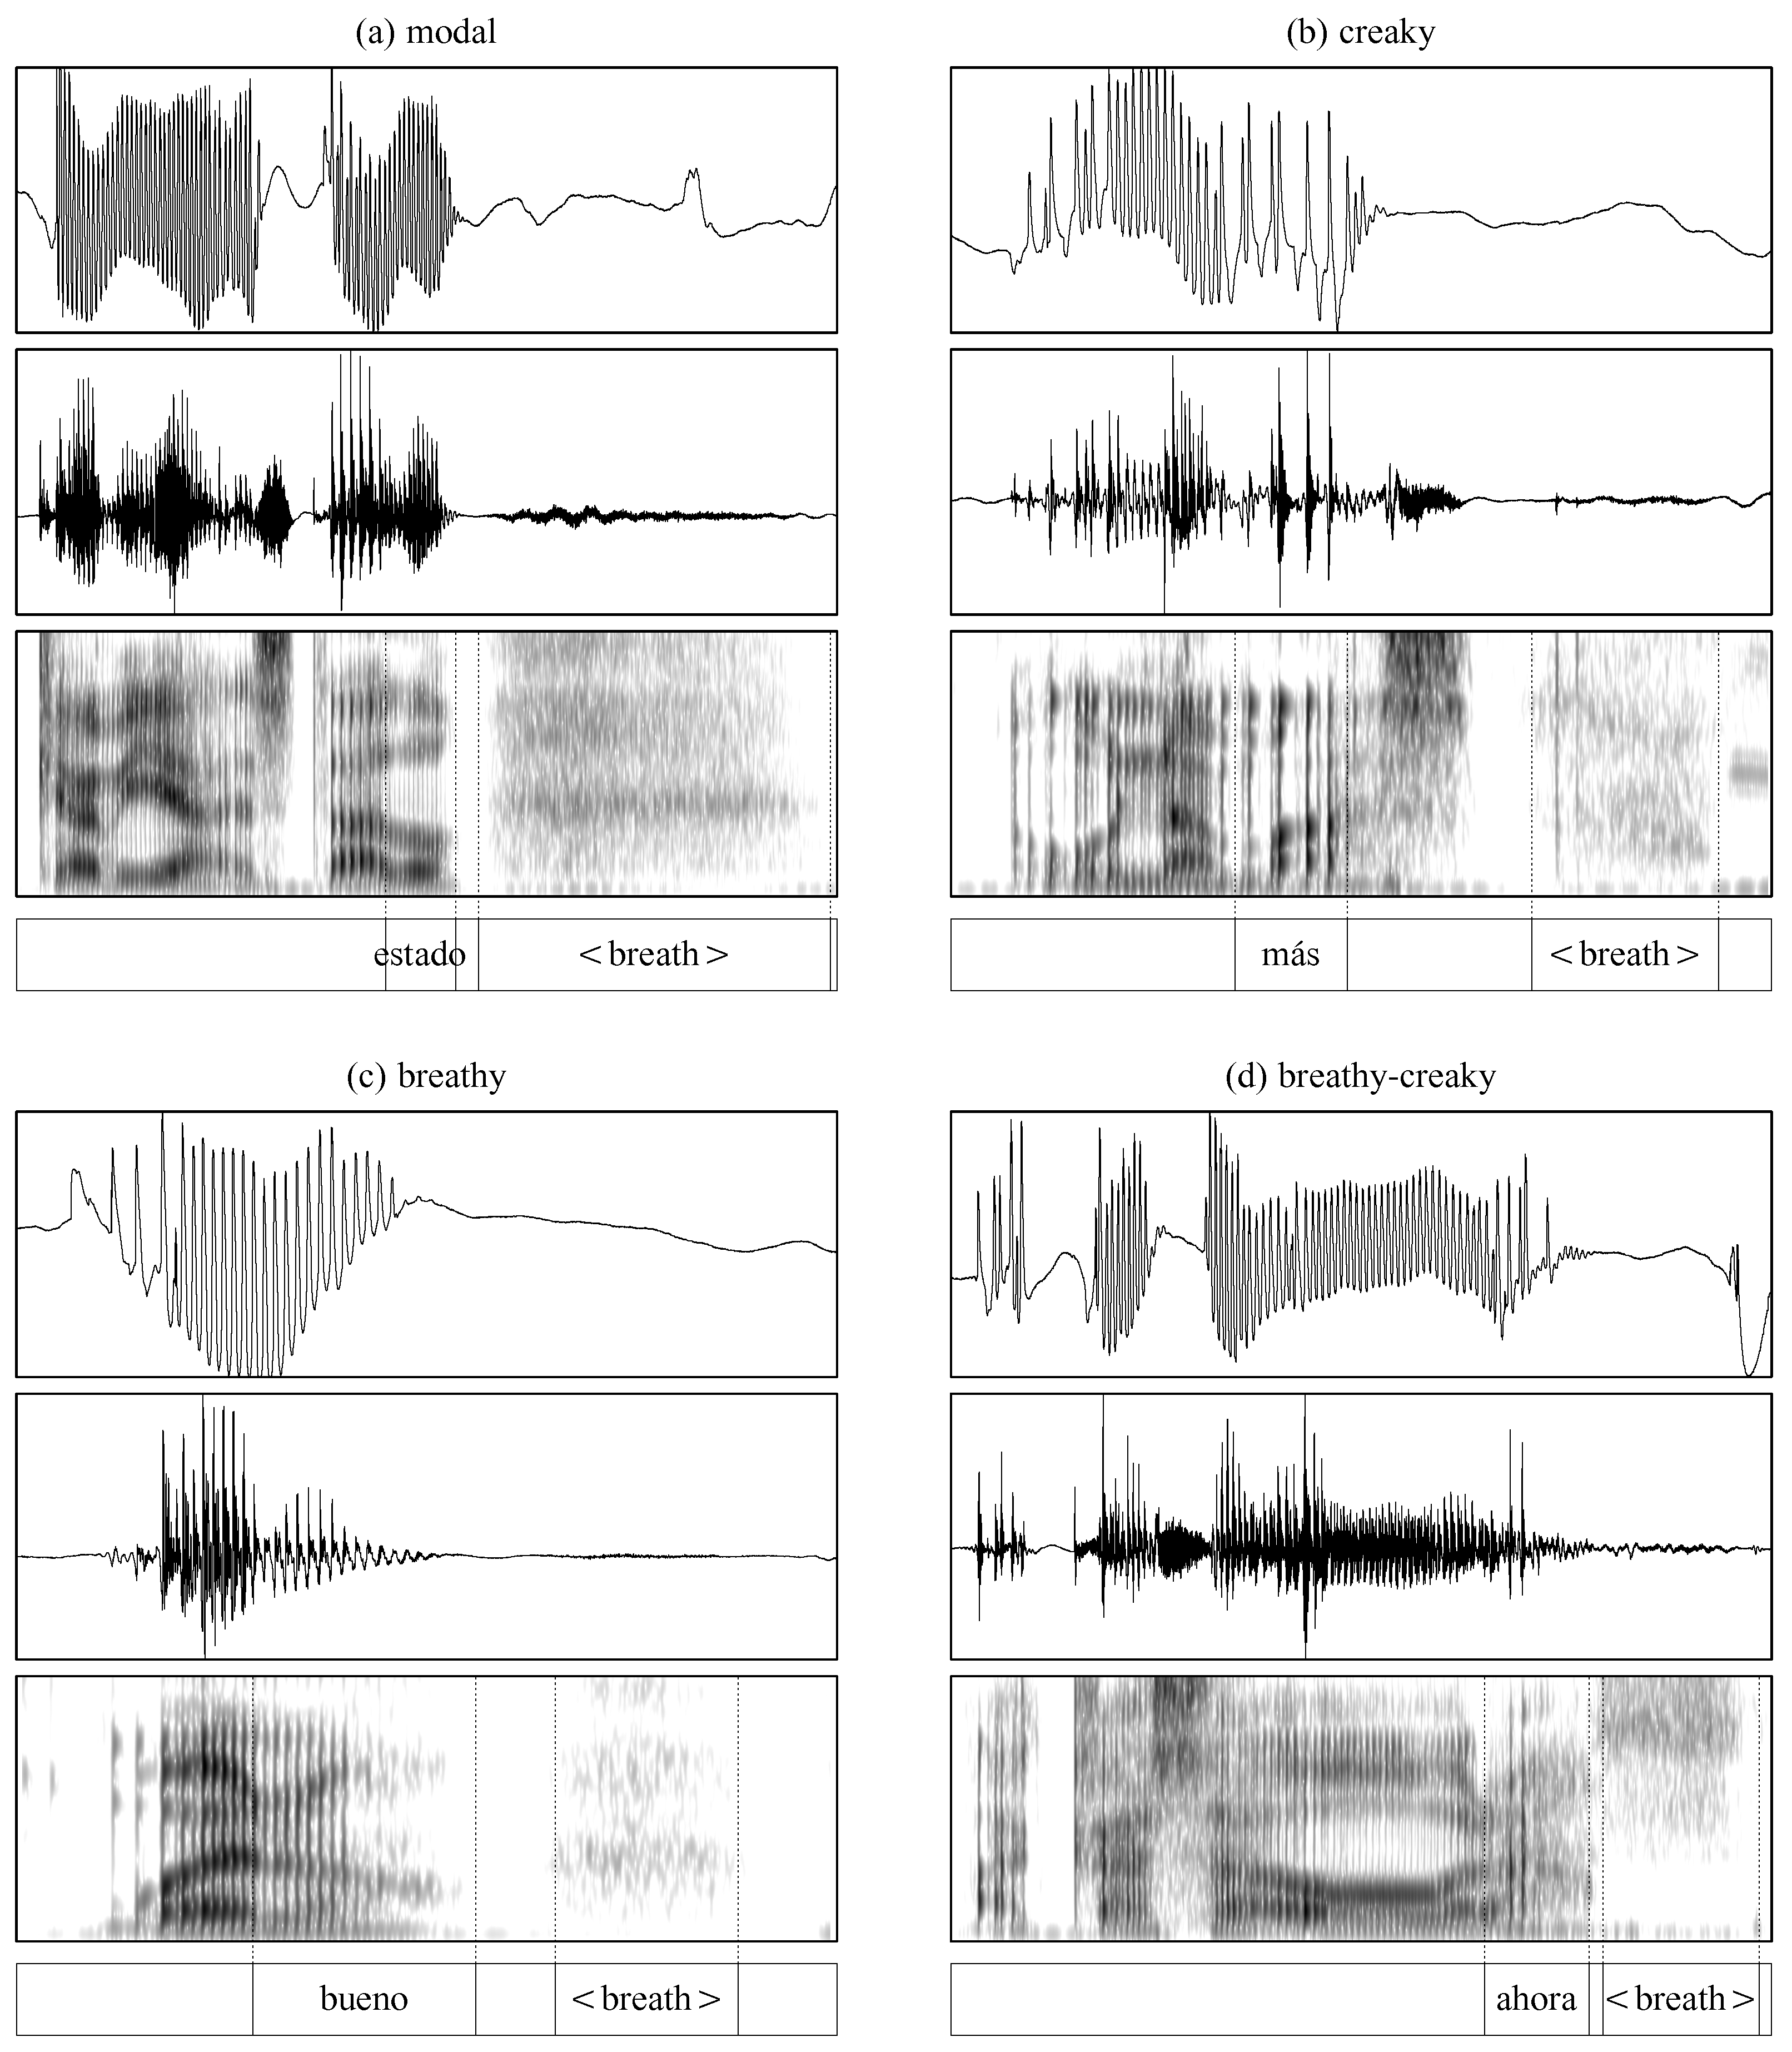
Figure 2 shows sample audio clips that were characterized as being “modal” (a), “creaky” (b), “breathy” (c), and “breathy-creaky” (d). EGG and acoustic descriptions will be described in Section 4. The “modal” token in (a) shows little voicing irregularity or aspiration noise; the “creaky” token in (b) shows irregular voicing but no aspiration noise; the “breathy” token in (c) shows aspiration noise (leading to devoicing) but regular voicing; the “breathy-creaky” token in (d) shows both voicing irregularity and aspiration noise that leads to devoicing.

2.3.2. Processing of the EGG and Acoustic Measures

In Section 4, we will explore how the coded voice qualities might be differentiated according to EGG and audio measures of phonation. Due to technical issues, four of our participants (F15, F16, F16, M04) only have audio recordings available; therefore, we excluded them from the subsequent exploration of how voice quality measures vary by the labeled voice qualities, which will be based on the data from the remaining 17 participants.
The stereo (EGG and audio) files were split, and the EGG waveforms were extracted according to the audio intervals segmented for the entire utterance-final rhyme. The EGG waveform clips were then analyzed using EggWorks for the purposes of measuring contact quotient (CQ), the proportion of a glottal cycle during which the vocal folds are considered to be in contact with one another. Following many studies (see, e.g., Garellek 2022), CQ was measured using the ’hybrid’ method (Howard 1995), in which contact (or closure) starts from the positive peak in the derivative and a 25% threshold of peak-to-peak amplitude is used to mark the end of the contact phase. For our analysis, we excluded any CQ values outside the range of [0.3,0.7]; outside of this range, values were generally considered to be outliers greater than 3 standard deviations from the mean, and are anyway considered spurious for being far too low or high. We expect that “breathy” tokens and “breathy-creaky” ones would have the lowest CQ, indicating the greatest degree of glottal spreading, and for “modal” tokens to have relatively higher CQ. If the utterance-final “creaky” tokens are produced with increased glottal constriction, they should also have the highest values of CQ.
The audio files were also extracted according to the segmented intervals, and the clips (with their corresponding TextGrid files) were analyzed using VoiceSauce (Shue et al. 2011). In this study we target several acoustic parameters. The fundamental frequency or f0 was measured using STRAIGHT (Kawahara et al. 1998). We expect that “modal” tokens will be higher in f0 than non-modal ones, and that “breathy-creaky” and “creaky” tokens should have the lowest f0.
We also obtained H1*–H2* measures. We excluded any data points for which f0 was deemed an outlier greater than 3 standard deviations from each participant’s mean, as the measure relies on accurate f0 detection. We expect “breathy” tokens to have the highest values of H1*–H2*, and creaky tokens the lowest, but it is unclear how “breathy-creaky” tokens will behave according to this measure. We caution though that the correction for formant frequencies and bandwidths is meant for vowels (Garellek 2019), yet some of the rhymes include sonorant consonants which may greatly affect the formants. Therefore, while we show the H1*–H2* results, the reader should be advised that, in general and especially in confirmatory studies, the corrected measure should only be used over vocalic portions.
We included two measures of harmonics-to-noise ratio: Cepstral Peak Prominence (CPP, de Krom 1993), a measure of broadband noise, and HNR below 500 Hz, a measure of low-frequency noise (i.e., noise around the fundamental frequency). Both CPP and HNR below 500 Hz are expected to be lower in breathier or creakier phonation types, but HNR below 500 Hz should be particularly low for “breathy-creaky” and “creaky” tokens if they have irregular f0 (Garellek 2020, 2022; Keating et al. 2023).

3. Results of Voice Quality Categorization

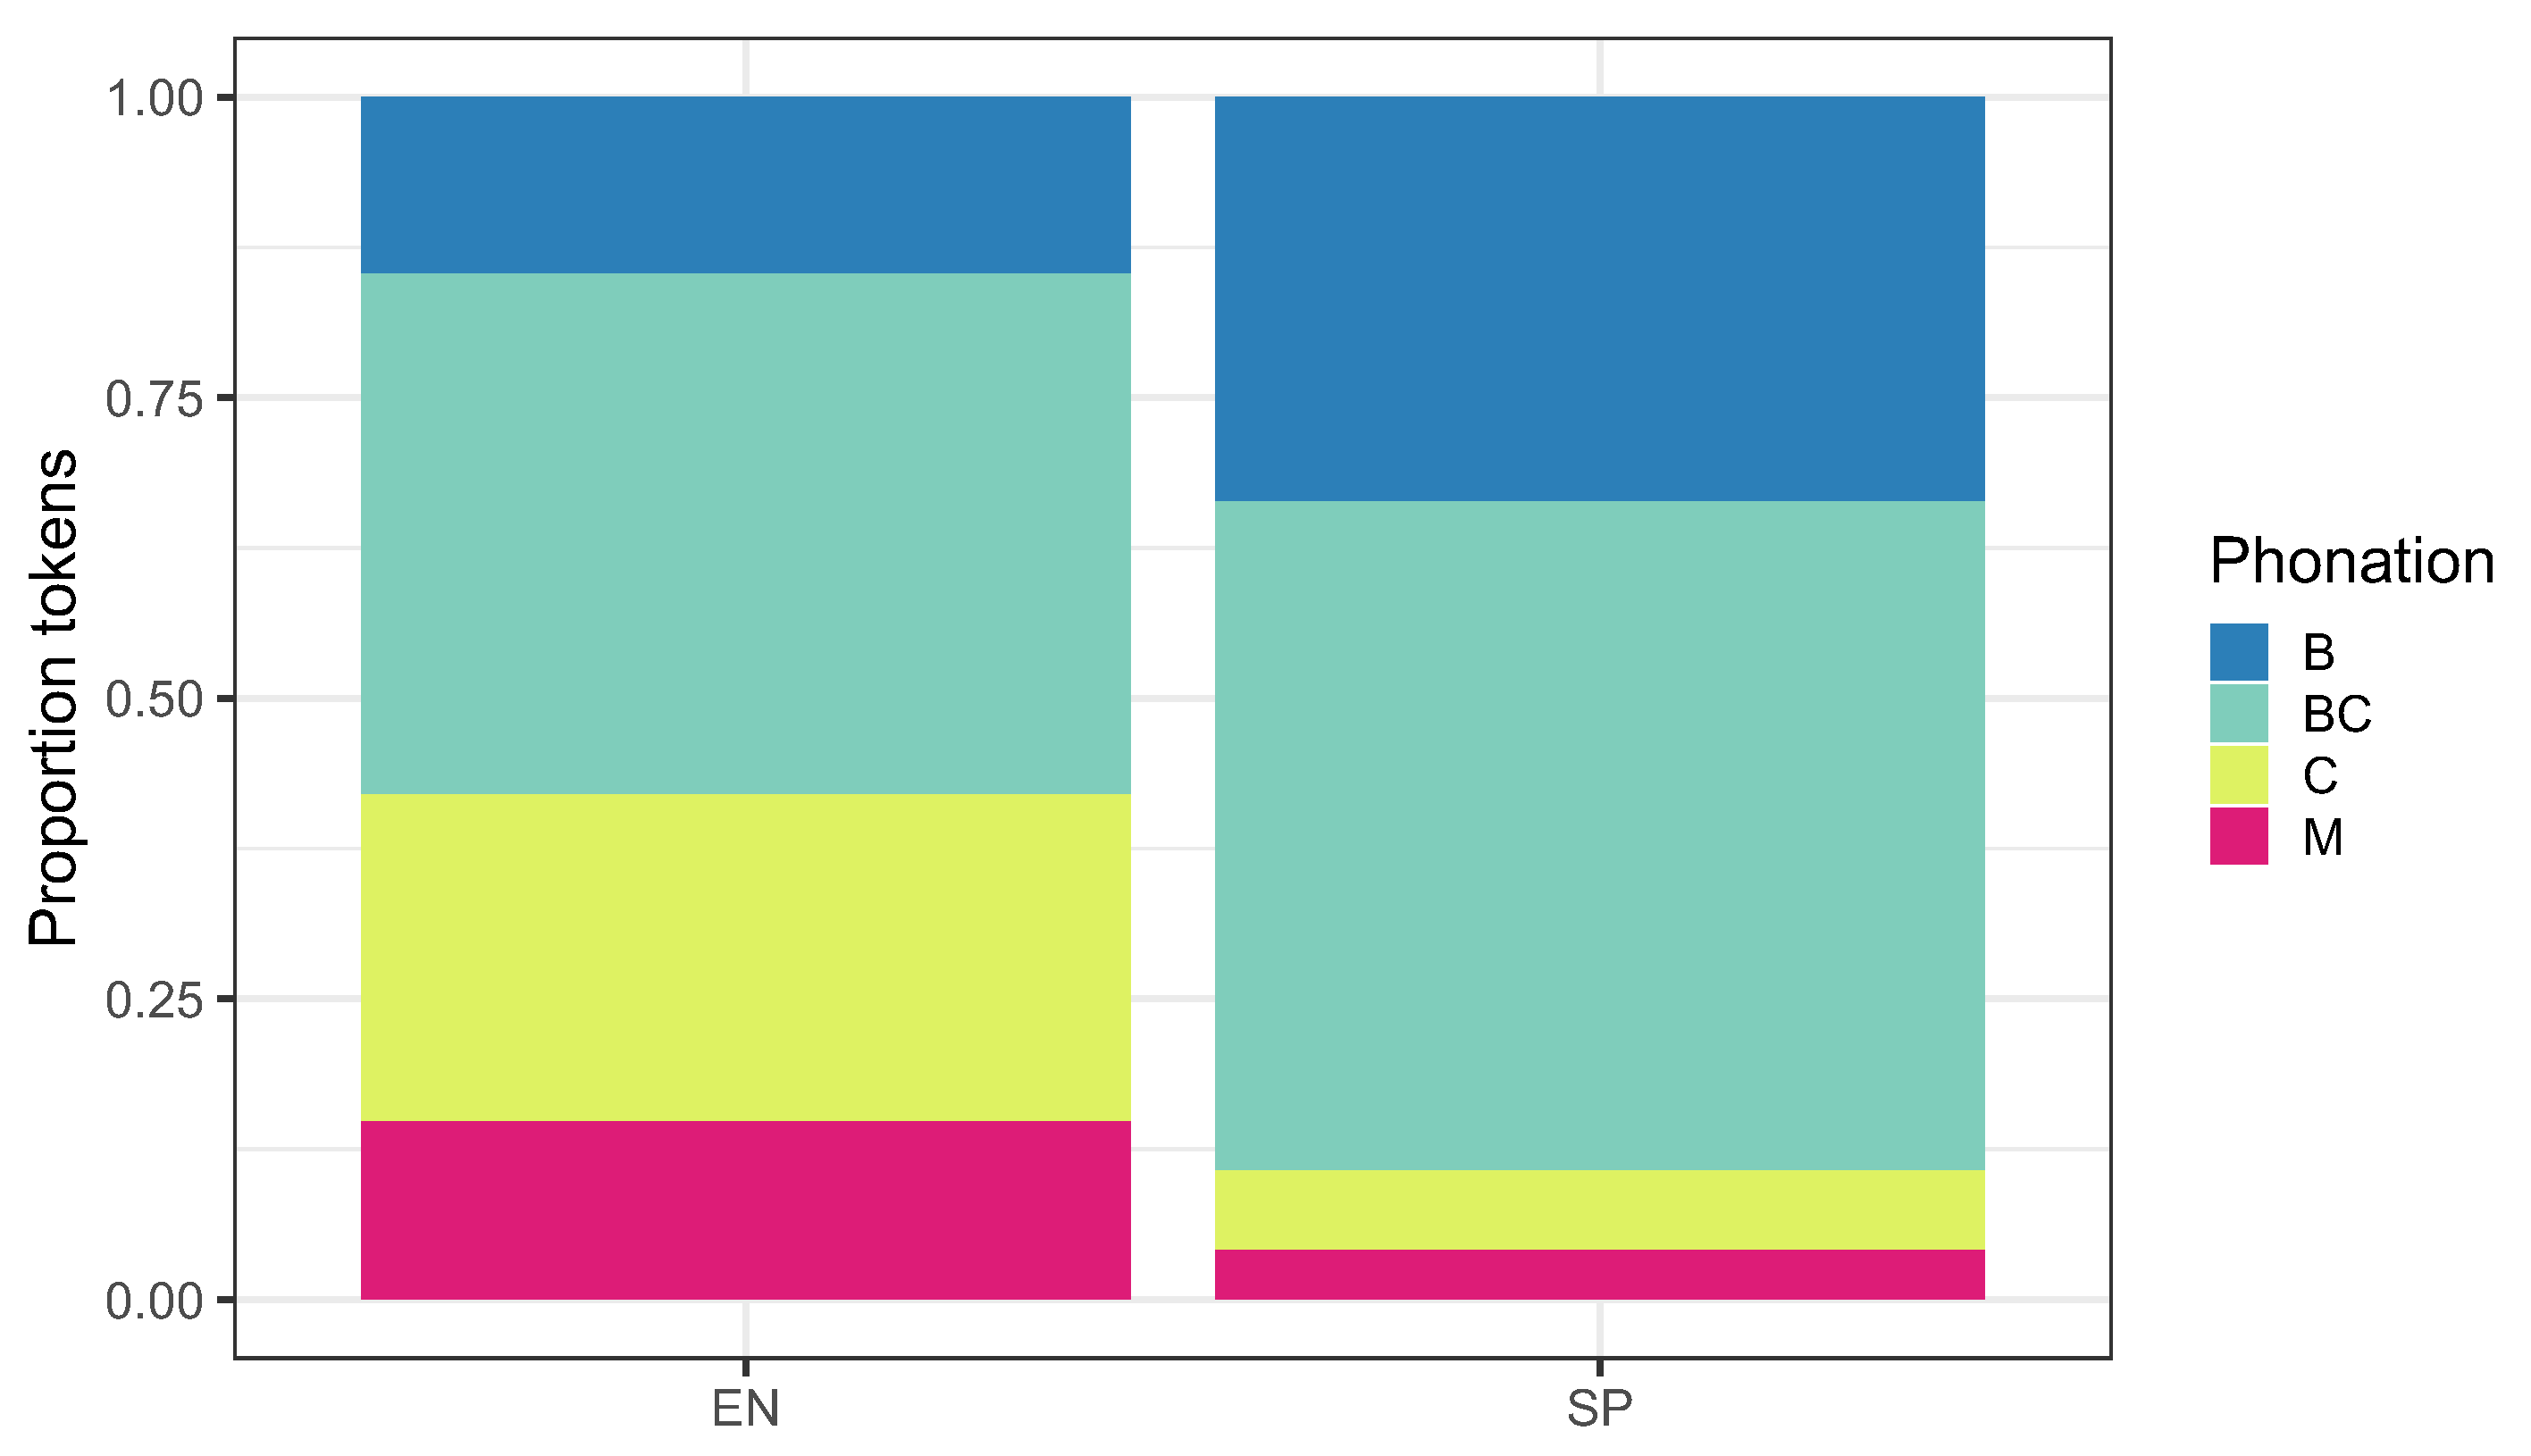
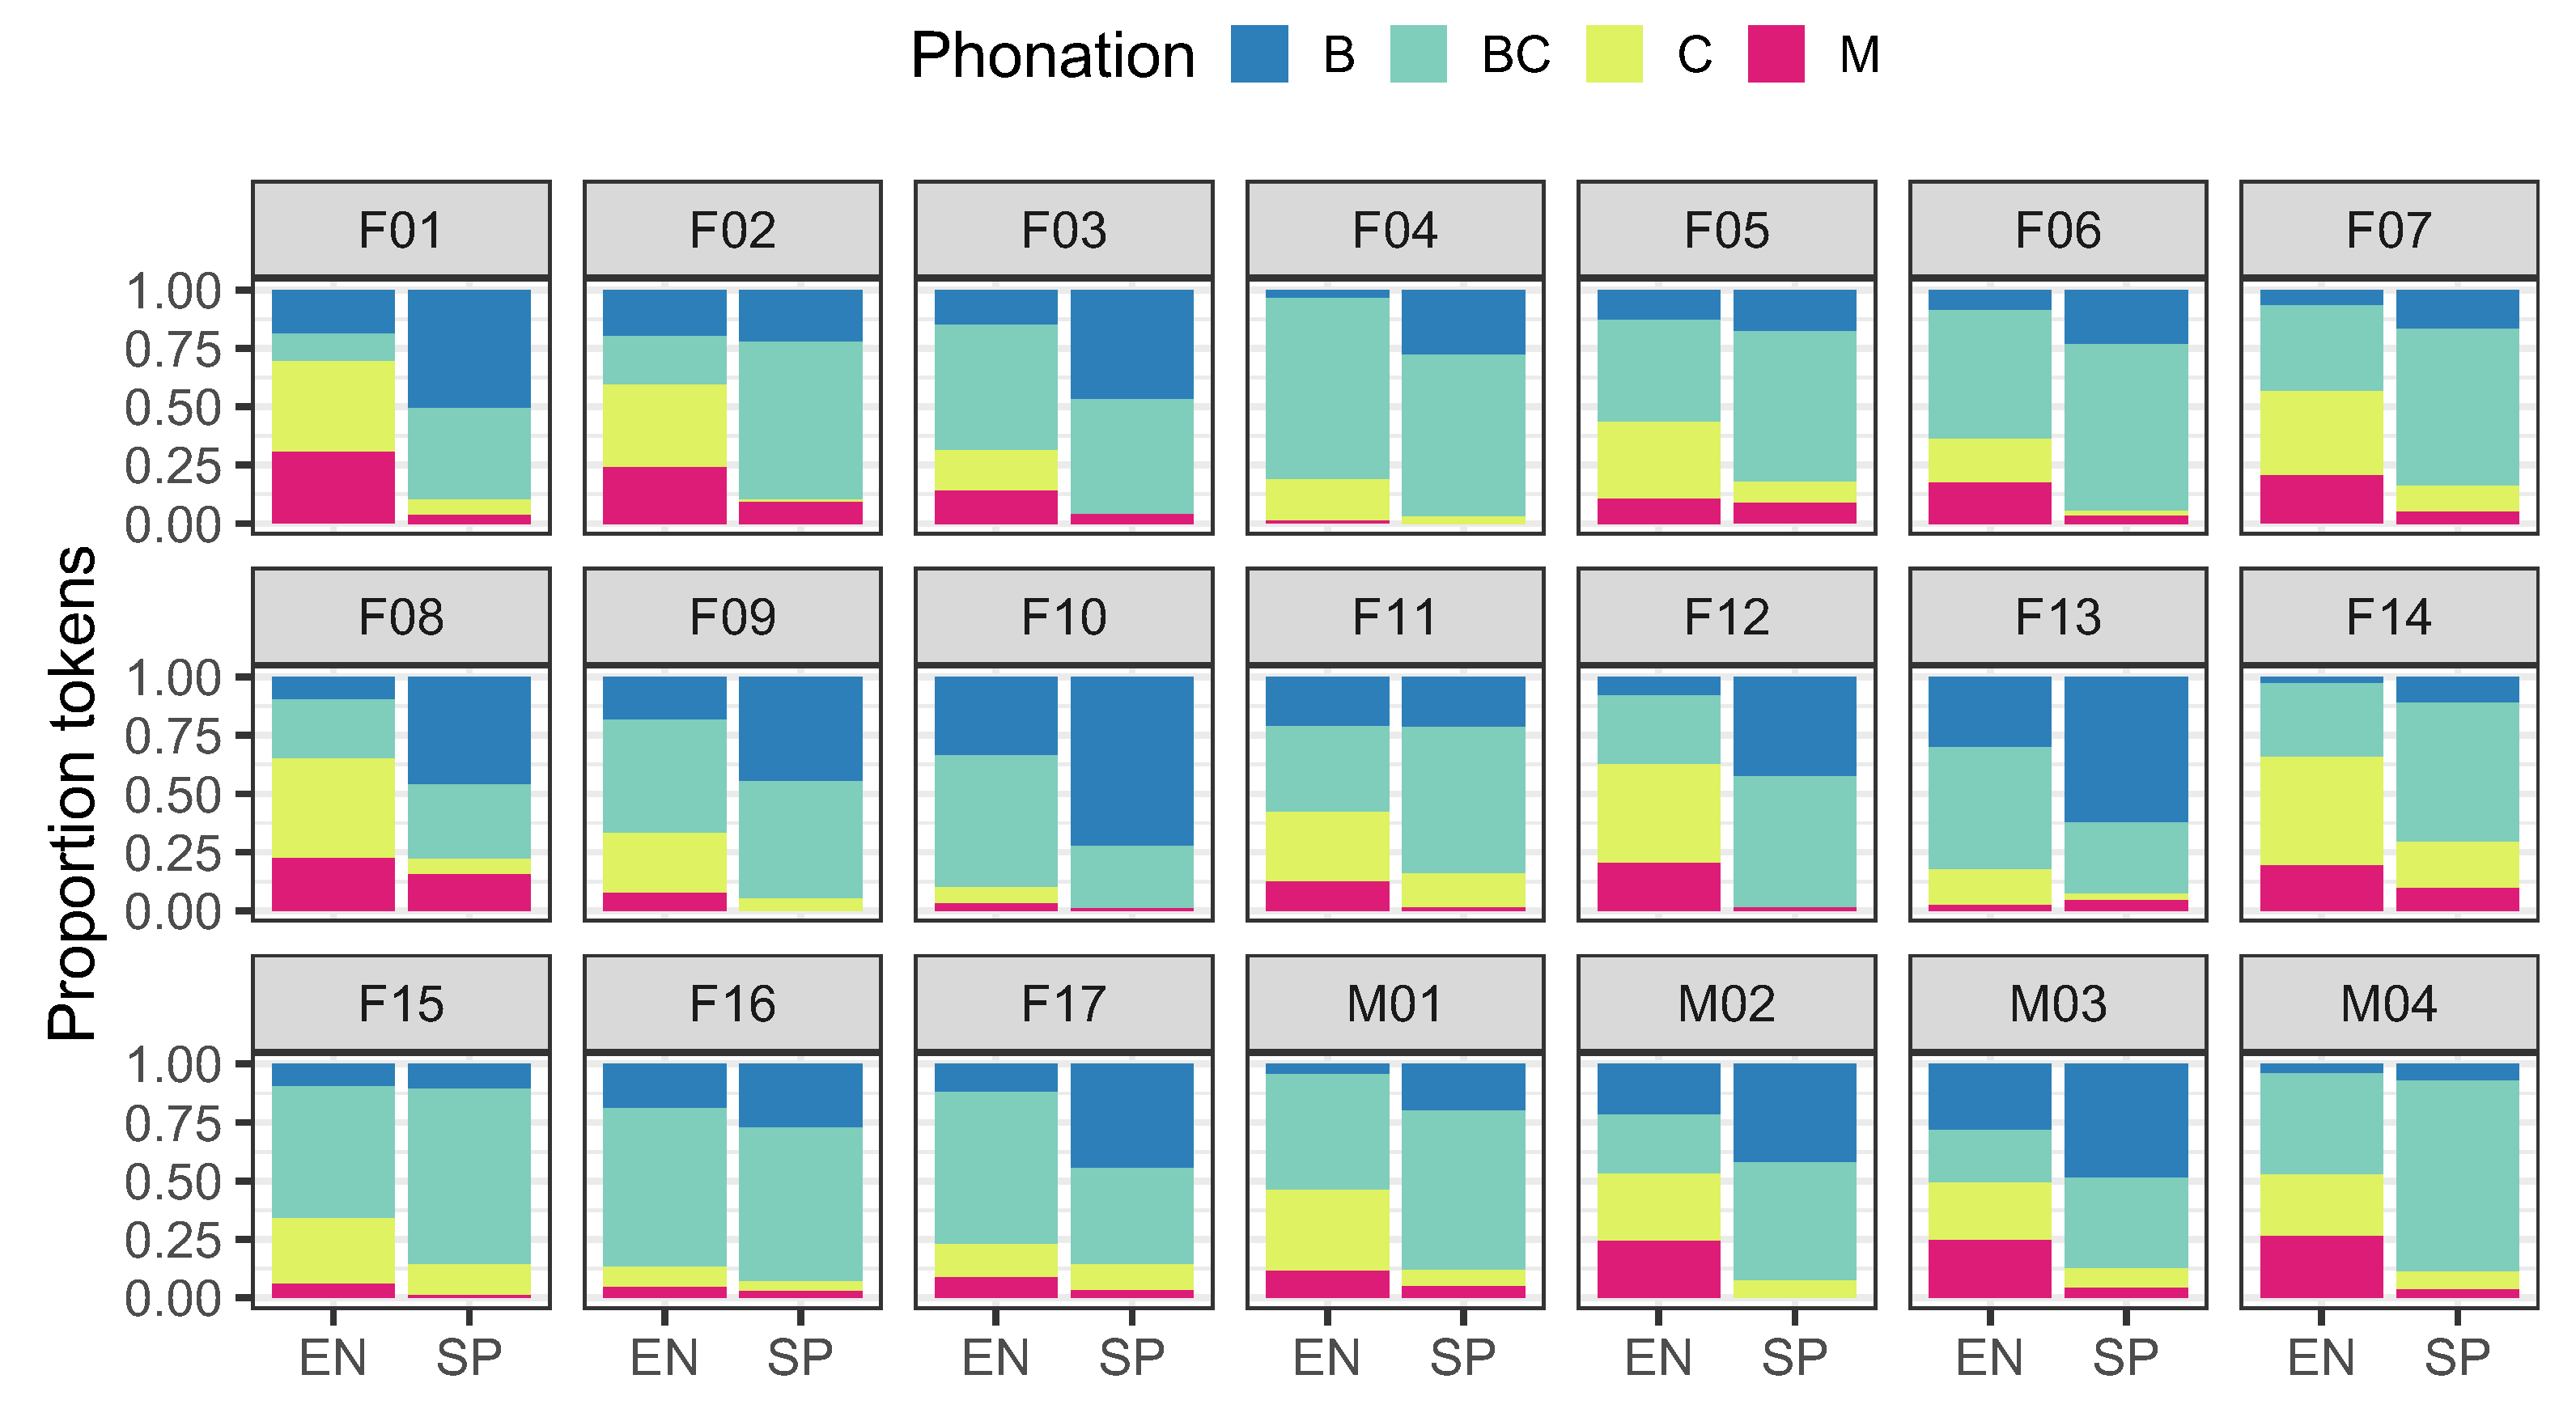
The proportion of tokens categorized as sounding “breathy”, “creaky”, “breathy-creaky”, and “modal” is shown in Figure 3 (averaged over all participants) and in Figure 4 (separated by participant).
Four logistic mixed-effects models were run in R using the lmerTest function (Kuznetsova et al. 2015), predicting presence vs. absence of a target voice quality (e.g., breathy vs. all other voice qualities), as a function of language (dummy-coded with English as the baseline) and speaker dominance, with random intercepts by speaker and word.3 As stated earlier, our first goal was to determine whether English–Spanish bilinguals use more utterance-final creak in their English, and more utterance-final breath in their Spanish. This hypothesis is borne out in our data: utterance-final breath is more common in Spanish than in English ( β = 1.39 , S E = 0.17 , z = 8.22 , p < 0.0001 ), while utterance-final creak is less common in Spanish than in English ( β = 1.85 , S E = 0.21 , z = 8.63 , p < 0.0001 ). In addition, we find that utterance-final breathy-creaky voice is more common in Spanish than in English ( β = 0.45 , S E = 0.16 , z = 2.83 , p < 0.001 ), whereas utterance-final modal voice is less common in Spanish than in English ( β = 1.41 , S E = 0.28 , z = 4.96 , p < 0.0001 ). The fact that breathy-creaky voice is the most common utterance-final voice quality in both languages lends support for our second goal, to document spread-glottis creak in both languages. In the acoustic analysis in Section 4, we will further show that breathy-creaky voice and (surprisingly) creaky voice are both produced with more glottal spreading than modal voice.
Our third goal was to determine whether each type of utterance-final voice quality varies as a function of language dominance. The results from the statistical models indicate that this is not the case, because in no model did dominance (as operationalized by the MINT score) have a significant effect on the particular utterance-final voice quality.
Figure 4 reveals that the general pattern just described is very stable across participants, with the exception of whether breathy-creaky vs. creaky tokens are more common in English. The majority of speakers show more frequent use of breathy-creaky voice, but some speakers (F07, F11, M01, M02, M03) have roughly the same proportion of both, whereas others (F01, F08, F12, F14) have more creaky than breathy-creaky voice in their English.

4. EGG and Acoustic Description

In this section, we explore how common voice quality measures vary according to both language and the coded voice qualities in our dataset. We will also report the results of linear mixed-effects models predicting the scaled acoustic measure as a function of language (dummy-coded with English as the baseline), the coded voice quality (dummy-coded with modal as baseline), the interaction between language and voice quality, as well as with random intercepts by word and speaker and random slopes by language.
The data for CQ are shown in Figure 5. Overall we see that the CQ values are quite low, with averages below 0.5 (meaning that, on average, the vocal folds are in contact for less time than they are open). Thus, even tokens coded as “modal” and “creaky” are produced with a spread glottis. For English, the CQ values for non-modal phonation types do not differ from modal. However, for Spanish, the differences between modal vs. non-modal voices are all significant (modal vs. breathy: β = 0.38 , S E = 0.14 , t = 2.70 , p < 0.01 ; modal vs. creaky: β = 0.32 , S E = 0.16 , t = 1.99 , p < 0.05 ; modal vs. breathy-creaky: β = 0.39 , S E = 0.13 , t = 2.93 , p < 0.01 ). We found no overall difference by language for CQ.
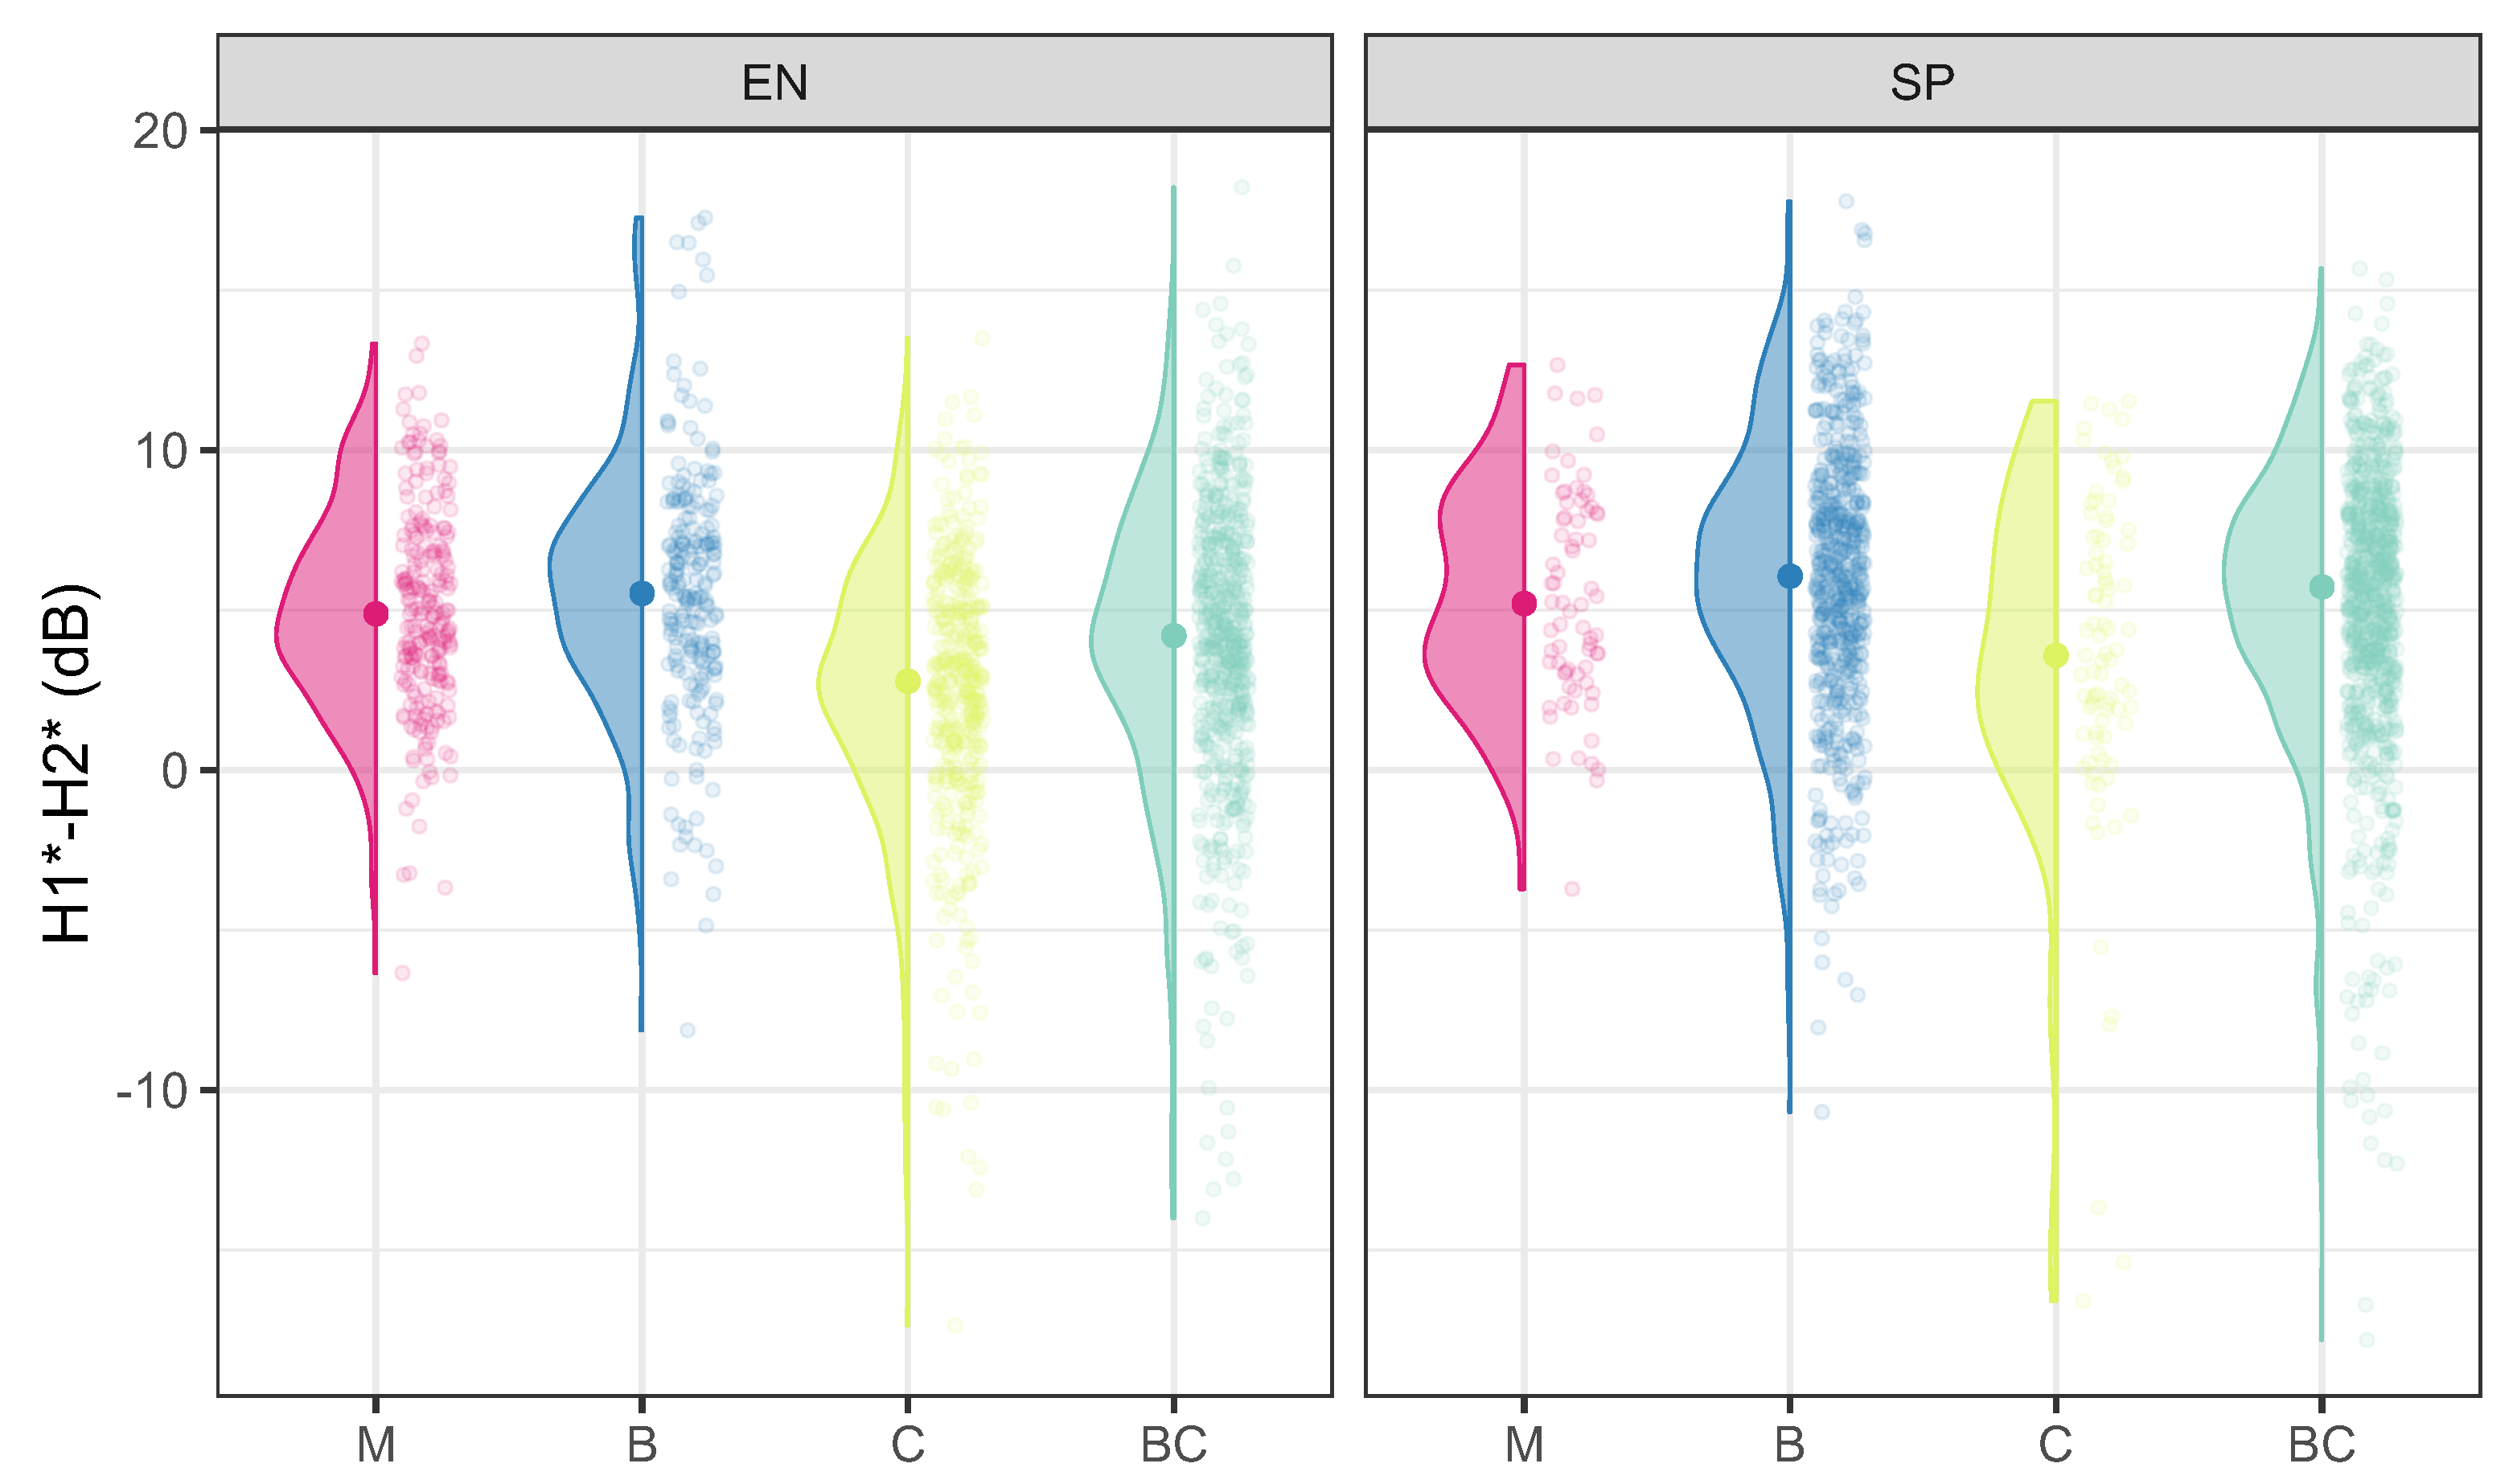
The H1*–H2* data shown in Figure 6 reveal a different picture. For English, both creaky and breathy-creaky tokens have lower H1*–H2* than modal (modal vs. creaky: β = 0.53 , S E = 0.08 , t = 6.54 , p < 0.001 ; modal vs. breathy-creaky: β = 0.21 , SE = 0.08, t = 2.60 , p < 0.01 ). No significant language-phonation interaction, or main effect of language, was found. These results differ from those of Kim (2017) and have important implications for future work; we will therefore discuss the conflicting results from CQ vs. H1*–H2* in more detail in Section 5.
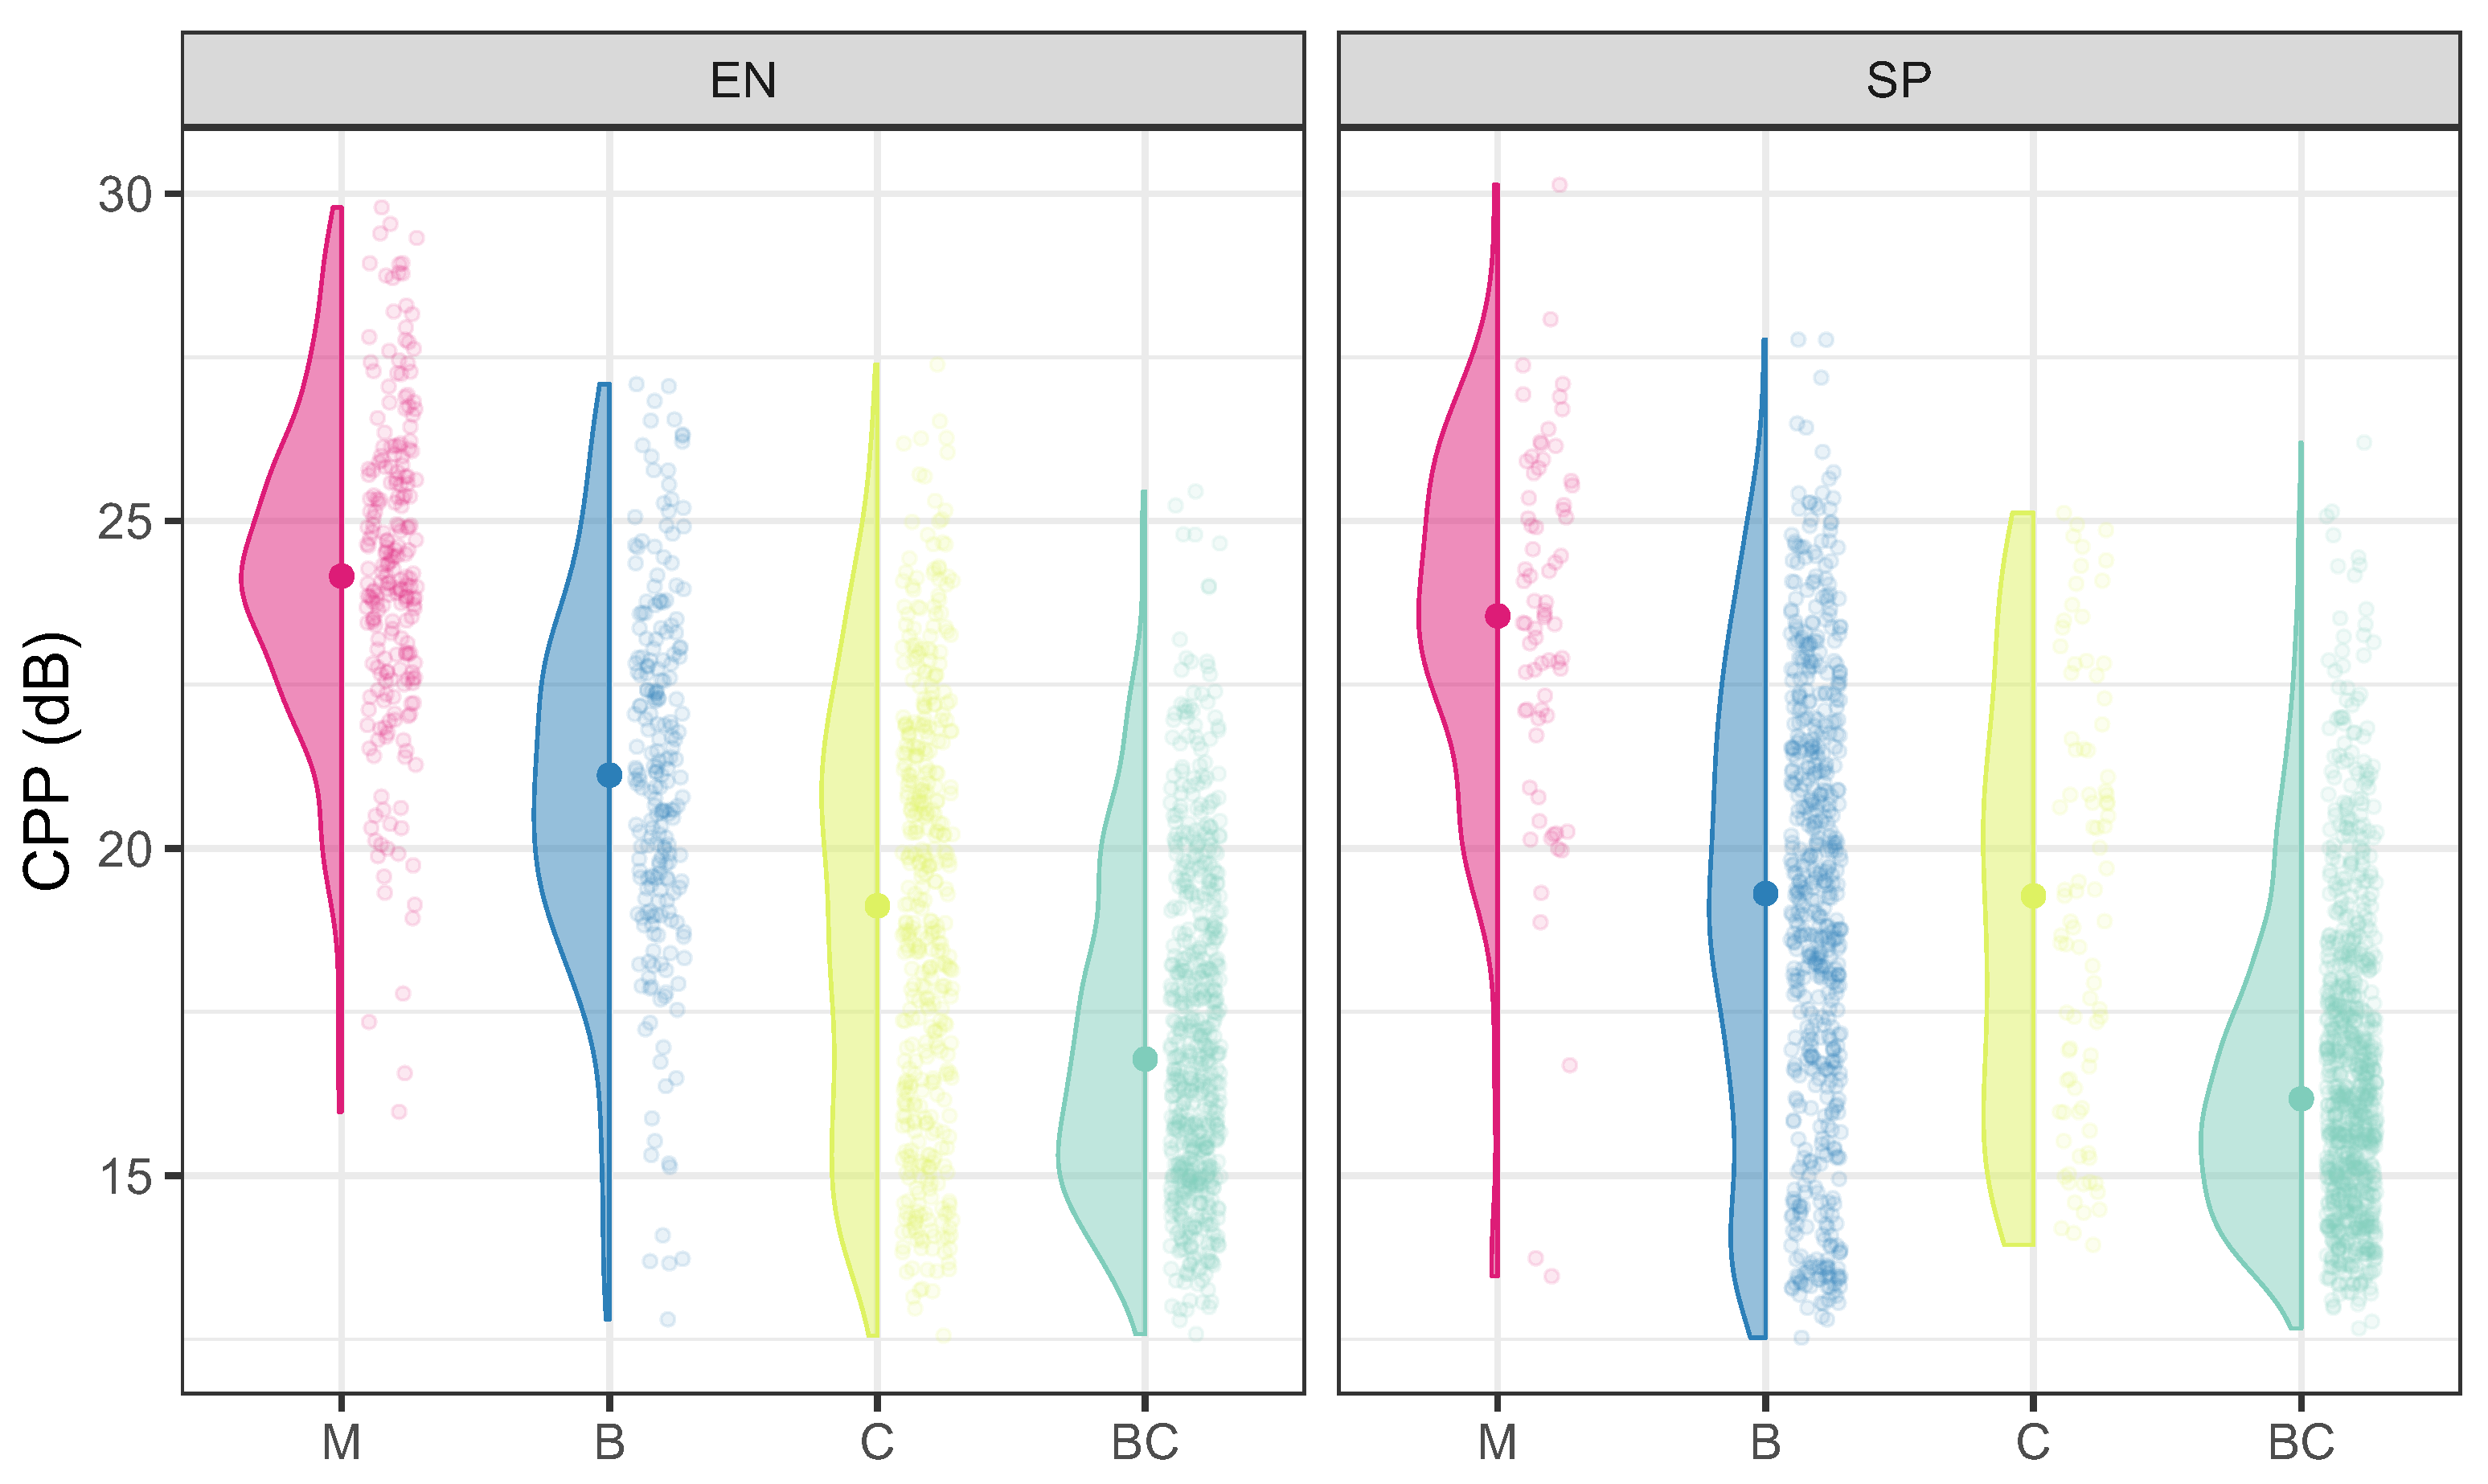
The results for CPP and HNR < 500 Hz are illustrated in Figure 7 and Figure 8. They reveal both commonalities and differences between the two measures. CPP, a measure of broadband noise, is highest for modal tokens, as expected. For English, all the non-modal phonation types have lower CPP than modal (modal vs. breathy: β = 0.58 , S E = 0.07 , t = 8.45 , p < 0.0001 ; modal vs. creaky: β = 1.31 , S E = 0.06 , t = 22.31 , p < 0.0001 ; modal vs. breathy-creaky: β = 1.63 , S E = 0.06 , t = 26.93 , p < 0.0001 ). These differences are even larger in Spanish than in English (modal vs. breathy: β = 0.32 , S E = 0.11 , t = 3.01 , p < 0.01 ; modal vs. creaky: β = 0.55 , S E = 0.12 , t = 4.82 , p < 0.0001 ; modal vs. breathy-creaky: β = 0.54 , S E = 0.10 , t = 5.46 , p < 0.0001 ). Note also that CPP is found to be more sensitive to voicing irregularity than to aspiration noise; creaky and especially breathy-creaky tokens have the lowest values. Overall, we find that CPP is lower in Spanish than in English ( β = 0.74 , S E = 0.11 , t = 6.49 , p < 0.0001 ).
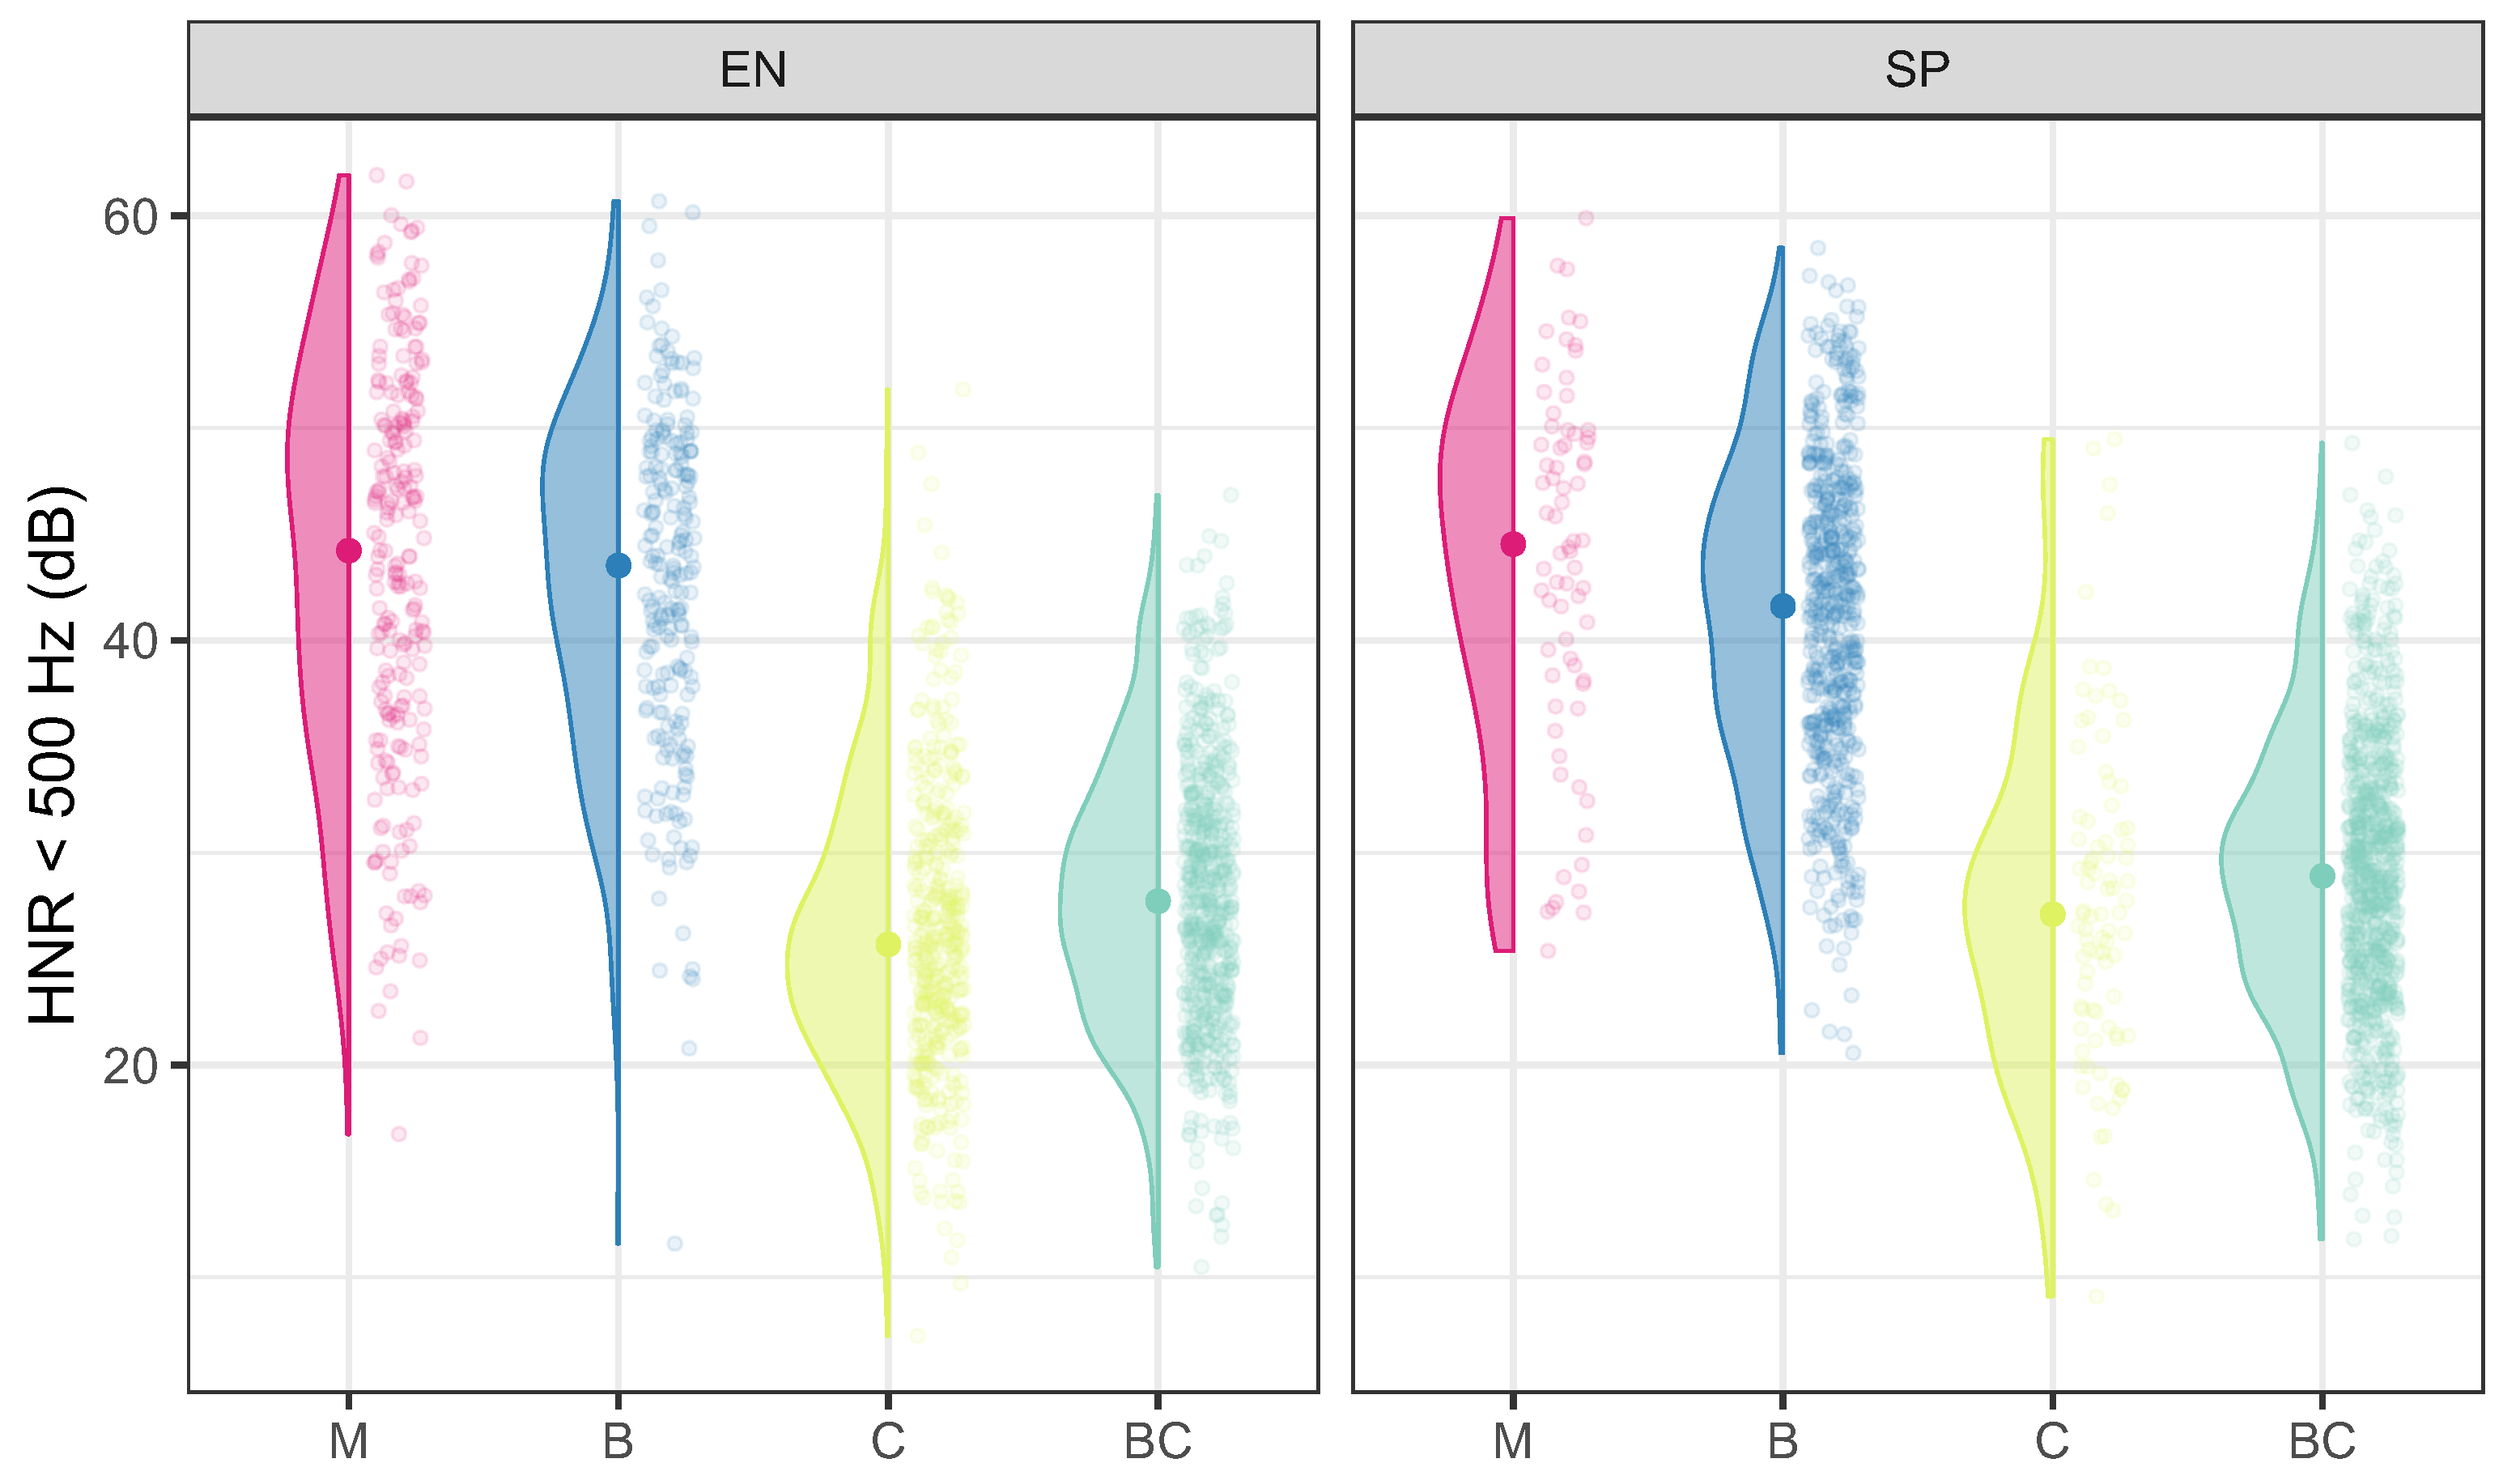
HNR <500 Hz is a measure of low-frequency noise, and thus is more sensitive to voicing irregularity than to aspiration noise. For English, all the non-modal phonation types have lower HNR than modal (modal vs. breathy: β = 0.21 , S E = 0.06 , t = 3.34 , p < 0.001 ; modal vs. creaky: β = 1.73 , S E = 0.05 , t = 33.24 , p < 0.0001 ; modal vs. breathy-creaky: β = 1.74 , S E = 0.05 , t = 32.83 , p < 0.0001 ). The differences between modal vs. breathy are not significantly different for Spanish but are larger for modal vs. creaky and breathy-creaky (modal vs. creaky: β = 0.31 , S E = 0.10 , t = 3.00 , p < 0.01 ; modal vs. breathy-creaky: β = 0.24 , S E = 0.09 , t = 2.76 , p < 0.001 ). No overall difference between languages is found.
Finally, the f0 data are shown in Figure 9, where f0 is plotted in semitones with reference to each speaker’s mean f0. For English, the f0 values for non-modal phonation types do not differ from modal. However, for Spanish, the differences between modal vs. non-modal voices are all significant (modal vs. breathy: β = 0.36 , S E = 0.15 , t = 2.36 , p < 0.05 ; modal vs. creaky: β = 0.38 , S E = 0.17 , t = 2.27 , p < 0.05 ; modal vs. breathy-creaky: β = 0.30 , S E = 0.14 , t = 2.10 , p < 0.05 ). Spanish also has an overall higher f0 ( β = 0.52, S E = 0.14 , t = 3.72 , p < 0.001 ).
In sum, all non-modal qualities are noisier than modal. All voice qualities—including modal and creaky—are produced with a spread-glottis configuration, as CQ values were generally lower than 0.5. Creaky vs. breathy-creaky tokens appear to have similar glottal configurations, with breathy-creaky tokens showing numerically greater overall noise (via lower CPP).

5. Discussion and Conclusions

In this study, we sought to describe utterance-final voice quality in bilingual speakers of English and Spanish from the San Diego-Tijuana border region. Despite the fact that many of our speakers spent much of their childhood in Baja California (Mexico), they were all either dominant in English or balanced bilinguals, as expected for a population that lives and works on the American side of the border. In line with our initial hypotheses, results showed that utterance-final creak is more common in English than in Spanish, and the opposite is true for utterance-final breath. Additionally, many utterances, especially in Spanish, end in a “breathy-creaky” quality, with characteristics associated with both creak (i.e. irregular and very low pitch) and breath (aspiration noise). Thus, we provide the first (to our knowledge) analysis of “phrase-final breath” in English and Spanish, and argue that both phrase-final breath and breathy-creaky final voice quality are widely attested in English–Spanish bilinguals’ speech. In fact, the extent to which the phenomena we call “phrase-final breath” and “phrase-final creak” are distinct, and (if they are indeed distinct) whether breathy-creaky tokens should be included as examples of either (or neither) of these phenomena, remains somewhat unclear.
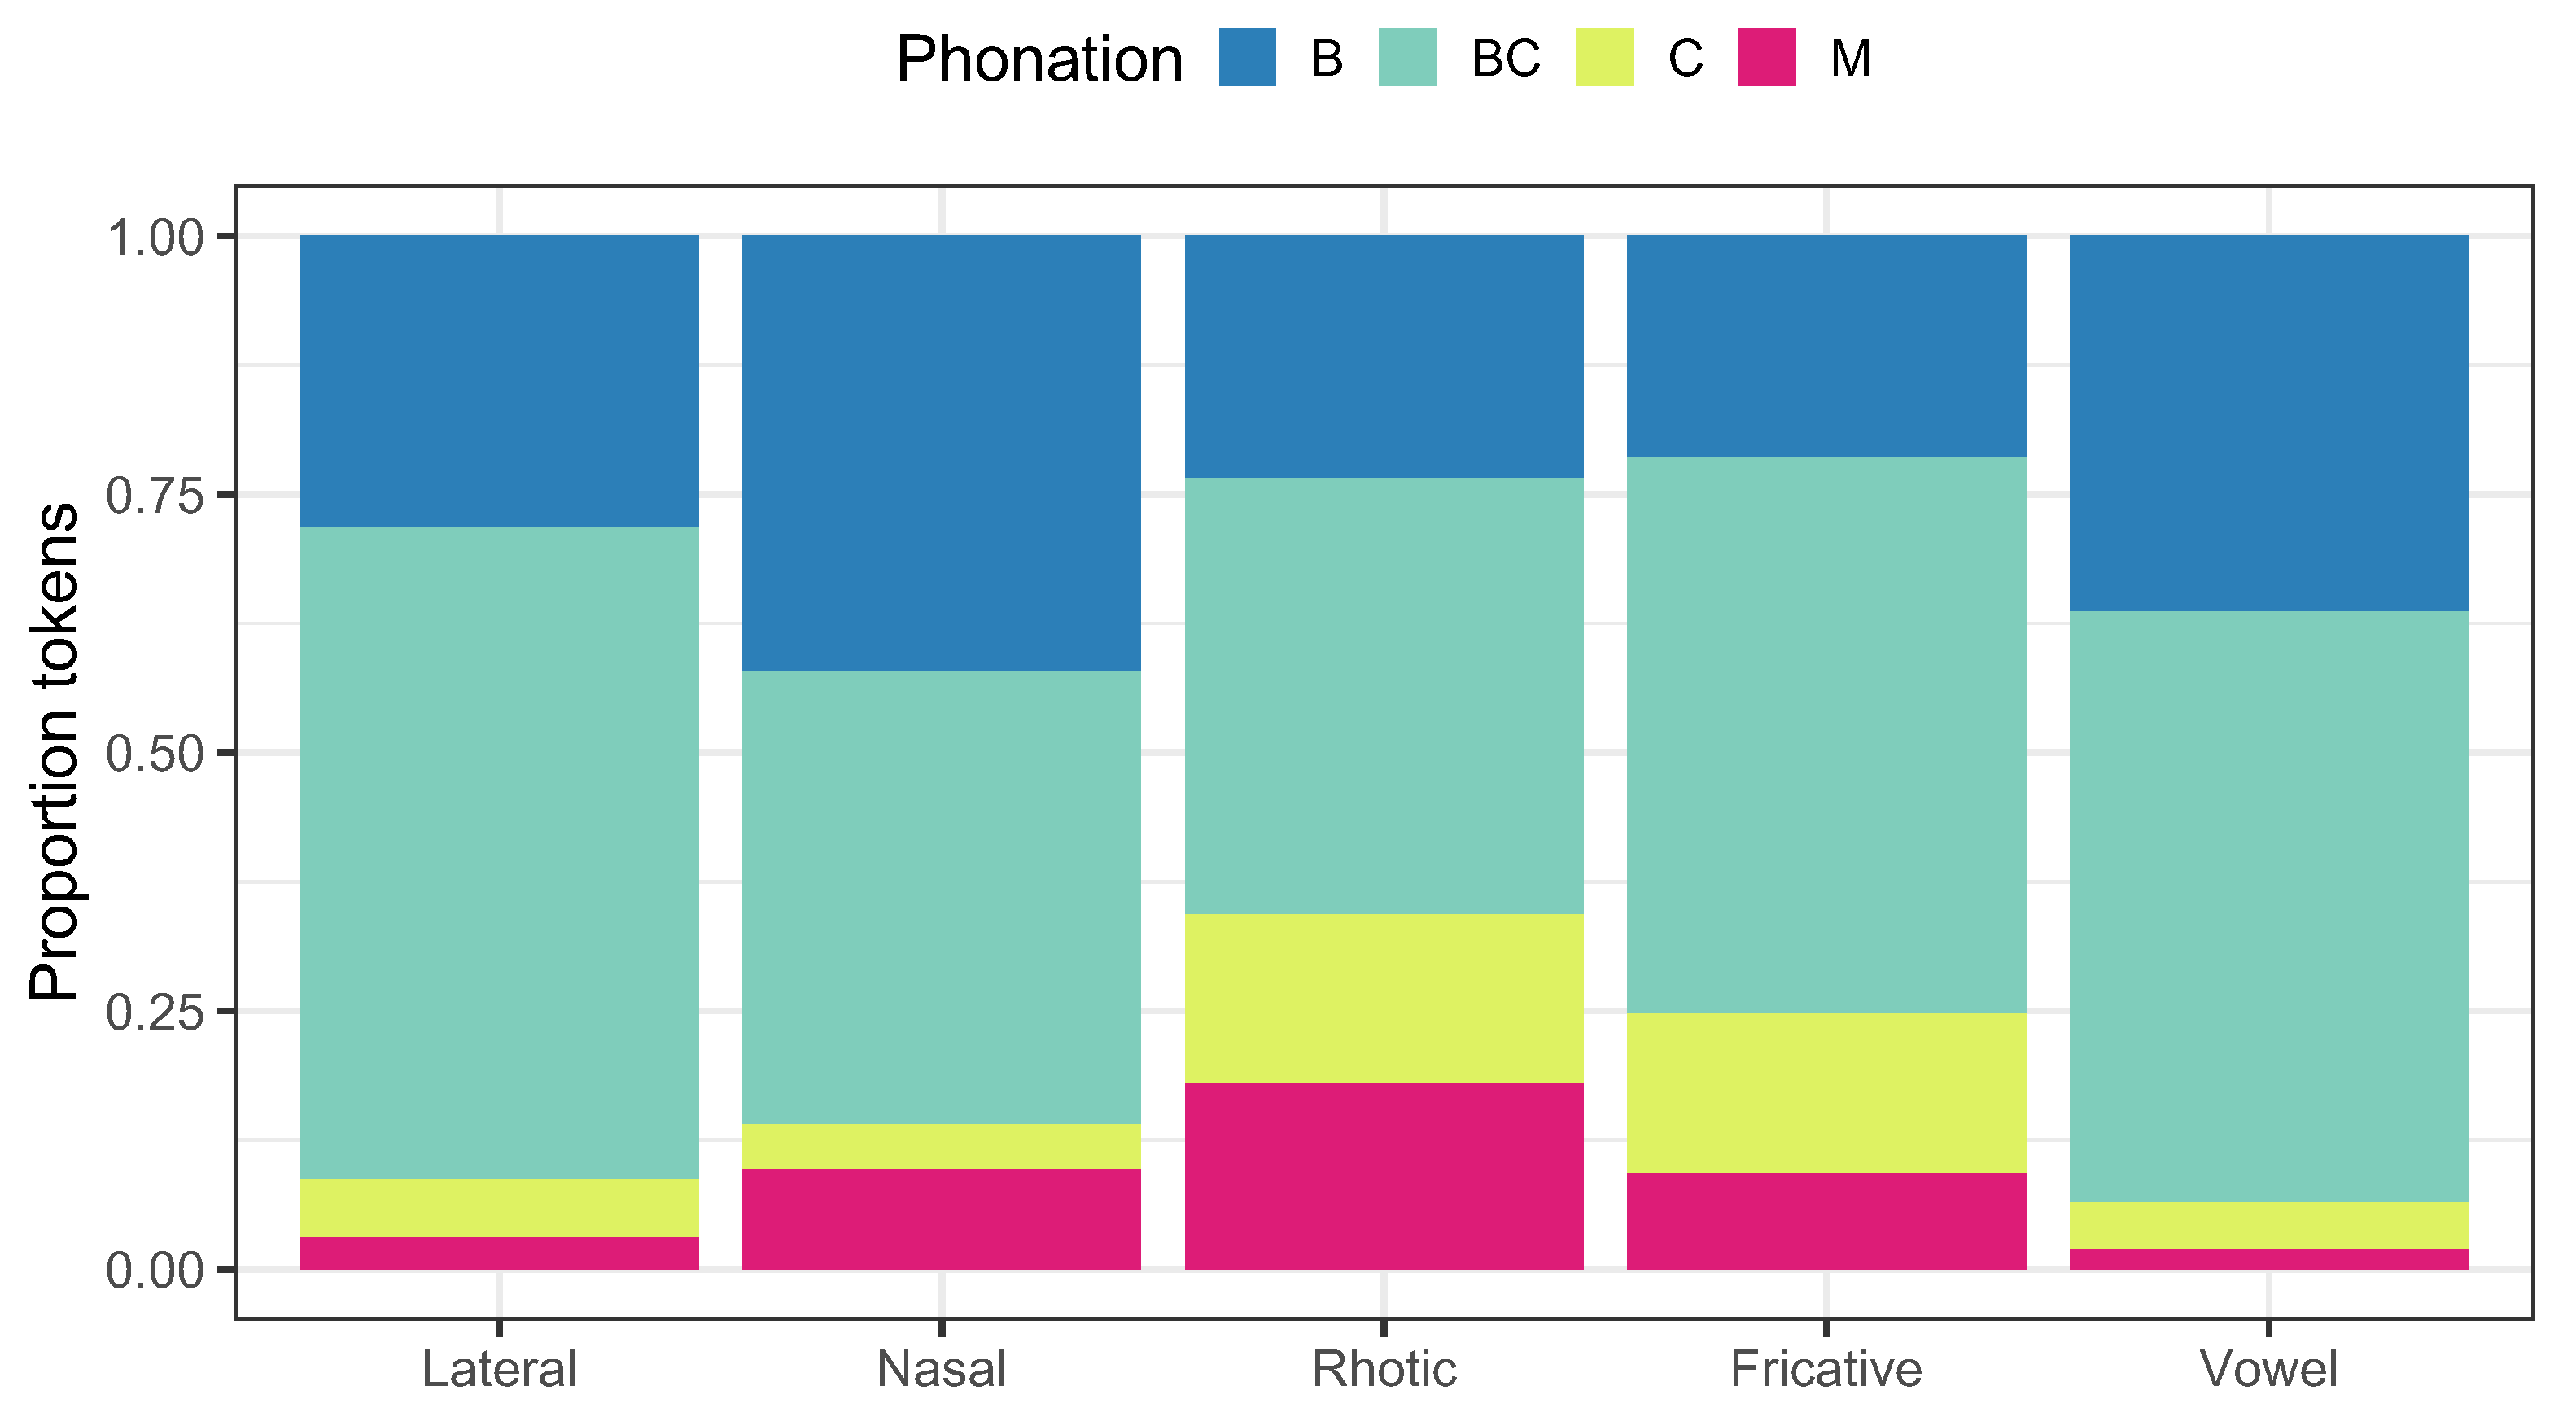
We hope that researchers will investigate the occurrence of phrase-final breath in more detail and in conjunction with phrase-final creak, especially for English and Spanish but also for other spoken languages. One interesting approach for future research on Spanish is to study how phrase-final breath interacts with sound-specific patterns of devoicing that are also attested. In Mexican Spanish for example, both vowels and /r/ can variably weaken in voicing or devoice (Avelino 2018; Dabkowski 2018). Do our results reflect these phonological processes? We believe the answer is no. Figure 10 shows the rate of occurrence of each coded voice quality as a function of the final segment in the utterance. Breathy and breathy-creaky voicing are by far the two most common phonation types, regardless of the final segment. Moreover, utterance-final rhymes ending in laterals, which are not described as undergoing devoicing in Spanish, have very similar proportions of breathy and breathy-creaky voice to utterance-final vowels, which are reported to devoice. Utterance-final rhymes ending in a fricative (which in our corpus was always /s/) or the ‘rhotic’ /r/ have lower rates of breathy(-creaky) voice than lateral-final utterances, despite the fact that vowels adjacent to /s/, and the /r/ itself, are attested as undergoing devoicing (Avelino 2018; Dabkowski 2018). Thus even if vowel and /r/ devoicing are treated as separate phenomena from utterance-final breath, breathy and breathy-creaky voice at ends of Spanish utterances do not reflect devoicing of these sounds alone. However, we hope that, in future work, researchers will ask to what extent vowel and /r/ devoicing in Spanish might be influenced by utterance-final breath. If utterance-final breath occurs regardless of the final segment, as suggested by our results, then future investigations into consonant and vowel devoicing in Spanish should either avoid utterance edges entirely, or better yet study these processes not in isolation, but by comparing them to the devoicing of all utterance-final sounds.
Contrary to our expectations, dominance did not affect the frequency of particular utterance-final voice qualities. Though they are unclear, some reasons for this might be that our sample was too small, and/or that it did not vary sufficiently. Most of the speakers in our sample varied between balanced bilinguals and more English-dominant bilinguals. It would be especially interesting then to follow this study up with a larger sample that includes more Spanish-dominant speakers currently living on the Mexican side of the border.
Our EGG and acoustic descriptions of the auditory qualities reveal some additional interesting findings. Had we only measured H1*–H2*, our results would have conformed to expectations: because “creaky” and “breathy-creaky” tokens have the lowest values of this measure, we might have been tempted to infer that the creaky voice involves greater glottal constriction. However, the CQ results disprove this: all non-modal qualities have low CQ, suggesting that the “creaky” tokens are produced consistently with spread-glottis creak (Keating et al. 2023; Slifka 2006), just like those coded as “breathy-creaky”. It is also possible that the overall low CQ values, even for “creaky” tokens, are due to the (presumed) presence of period doubling. If period doubling is common during creak, it likely involves an alternation between higher and lower CQ values (Huang 2023), which can result in mean CQ values being skewed lower than if the creak is produced with more glottal constriction. Although period-doubled voice was not coded for in this study, Huang (2023) found that it frequently occurs at utterance edges in Mandarin. This suggests that period doubling could be a common type of creaky voice utterance-finally in English and Spanish, and that it can give rise to lower CQ values due to the alternation between higher and lower CQ.
Although H1*–H2* and CQ are generally well correlated (Garellek 2014), the strength of the correlation is speaker-specific (Kreiman et al. 2012), and highly dependent (but not in a linear manner) on f0 (Kuang 2017). Thus a lower H1*–H2*, measured in the absence of articulatory data or other acoustic measures, does not imply greater glottal constriction and therefore creak (of any kind); even spread-glottis creak can show a lower value in this measure, despite the presence of glottal spreading. We therefore caution against drawing strong inferences about voice production from the acoustic signal alone, especially when the only measure being analyzed is H1*–H2* or another measure of spectral tilt. We also recommend that research on voice quality investigate both spectral tilt and noise measures (like CPP and HNR < 500 Hz), because when viewed together they have more explanatory power (Garellek 2019; Seyfarth and Garellek 2018).
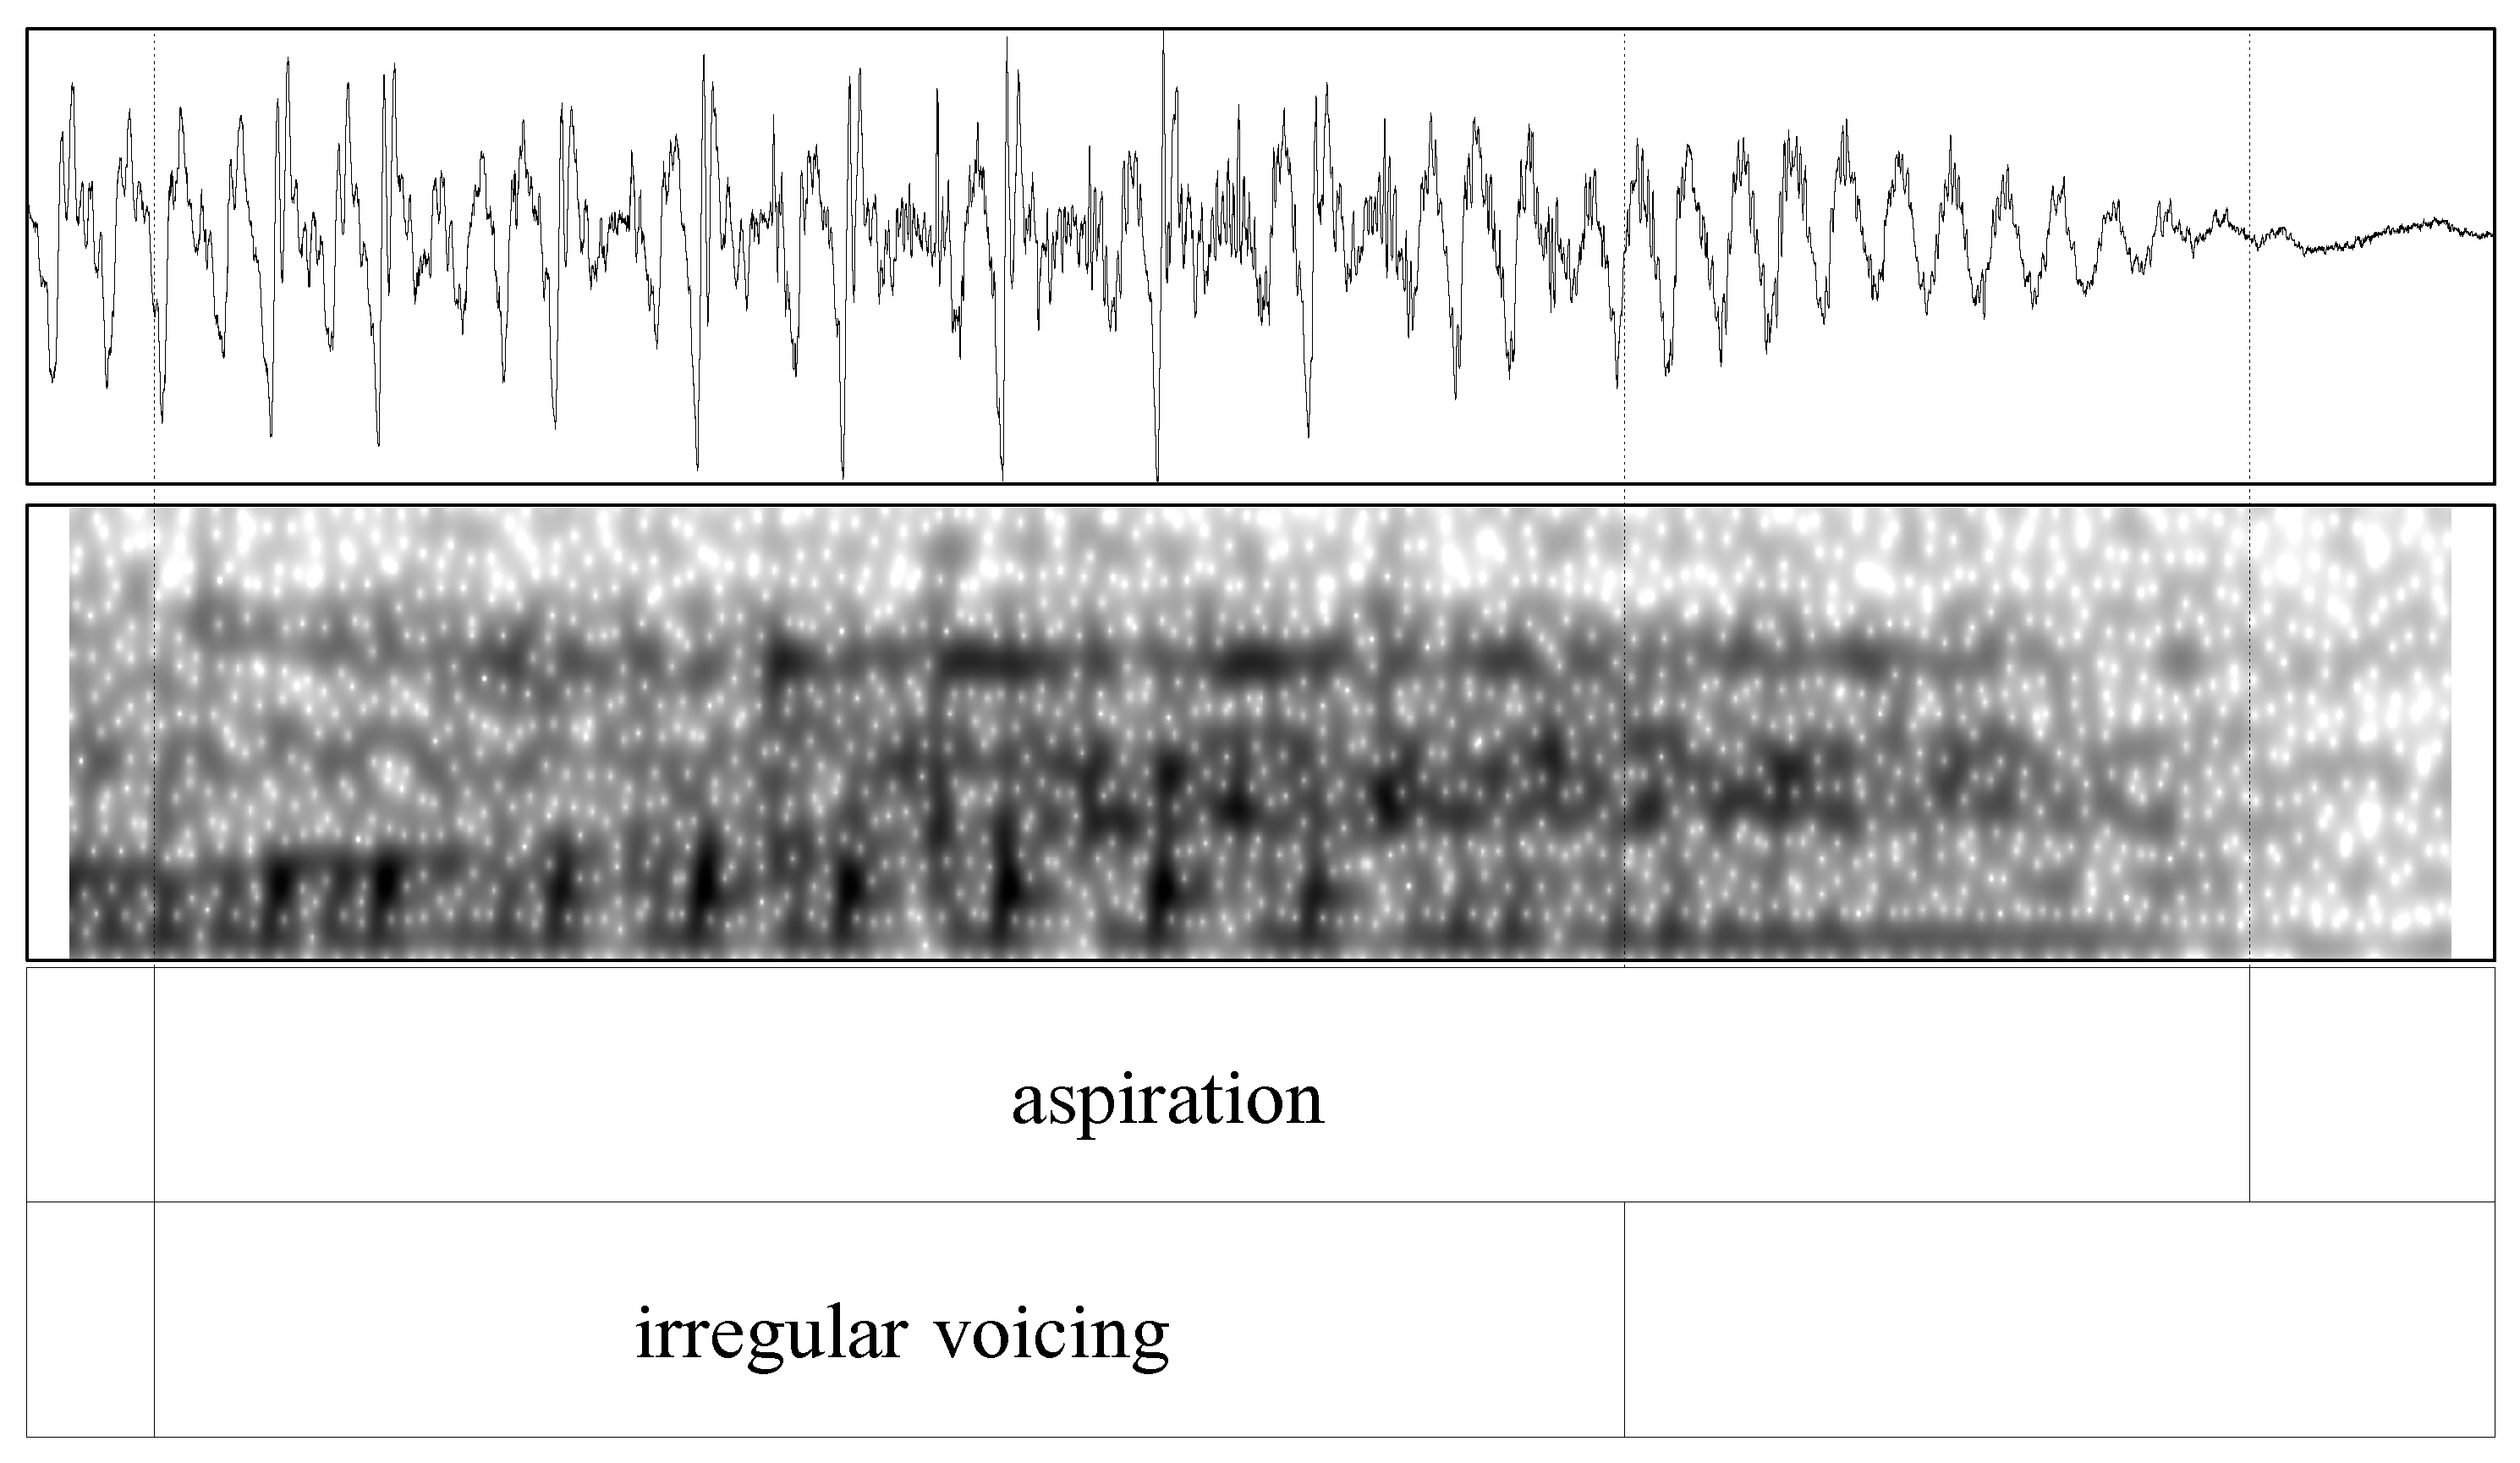
We end the paper with another word of caution to researchers of voice quality: had we only investigated phrase-final creak, we likely would have coded the “breathy-creaky” tokens as “creaky”. For example, let us consider the “breathy-creaky” token of the English word “more” spoken by F16, and shown in Figure 11. If this had been a study of phrase-final creak, the token would obviously have counted as “creaky”. Conversely, if this had been a study of phrase-final breath, this token would obviously have counted as “breathy”. In this study, we find that the “creaky” and “breathy-creaky” tokens have distinct acoustic characteristics, and very different rates of use by language: a breathy-creaky quality is more frequent in Spanish, and a creaky quality is more frequent in English. The most neutral decision then would be to code this token as “breathy-creaky”, or as both “breathy” and “creaky”. Thus, how tokens are classified depends on the research questions at hand, and consequently the researchers’ preconceptions about how voice quality can vary, as well as what variations in quality are of interest. When investigating creaky voice in any language, it is always worth bearing in mind that not all creak is alike (Keating et al. 2023), and that the different kinds of creaky voice can be linguistically structured in interesting ways, most of which have yet to be discovered.

Author Contributions

Conceptualization, C.D.-B., M.V.D. and M.G.; Data curation, C.D.-B.; Formal analysis, C.D.-B., M.V.D. and M.G.; Investigation, C.D.-B., M.V.D. and M.G.; Methodology, C.D.-B., M.V.D. and M.G.; Project administration, C.D.-B. and M.G.; Supervision, C.D.-B. and M.G.; Visualization, M.G.; Writing—original draft, C.D.-B., M.V.D. and M.G.; Writing—review & editing, C.D.-B., M.V.D. and M.G. All authors have read and agreed to the published version of the manuscript.

Funding

This research received no external funding.

Institutional Review Board Statement

The study was approved by the Institutional Review Board of UC San Diego (protocol 131094, last approved 29 March 2023).

Informed Consent Statement

Informed consent was obtained from all subjects involved in the study.

Data Availability Statement

Data from this project is available at https://osf.io/3udpe/, accessed on 5 February 2024.

Acknowledgments

We would like to thank Meghan Armstrong and Tim Face for the invitation to contribute an article for this special issue, and to two anonymous reviewers for their helpful feedback. We are grateful to the speakers who participated in the study, some of whom also helped with recruiting other speakers. For their assistance with the MINT Sprint protocol, we thank Tamar Gollan and Reina Mizrahi. We are also very grateful to Margaret Kasberger and Aaron Rasin for helping us segment and annotate the files.

Conflicts of Interest

The authors declare no conflict of interest.

Notes

1
“The d in absolute final position, followed by a pause is pronounced in a particularly weak and relaxed manner [...] voicing ceases almost at the same time as the linguodental contact is made; moreover, the airflow, preparing for the following pause, is usually so faint that in fact the articulation is almost silent” (translated by Marc Garellek).
2
The English and Spanish texts both came from https://www.thespanishexperiment.com/stories/redridinghood, accessed on 5 February 2024.
3
An initial exploration of the data revealed no effect of language order, so this factor was excluded in the reported models.

References

  1. Avelino, Heriberto. 2018. Mexico City Spanish. Journal of the International Phonetic Association 48: 223–30. [Google Scholar] [CrossRef]
  2. Becker, Kara, Sameer ud Dowla Khan, and Lal Zimman. 2022. Beyond binary gender: Creaky voice, gender, and the variationist enterprise. Language Variation and Change 34: 215–38. [Google Scholar] [CrossRef]
  3. Bird, Elizabeth, and Marc Garellek. 2019. Dynamics of voice quality over the course of the English utterance. In Proceedings of the 19th International Congress of Phonetic Sciences. Edited by Sasha Calhoun, Paola Escudero, Marija Tabain and Paul Warren. Canberra: Australasian Speech Science and Technology Association Inc., pp. 2406–10. [Google Scholar]
  4. Boersma, Paul, and David Weenink. 2024. Praat: Doing Phonetics by Computer [Computer Program]. Version 6.4.05. Available online: http://www.praat.org/ (accessed on 5 February 2024).
  5. Bolyanatz, Mariška. 2023. Creaky voice in Chilean Spanish: A tool for organizing discourse and invoking alignment. Languages 8: 161. [Google Scholar] [CrossRef]
  6. Bruyninckx, Marielle, Bernard Harmegnies, Joaquim Llisterri, and Dolors Poch-Oiivé. 1994. Language-induced voice quality variability in bilinguals. Journal of Phonetics 22: 19–31. [Google Scholar] [CrossRef]
  7. Cantor-Cutiva, Lady Catherine, Pasquale Bottalico, Jossemia Webster, Charles Nudelman, and Eric Hunter. 2023. The effect of bilingualism on production and perception of vocal fry. Journal of Voice 36: 970.e1–970.e10. [Google Scholar] [CrossRef] [PubMed]
  8. Dabkowski, Meghan Frances. 2018. Variable Vowel Reduction in Mexico City Spanish. Ph.D. Thesis, The Ohio State University, Columbus, OH, USA. [Google Scholar]
  9. Dallaston, Katherine, and Gerard Docherty. 2020. The quantitative prevalence of creaky voice (vocal fry) in varieties of English: A systematic review of the literature. PLoS ONE 15: e0229960. [Google Scholar] [CrossRef] [PubMed]
  10. Davidson, Lisa. 2020. The versatility of creaky phonation: Segmental, prosodic, and sociolinguistic uses in the world’s languages. Wiley Interdisciplinary Reviews: Cognitive Science 12: e1547. [Google Scholar] [CrossRef]
  11. de Krom, Guus. 1993. A cepstrum-based technique for determining harmonics-to-noise ratio in speech signals. Journal of Speech and Hearing Research 36: 254–66. [Google Scholar] [CrossRef]
  12. Eckert, Penelope, and Robert J. Podesva. 2021. Non-binary approaches to gender and sexuality. In The Routledge Handbook of Language, Gender, and Sexuality. Edited by Jo Angouri and Judith Baxter. Oxford and New York: Routledge, pp. 25–36. [Google Scholar] [CrossRef]
  13. Esling, John H., Scott R. Moisik, Allison Benner, and Lise Crevier-Buchman. 2019. Voice Quality: The Laryngeal Articulator Model. Cambridge: Cambridge University Press. [Google Scholar] [CrossRef]
  14. Farnetani, Edda, and Daniel Recasens. 2010. Coarticulation and connected speech processes. In The Handbook of Phonetic Sciences, 2nd ed. Edited by William J. Hardcastle, John Laver and Fiona E. Gibbon. Oxford: Wiley-Blackwell, pp. 316–52. [Google Scholar] [CrossRef]
  15. Garcia, Dalia L., and Tamar H. Gollan. 2022. The MINT Sprint: Exploring a fast administration procedure with an expanded multilingual naming test. Journal of the International Neuropsychological Society 28: 845–61. [Google Scholar] [CrossRef]
  16. Garellek, Marc. 2019. The phonetics of voice. In Routledge Handbook of Phonetics. Edited by William Katz and Peter Assmann. Oxford: Routledge, pp. 75–106. [Google Scholar] [CrossRef]
  17. Garellek, Marc. 2020. Acoustic discriminability of the complex phonation system in !Xóõ. Phonetica 77: 131–60. [Google Scholar] [CrossRef]
  18. Garellek, Marc. 2022. Theoretical achievements of phonetics in the 21st century: Phonetics of voice quality. Journal of Phonetics 94: 101155. [Google Scholar] [CrossRef]
  19. Garellek, Marc. 2014. Voice quality strengthening and glottalization. Journal of Phonetics 45: 106–13. [Google Scholar] [CrossRef]
  20. Garellek, Marc, Yuan Chai, Yaqian Huang, and Maxine Van Doren. 2023. Voicing of glottal consonants and non-modal vowels. Journal of the International Phonetic Association 53: 305–32. [Google Scholar] [CrossRef]
  21. Garellek, Marc, Patricia Keating, Christina M. Esposito, and Jody Kreiman. 2013. Voice quality and tone identification in White Hmong. Journal of the Acoustical Society of America 133: 1078–89. [Google Scholar] [CrossRef] [PubMed]
  22. Gibson, Todd A., Connie Summers, and Sydney Walls. 2017. Vocal fry use in adult female speakers exposed to two languages. Journal of Voice 31: 510.e1–510.e5. [Google Scholar] [CrossRef]
  23. González, Carolina, Christine Weissglass, and Daniel Bates. 2022. Creaky voice and prosodic boundaries in Spanish: An acoustic study. Studies in Hispanic and Lusophone Linguistics 15: 33–65. [Google Scholar] [CrossRef]
  24. Green, David W. 1998. Mental control of the bilingual lexico-semantic system. Bilingualism: Language and Cognition 1: 67–81. [Google Scholar] [CrossRef]
  25. Howard, David M. 1995. Variation of electrolaryngographically derived closed quotient for trained and untrained adult female singers. Journal of Voice 9: 163–72. [Google Scholar] [CrossRef] [PubMed]
  26. Huang, Yaqian. 2023. Phonetics of Period Doubling. Ph.D. Thesis, UC San Diego, La Jolla, CA, USA. [Google Scholar]
  27. Johnson, Khia A., and Molly Babel. 2023. The structure of acoustic voice variation in bilingual speech. Journal of the Acoustical Society of America 153: 3221–38. [Google Scholar] [CrossRef]
  28. Jun, Sun-Ah. 2005. Prosodic typology. In Prosodic Typology. Edited by Sun-Ah Jun. Oxford: Oxford University Press, pp. 430–58. [Google Scholar] [CrossRef]
  29. Kawahara, Hideki, Alain de Cheveigné, and Roy D. Patterson. 1998. An instantaneous-frequency-based pitch extraction method for high-quality speech transformation: Revised TEMPO in the STRAIGHT-suite. Paper presented at the 5th International Conference on Spoken Language Processing (ICSLP 1998), Paper 0659. Sydney, Australia, November 30–December 4. [Google Scholar]
  30. Keating, Patricia, Marc Garellek, and Jody Kreiman. 2015. Acoustic properties of different kinds of creaky voice. Paper presented at 18th International Congress of Phonetic Sciences, Glasgow, UK, August 10–14. [Google Scholar]
  31. Keating, Patricia, Jianjing Kuang, Marc Garellek, Christina M. Esposito, and Sameer ud Dowla Khan. 2023. A cross-language acoustic space for phonation distinctions. Language 99: 351–89. [Google Scholar] [CrossRef]
  32. Keating, Patricia A., Marc Garellek, Jody Kreiman, and Yuan Chai. 2023. Acoustic properties of subtypes of creaky voice. Paper presented at the Spring 2023 Meeting of the Acoustical Society of America, Chicago, IL, USA, May 8–12. [Google Scholar]
  33. Kendall, Tyler, Nicolai Pharao, Jane Stuart-Smith, and Charlotte Vaughn. 2023. Advancements of phonetics in the 21st century: Theoretical issues in sociophonetics. Journal of Phonetics 98: 101226. [Google Scholar] [CrossRef]
  34. Kim, Ji Young. 2017. Voice quality transfer in the production of Spanish heritage speakers and English l2 learners of Spanish. In Romance Languages and Linguistic Theory 11: Selected Papers from the 44th Linguistic Symposium on Romance Languages (LSRL), London, Ontario. Edited by Silvia Perpiñán, David Heap, Itziri Moreno-Villamar and Adriana Soto-Corominas. Amsterdam and Philadelphia: John Benjamins, pp. 191–207. [Google Scholar] [CrossRef]
  35. Kreiman, Jody, Bruce R. Gerratt, Marc Garellek, Robin Samlan, and Zhaoyan Zhang. 2014. Toward a unified theory of voice production and perception. Loquens 1: e009. [Google Scholar] [CrossRef] [PubMed]
  36. Kreiman, Jody, Yen-Liang Shue, Gang Chen, Markus Iseli, Bruce R. Gerratt, Juergen Neubauer, and Abeer Alwan. 2012. Variability in the relationships among voice quality, harmonic amplitudes, open quotient, and glottal area waveform shape in sustained phonation. Journal of the Acoustical Society of America 132: 2625–32. [Google Scholar] [CrossRef] [PubMed]
  37. Kuang, Jianjing. 2017. Covariation between voice quality and pitch: Revisiting the case of Mandarin creaky voice. Journal of the Acoustical Society of America 142: 1693–706. [Google Scholar] [CrossRef] [PubMed]
  38. Kuznetsova, Alexandra, Per Bruun Brockhoff, and Rune Haubo Bojesen Christensen. 2015. lmerTest: R Package Version 2.0-20. Available online: https://cran.r-project.org/package=lmerTest (accessed on 5 February 2024).
  39. Ladd, D. Robert. 2001. Intonation. In Language Typology and Language Universals: An International Handbook. Edited by Martin Haspelmath, Ekkehard König, Wulf Oesterreicher and Wolfgang Raible. Berlin and New York: de Gruyter, vol. 2, pp. 1380–90. [Google Scholar] [CrossRef]
  40. Ladefoged, Peter, and Norris P. McKinney. 1963. Loudness, sound pressure, and subglottal pressure in speech. Journal of the Acoustical Society of America 35: 454–60. [Google Scholar] [CrossRef]
  41. Lang, Benjamin. 2023. Reconstructing the perception of gender identity, sexual orientation, and gender expression in American English. In Proceedings of the 20th International Congress of the Phonetic Sciences. Edited by Radek Skarnitzl and Jan Volín. Prague: Guarant International, pp. 2552–56. [Google Scholar]
  42. Laver, John. 1980. The Phonetic Description of Voice Quality. Cambridge: Cambridge University Press. [Google Scholar]
  43. Montrul, Silvina. 2015. Dominance and proficiency in early and late bilingualism. In Language Dominance in Bilinguals: Issues of Measurement and Conceptualization. Edited by Carmen Silva-Corvalán and Jeanine Treffers-Daller. Cambridge: Cambridge University Press, pp. 15–35. [Google Scholar] [CrossRef]
  44. Navarro Tomás, Tomás. 1918. Manual de pronunciación española. Madrid: Centro de estudios históricos. [Google Scholar]
  45. Olson, Daniel J. 2013. Bilingual language switching and selection at the phonetic level: Asymmetrical transfer in VOT production. Journal of Phonetics 41: 407–20. [Google Scholar] [CrossRef]
  46. Piccinini, Page, and Amalia Arvaniti. 2019. Dominance, mode, and individual variation in bilingual speech production and perception. Linguistic Approaches to Bilingualism 9: 628–58. [Google Scholar] [CrossRef]
  47. Piccinini, Page Elizabeth. 2016. Cross-Language Activation and the Phonetics of Code-Switching. Ph.D. Thesis, UC San Diego, La Jolla, CA, USA. [Google Scholar]
  48. Podesva, Robert J., and Patrick Callier. 2015. Voice quality and identity. Annual Review of Applied Linguistics 35: 173–94. [Google Scholar] [CrossRef]
  49. Redi, Laura, and Stefanie Shattuck-Hufnagel. 2001. Variation in the realization of glottalization in normal speakers. Journal of Phonetics 29: 407–29. [Google Scholar] [CrossRef]
  50. Salgado, Hugo. 2023. New Voices for Ancestral Sounds: The Acquisition of Nawat Phonology by Speakers of Salvadoran Spanish. Ph.D. Thesis, The Ohio State University, Columbus, OH, USA. [Google Scholar]
  51. Seyfarth, Scott, and Marc Garellek. 2018. Plosive voicing acoustics and voice quality in Yerevan Armenian. Journal of Phonetics 71: 425–50. [Google Scholar] [CrossRef]
  52. Shue, Yen-Liang, Patricia A. Keating, Chad Vicenik, and Kristine Yu. 2011. VoiceSauce: A program for voice analysis. Paper presented at the International Congress of Phonetic Sciences, Hong Kong, China, August 17–21; pp. 1846–49. [Google Scholar]
  53. Simonet, Miquel. 2010. Dark and clear laterals in Catalan and Spanish: Interaction of phonetic categories in early bilinguals. Journal of Phonetics 38: 663–78. [Google Scholar] [CrossRef]
  54. Slifka, Janet. 2000. Respiratory Constraints on Speech Production at Prosodic Boundaries. Ph.D. Thesis, MIT, Cambridge, MA, USA. [Google Scholar]
  55. Slifka, Janet. 2006. Some physiological correlates to regular and irregular phonation at the end of an utterance. Journal of Voice 20: 171–86. [Google Scholar] [CrossRef] [PubMed]
  56. Sundara, Megha, Linda Polka, and Shari Baum. 2006. Production of coronal stops by simultaneous bilingual adults. Bilingualism: Language and Cognition 9: 97–114. [Google Scholar] [CrossRef]
  57. Todaka, Yuichi. 1993. A Cross-Language Study of Voice Quality: Bilingual Japanese and American English Speakers. Ph.D. thesis, UCLA, Los Angeles, CA, USA. [Google Scholar]
Figure 1. An example of the segmentation for voiced vs. devoiced utterance-final rhyme in two tokens of Spanish bosque by speaker F12. The top panel shows the audio waveform, followed by the spectrogram (showing up to 5000 Hz) and TextGrid. Both tokens show evidence of aspiration noise, and therefore both were coded as having a breathy voice quality. For both tokens, the final vowel was segmented based on the start and end of clear vowel formants; those formants are excited by both voicing and aspiration for the token on the left, but only by aspiration for the token on the right.
Languages 09 00070 g001
Figure 2. Sample clips of tokens rated as “modal” (a), “creaky” (b), “breathy” (c), and “breathy-creaky” (d), all from the same speaker (M01). In each panel the top figure is the EGG waveform, followed by the audio waveform and spectrogram. The TextGrid tier shows the labeled final syllable and the following breath.
Languages 09 00070 g002
Figure 3. Voice qualities by language, averaged over all speakers. ‘B’ = ‘breathy’, ‘BC’ = ‘breathy-creaky’, ‘C’ = ‘creaky’, and ‘M’ = ‘modal’.
Languages 09 00070 g003
Figure 4. Voice qualities by speaker and language. ‘B’ = ‘breathy’, ‘BC’ = ‘breathy-creaky’, ‘C’ = ‘creaky’, and ‘M’ = ‘modal’.
Languages 09 00070 g004
Figure 5. CQ by voice quality and language. Large dots represent the mean for each distribution. ‘B’ = ‘breathy’, ‘BC’ = ‘breathy-creaky’, ‘C’ = ‘creaky’, and ‘M’ = ‘modal’.
Languages 09 00070 g005
Figure 6. H1*–H2* by voice quality and language. Large dots represent the mean for each distribution. ‘B’ = ‘breathy’, ‘BC’ = ‘breathy-creaky’, ‘C’ = ‘creaky’, and `M’ = ‘modal’.
Languages 09 00070 g006
Figure 7. CPP by voice quality and language. Large dots represent the mean for each distribution. ‘B’ = ‘breathy’, ‘BC’ = ‘breathy-creaky’, ‘C’ = ‘creaky’, and ‘M’ = ‘modal’.
Languages 09 00070 g007
Figure 8. HNR < 500 Hz by voice quality and language. Large dots represent the mean for each distribution. ‘B’ = ‘breathy’, ‘BC’ = ‘breathy-creaky’, ‘C’ = ‘creaky’, and ‘M’ = ‘modal’.
Languages 09 00070 g008
Figure 9. F0 by voice quality and language. Large dots represent the mean for each distribution. ‘B’ = ‘breathy’, ‘BC’ = ‘breathy-creaky’, ‘C’ = ‘creaky’, and ‘M’ = ‘modal’.
Languages 09 00070 g009
Figure 10. Voice qualities by final segment in rhyme, for Spanish data only. ‘B’ = ‘breathy’, ‘BC’ = ‘breathy-creaky’, ‘C’ = ‘creaky’, and ‘M’ = ‘modal’.
Languages 09 00070 g010
Figure 11. Rhyme of English token “more” in utterance-final position, spoken by speaker F16. The rhyme has largely overlapping aspiration noise and voicing irregularity, and as such was labeled here as “breathy-creaky”.
Languages 09 00070 g011
Table 1. Participant information. More English-dominant speakers have higher MINT scores, whereas more balanced bilinguals have scores close to 0. (Slight) negative scores indicate (slightly) more Spanish-dominant speakers.
ParticipantAgeArea Raised
0–7/7–14
MINT Score
(English–Spanish)
F0119US/US16
F0218US/US–9
F0328US, MEX/US0
F0421MEX/MEX–5
F0520MEX/US8
F0620US/US43
F0720US/US15
M0118MEX/MEX1
F0820US/US12
F0922US/US40
M0218US/US31
F1030US, MEX/US, MEX0
F1119US/US26
F1225MEX/MEX–9
M0322MEX/US15
F1318US/US30
F1419MEX, US/US35
F1525US/US13
F1618US/US31
F1725US/US33
M0421US/US25
Disclaimer/Publisher’s Note: The statements, opinions and data contained in all publications are solely those of the individual author(s) and contributor(s) and not of MDPI and/or the editor(s). MDPI and/or the editor(s) disclaim responsibility for any injury to people or property resulting from any ideas, methods, instructions or products referred to in the content.