1. Introduction
Speech perception is not solely an auditory phenomenon but an auditory–visual (AV) process. This was first empirically demonstrated in noisy listening conditions by
Sumby and Pollack (
1954), and later in clear listening conditions by what is called the McGurk Effect (
McGurk and MacDonald 1976). In a typical demonstration of the McGurk effect, the auditory syllable /ba/ dubbed onto the lip movements for /ga/ is often perceived as /da/ or /tha/ by most native English speakers. This illusory effect unequivocally shows that speech perception involves the processing of visual speech information in the form of orofacial (lip and mouth) movements. Not only did
McGurk and MacDonald (
1976) demonstrate the role of visual speech information in clear listening conditions, but more importantly, it has come to be used as a widespread research tool that measures the degree to which visual speech information influences the resultant percept—the degree of auditory–visual speech integration. The effect is stronger in some language contexts than others (e.g.,
Sekiyama and Tohkura 1993), showing considerable inter-language variation. In some languages, such as English, Italian (
Bovo et al. 2009), and Turkish (
Erdener 2015), the effect is observed robustly, but in some others such as Japanese and Mandarin (
Sekiyama and Tohkura 1993;
Sekiyama 1997; also
Magnotti et al. 2015) it is not observed so readily. However, most, if not all, cross-language research in auditory–visual speech perception shows that the effect is stronger when we attend to a foreign or unfamiliar language rather than our native language. This demonstrates that the system uses more visual speech information to decipher unfamiliar speech input than for a native language. Further, there are cross-language differences in the strength of the McGurk effect (e.g.,
Sekiyama and Burnham 2008;
Erdener and Burnham 2013) coupled with developmental factors such as language-specific speech perception (see
Burnham 2003). The degree to which visual speech information is integrated into the auditory information also appears to be a function of age. While the (in)coherences between the auditory and visual speech components are detectable in infancy (
Kuhl and Meltzoff 1982), the McGurk effect itself is also evident in infants (
Burnham and Dodd 2004;
Desjardins and Werker 2004). Furthermore, the influence of visual speech increases with age (
McGurk and MacDonald 1976;
Desjardins et al. 1997;
Sekiyama and Burnham 2008). This age-based increase appears to be a result of a number of factors such as language-specific speech perception—the relative influence of native over non-native speech perception (
Erdener and Burnham 2013).
Unfortunately, there is a paucity of research in how AV speech perception occurs in the context of psychopathology. In the domain of speech pathology and hearing, we know that children and adults with hearing problems tend to utilize visual speech information more than their hearing counterparts in order to enhance the incoming speech input (
Arnold and Köpsel 1996). Using McGurk stimuli,
Dodd et al. (
2008) tested three groups of children: those with delayed phonological acquisition, those with phonological disorder and those with normal speech development. The results showed that children with phonological disorder had greater difficulty in integrating auditory and visual speech information. These results show that the extent to which visual speech information is used has the potential to be used as an additional diagnostic and prognostic metric in the treatment of speech disorders. However, how AV speech integration occurs in those with mental disorders is almost completely uncharted territory. Some scattered studies presented below with no clear common focus were reported recently. The studies that had recruited participants with mental disorders or developmental disabilities consistently demonstrated a lack of integration of auditory and visual speech information (see below). Uncovering the mechanism of the integration between auditory and visual speech information in these special populations is of particular importance for both pure and applied sciences, not least with the potential to provide us with additional behavioural criteria and diagnostic and prognostic tools.
In one of the very few AV speech perception studies with clinical cases, schizophrenic patients showed difficulty in integrating visual and auditory speech information and the amount of illusory experience was inversely related to age (
Pearl et al. 2009;
White et al. 2014). These AV speech integration differences between healthy and schizophrenic perceivers were shown to be salient at a cortical level as well. It was, for instance, demonstrated that while silent speech (i.e., a VO speech or lip-reading) condition activated the superior and inferior posterior temporal areas of the brain in healthy controls, the activation in these areas in their schizophrenic counterparts was significantly less (
Surguladze et al. 2001; also see
Calvert et al. 1997). In other words, while silent speech was perceived as speech by healthy individuals, seeing orofacial movements in silent speech was not any different than seeing any other object or event visually. The available—but limited—evidence also suggests that the problem in AV speech integration in schizophrenics was due to a dysfunction in the motor areas (
Szycik et al. 2009). Such AV speech perception discrepancies were also found in other mental disorders. For instance,
Delbeuck et al. (
2007) reported deficits in AV speech integration in Alzheimer’s disease patients, and with a sample of Asperger’s syndrome individuals,
Schelinski et al. (
2014) found a similar result. In addition,
Stevenson et al. (
2014) found that the magnitude of deficiency in AV speech integration was relatively negligible at earlier ages, with the difference becoming much greater with increasing age. A comparable developmental pattern was also found with a group of children with developmental language disorder (
Meronen et al. 2013). In this investigation we attempted to study the process of AV speech integration in the context bipolar disorder—a disorder characterized by alternating and contrastive episodes of mania and depression. While those bipolar individuals in the manic stage can focus on tasks at hand in a rather excessive and extremely goal-directed way, those in the depressive episode display behavioural patterns that are almost completely the opposite (
Goodwin and Sachs 2010). The paucity of data from clinical populations prevents us from advancing literature-based, clear-cut hypotheses. So we adopted the following approach: (1) to preliminarily investigate the status of AV speech perception in bipolar disorder; and (2) to determine whether, if any, differences exist between bipolar-disordered individuals in both manic and depressive episodes. Arising from this approach, we hypothesized that: (1) based on previous research with other clinical groups, the control group here should give more visually-based/integrated responses to the AV McGurk stimuli than their bipolar-disordered counterparts; and (2) if the auditory and visual speech information are fused at behavioural level as a function of attentional focus and excessive goal-directed behaviour (
Goodwin and Sachs 2010), then bipolar participants in the manic episode should give more integrated responses than the depressive sub-group. We based this latter hypothesis also on the anecdotal evidence (in the absence of empirical observations about attentional processes in bipolar disorder), as reported by several participants, that patients are almost always focused on tasks of interest when they go through a manic episode, whereas they report relatively impoverished attention to tasks during the depressive phase of the disorder.
3. Results
Two sets of statistical analyses were conducted in this study: a comparison of disordered and control groups by means of a t-test analysis, and a comparison of the disordered subgroups, namely those with bipolar disorder going through manic versus depressive stages versus the control group using the non-parametric Kruskal–Wallis test due to small sample size. Statistical analyses were conducted using IBM SPSS 24 (IBM, Armonk, NY, USA).
3.1. The t-Test Analyses
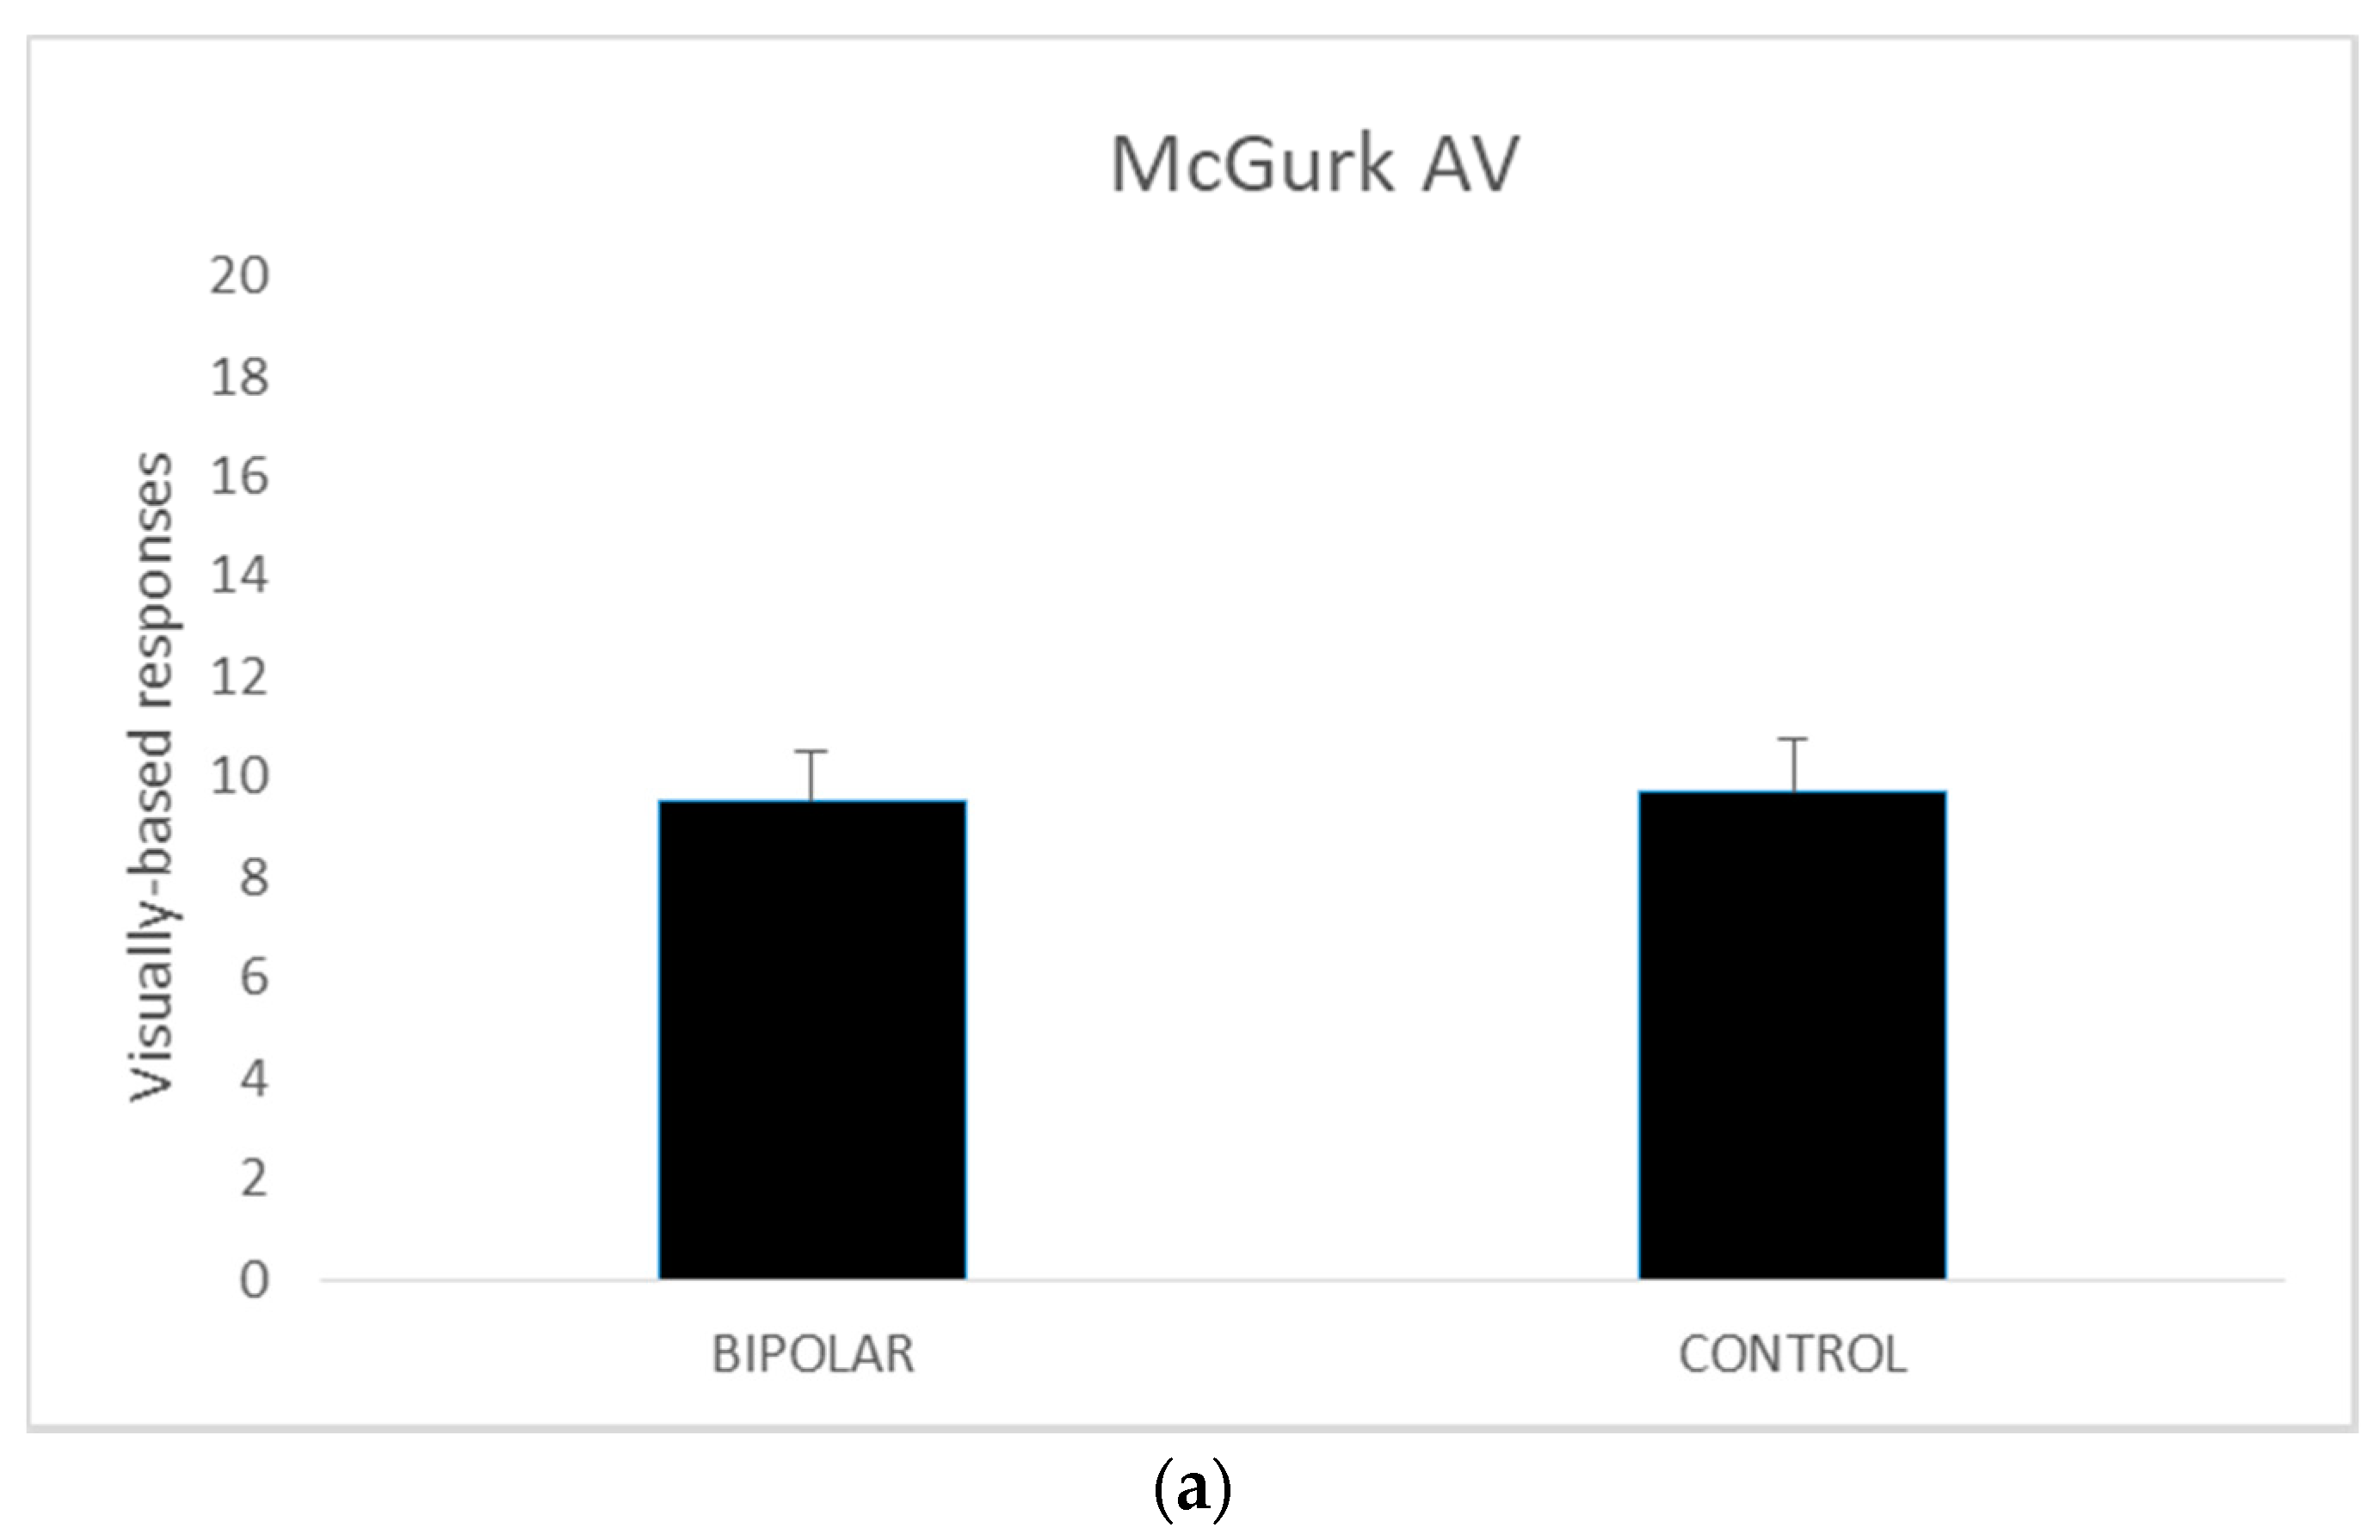
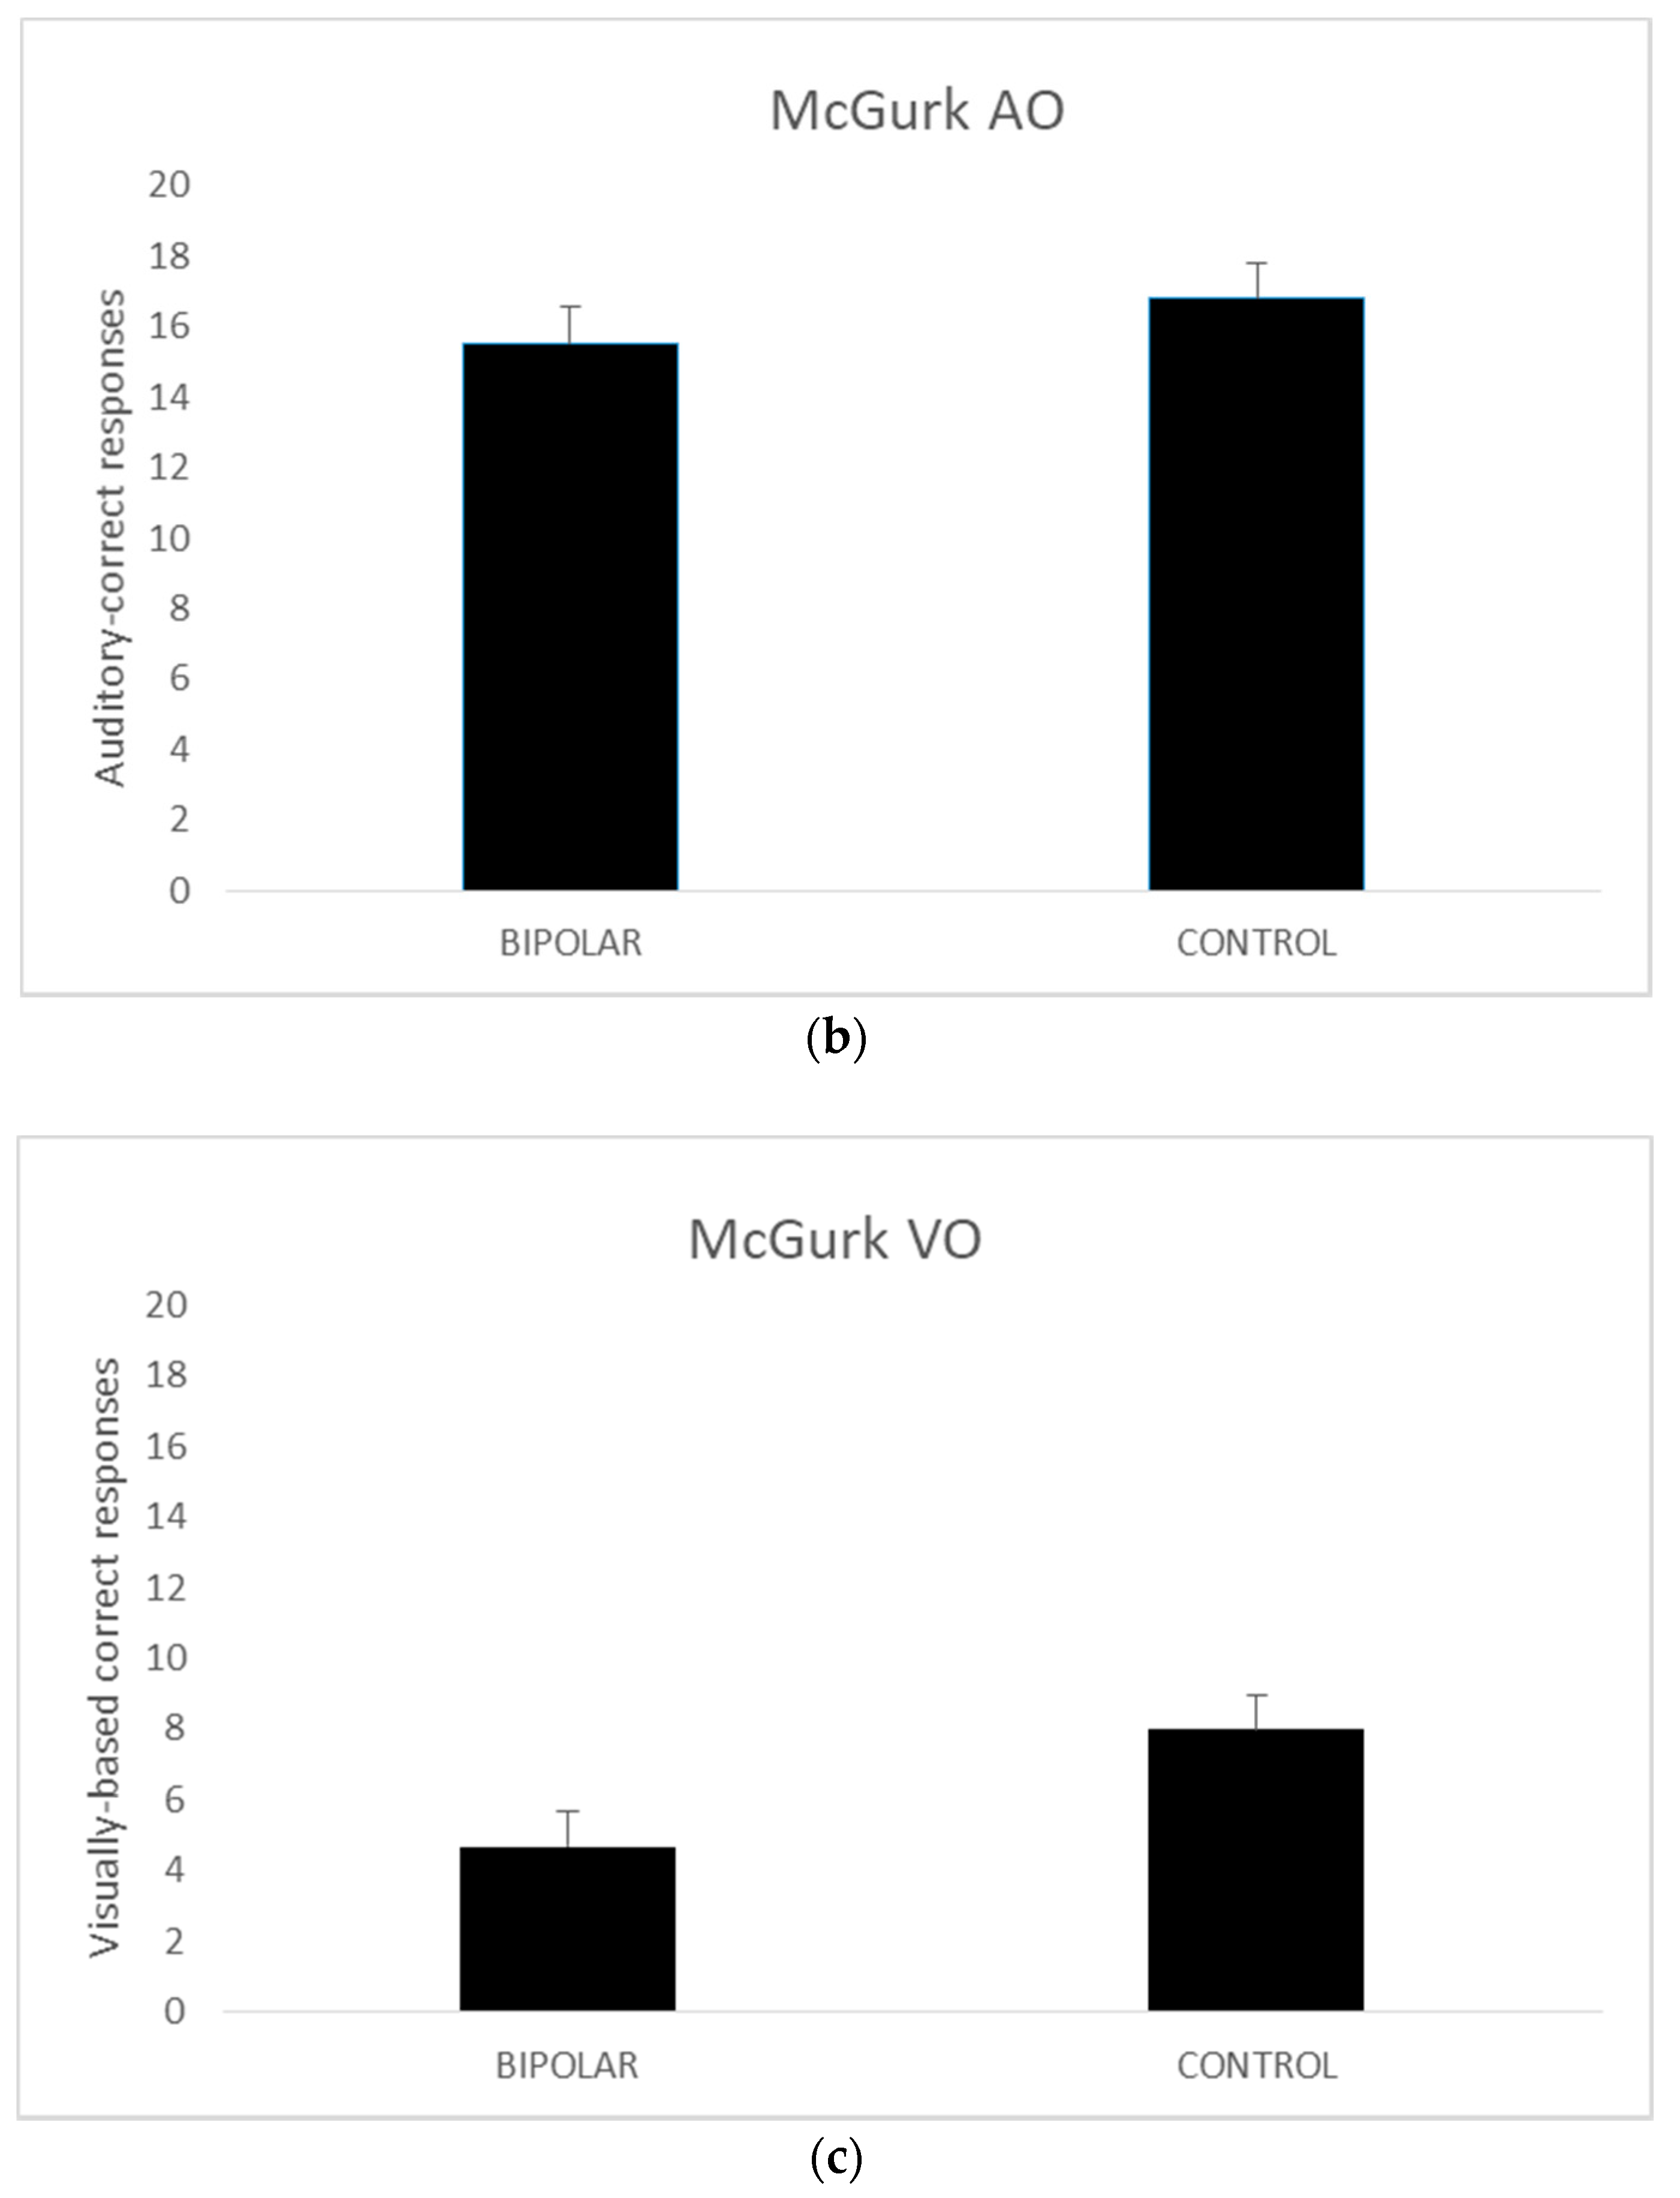
A series of independent t tests were conducted on AV, AO, and VO scores comparing the bipolar-disordered and the control groups. The homogeneity of variance assumptions as per Levene’s test for equality of variances was met for all except McGurk AO scores (p = 0.029).
Thus, for the AO variable the values when equal variances were not met are reported. The results revealed no significant differences between the disordered and control groups in terms of the AV (
t (42) = 0.227,
p = 0.82) and AO scores (
t (35.602) = −0.593,
p = 0.56). However, in the VO condition, the control group performed better than their disordered counterparts (
t (42) = −2.882,
p <0.005). The mean scores for these measures are presented in
Figure 1.
3.2. The Kruskall-Wallis Test
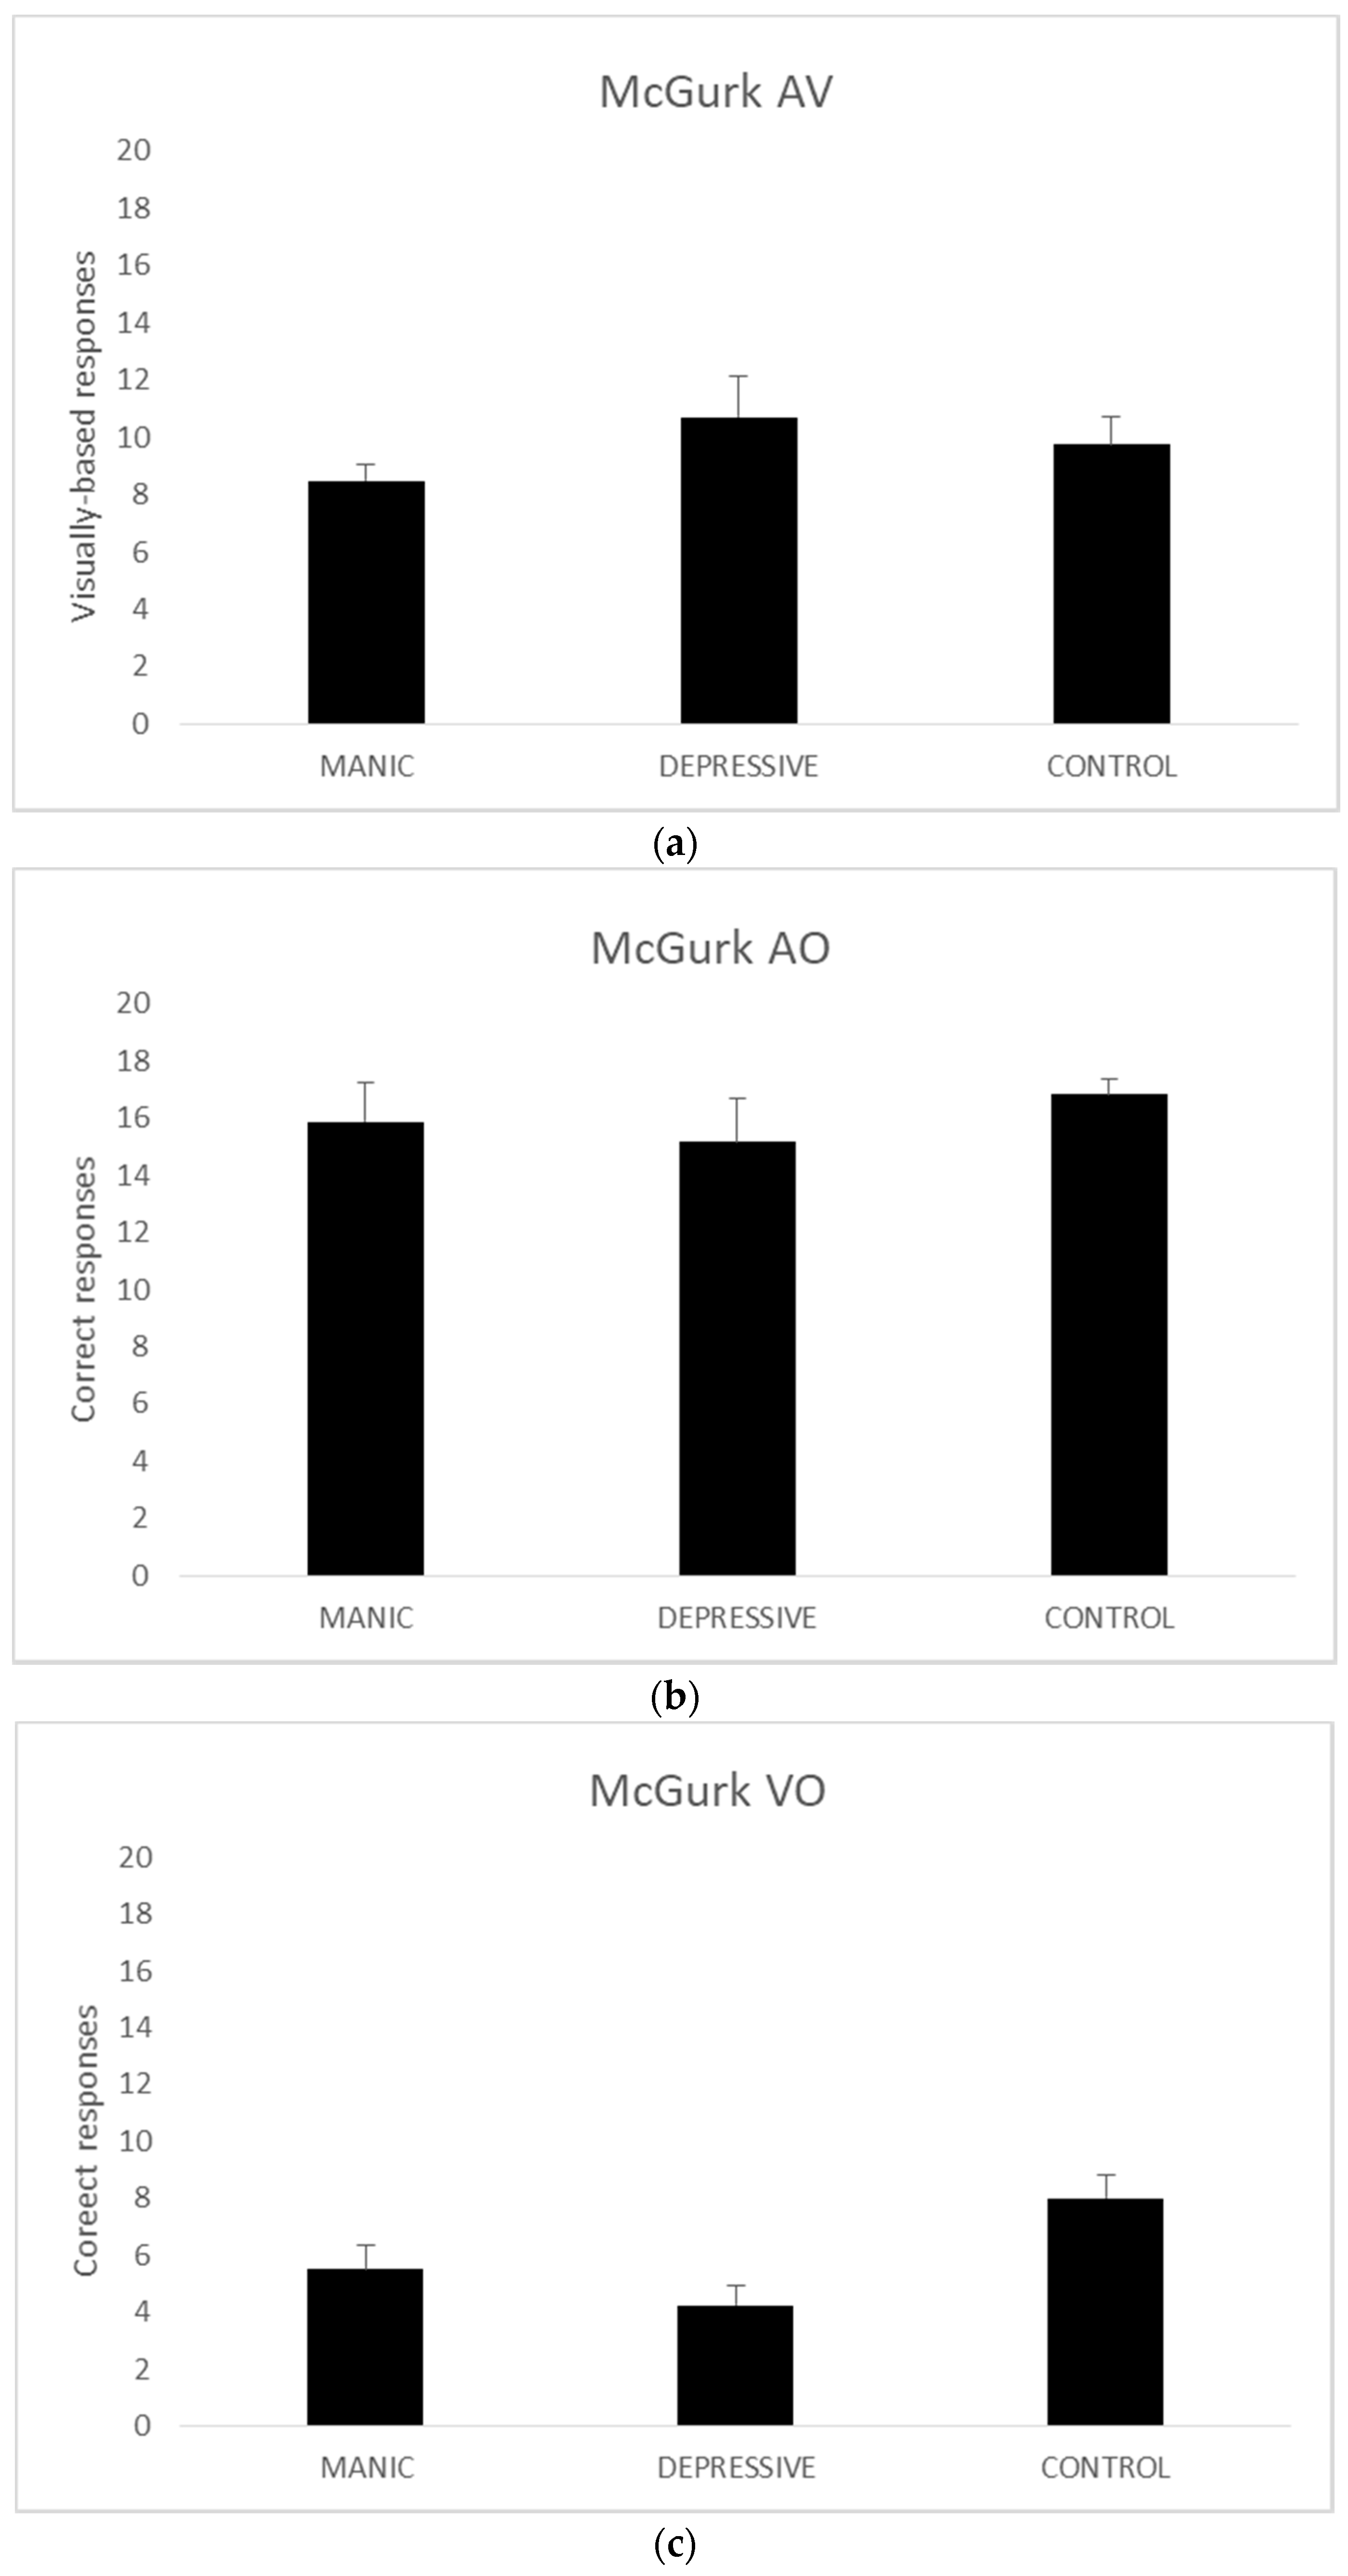
Given the small sample size of groups (n < 30), we resorted to three Kruskal–Wallis nonparametric tests to analyse the AV, AO, and VO scores. The analyses of AV (χ2 (2, n = 44) = 0.804, p = 0.669) and AO (χ2 (2, n = 44) = 0.584, p = 0.747) scores revealed no significant results.
The Kruskal–Wallis analysis of the VO scored produced significant group differences (
χ2 (2,
n = 44) = 7.665,
p = 0.022). As there are no post-hoc alternatives for the Kruskal–Wallis test, we ran two Mann–Whitney U tests with VO scores. The comparison of VO scores between manic and depressive bipolar groups (
z (
n = 22) = −0.863,
r2 = 0.418) and manic bipolar and the control groups failed to reach significance (
z (
n = 34) = −1.773,
r2 = 0.080). The third Mann–Whitney U comparison between the depressive bipolar and the control groups, on the other hand, showed a significant difference (
z (
n = 32) = −2.569,
r2 = 0.009).
Figure 2 presents the mean data for each group on all measures.
4. Discussion
It was hypothesized that the bipolar disorder group would be less susceptible to the McGurk effect and therefore to exhibit integration of auditory and visual speech information to a lesser extent compared to the healthy control group. Furthermore, the bipolar manic group was predicted to integrate auditory and visual speech information to a greater extent than their depressive phase counterparts if the AV speech integration was a process occurring at the behavioural level requiring attentional resource allocation. The findings of this study did not support the main hypothesis that there was no significant difference between the control group and the bipolar group in terms of the degree of AV speech integration. Group-based differences were not observed with the AO stimuli. On the other hand, lending partial support to the overall hypotheses, the control group performed overwhelmingly better than the bipolar group in the depressive episode, yet the manic group did not differ significantly from the control group—as demonstrated in the analyses of both combined and separated bipolar groups’ data—with the VO condition, virtually a lip-reading task. Further, the disordered subgroups did not differ from each other significantly on any of the measures. To sum up, the only significant result was the observation that the control group performed significantly better than the depressive episode bipolar group in the VO condition but not in either of the AO or AV conditions as had been predicted. Although this seems to present an ambiguous picture—surely warranting further scrutiny—these results present us with a number of intriguing possibilities for interpretation. These are presented below.
In a normal integration process of auditory and visual speech information the stimuli coming from these two modalities are integrated on a number of levels such as the behavioural (i.e., phonetic vs. phonological levels of integration; see
Bernstein et al. 2002) or cortical (
Campbell 2007) levels. Given the finding that the control group did not differ from the disordered groups with respect to the integration of auditory and visual speech information and AO information but did on the VO information leaves us with the question as to why the visual-only (or lip-reading) information acts differently in the disordered group in general.
Given the fact that there was no difference between the groups—disordered or not—with respect to AV speech integration, it seems that visual information is somehow integrated with the auditory information to a resultant percept whether the perceiver is disordered or not. This may suggest the source of the integration is not limited to behavioural level but also to cortical and/or other levels, thus calling for further scrutiny on multiple levels. That is, we need to look at both behavioural and cortical responses to the AV stimuli to understand how integration works in bipolar individuals. There are suggestions and models in the literature that explain how the AV speech integration may be in the non-disordered population. Some studies claim that integration occurs at the cortical level, independent of other levels (
Campbell 2007), while some others argue in favour of a behavioural emphasis for the integration process, that is, phonetic (e.g.,
Burnham and Dodd 2004) vs. phonological in which the probabilistic values of auditory and visual speech inputs are weighted out, for example in Massaro’s Fuzzy Logical Model of Perception in which both auditory and visual signals are evaluated on the basis of their probabilistic values, and then integrated based on those values leading to a percept (e.g.,
Massaro 1998). However insofar as the fact that no difference between the disordered and control group responses to the AV and AO stimuli is present here, no known models seem to explain the differences in VO performances between (and amongst) these groups.
Thus, how do bipolar disordered perceivers, unlike people with other disorders such as schizophrenia (
White et al. 2014) or Alzheimer’s disease (
Delbeuck et al. 2007) still integrate auditory and visual speech information whilst having difficulty perceiving VO speech information (or lipreading)? On the basis of the data we have here, one can think of three broad possibilities as to how AV speech integration occurs, yet the visual speech information alone fails to be processed. One possibility is that, given that speech perception is primarily an auditory phenomenon, the visual speech information is carried somehow alongside the auditory information without any integrative process, as some data suggest in auditory-dominant models (
Altieri and Yang 2016). One question that remains with respect to the perception of AV speech in the bipolar disorder context is how the visual speech information is integrated. It appears that, given the relative failure of visual-only speech processing in bipolar disordered individuals, further research is warranted to unearth the mechanism through which the visual speech information is eventually and evidently integrated.
Such mechanisms are, as we have so far seen in AV speech perception research, multi-faceted, thus calling for multi-level scrutiny, e.g., investigations at both behavioural and cortical levels. The finding that the non-disordered individuals treat VO speech information as a speech input whilst the bipolar individuals do not seem to (at least in relative terms), raises the question whether, in fact, bipolar individuals have issues with the visual speech input per se. Given the fact that there was no difference with respect to the AV stimuli, the auditory dominance models (e.g.,
Altieri and Yang 2016) may account for a possibility that visual speech information arriving with auditory speech information is somehow undermined, but the resultant percept is still there, as is the case with the non-disordered individuals. In fact, VO speech input is treated as speech in healthy population. Using the MRI imaging technique, Calvert and colleagues demonstrated that VO (lip-read) speech without any auditory input activated several areas of the cortex in which activation is normally associated with auditory speech input, particularly with superior temporal gyrus. Even more intriguingly, they also found that no speech-related areas were active in response to faces performing non-speech movements (
Calvert et al. 1997). Thus, VO information is converted to an auditory code in healthy individuals, and as far as our data seem to suggest, at a behavioural level this does not occur in bipolar individuals. On the basis of our data and Calvert et al.’s findings, we may suggest (or speculate) that the way visual speech information is integrated in bipolar individuals is most likely different to the way it occurs in healthy individuals due to the different behavioural and/or cortical processes engaged. In order to understand how visual information is processed, we need both behavioural and cortical data to be obtained in real time, simultaneously, and in response to the same AV stimuli.
An understanding of how visual speech information is processed both with and without auditory input will provide us with a better understanding of how speech perception processes occur in this special population and thus will pave the way to developing finer criteria for both diagnostic and prognostic processes.
Unfortunately, for reasons beyond our control we had limited time and resources, thus limiting us to a small sample size. However, still, the data we present allow us to make the following hypothesis for subsequent studies: given the impoverished status of VO speech perception in the bipolar groups while still yielding eventual AV speech integration, a compensatory mechanism at both the behavioural and cortical levels may be at work. In order to understand this mechanism, as we have just suggested, responses to McGurk stimuli at both the behavioural and cortical levels must be obtained via known as well as new-type auditory–visual speech stimuli (
Jerger et al. 2014).


