Article

Distribution and Timing of Verbal Backchannels in Conversational Speech: A Quantitative Study

by
Michael Paierl
1,*,
Anneliese Kelterer
2 and
Barbara Schuppler
1
1
Signal Processing and Speech Communication Laboratory, Graz University of Technology, 8010 Graz, Austria
2
Department of Linguistics, University of Graz, 8010 Graz, Austria
*
Author to whom correspondence should be addressed.
Languages 2025, 10(8), 194; https://doi.org/10.3390/languages10080194
Submission received: 15 April 2025 / Revised: 17 July 2025 / Accepted: 31 July 2025 / Published: 15 August 2025
(This article belongs to the Special Issue Current Trends in Discourse Marker Research)

Abstract

This paper explores backchannels, short listener responses such as “mhm”, which play an important role in managing turn-taking and grounding in spontaneous conversation. While previous work has largely focused on their acoustic cues or listener’s behavior in isolation, this study investigates if and when backchannels occur by taking into account the prosodic characteristics together with the communicative functions of the interlocutor’s speech preceding backchannels. Using a corpus of spontaneous dyadic conversations in Austrian German annotated with continuous turn-taking labels, we analyze the distribution of backchannels across different turn-taking contexts and examine which acoustic features affect their occurrence and timing by means of Conditional Inference Trees and linear mixed-effects regression models. Our findings show that the turn-taking function of the interlocutor’s utterance is a significant predictor of whether a backchannel occurs or not: Backchannels tend to occur most frequently after longer and syntactically complete utterances by the interlocutor. Moreover, prosodic features such as utterance duration, articulation rate variability and rising or falling intensity affect the timing of listener responses, with significant differences across different turn-taking functions. These results highlight the value of using continuous turn-taking annotations to investigate conversational dynamics and demonstrate how turn-taking function and prosody jointly shape backchannel behavior in spontaneous conversation.

1. Introduction

Human communication is a remarkably coordinated activity. Successful interaction not only relies on the words themselves, but also on how these words are said, on subtle cues and fine-grained timing between conversational partners. Speakers continuously adjust to each other in real time (Kelterer et al., 2023), relying not only on linguistic content but also on prosody, gestures and context. This dynamic behavior is especially evident in spontaneous conversation, where speakers rarely plan their turns in advance but instead co-construct utterances on-the-fly and in conjunction with their interlocutors (B. Clancy & McCarthy, 2014). Understanding how this coordination unfolds, particularly in the area of turn-taking, remains a central challenge for speech scientists and technologists aiming to understand and model human speech processing in spontaneous human conversation, and also to apply these insights to interactions involving artificial agents (e.g., human–computer communication).
One key mechanism central to the real-time coordination between conversation partners is the use of backchannels (i.e., short, typically non-disruptive listener responses like “mhm”, “yeah”, or head nods). Although often brief and easily overlooked, backchannels have been shown to serve important interactional functions (e.g., Bravo Cladera, 2010; Gardner, 1998; McCarthy, 2003; Schegloff, 1982; Stubbe, 1998). They act as continuous feedback signals, giving speakers feedback on how their utterance is received, without needing to explicitly check by asking. Backchannels contribute to the flow, efficiency, and coherence of dialogue (Yngve, 1970). Backchannels further play a central role in the process of grounding, that is, the ongoing effort by which speakers and listeners work to establish a shared understanding, or common ground (Stalnaker, 2002). Grounding is a collaborative effort in which speakers and listeners continually signal comprehension, attention, or the need for clarification. In human–human communication, this process is largely automatic, supported by a mix of verbal and non-verbal cues that signal attention, understanding, or confusion. Beňuš et al. (2011) and others have shown that backchannels help maintain alignment between conversation partners, reinforcing the sense that the conversation is proceeding smoothly.
Backchannels are not produced at random. Various studies have shown that they tend to be produced close to grammatical completion and/or pauses in the interlocutor’s turn (e.g., Bravo Cladera, 2010; P. M. Clancy et al., 1996; Schegloff, 1982), and that they also tend to be produced in certain sequential and prosodic contexts, but that the relative importance of these cues can be language specific. For instance, German and English speakers differ in the frequency of backchannels produced in overlap vs. in pauses (Heinz, 2003), and the relative importance of grammatical completion, prosodic completion, the use of backchannel-eliciting discourse particles and head movements were shown to be different in English vs. Japanese conversations (P. M. Clancy et al., 1996; Maynard, 1986, 1990).
The findings of qualitative studies have also been extended by quantitative studies on prosodic and interactional cues prompting backchannels: Regarding fundamental frequency (F0), Hirschberg and Gravano (2009) found that both rising and falling intonation patterns can elicit backchannels. Similarly, Ward and Tsukahara (2000) observed that prolonged low and flat intonation tends to affect backchannels. Overall, the literature shows mixed findings for F0, indicating that additional acoustic features and turn-taking cues need to be considered to better explain backchannel occurrence. For intensity (loudness), Gravano and Hirschberg (2011) reported that mean intensity is typically higher at potential turn completions. In terms of durational features, Noguchi and Den (1998) demonstrated that pauses affect backchanneling behavior, while Bögels and Torreira (2021) showed that a slowing of the articulation rate (final lengthening) often signals an upcoming opportunity for feedback. Non-verbal behaviors, such as gaze (Bavelas et al., 2002), head movements, and posture shifts, have also been identified as cues for listener responses (Coates & Sutton-Spence, 2001). Together, these multi-modal signals create windows of opportunity for brief listener contributions like backchannels.
What above mentioned quantitative studies have in common is that they treat backchanneling behavior in relative isolation, either by focusing on the listener’s acoustic response or on the prosodic structure of the interlocutor’s turn (Gravano & Hirschberg, 2011). What is often missing is a more contextualized understanding of how the communicative function and the design of the preceding utterance shapes the likelihood for or the timing of a backchannel. For example, are interlocutors more likely to produce a backchannel when their conversation partner approaches a potential endpoint, or in the middle of a turn construction unit? Do backchannels also occur when the speaker is rephrasing themselves? How does prosody affect whether a backchannel is produced or not? How does the conversational situation (e.g., narrative sequences vs. co-construction of turns and content by both speakers) affect backchannel production?
For the investigation of these questions, we suggest a combined methodology. While the above mentioned qualitative studies have already jointly analyzed prosodic and functional aspects, a systematic quantitative analysis of backchannel occurrence and timing that incorporates both prosodic cues and turn-taking functions is still lacking. Filling this gap makes it possible to better understand how prosody and turn-taking functions jointly shape backchanneling behavior. The focus of this paper is on investigating the conditions under which backchannels occur, and if they occur, how their timing relates to the prosodic and turn-taking characteristics of the speech produced by the interlocutor prior to the backchannel and not the properties of the backchannel itself. Ultimately, our findings from human–human interactions are intended to inform human–computer interactions.

Design of the Current Study

This study presents a quantitative analysis of a corpus of spontaneous conversations annotated for turn-taking, based on Conversation Analysis (CA) criteria, that is, a purely observational annotation of how interlocutors behave in the sequential context (e.g., Ogden, 2012; Sacks et al., 1974), without any interpretations of what one interlocutor (would have) wanted to signal to the other1. In line with the CA-based study by Sikveland (2012), we use the term hearer response tokens to refer to verbal backchannel signals with varying lexical and phonetic-prosodic forms. However, in the introduction and discussion of this paper, we also use the more widely recognized term backchannel for a broader accessibility. What all of these hearer response tokens have in common is that they do not take up a turn, but express functions, such as continuing attention, acknowledgment, agreement, etc. Unlike studies that rely solely on surface-level cues (e.g., orthographic annotations like “mhm”), our approach considers functionally informed annotations to examine how the structure of speakers’ turns and acoustic cues jointly influence backchanneling behavior.
The primary goal of this paper is to investigate when and how backchannels occur, with a specific focus on their distribution across different turn-taking contexts. To do so, we focus on the speech preceding a backchannel to understand how its prosodic and functional characteristics influence whether and when a backchannel occurs. Specifically, we analyze prosodic features related to fundamental frequency (F0), intensity, articulation rate, and duration, along with measures capturing their temporal change and shape. These features are combined with a categorical factor: the turn-taking function of the analyzed speech segment. Our analysis is structured into three parts. First, we examine the distribution of turn-taking labels globally and across individual conversations in the dataset. Second, we analyze whether certain turn-taking functions are more likely to prompt backchannels and explore which prosodic features influence their occurrence. For this purpose, we use Gradient Boosting models, to learn more about the overall feature importances of the features, and Conditional Inference Trees to learn about the direction and feature values behind. Third, using mixed-effects regression modeling, we analyze the exact timing of backchannels in different communicative contexts.
The secondary goal is to provide an example of how continuous turn-taking annotations, developed for spontaneous conversational data, can be applied to research from a variety of (sub-)disciplines, in this case within Phonetics of Talk in Interaction (PTI; see Ogden, 2012). These annotations are part of a larger annotation scheme, which also includes turn-taking annotations on the basis of Inter-Pausal Units. A detailed description of the annotation scheme and the annotation process is included in Kelterer and Schuppler (2025). These annotations could form the basis for research on a variety of conversational phenomena, and they are freely available for non-commercial research2

2. Materials and Annotations

2.1. GRASS

In this paper, we use the conversational speech component of the GRASS corpus (Schuppler et al., 2014, 2017), which consists of 19 dyadic one-hour-long spontaneous conversations. The speaker sample is balanced for gender (6 f-f, 7 f-m, 6 m-m) and comprises 20–60-year-old native speakers of Austrian German from the South Bavarian and southern Middle Bavarian dialect area from the south–east of Austria. Speakers use a mix between Standard Austrian German and these dialects. While individual speakers occupy different positions along the standard-dialect continuum, there is also considerable intra-speaker variation along this parameter, with all speakers using both Standard Austrian German and dialectal forms, albeit to different degrees (Geiger & Schuppler, 2023).
The speakers in each conversation knew each other well and were friends, partners, family members or colleagues. The dialogues were recorded in a studio, but no task was given for the conversations and no experimenter was present during the recordings. This resulted in natural interactions in a casual speaking style with a rich variety of backchanneling behavior. The corpus comes with time-aligned manually created orthographic transcriptions (Schuppler et al., 2017), and turn-taking annotations were created that allow for the investigation of various topics (cf. Section 2.2). GRASS thus provides a suitable basis to analyze backchannel occurrences and timing in specific turn-taking contexts.

2.2. Turn-Taking Annotations: Points of Potential Completion (PCOMP)

This study is based on continuous turn-taking annotations in 70 min of spontaneous conversation in GRASS (extracted from 12 conversations), which are part of a larger annotation scheme that also includes turn-taking annotations on the level of Inter-Pausal Units (Schuppler & Kelterer, 2021). Annotation (segmentation and labeling) was performed in Praat (Boersma & Weenink, 2001), that is, in a time-aligned manner in a program that allows for exact boundaries according to phonetic criteria (e.g., between two adjacent words). Timing, such as pauses or overlapping speech, is not annotated explicitly, as this information can be automatically extracted from the time-aligned annotations.

2.2.1. Identifying PCOMPs

Turn-taking annotations are based on the concept of potential completion (PCOMP). For segmentation on this layer, we followed P. M. Clancy et al.’s (1996) definition of grammatical completion:
“We judged an utterance to be grammatically complete if, in its sequential context, it could be interpreted as a complete clause, i.e., with an overt or directly recoverable predicate, without considering intonation. In the category of grammatically complete utterances, we also included elliptical clauses and answers to questions. […] A grammatical completion point, then, is a point at which the speaker could have stopped and have produced a grammatically complete utterance, though not necessarily one that is accompanied by intonational or interactional completion.”
In previous studies, such points in speech have also been called points of possible syntactic completion (SYNCOMP; Local & Walker, 2012) and potential turn boundaries (PTB; Zellers, 2017). This notion overlaps to a large degree with transition relevance places (TRP; Sacks et al., 1974). In most of the Conversation Analysis literature, however, TRPs are generally not only characterized by grammatical completeness, but also by prosodic completeness (cf. Selting, 2000). In line with P. M. Clancy et al. (1996), Local and Walker (2012) and Zellers (2017), we did not include prosodic completion in the definition of these points for our annotation system, since prosodic completion in Austrian German is still a topic under investigation. This also avoids circularity in prosodic investigations such as this one.
Since German syntax differs from English syntax (cf. P. M. Clancy et al., 1996; Local & Walker, 2012), a few notes on potential completion in German are necessary. In the invented example in 1 (a) below, a PCOMP point (indicated by a vertical line) is reached after “Buch” (“book”). Even though the speaker continues speaking, “sie schenkt ihm ein Buch” could be a complete sentence, because it includes the verb (“schenken”) and its obligatory direct and indirect objects (“Buch” and “ihm”). Additional PCOMP points are reached after each increment (“zum Geburtstag”, “morgen”). German syntax also allows the insertion of several constituents between a transitive verb and its direct object. In Example 1 (b), for instance, the increments from (a) are inserted before the direct object. Therefore, no PCOMP point is reached until the direct object is expressed. The same criteria apply to separable predicates and separable prefixes.
  • Example 1
  • Languages 10 00194 i001
If a main clause follows a subordinate clause, a PCOMP point is reached only when the main clause has been expressed. The maximum domain of potential completion is the sentence, so turn projection strategies with a scope wider than the sentence, such as “first, … second, …”, are not considered. Many utterances in a conversation, however, are not full sentences containing a predicate. Therefore, the preceding context is also considered, in particular the previous turn by another speaker. In the invented Example 2, several answer options are given to a question asking for a location. Potential completion is reached only when a location is expressed in the answer, even if the answer does not contain a predicate, because it is recoverable from the question in the previous turn (see (a) and (b)). If an answer is given in a longer format (e.g., by a main clause including additional information, as in (c)), no PCOMP point is reached before the location is expressed. The same criteria apply when the predicate is expressed again after the location (see (d)), since the location alone could be a complete answer.
  • Example 2
  • Languages 10 00194 i002
While PCOMP refers to end points rather than units, in the remainder of this paper, we still refer to the PCOMP annotations as intervals that start when speech starts at the beginning of a turn (or hearer response token), or at the end boundary of an immediately preceding PCOMP if more speech is produced, and end when a PCOMP is reached.

2.2.2. PCOMP Labels

PCOMP intervals received one of ten labels, which combine syntactic and forward-looking3 turn-taking criteria, based on analytic principles from Conversation Analysis (i.e., what interlocutors do, not what they intended)4. The label set comprises an extension of the annotations used by Zellers (2017) (hold, change, question, backchannel). To be able to characterize all of interlocutors’ speech production in longer sequences, labels were added to distinguish syntactically dependent from independent turn-continuations, to distinguish between syntactically complete and incomplete turn-holds, to capture syntactically incomplete turn-holds with subsequent rephrasing, to represent different kinds of discourse and hesitation particles that are independent of syntax, and to characterize various kinds of syntactically incomplete turn-changes. Table 1 shows an overview of all labels.5
To account for the full range of interlocutors’ behaviors, we allowed for the combination of labels when more than one label applied. One frequent example is that an utterance was interpreted as yielding the turn by the interlocutor, but the current speaker held their turn and continued speaking, which resulted in a short period of simultaneous speech. Such utterances were labeled as change_hold.
For the statistical analysis in this investigation, any remaining uncertain annotations and very infrequent labels were excluded, incomplete and disruption were grouped together, and double labels were grouped with the more frequent label (cf. Section 3.3).

2.2.3. Annotation Process

The annotation of PCOMP required a firm background in syntax as well as experience with phonetic segmentation because boundaries had to be set with precision not only at pauses, but also within the speech stream, that is, between two phones. The amount of reduction and coarticulation in conversational speech makes this task particularly challenging. Thus, annotators were trained in syntax as well as in phonetic segmentation and annotations were performed in a two-step process. First, one annotator performed a first round of annotations. After some time, she self-corrected her annotations and then another annotator corrected these annotations. To account for uncertainty in the labeling process, we introduced @ as an uncertainty marker. After the training phase with the second author of this contribution, the annotators and the second author continued to have regular meetings in which uncertain examples were discussed and, where possible, resolved. This process contributed considerably to the development of segmentation guidelines, to the concrete label-decision guidelines and also to the final label set6.

2.2.4. Validation of Annotations

We calculated Intra-Annotator agreement on 300   s of speech ( 100   s from three different conversations), in which the annotation process was the same as for all other conversations. In these 300   s of conversation, a total of 223 PCOMPs were annotated. For PCOMP boundaries, the intra-annotator agreement was 0.967 (Cohen’s κ calculated for the boundaries that were set with respect to all the words where a boundary could have been set), indicating near-perfect agreement (cf. Landis & Koch, 1977).
For PCOMP labels, we obtained a Fleiss’ κ of 0.75 (based on 210 observations in which the same boundaries were set; z = 25.6, p > 0.0001), indicating substantial agreement (Landis & Koch, 1977). A more detailed validation of PCOMP annotations, including the analysis of common confusions (e.g., partial agreement cases, such as between hold and hold_change or disagreement due to different analyses of a whole sequence) can be found in Kelterer and Schuppler (2025). Given these scores for inter-rater agreement, we conclude that these data form a valid basis for our subsequent study on the distribution and timing of hearer response tokens.

3. Methods

3.1. Label Extraction

For this paper, we extracted hearer response tokens along with their preceding PCOMP labels and identified the corresponding portions of the interlocutor’s speech to analyze the context leading up to each hearer response token. To do this, we traced back from the onset of the hearer response token through the interlocutor’s PCOMP tier until we reached the immediately preceding turn, which we refer to as the preHRT. We included a Δ t min = 200   ms window before each hearer response token to account for human reaction time, which is based on average reaction times reported by Fry (1975), and extracted both the label and the audio from a 600   ms window. The length of the extraction window is based on findings from a previous study by the first and third author (Paierl et al., 2025). Figure 1 illustrates this general windowing process. To enable comparison with utterances that are not followed by a hearer response token, we also extracted all other PCOMPs that did not precede a hearer response token. For these non-HRT (noHRT) tokens, the same 600   ms window was applied, aligned to the end of the respective annotation. These noHRT tokens serve as a control set for analyzing the presence or absence of hearer response tokens.
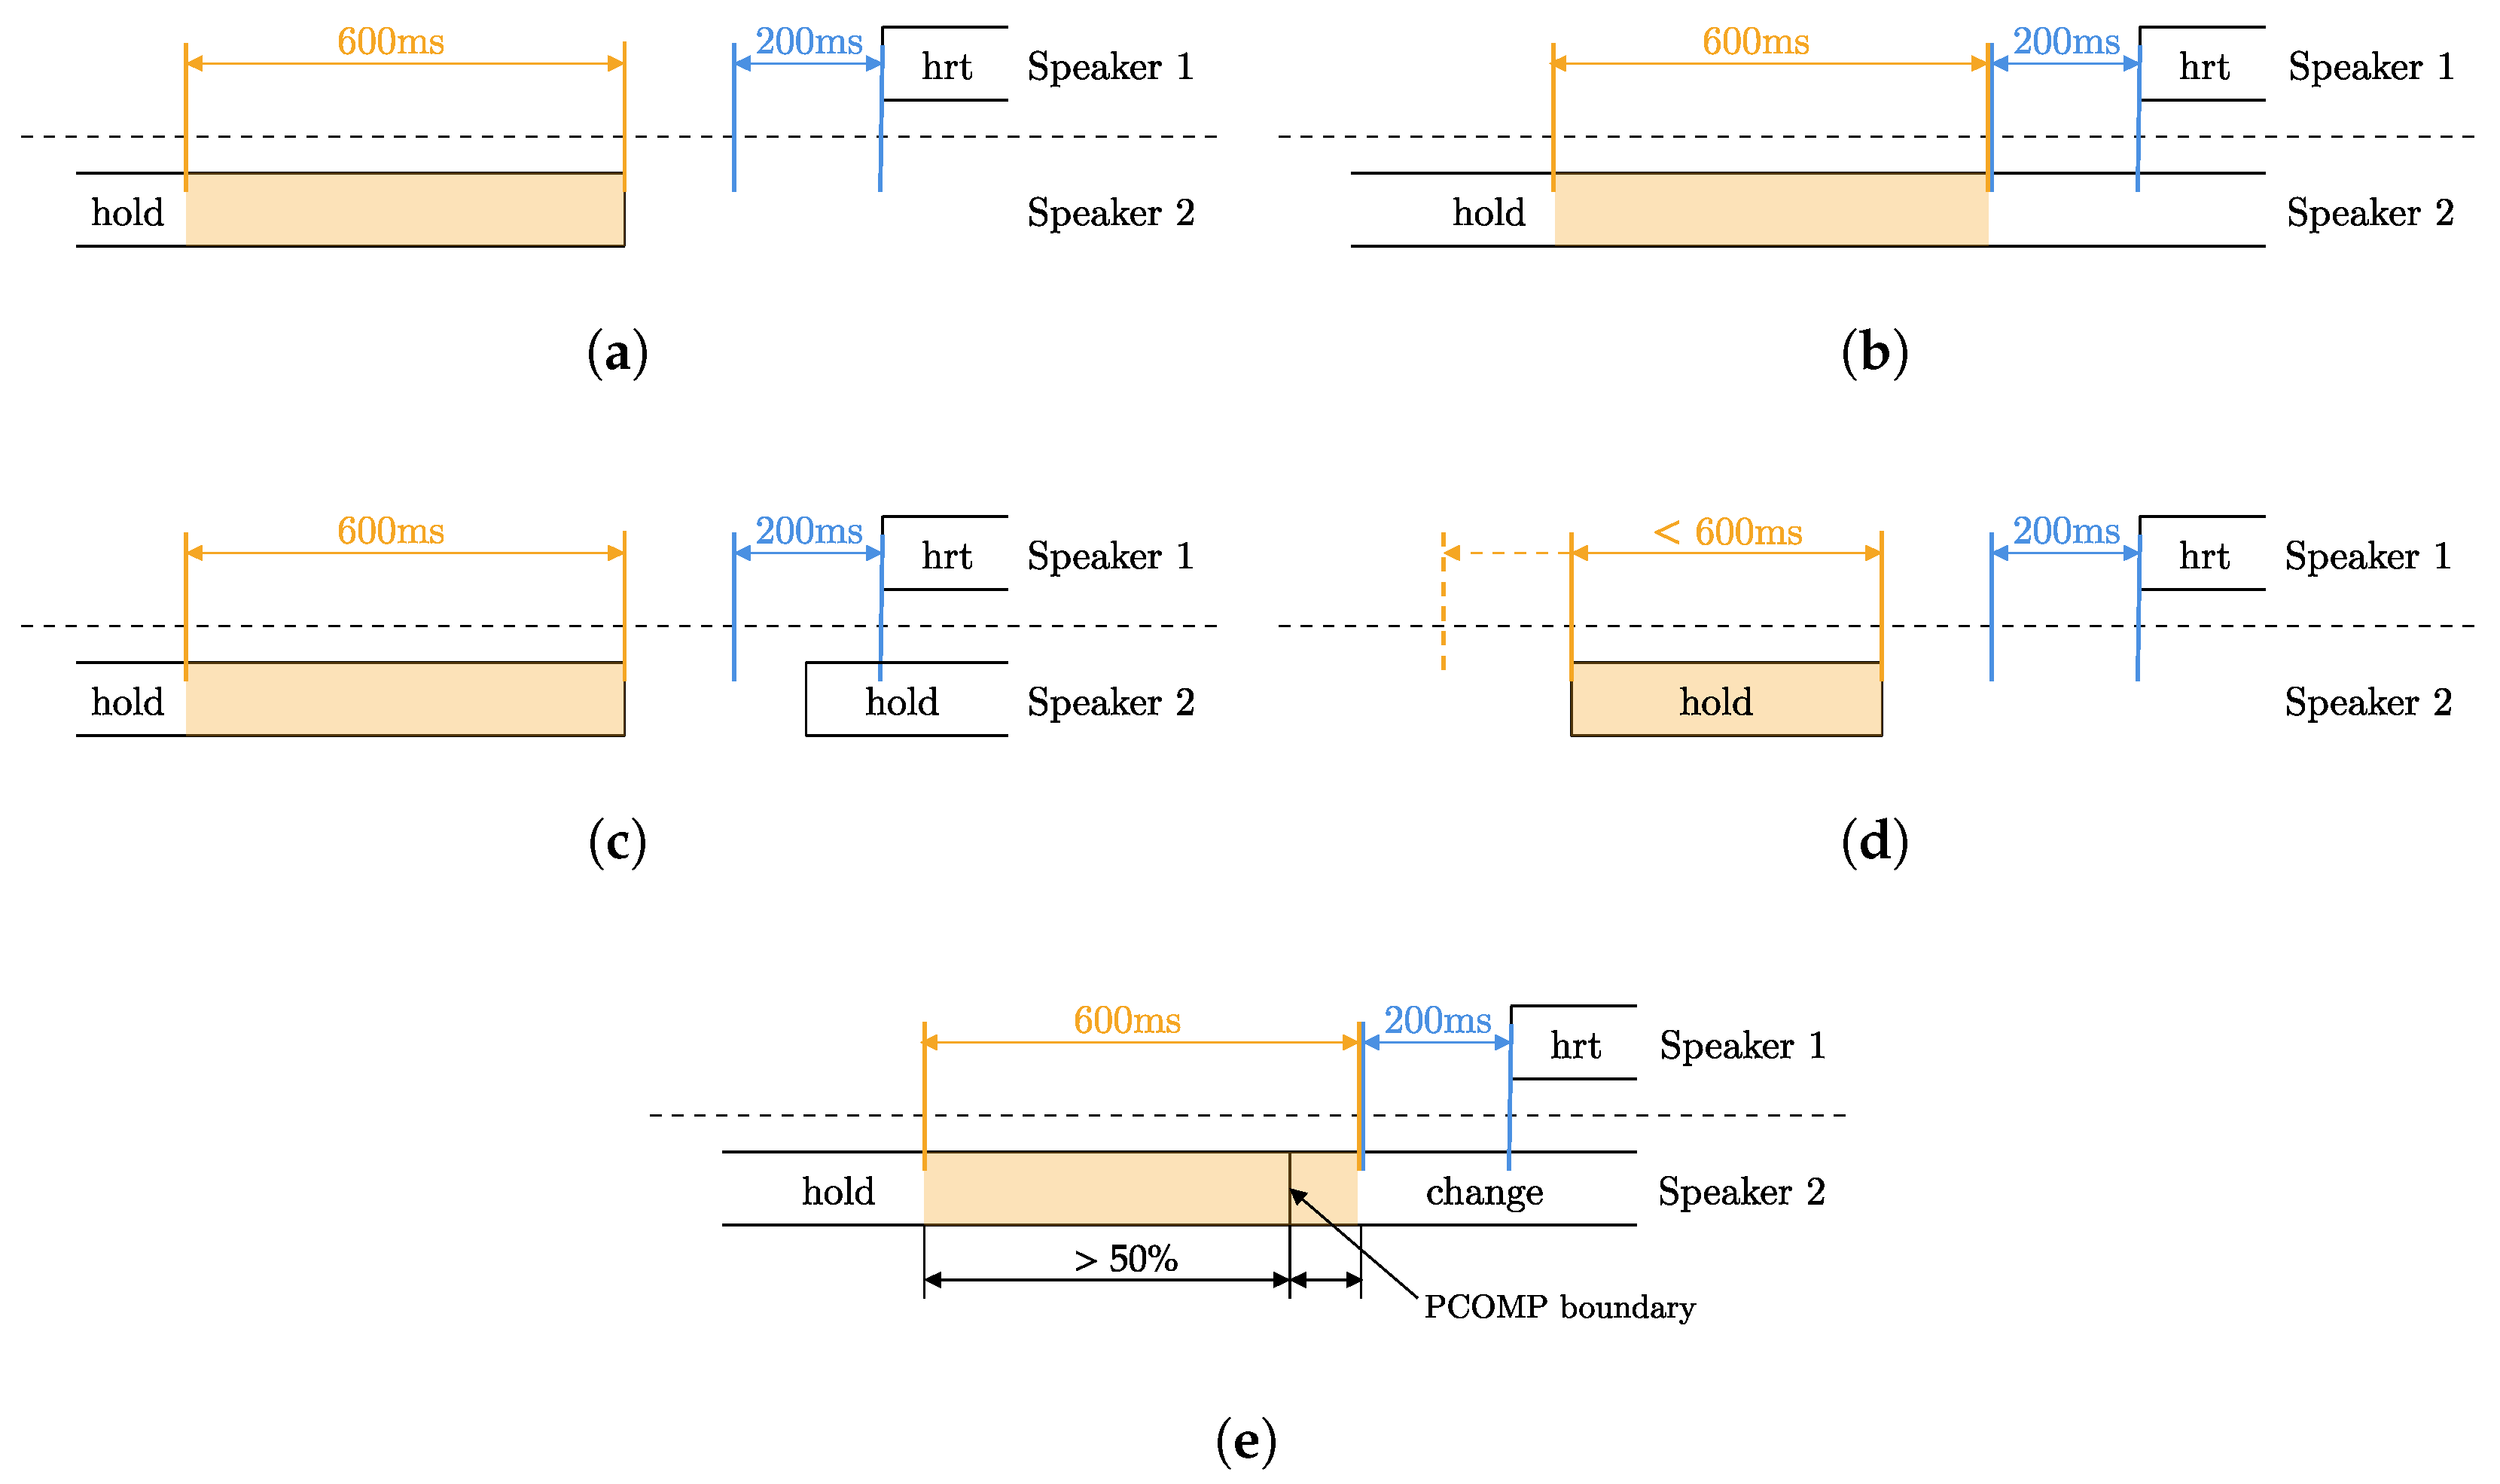
Due to the highly variable conversational dynamics in the GRASS corpus, the extraction of the correct label and audio is not always straightforward. Figure 2 presents the most common configurations of hearer response token and preHRT, and how each was handled:
(a)
The hearer response token and preHRT do not overlap, and the pause between the two utterances is greater than Δ t min . The extraction window begins at the end of the preHRT and extends 600   ms backwards.
(b)
The hearer response token occurs in the middle of the interlocutor’s turn, resulting in overlap. In this case, the extraction window starts 200   m s before the hearer response token and spans 600   m s backwards.
(c)
The hearer response token overlaps with a newly started PCOMP interval. If the onset of that interval occurred less than Δ t min before the hearer response token, it is skipped. The extraction window is then starting at the end of the preceding utterance and extends 600   m s backwards.
(d)
The preHRT is shorter than the default extraction window. In this case, the extraction window is shortened to match the duration of the preHRT.
(e)
The hearer response token overlaps with multiple PCOMP annotations. The extraction window is defined as in (b). When multiple labels fall within the extraction window, the one with the greatest overlap, that is, more than 50 % of its duration within the extraction window, is selected.

3.1.1. Combining of Labels

We merged certain labels based on functional similarity and manual inspection. Tokens labeled as incomplete and disruption were combined into incomplete, as both represent interruptions or breaks in the conversational flow. For preHRTs, tokens labeled as particle were reclassified as hold. This decision was based on a manual review of the 4 particle tokens in the dataset, which revealed that each was a continuation of the preceding PCOMP interval, all of which were labeled as hold. In cases where a PCOMP interval was annotated with double labels (e.g., hold_change), we applied a systematic strategy to assign a single label for later analysis. By default, compound labels were resolved by selecting the label with the higher overall frequency in the corpus. For example, hold_change was reduced to hold, as hold occurred more frequently than change. An exception to this rule was made for any label combinations involving hrt (e.g., hold_hrt), which were all mapped to hrt, reflecting the functional consistency of these tokens as hearer response tokens.

3.1.2. Categorical Factors

We are using only one categorical factor, which is the label of the PCOMP annotation of the interlocutor’s speech preceding a hearer response token. A full list of possible labels is shown in Table 1.

3.2. Acoustic Feature Extraction

The selection of features was primarily guided by previous literature on prosodic and functional cues known to affect backchanneling (cf. Section 1). A full list of the features is provided in Table 2. All acoustic features, except for the durational ones, were extracted from the default 600   m s extraction window from the interlocutor’s speech, as illustrated in Figure 1.

3.2.1. Durational Features

With durational features, we refer to all features capturing timing aspects relevant to turn-taking and backchanneling behavior. Specifically, we measure the durations of all PCOMPs (duration) and the time gap between hearer response tokens and preHRTs (time_gap), in order to learn more about the temporal dynamics that favor the occurrence of backchannels. All durational features were extracted from the manually created PCOMP intervals, which are closely aligned with the utterances. This tight alignment ensures accurate estimates of the various time-based features, making the PCOMP tier a reliable source for capturing the temporal structure of conversational exchanges.

3.2.2. F0 Features

Several F0-based features were computed, including the mean, median, standard deviation, slope, and both the maximum and minimum F0 values, along with their relative positions within the utterance. Together, these features aim to provide a comprehensive representation of the F0 curve, capturing how its shape may affect hearer response tokens. The F0 extraction was performed in Python 3.11.2 using the package parselmouth (Jadoul et al., 2018), a Python frontend for the Praat (Boersma & Weenink, 2001) F0 extraction algorithm. This algorithm is based on autocorrelation and operates in the time domain. The parameters for extraction were set as follows: The minimum F0 was set to 60   Hz for male speakers and 80   Hz for female speakers, while the maximum F0 was set to 300   Hz for males and 400   Hz for females. These cutoffs are based on empirical experience and were adjusted to fit the characteristics of our data. They are broadly in line with ranges reported in previous work (e.g., Vogel et al. (2009)). F0 values were extracted every 10   m s . After extraction, missing F0 values were interpolated using the interp function from the Python package numpy (Harris et al., 2020) and later smoothed using the function savgol_filter ( window _ length = 11 , polyorder = 2 ) from the Python package scipy (Virtanen et al., 2020). This smoothing step helps attenuate common F0 extraction errors, such as octave jumps, which is particularly important for ensuring accurate calculations of the maximum and minimum F0 values and their respective positions in the utterance. In a final step, the F0 was normalized to semitones using the median F0 of each speaker within the current 10-min interval of the conversation. From the normalized and smoothed F0 data, we extracted the mean, median, standard deviation, and the maximum and minimum F0 values, along with their corresponding positions. To compute the F0 slope, we applied a first-degree polynomial fit using the polyfit function from numpy over the full duration of the smoothed F0 contour. This provides a single linear slope value reflecting the general trend in F0 across the interval.

3.2.3. Intensity Features

Similar to the F0 features, several intensity-based features were computed, including the mean, median, standard deviation, slope, and both the maximum and minimum intensity values, along with their relative positions in the utterance. These features collectively provide a detailed representation of the intensity curve throughout the turn, helping to determine how variations in loudness may affect backchannel responses. The intensity extraction was performed using the parselmouth package, with default parameters applied for extraction. Intensity values were extracted every 10   m s . The intensity was z-score normalized using Equation (1), based on the median ( μ ) and standard deviation ( σ ) of each speaker’s intensity within the current 10-min interval. From the normalized intensity data, we extracted the mean, median, standard deviation, and the maximum and minimum intensity values, along with their corresponding positions. The intensity slope was computed in the same manner as the F0 slope.
z = x μ σ

3.2.4. Articulation Rate Features

Although speech rate is often used as a feature in analyzing backchanneling behavior, this paper focuses on the closely related articulation rate to better understand aspects, such as final lengthening, and how changes in speaking tempo influence backchannel behavior. The key difference between speech rate and articulation rate is that articulation rate excludes silences from the calculation, i.e., only the time spent actually speaking is considered. This approach is feasible because the GRASS corpus includes a phone-level segmentation, which was generated through forced alignment (with a frame shift of f s h = 7.5   m s ), which also provides time-aligned silence segments as part of the output (Linke et al., 2023). To compute the articulation rate and its temporal changes, we counted the number of phones spoken (excluding silences) within moving windows of 500   m s inside the extraction window of interest. The window was shifted in steps of 10   m s , and the articulation rate was recalculated at each step. As the end of the 600   m s extraction window approached, the 500   m s analysis window was incrementally shortened by 10   m s per step, down to a minimum window size of 20   m s . Equation (2) defines how the articulation rate is calculated, where Δ t represents the total duration of the analysis window excluding silences. The resulting articulation rate values were then normalized using Equation (3), based on the median ( μ ) of each speaker’s articulation rate within the current 10-min interval. This method allowed us to compute not only the mean and median articulation rate, but also the standard deviation, maximum and minimum values (along with their respective positions), and the articulation rate slope.
AR = N phones Δ t
z = x μ μ

3.3. Data Cleaning and Filtering

For preHRTs, we removed entries with implausible values for time_gap (less than 1% of the data). These cases were likely caused by annotation errors or highly atypical interaction patterns. We also excluded statistical outliers for time_gap, defined as values outside the range of μ ± 2 · σ , as they were assumed to reflect non-typical backchanneling behavior, such as moments of hesitation or awkwardness (6.0%). We also removed all labels containing the symbol @, which indicates uncertainty in the annotation, as well as entries marked by noise like events such as laughter (4.5%).
For noHRTs, a similar cleaning procedure was applied. We discarded all entries with labels representing non-verbal or noise-like events, such as breathing or smack, as well as those containing the @ symbol (44.9%). This high proportion is expected, as many PCOMPs in this group consist solely of breathings or other noise types. We also excluded labels that were neither among the six most frequent nor found in any preHRT. This included labels such as question, question-particle, and hesitation, along with various typographical errors (4.8%). Lastly, we discarded samples where one or more acoustic or prosodic features could not be computed (3.6%). This was primarily due to the absence of phone-level segmentation, which made the calculation of articulation rate features not possible for those tokens. Table 3 summarizes the final number of PCOMPs retained after cleaning and filtering as used for all subsequent analyses.

3.4. Statistical Methods

3.4.1. Conditional Inference Trees

We used Conditional Inference Trees (CIT) (Hothorn et al., 2006) for investigating which characteristics of PCOMP intervals (their acoustic properties and their turn-taking function) indicate whether the PCOMP is followed by a hearer response token or not, across all data from all speaker pairs. Unlike traditional decision trees, CITs rely on statistical hypothesis testing to determine significant splits, thereby reducing selection bias and improving generalization. CITs were modeled using the library partykit (Hothorn et al., 2015), following the guidelines proposed by Levshina (2021).

3.4.2. Feature Importance

CITs do not allow to estimate the predictive power of specific features beyond their statistical significance. For this purpose, we used the Gradient Boosting Classifier (GBC) (Friedman, 2001) from the Python package scikit-learn (Pedregosa et al., 2011). To quantify the contribution of each feature, we applied Permutation Feature Importance (Breiman, 2001), which evaluates a feature’s impact by randomly shuffling its values and measuring the resulting change in the model’s performance. Gradient Boosting constructs an ensemble of decision trees, iteratively refining the model by focusing on previously misclassified instances. After training the model, we extracted feature importance scores, offering insight into which acoustic–prosodic and contextual features were most influential for the classification task.

3.4.3. Linear Mixed-Effects Regression Models

To account for variability across speakers and conversations, we applied linear mixed-effects regression models (LMER) using the lme4 package (Bates et al., 2015) in R. Using these models, we can gain insights into how strongly the acoustic features (continuous independent variables) and the turn-taking category (categorical independent variable) predict the time gap between the hearer response token and its preceding PCOMP (dependent variable). Furthermore, mixed-effects linear regression models allow the incorporation of random effects (i.e., speaker ID). When building the model, we first selected the initial set of independent variables based on their importance in the Gradient Boosting Classifier. We then checked for potential collinearity by computing pairwise Pearson correlations between them, resulting in a feature set with a maximum correlation of 0.4 . For the initial model, we then added all independent variables together with their two-way interactions, as these can reveal combined effects of prosodic and functional features that would remain hidden otherwise, while potentially also improving model fit and predictive power. Higher-order interactions were not included due to the limited number of tokens and concerns about model complexity and interpretability. We then applied a best-fit model selection procedure via manual backward stepwise reduction, using Akaike Information Criterion (AIC) as the criterion for retaining independent variables and interactions (Baayen et al., 2008; Levshina, 2021). Random effects were only kept if they significantly improved model fit, as determined by ANOVA testing. Both the initial set of independent variables as well as the formula of the final stepped model are reported in Section 5.2.

4. How PCOMP Annotations Capture Conversational Dynamics and Backchanneling Behavior

This section presents the distribution of the occurring PCOMP labels and how often different PCOMP labels are followed by hearer response tokens. We provide a global picture on the patterns across speaker pairs, while also showing how these annotations capture the differences in turn-taking dynamics and backchanneling behavior for the 12 speaker pairs studied in this paper.
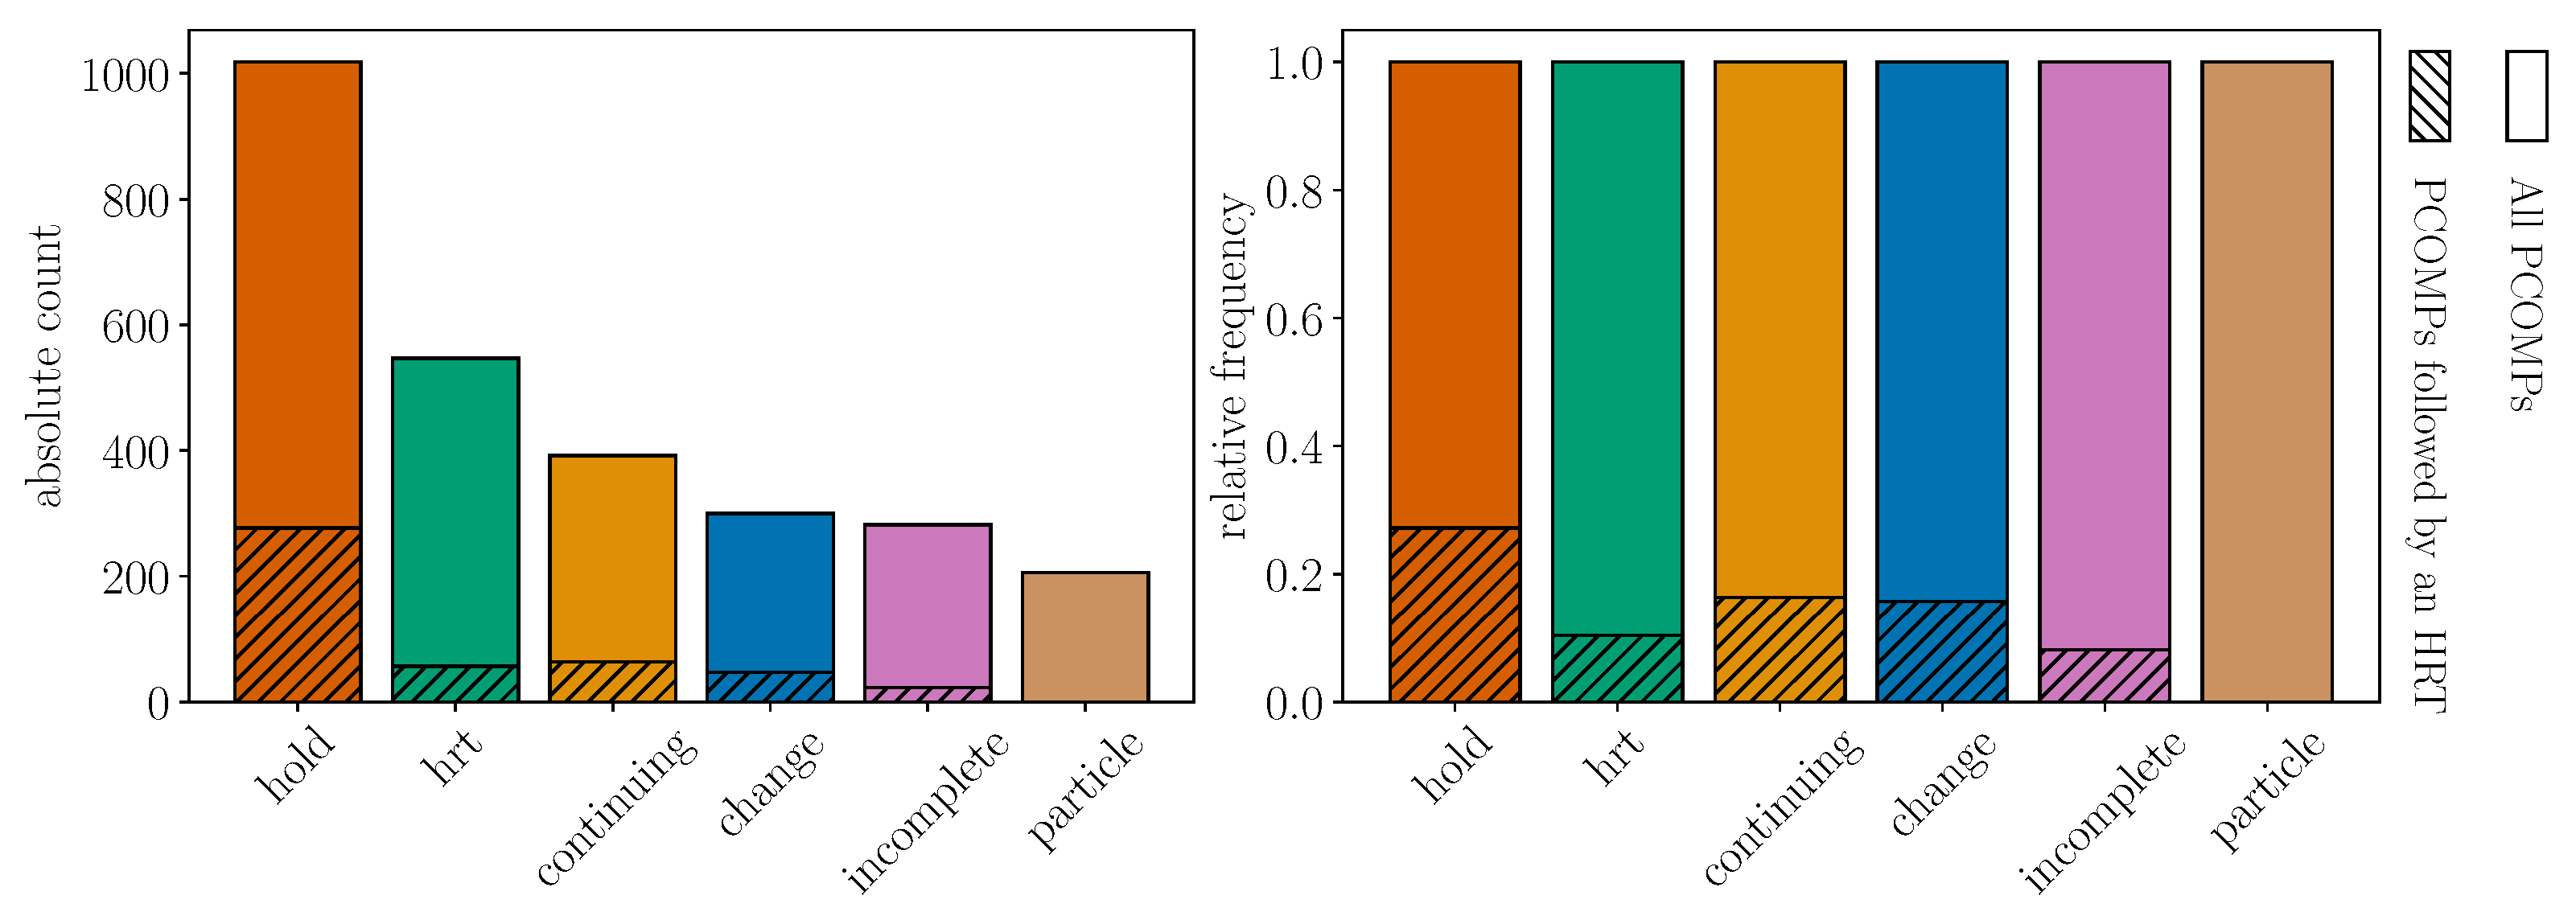
Figure 3 displays the absolute (left) and relative (right) distribution of the six most common PCOMP labels in the annotated data of all 12 speaker pairs: hold, change, hrt, continuing, incomplete, and particle. Each bar in the figure is split into two segments: The solid portion represents the portion of PCOMP functions in the dataset after which the interlocutor did not produce a hearer response token (noHRT). The shaded area denotes the portion of those PCOMPs that were followed by a hearer response token (preHRT) produced by the interlocutor. In general, the most frequent label is hold (same speaker continues by starting a new sentence), accounting for over 30% of occurrences. hrt (hearer response token), continuing (same speaker continues with the same sentence), and change (other speaker continues) follow with approximately 18%, 13%, and 10%, respectively. incomplete (speaker does not reach PCOMP) and particle (discourse particle) are the least frequent. The shaded areas clearly show that hearer response tokens occur most frequently after hold compared to the other functions. For continuing and change, the number of hearer response tokens are relatively similar, which can also be seen for hrt and incomplete. This means that most hearer response tokens are produced when the current speaker holds their turn, mostly close to where they finish a sentence, while relatively few hearer response tokens are produced when the current speaker yields the turn. At first glance, the presence of hearer response tokens following a change may seem counterintuitive, because hearer response tokens themselves do not take up a turn. Since turn-taking is co-constructed by both interlocutors, however, this situation happens when the initial speaker does not continue their turn after the hearer response token, so the interlocutor who produced the hearer response token takes up the turn instead.
Perhaps surprisingly, a non-negligible number of hearer response tokens follow another hearer response token by the interlocutor. This often occurs more than once in a row. We refer to this recurring pattern as an “hrt loop”.
A much higher number of turn-holding annotations (hold, continuing and particle) than turn-yielding annotations (change8) tells us that most turns consist of more than one PCOMP interval. On average, turns in our data consist of about three Turn Construction Units (TCUs)9.
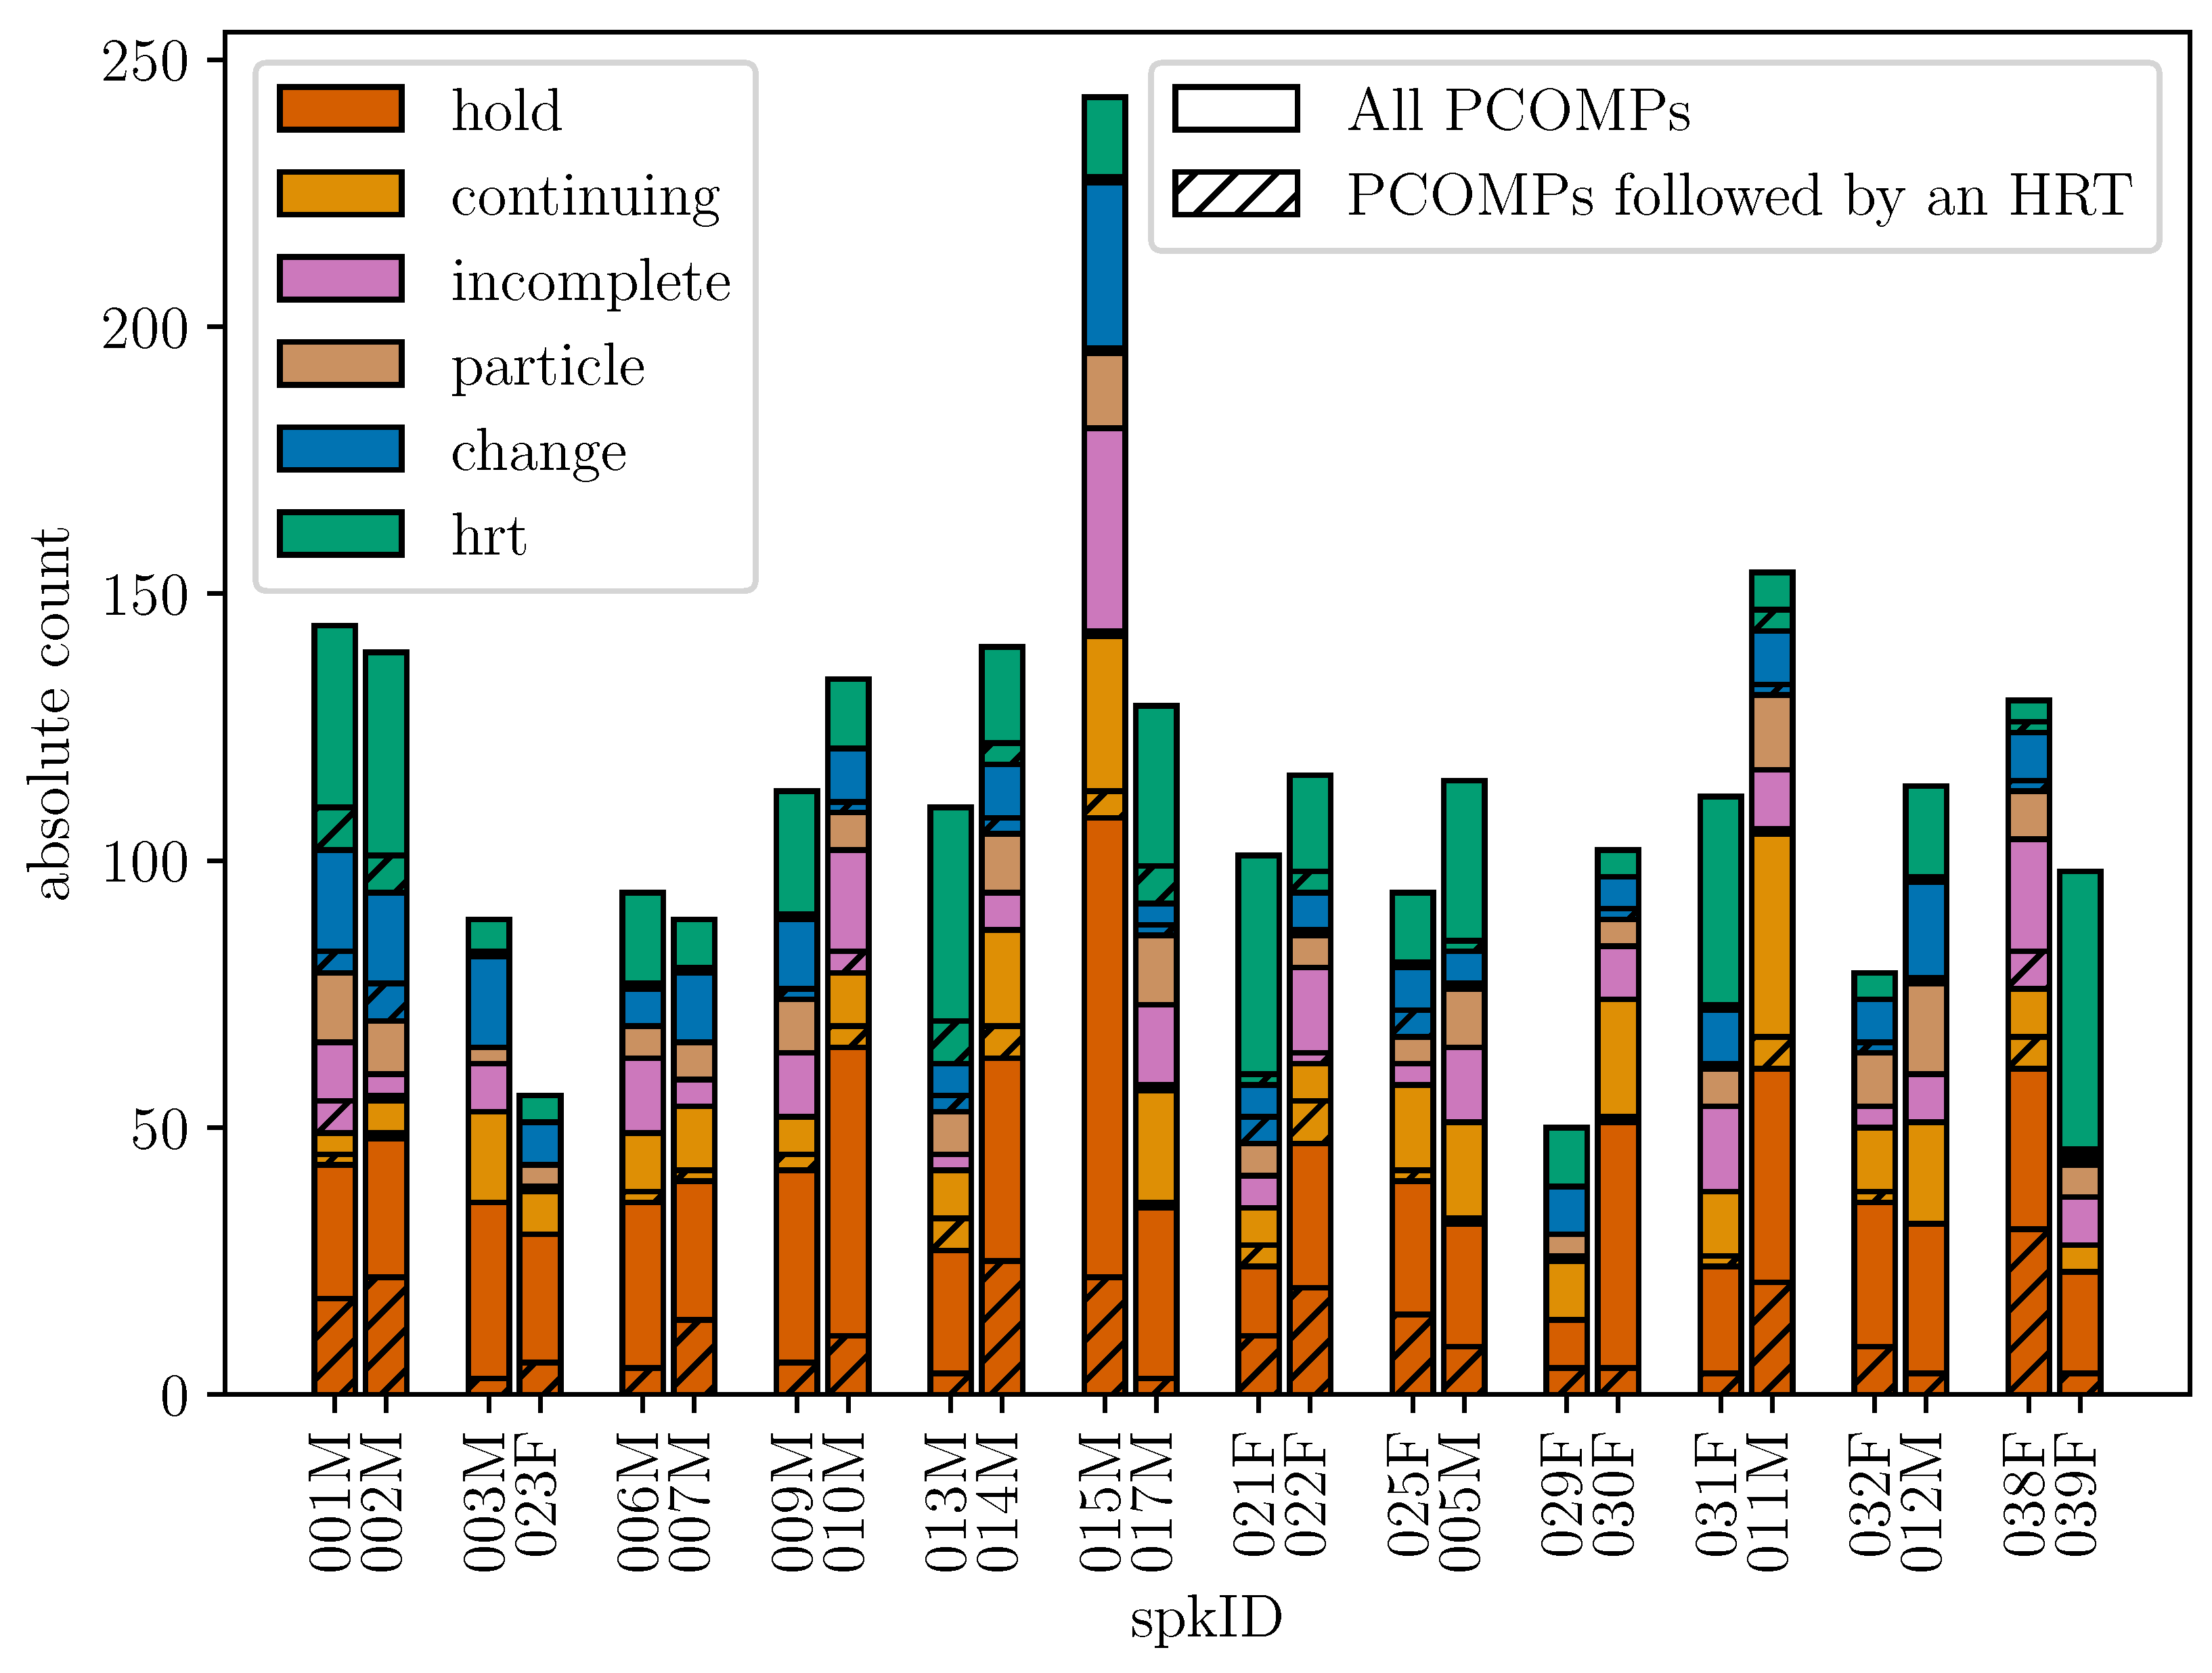
Figure 4 breaks down PCOMP distributions by speaker, grouped together with their respective interlocutor. Speaker IDs with an “F” are female speakers and those with “M” male speakers respectively. As in the previous figure, the shaded areas represent the subset of PCOMPs that are followed by a hearer response token, in contrast to the non-shaded areas that are PCOMPs not followed by a hearer response token. The speaker IDs directly depicted next to each other were the conversation partners in GRASS. The first very obvious difference between the conversations is that in the same five minutes of speech, the different speaker pairs produced a different amount of PCOMP intervals. For instance, speaker 015M produced the highest number of PCOMP intervals, whereas 029F produced the fewest, which are roughly one quarter of 015M’s count.
This visualization reveals not only speaker-specific variation but also differences in conversational dynamics in the five minutes annotated in each conversation. Some conversations are more symmetrical in their general turn-taking, as well as in the interlocutors’ backchanneling behavior, than others. The conversation between 001M and 002M, for instance, appears highly balanced: both speakers produced a similar number of utterances and backchannels, and their PCOMP label distributions are nearly symmetrical. Other conversations, such as those between 003M and 023F, or 029F and 030M, exhibit relatively few backchannels and lower overall utterance counts.
The exchange between 038F and 039F, on the other hand, is rather asymmetrical. 039F produced the highest number of backchannels among all speakers. Notably, she responded with a verbal backchannel to approximately 50% of all holds by 038F, and also produced the highest number of backchannels following an incomplete label (i.e., when her interlocutor had not actually reached a PCOMP point). Overall, this figure illustrates the substantial variability in how individuals structure their turns and how often they engage in backchanneling. There is no evident pattern of a preferred behavior, but the data reflects a rich diversity in conversational styles across individual conversations.
Figure 5, Figure 6 and Figure 7 show how these PCOMP annotations translate to conversational dynamics in the sequential context (time progression on the x-axis) with examples of 30–40 s long extracts from three conversations. Hearer response tokens are indicated in green. Speakers hold their turns as long as only hold, continuing, particle and disruption10 occur (warm colors). Turn ends are indicated by change or question (shades of blue). Questions are not included in the remainder of this study because they are never followed by a hearer response token, but they are included in these figures to give a complete picture of the turn-taking dynamics in the sequences shown.
Figure 5 presents 25 s of conversation from conversation 001M002M. This sequence illustrates turn-taking dynamics at the conclusion of a longer discussion before second 250. This sequence is taken up by several turns establishing consensus on the topic under discussion (whether the city they live in is beautiful or not). This is followed by a disjunctive topic shift after second 250.
In terms of turn-taking, this sequence starts with a short turn by 001M that consists of three PCOMPs (labeled as particle, hold and change). Already in overlap with the end of 001M’s turn, 002M produces a hrt. Since 001M does not continue his turn after the hrt, 002M takes up the turn himself (cf. change annotations followed by hrt in Figure 3). 001M produces the next hrt at around second 237, which is timed with 002M’s turn-internal pause after a hold. At around second 244, 002M produces two hrts, which initiate an alternation of several hrts by both interlocutors (cf. hrt annotations followed by hrt in Figure 3). At this point, neither speaker adds any new points to the discussion, and this “hrt loop” effectively concludes the discussion.
After the disjunctive topic shift at second 250, turn-taking dynamics change considerably. Turns are mostly short (i.e., single-PCOMP turns labeled as change and question), except for one longer turn by 001M containing three holds and ending in a question, which is only interrupted by 002M’s hrt after a relatively long gap. In general, gaps as well as turn-initial pauses are longer after the topic change and there is no overlapping speech as there was at the end of the previous discussion.
Figure 6 and Figure 7 each show an example of an asymmetric conversation. In Figure 6, the whole extract is taken up by one long turn in the middle of a longer narrative sequence in which 038F talks about her day. 039F only produces hrts (cf. her high ratio of hrts in Figure 4), which she mostly times with PCOMP points at which 038F holds the turn, except for the second hrt, which is timed in the middle of a long turn hold, not close to a PCOMP point. A closer look at the timing of 039F’s hrts reveals that she times some of them perfectly with 038F’s PCOMP points (first and last hrt), while some hrts are uttered after a short gap (third and fifth to seventh hrt).
Figure 7 presents 32 s of a similar narrative sequence from another conversation (029F030F). These 32 s are also taken up by one long turn by one speaker (cf. high percentage of hold by 030F in Figure 4), but in this case, the interlocutor produces only one hrt (cf. low percentage of 030F’s hold followed by hrt in Figure 4), while six hrts were produced in the same time span in Figure 6.
These qualitative results highlight the importance of analyzing backchanneling not only through large-scale quantitative patterns, but also at the level of individual conversational sequences, maintaining their temporal information. While Section 5.1 quantitatively addresses the sequential and prosodic context under which interlocutors do or do not produce hearer response tokens, and Section 5.2 explores their precise timing, whether they occur after a gap, immediately, or in overlap, this qualitative analysis reveals the interactional variability that happens within and between speaker pairs. By zooming in on specific interactional sections, we gain a deeper understanding of how backchannels are used to manage alignment, topic shifts, and speaker transitions, insights that would be difficult to analyze with statistical modeling techniques with which the temporal information is lost (where each instance is seen as a labeled data point with no temporal connection to the other data points). There exist statistical and classification methods that allow for the incorporation of temporal information in a longer conversational sequence, which would not have been possible in our data—for some methods, our data have too much variation (e.g., FPCA Zellers et al., 2010). For other methods, we simply do not have enough annotated data. One example would be to use a transformer based language model like BERT (Devlin et al., 2019) to perform a sequence classification for communicative functions rather than for the currently implemented word-level models.

5. Acoustic Analysis of the Interlocutor’s Speech Preceding Hearer Response Tokens

This section presents quantitative, statistical analyses with two aims. First, to reveal whether certain turn-taking functions are more likely to prompt backchannels than others and whether the acoustic–prosodic features of speech affect whether an utterance is followed by backchannels or not (cf. Section 5.1). Subsequently, in Section 5.2, we gain insights into the exact timing of backchannels in different communicative contexts (using mixed-effects regression modeling).

5.1. How Turn-Taking Function and Prosody Affect Whether a Hearer Response Token Occurs or Not

Before conducting the acoustic–prosodic analysis, we first created a balanced dataset. As shown in Table 3, there is an imbalance between preHRT and noHRT tokens. Analyzing the full dataset without addressing this would bias the results toward the majority class. To correct for this, we sampled a subset of noHRTs to match the number of preHRTs (468 tokens), creating a balanced dataset for comparison. However, because the distribution of turn-taking function labels is not uniform, we could not sample noHRTs entirely at random. Instead, we sampled according to the empirical label distribution of the full dataset across the six most frequent labels, as shown in Figure 3. For example, since hold occurs in over 37% of PCOMP labels, it should maintain a similar proportion in the sampled noHRT set. This balanced dataset, which contains an equal number of preHRT and noHRT tokens, and is matched by label distribution, was used for the acoustic–prosodic analyses of backchannel occurrence.
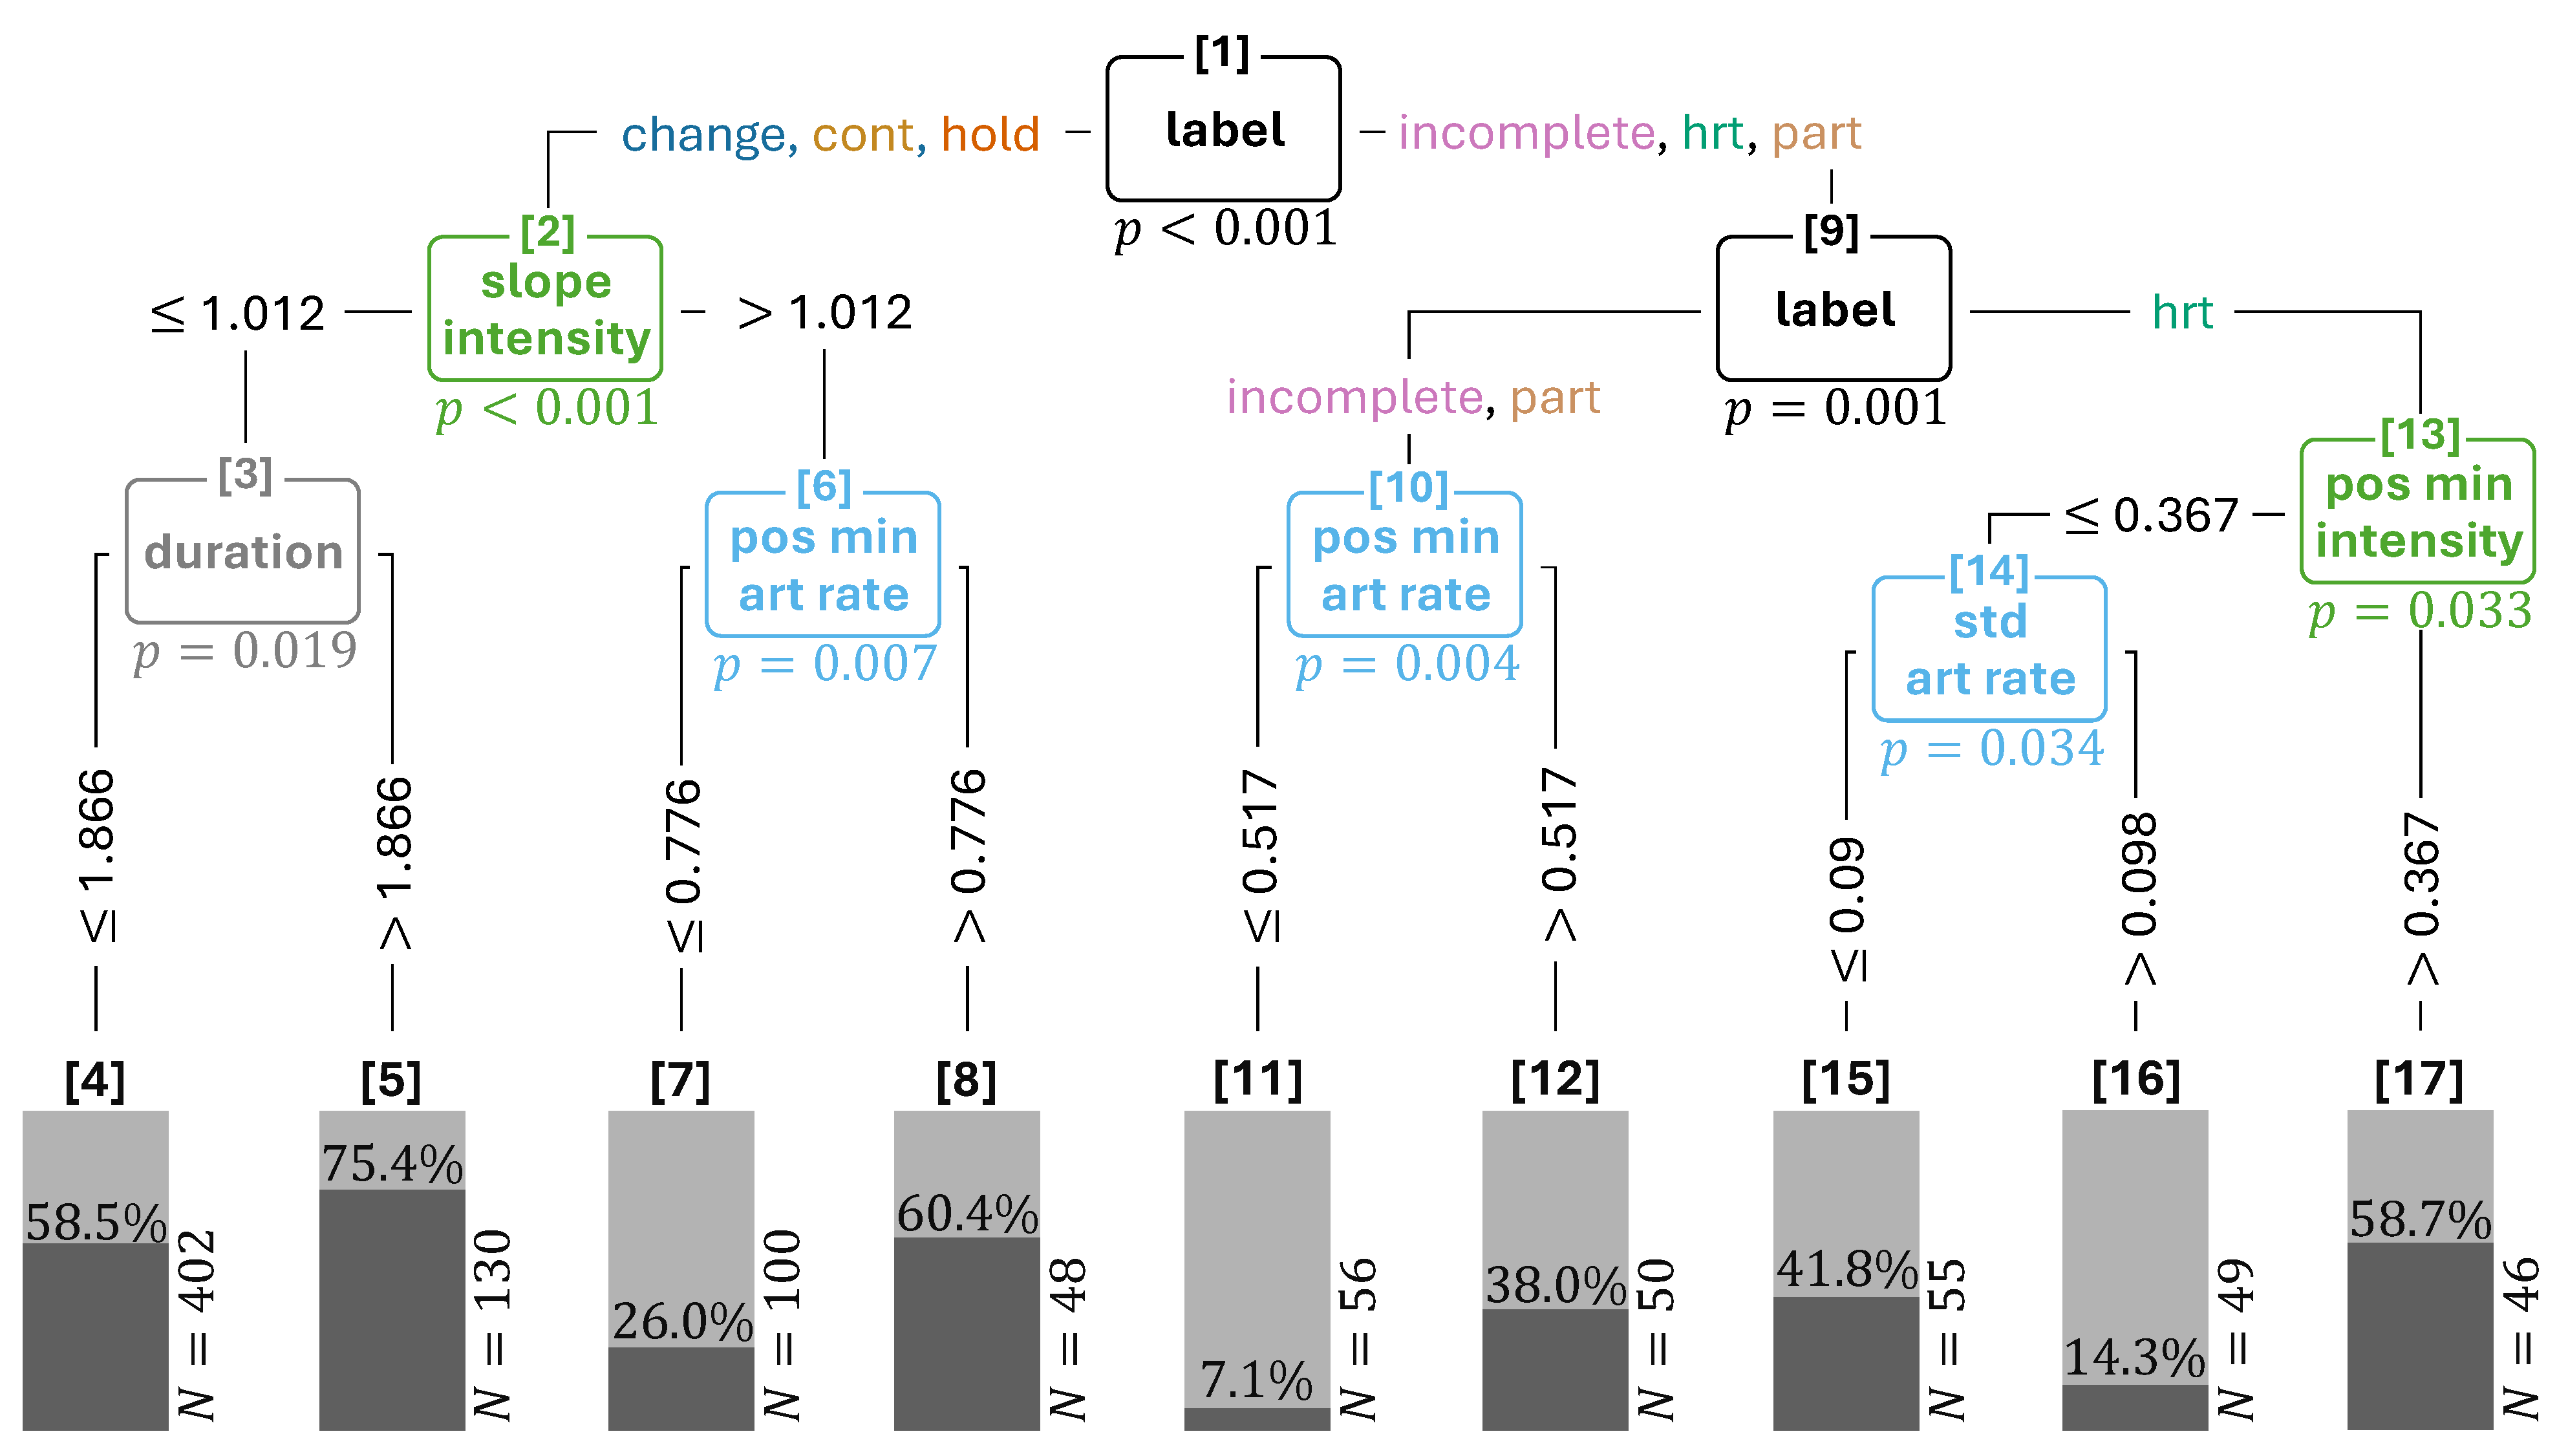
To gain a more interpretable understanding of how the function of a PCOMP and the corresponding prosodic features interact in the context of hearer response tokens, we trained a CIT on the balanced dataset. Figure 8 shows the trained CIT. The tree was trained using the partykit::ctree() function (Hothorn et al., 2015) in R with the following parameters: alpha = 0.05 , minsplit = 40 , minbucket = 40 , numsurrogate = TRUE, and maxsurrogate = 10 . The significance level alpha = 0.05 sets a moderate threshold for node splitting. Both minsplit and minbucket correspond to approximately 4% of the dataset, ensuring that splits and terminal nodes are based on sufficiently large subsets to avoid overfitting. The CIT is trained on a binary classification task, distinguishing whether a PCOMP interval in the data was followed by a hearer response token or not. Each terminal node at the bottom of the tree (= the bucket) shows all tokens in the data set that fulfill the conditions given by the feature-splits leading to these buckets. Importantly, the buckets depict the portion of data points for the two classes, in our case, whether a PCOMP label was followed by hearer response token or not. Dark gray represents the proportion of preHRTs, while light gray corresponds to noHRTs. The percentage shown within each bar reflects the share of preHRTs within that terminal node, offering a direct interpretation of how the preceding feature-based splits affect whether a hearer response token occurred in the data or not.
If we look at the resulting tree at a very global level (cf. Figure 8), we can gain the following general insights:
  • The tree is not very deep (only three layers of splits), this can be expected given our relatively small size of observations (total N = 936). The resulting buckets have a minimum of 46 and a maximum of 402 tokens, showing that some of the trends cover a much larger group of tokens than others.
  • Of all features that we entered into the tree (eight F0-related, eight intensity-related, ten durational and PCOMP label), only six features resulted in the production of significant splits in the tree.
  • The highest ranking feature is the PCOMP label (nodes 1 and 9), followed by two intensity-related features (nodes 2 and 13, indicated in green), and the durational features (nodes 3, 6, 10 and 14, indicated in gray and blue).
  • None of the F0-related features resulted to contribute significantly to describing the variation seen in the data, i.e., to the distinction of whether a PCOMP segment was followed by a hearer response token or not.
We now proceed into the CIT, reporting each node of the tree. The CIT’s first node is the feature PCOMP label, which proves to be the most significant predictor (Node 1, p < 0.001 ). This initial division separates utterances labeled as hold, continuing, and change from those labeled as incomplete, hrt, and particle, indicating that the communicative function of an utterance plays a fundamental role in determining whether it is followed by a hearer response token or not. This separation appears intuitive, as hold, continuing, and change typically correspond to longer, more complete utterances, whereas incomplete, hrt, and particle generally denote shorter or incomplete tokens.
Within the left branch (hold, change, or continuing) the next splitting feature is the slope of intensity (node 2, p < 0.001 ). Tokens with a flatter or even negative slope lead to a further split based on utterance duration (node 3, p = 0.019 ). Shorter utterances end in terminal node 4 ( N = 402 ), which represents the largest group among the terminal nodes. The occurrence frequency of hearer response tokens under this condition is 58.5 % . In comparison, if the duration is longer than 1.866   s , the frequency of hearer response tokens increases to 75.4 % (terminal node 5, N = 130 ), which indicates that hearer response tokens tend to occur more frequently after longer utterances. For those tokens where slope_intensity was higher (i.e., rising intensity), the position of minimum articulation rate emerges as a further significant feature (node 6, p = 0.007 ): Articulation rate minima that occur relatively early in the extraction window resulted in a lower occurrence frequency of hearer response tokens ( 26.0 % ) (terminal node 7, N = 100 ) than if the minimum is later or near the end of the analyzed interval, where the occurrence frequency of hearer response token increases to 60.4 % (terminal node 8, N = 48 ). This indicates that articulation rate minima at the end of PCOMP intervals, which also correlate with final lengthening, tend to be followed by more backchannels than if the minima were farther away from the utterances’ end.
On the other side of the tree (incomplete, hrt, particle) a second split is again made on the label itself (node 9, p = 0.001 ), separating utterances labeled as hrt from those labeled incomplete and particle. incomplete and particle are separated by the position of the minimum articulation rate (node 10, p = 0.004 ). Articulation rate minima in the first half of the extraction window correspond to fewer ( 7.1 % ) hearer response tokens (terminal node 11, N = 56 ), while later minima yield relatively more backchannels with about 41.8 % (terminal node 12, N = 50 ), possibly indicating hesitation or continuation points that invite listener responses. This pattern aligns with the other side of the tree, where pos_min_art_rate has a similar effect. For the hrts, the position of minimum intensity (pos_min_intensity) becomes a key feature (node 13, p = 0.033 ), with a later minimum corresponding to a relatively high occurrence frequency ( 58.7 % ) of hearer response tokens (terminal node 17, N = 46 ). This branch further splits on the standard deviation of the articulation rate (node 14, p = 0.034 ). Hearer response tokens occur more frequently for less variable articulation rates ( 41.8 % ) (terminal node 15, N = 55 ) than for more variable articulation rates ( 14.3 % ) (terminal node 16, N = 49 ). This means that less fluctuation in the articulation rate, generally elicit more hearer response tokens. This rightmost branch of the CIT also highlights the occurrence of the “hrt loops” discussed in Figure 5.
The tree shows that the label of the PCOMP is the most significant predictor, but it also shows that across the tree, features related to articulation rate, that is, its variability, position, and timing, appear frequently, suggesting their central role in shaping the occurrence of hearer response tokens. Similarly, prosodic cues such as intensity dynamics and utterance duration provide additional discriminative power. Notably, only durational and intensity features appear in the CIT, while no F0 features were selected, suggesting that whether a hearer response token is uttered or not is not related to F0. The terminal nodes show distinct distributions of hearer response tokens, offering insight into which combinations of features define response-relevant moments in conversations.
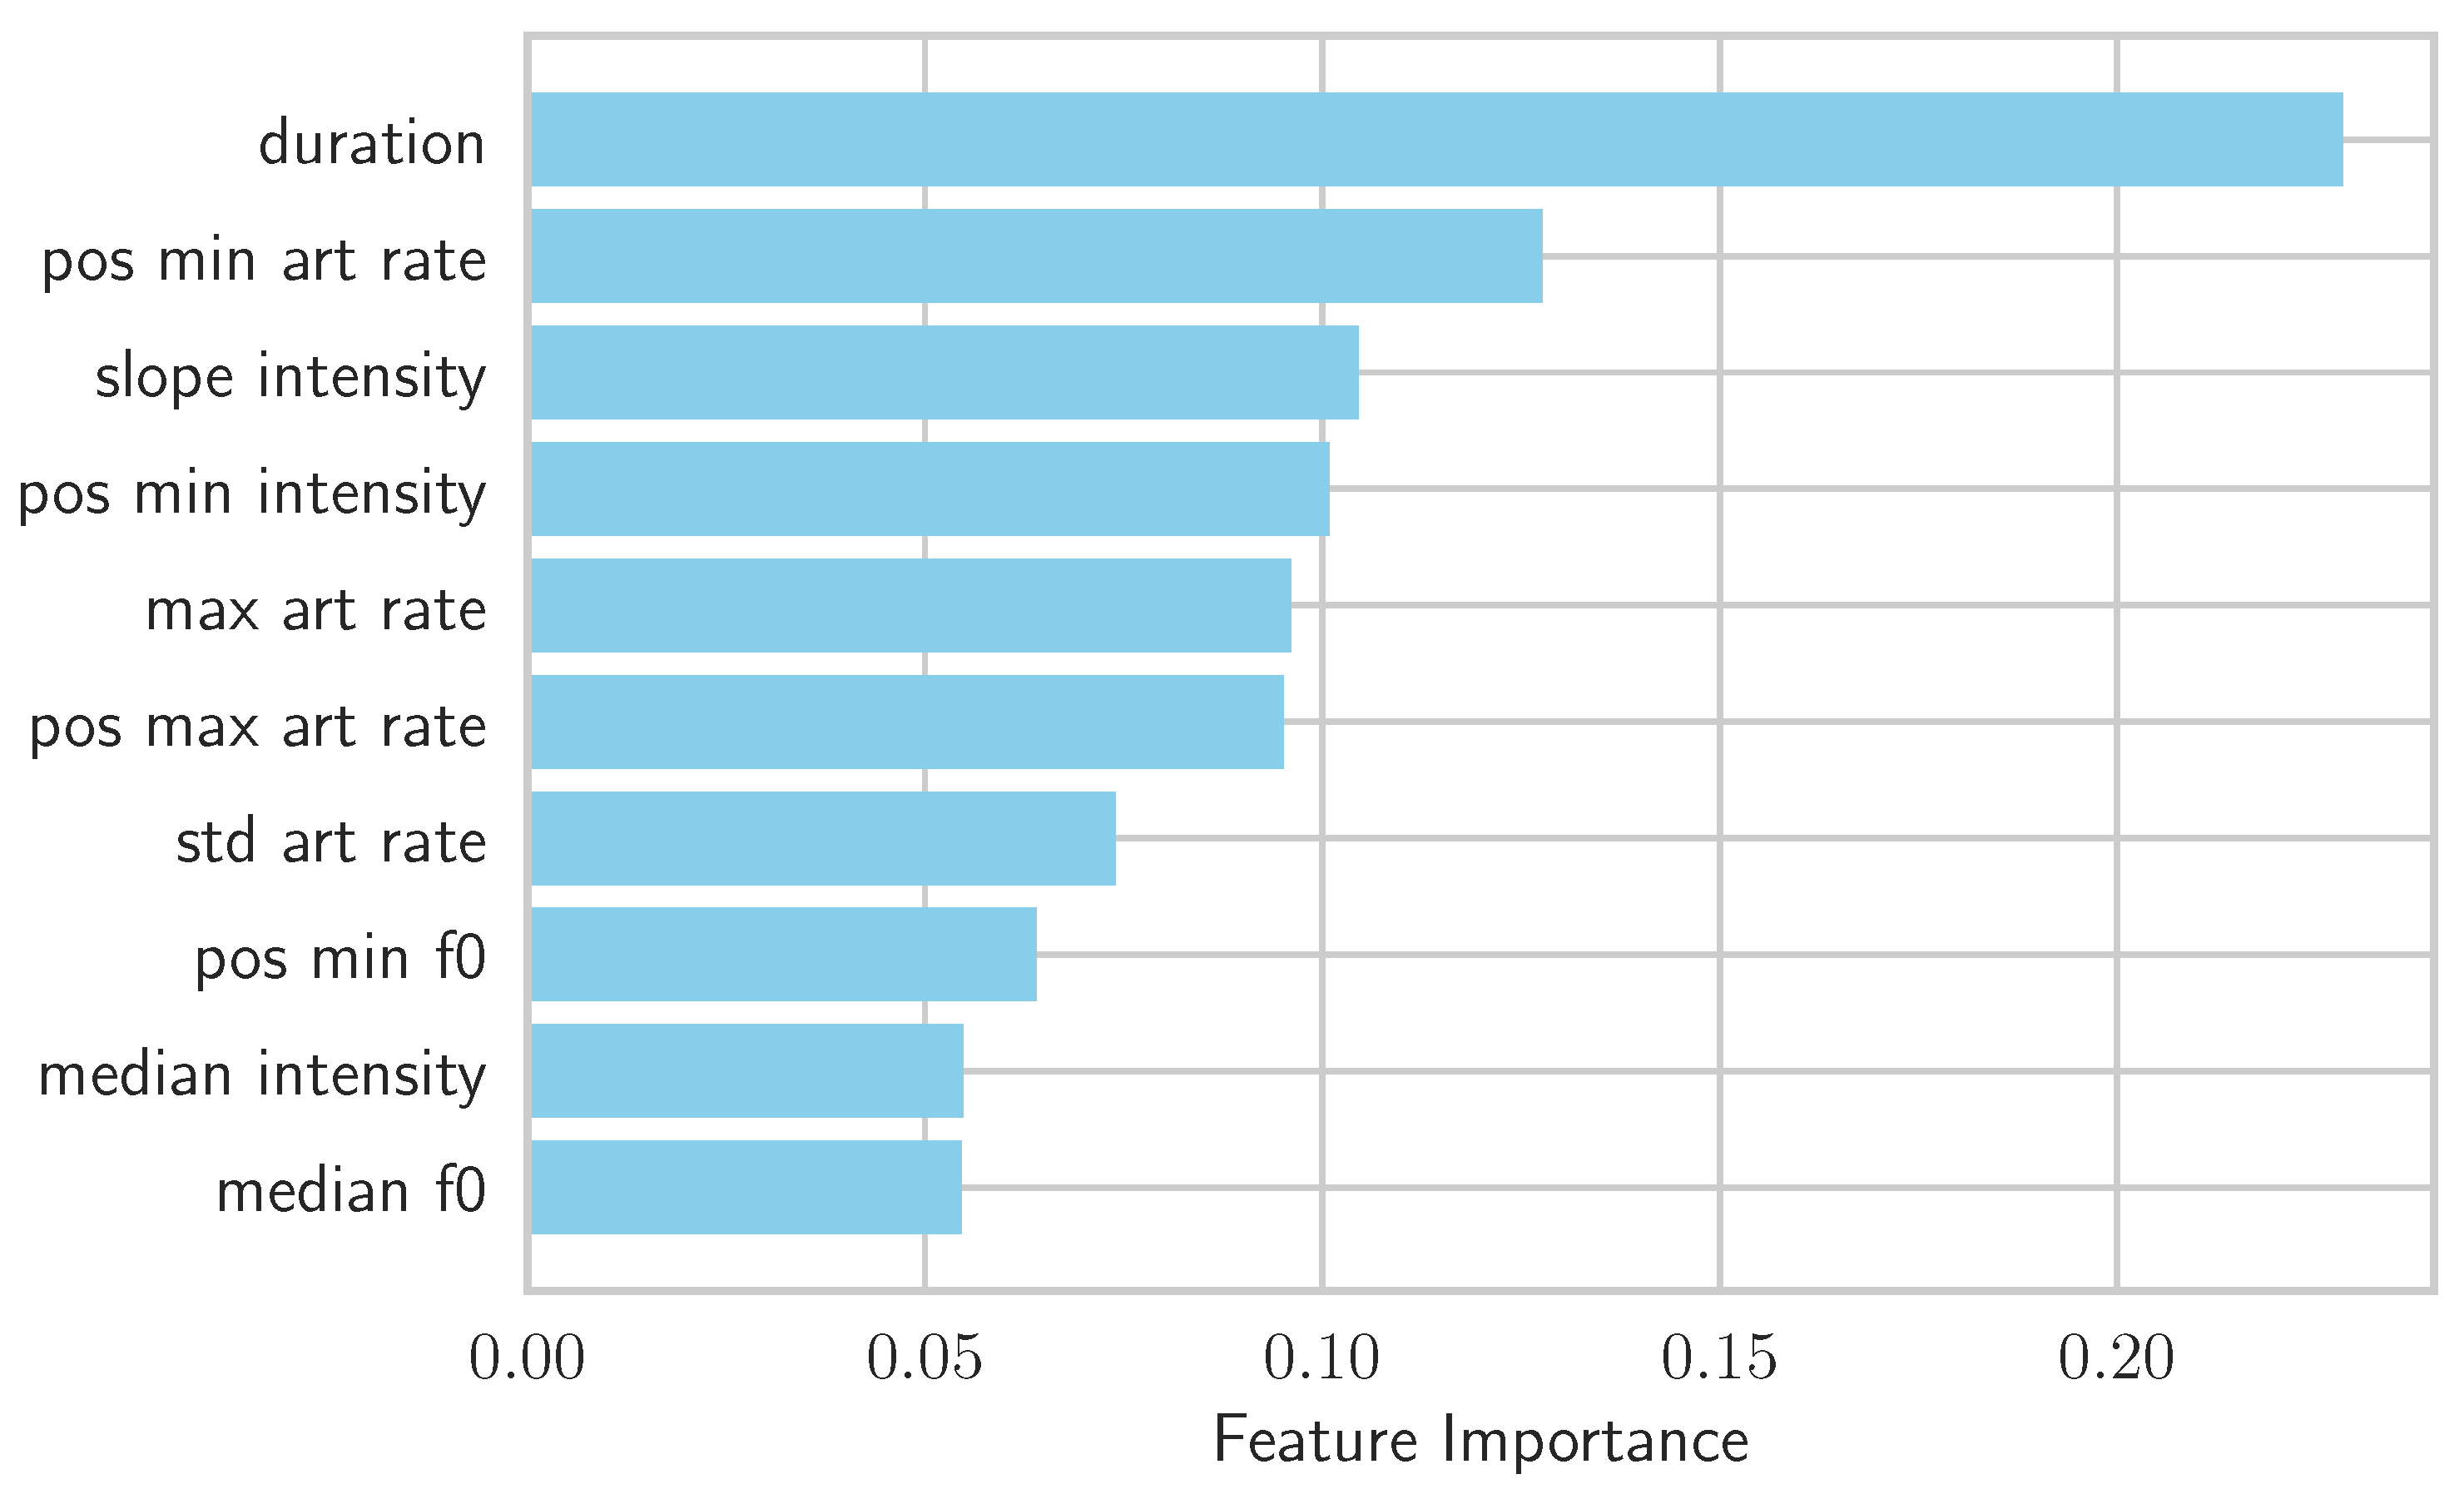
Figure 9 shows the relative importance of the 10 most important features, as determined by a Gradient Boosting Classifier trained on all 27 features using default parameters to distinguish between preHRT and noHRT segments. Each bar represents a feature, and its corresponding value reflects the degree to which that feature contributes to the model’s predictive performance. To ensure the reliability of this feature interpretation, we evaluated the classifier using standard metrics, summarized in Table 4. The model achieved an F1-score of 0.69, indicating reasonably strong performance and suggesting that it captured relevant patterns in the data. Additionally, the similar values observed for precision, recall, and accuracy point to a balanced classification: the model does not disproportionately favor one class over the other. This balanced performance is important for interpretability, as it suggests that the extracted feature importances are not skewed by class imbalance.
The top-ranked features include: (1) The duration of the previous PCOMP interval, which is the strongest overall predictor in the model, highlighting the role of utterance length in affecting the occurrence of hearer response tokens, (2) positional features like pos_min_art_rate, pos_min_intensity, and pos_min_f0 which indicates that the timing of acoustic minima within the window is a strong cue, (3) dynamic features such as slope_intensity and std_art_rate also rank highly, reinforcing the idea that articulation rate variability and intensity contour matter and (4) median_f0 and median_intensity, suggesting that central tendencies of F0 and loudness are important for prediction.
This feature importance analysis offers a useful complement to the findings from the CIT. Notably, the four highest-ranking features in the GBC model also appeared in the CIT, particularly pos_min_art_rate, pos_min_intensity, duration, and slope_intensity. These overlaps suggest that certain acoustic and prosodic features consistently contribute to identifying contexts where hearer response tokens occur, regardless of the modeling approach. While the CIT provides interpretable insights into how these features interact hierarchically, the feature importance analysis offers a view of their global relevance across the dataset.
Interestingly, some features, such as median_f0 and median_intensity, rank among the most important (although relatively low in comparison) in the GBC, even though they were not selected as split points in the CIT. This suggests that these features may influence the prediction in a more gradual or general way, rather than through clear threshold-based decisions. Ensemble models like GBC are good in capturing such effects, while decision trees highlight features that create strong splits in specific contexts. The CIT highlights how certain features, like the variability or timing of the articulation rate, interact with the conversational function of the utterance. For example, the impact of articulation rate may differ depending on whether the token is a hold or an incomplete. Taken together, the two methods complement each other: the GBC model shows which features matter most overall, while the CIT reveals how these features behave in interaction with one another. Together, these results support the robustness of the identified prosodic features and highlight that both models converge on a core set of features as being central in predicting the occurrence of hearer response tokens in conversation.

5.2. How Turn-Taking Function and Prosody Affect Hearer Response Token Timing

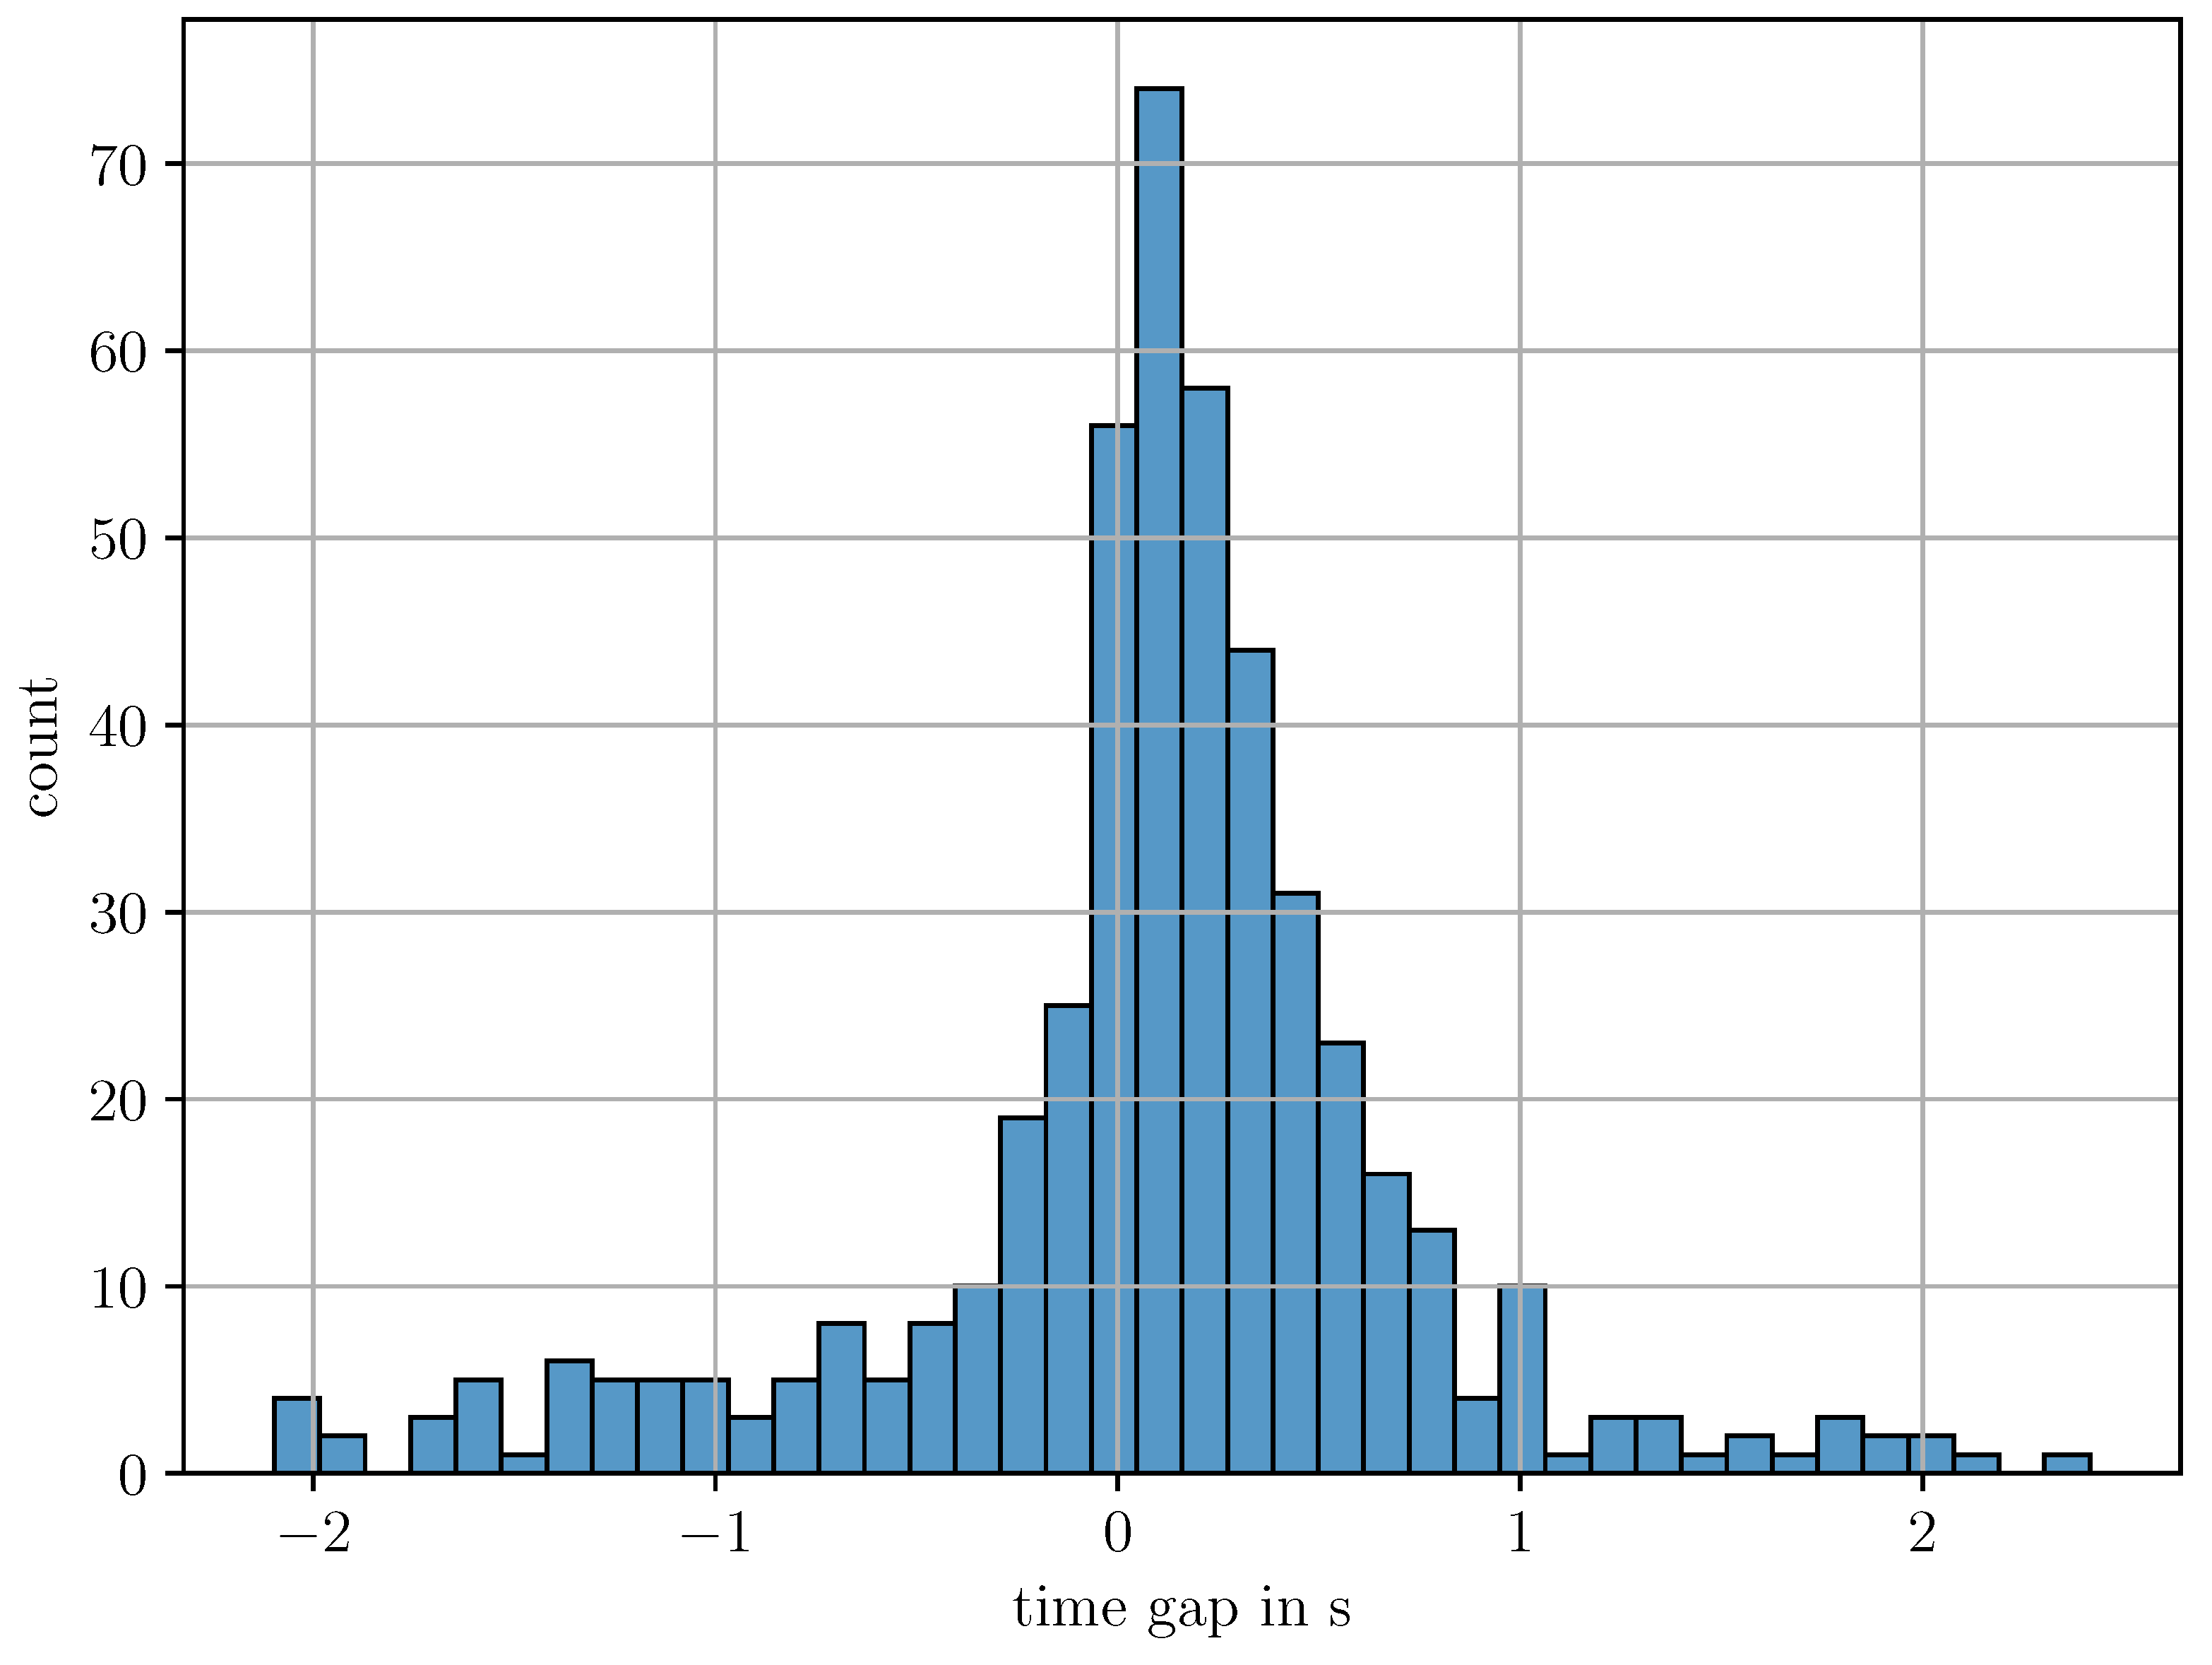
This section focuses exclusively on the preHRT dataset to analyze the timing of hearer response tokens. Figure 10 displays the distribution of the time_gap, i.e., the temporal distance between the end of the preHRT and the onset of the hearer response token. The distribution is right-skewed, with most values falling within the range of 0.5 to 0.8   s and a median around 0.14   s . This suggests that hearer response tokens typically occur timed with PCOMP points. Negative values indicate overlap, where a hearer response token begins before the other speaker has reached a PCOMP, reflecting instances of early or overlapping listener responses.
To analyze the impact of prosodic features and communicative functions (represented by the PCOMP labels) on the timing of hearer response tokens, we fit an LMER predicting time_gap. The initial model included the independent variables label (with the five values hold, hrt, continuing, change and incomplete), duration, slope_intensity, pos_min_art_rate, median_intensity, median_f0 and std_art_rate, along with all two-way interactions between these predictors. Speaker ID was included as a random intercept, which significantly improved the model fit (ANOVA, p < 0.01 ). Starting from this initial model, we performed a manual backward stepwise reduction, removing non-significant predictors and interactions. The final model resulted into c m t t t i m e _ g a p c m t t l a b e l + c m t t d u r a t i o n + c m t t s t d _ a r t _ r a t e + ( c m t t d u r a t i o n + c m t t s l o p e _ i n t e n s i t y ) 2 + ( 1 | s p e a k e r I D ) . The detailed model selection procedures are described in Section 3.4.3. Since one model allows us to draw conclusions only about how the values of label affect hearer response token timing in comparison to one specific label value, we additionally re-fitted the same model using each of the five labels as the reference level.
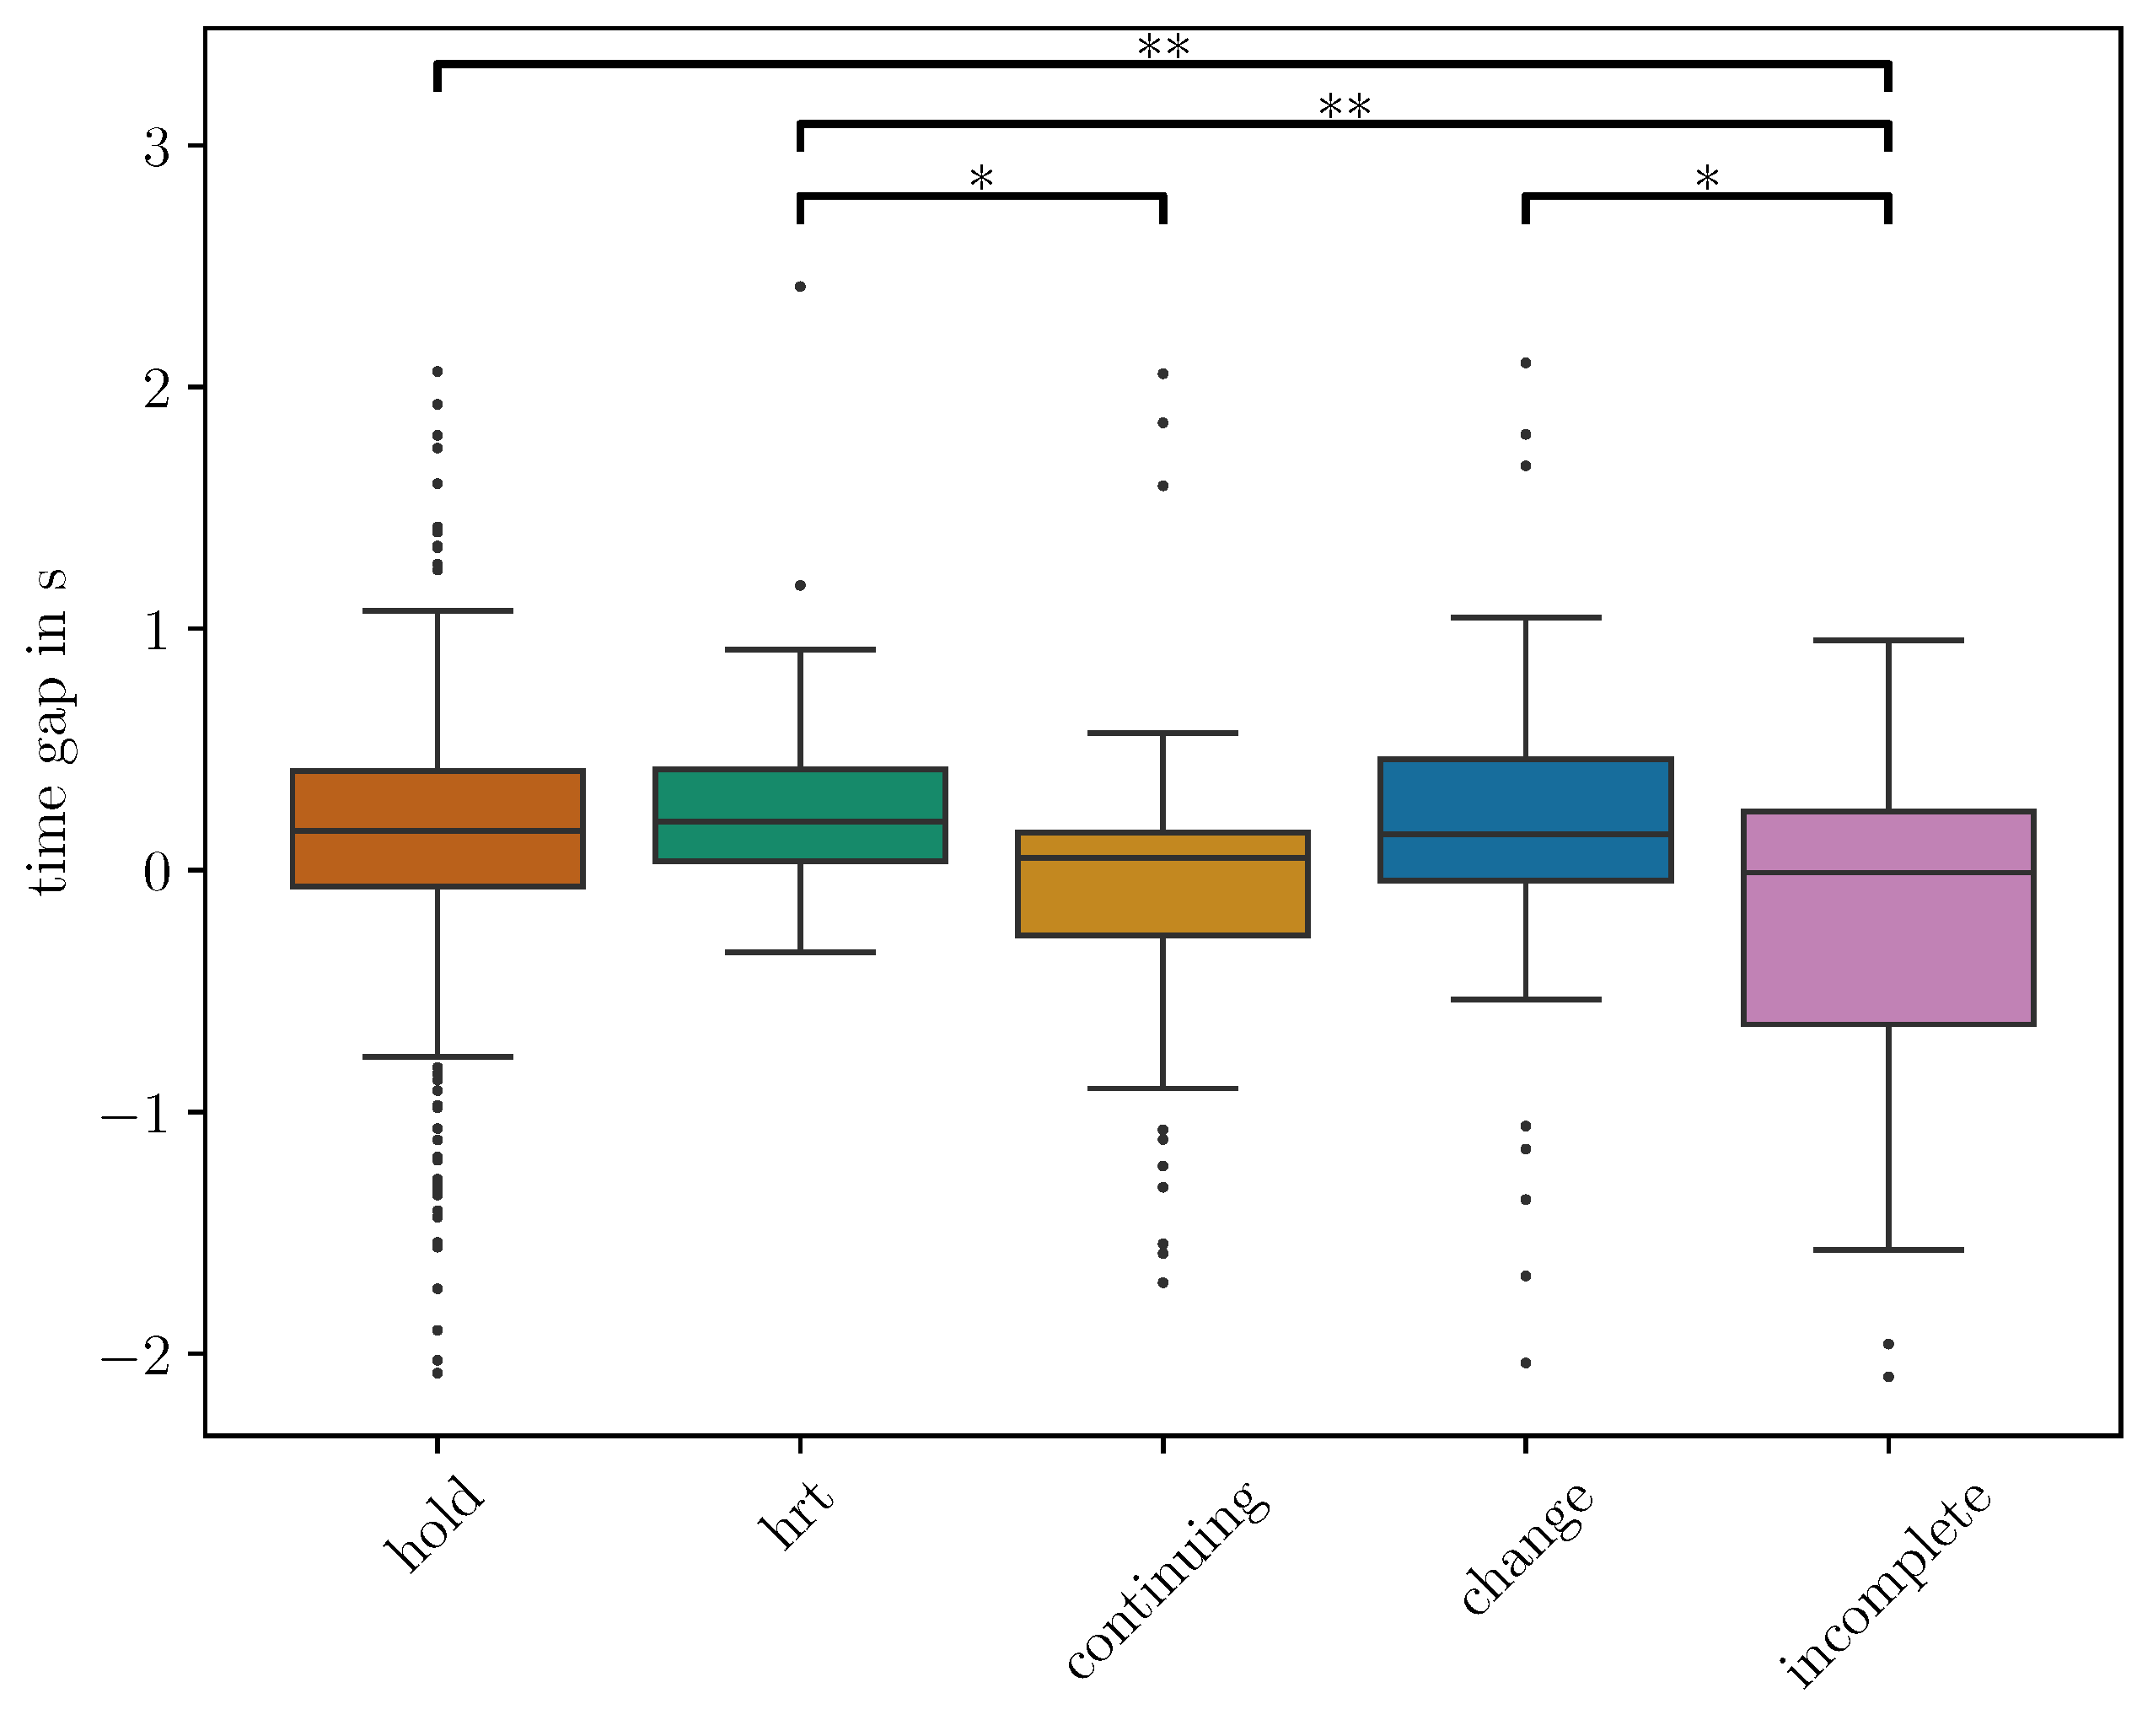
Table 5 shows the model estimates, with the value incomplete serving as the reference level for the label variable. The results of the supplementary models (i.e., for the other values of label) are presented in Appendix A as Table A1, Table A2, Table A3 and Table A4. The results indicate that the time_gap for incomplete is significantly shorter than for hold ( β = 0.35 , t = 2.63 , p < 0.01 ) and hrt ( β = 0.49 , t = 3.14 , p < 0.01 ) and marginally significantly shorter than for change ( β = 0.37 , t = 2.41 , p < 0.05 ). Additionally, the time_gap is marginally significantly longer for hrt than for continuing ( β = 0.23 , t = 2.00 , p < 0.05 ). Figure 11 visualizes these patterns in more detail. It shows that the median time_gap for incomplete and continuing is shorter than for the other turn-taking functions. This suggests that hearer response tokens tend to occur earlier or sometimes even on overlap, when the preceding utterance is either incomplete, disrupted, or a continuation. Moreover, the variance of the time_gap is highest for hold and incomplete, suggesting more flexible timing in these cases. By contrast, utterances labeled as hrt or change not only show the longest median time_gap, but also the lowest variance. Notably, hrt tokens are followed by the fewest overlapping hearer response tokens, which may indicate that hearer response tokens are not typically expected after an hrt.
The output from the final regression model (cf. Table 5) additionally shows that std_art_rate is highly significant ( β = 1.49 , t = 3.78 , p < 0.001 ), indicating that with increasing variation in articulation rate, also the time_gap between preHRT and hearer response token is increasing significantly. The duration of a PCOMP annotation is another highly significant main effect ( β = 0.11 , t = 4.53 , p < 0.001 ), indicating that longer utterances tend to be followed by shorter time gaps. While slope_intensity on its own is not a significant predictor of time_gap, the interaction between duration and slope_intensity is significant ( β = 0.04 , t = 3.25 , p < 0.01 ). These results suggest that both individual prosodic cues and their interaction with the duration of the preceding PCOMP interval shape the timing of hearer response tokens. Similar to the CIT analysis, F0-based features do not appear to play a significant role in predicting the timing of hearer response tokens.
Since the regression model showed a significant interaction effect of duration and slope_intensity, we examine the direction of their interactional effect on time_gap. Figure 12 illustrates this interaction by showing predicted time_gap values across varying duration levels at three representative values of slope_intensity (low: 1.67 , medium: 0.08 , high: 1.51 ). Predictions were computed using the fitted model, holding std_art_rate constant at its median value ( 0.14 ) and fixing the label to hold.
The figure shows that, for hold, longer PCOMP interval durations are associated with shorter time_gap values, suggesting that more extended utterances prompt earlier listener responses. However, this relationship is modulated by the slope of the speaker’s intensity. When slope_intensity is high (i.e., increasing loudness), the time_gap tends to be longer, whereas for lower or negative slope_intensity values (i.e., decreasing loudness), the time_gap becomes shorter. This implies that rising intensity may delay listener responses, possibly signaling continued speaker engagement, while falling intensity may serve as a cue for the listener to respond sooner. Another observation is that for low slope_intensity values, PCOMP intervals longer than approximately 2 s are increasingly associated with negative time_gap values, indicating overlapping responses. In contrast, higher slope_intensity values tend to produce fewer overlaps, even for longer utterances. This suggests that decreasing intensity may not only invite earlier responses, but responses that anticipate a PCOMP point, that is, before the interlocutor has fully finished their utterance.

6. General Discussion

This study set out to investigate the distribution and timing of backchannels in spontaneous conversation, with a particular focus on how they are influenced by the communicative function and the prosody of the preceding utterance. Using the GRASS corpus and its continuous turn-taking annotations based on points of potential completion (PCOMP), we examined whether certain turn-taking functions affect backchanneling behavior. By analyzing these functionally annotated data, our main aim was to develop a contextually grounded understanding of when and how backchannels occur—moving beyond previous work that has often treated backchannels as isolated tokens based primarily on surface-level acoustic cues (e.g., Gravano & Hirschberg, 2011; Poppe et al., 2011).
In the first part of this paper, we examined the distribution of turn-taking labels both globally and across the 12 individual conversations in the dataset. In the second part, we quantitatively analyzed which acoustic–prosodic features, such as fundamental frequency, intensity, duration, and articulation rate, contribute to whether a backchannel occurs. The third part of the study then explored how these features influence the timing of backchannels. Overall, the combination of prosodic measurements with the continuous PCOMP annotations allowed us to confirm earlier findings in the literature while offering new insights into the interactional conditions under which backchannels are produced.
The first part of our analysis on backchannel distributions revealed clear trends both at a global level and across individual conversations. Globally, the majority of backchannels were uttered around points where an interlocutor reached a PCOMP and held their turn (hold). hrt, change and continuing were the second most frequent turn-taking functions preceding a backchannel. These finding aligns with prior work suggesting that speakers tend to invite backchannels when intending to retain the turn, signaling engagement or the need for affirmation from the interlocutor (Hirschberg & Gravano, 2009). However, a closer look at speaker-specific data showed variability in the frequency of backchannels, as well as in the distribution of turn-taking functions. This underlines the importance of taking individual conversational dynamics into account, something which is often lost in more structured, task-oriented dialogue datasets.
In the second part of our analysis, we investigated which factors influence the occurrence of backchannels, comparing the acoustic characteristics of PCOMP tokens followed by a hearer response token to those that were not followed by a hearer response token. The results of the CIT showed that the turn-taking function of the interlocutor’s utterance (represented by PCOMP labels) affects backchanneling behavior. Our findings show that there is a significant difference between longer, more complete utterance structures (hold, change, continuing) and shorter or disrupted ones (hrt, incomplete, particle). In addition to PCOMP function, several acoustic and prosodic features emerged as strong predictors of backchannel occurrences. Most notably, articulation rate variability, utterance duration and changes in intensity over time were consistently ranked among the most important features across both models. In contrast, F0-related features were either absent or ranked lower in our models, which stands in contrast to earlier findings by Hirschberg and Gravano (2009), who identified rising and falling F0 contours as cues for eliciting feedback, and Ward and Tsukahara (2000), who found that prolonged low or flat F0 patterns could have a similar effect. Our results align more closely with prior research suggesting that slower, less variable articulation (Bögels & Torreira, 2021) and falling intensity (Gravano & Hirschberg, 2011) act as reliable indicators for inviting backchannels. Our results extend these findings to spontaneous conversation, showing that such prosodic cues not only align with potential completion points, but also help signal when a backchannel is relevant.
Further support for the importance of prosodic information come from the study by Inoue et al. (2025), who systematically flattened F0 and intensity contours in their backchannel prediction model (Ekstedt & Skantze, 2022) to asses the role of these cues. They found that removing intensity dynamics impaired their model performance, more so than removing F0 information. These results align with our findings that F0 features played only a minor role, while dynamic prosodic cues, particularly rising or falling intensity, played a central role in predicting backchannel occurrence.
By combining functional annotations with prosodic measurements, our models successfully captured a wide range of backchannel-relevant contexts. These findings reinforce the view that backchannels are not elicited by isolated cues, but rather emerge from the interaction between sequential function and prosody. This interplay has also been described by Gravano and Hirschberg (2011), who showed that the probability of backchanneling increases when multiple cues co-occur. Our results further echo Hjalmarsson (2011), who reported a similar phenomenon for turn-taking and turn-yielding cues. Altogether, these findings underscore the value of integrating both functional and prosodic dimensions into models of interaction, particularly in the context of spontaneous speech.
In the third part of our analysis, we examined the timing of backchannels, focusing specifically on how prosodic cues influence the time gap between the end of the interlocutor’s utterance and the onset of a hearer response token. Linear mixed-effects regression models revealed that the duration of the interlocutor’s utterance, articulation rate variability and the interaction between duration and changes in intensity over time significantly affect backchannel timing. Longer utterances were associated with shorter time gaps, suggesting that extended utterances give the listener the opportunity to anticipate when a speaker will reach a point of potential completion. However, this relationship was modulated by the direction of the slope of intensity. Listeners tended to respond more quickly when intensity decreased and more slowly when it increased, suggesting that listeners may perceive increasing loudness as a cue that the speaker is not finished talking yet. These findings are in line with earlier work that links falling prosodic cues to backchannel opportunities (Gravano & Hirschberg, 2011).
In addition to prosodic features, the timing of backchannels varied significantly across different turn-taking functions. Utterances labeled as incomplete were followed by shorter time gaps, whereas hold, change, and hrt were followed by longer ones. This indicates that the functional role of the preceding utterance correlates with the timing of listener responses. Notably, utterances labeled as incomplete, which are typically structurally less complete, were followed by earlier backchannels, while functionally complete utterances were associated with delayed responses.
Together, these findings demonstrate that backchannel timing is shaped by a combination of prosodic dynamics and turn-taking function, rather than any single cue. This aligns with findings by Hjalmarsson (2011), who showed that the presence of multiple turn-taking or turn-yielding cues lead to shorter response times. The observed interaction effects in our analysis show the importance of modeling not only individual prosodic features but also their interaction with conversational structure when analyzing backchannels in spontaneous conversations.
While our study offers valuable insights into backchannel distribution and timing in spontaneous interaction, several limitations remain. Most notably, our analysis is based exclusively on verbal backchannels, excluding non-verbal listener responses such as head nods, facial expressions or gaze. However, prior work has shown that multi-modal cues play a major role in turn-taking and backchanneling. For instance, Blomsma et al. (2024) found that only about one quarter of all backchannels in their experiment were verbal and Bavelas et al. (2002) found that mutual gaze often occurs prior to a backchannel. Since our data stems from face-to-face interaction, the integration of visual cues could provide a richer understanding of backchannel behavior11.
Another limitation of our study is that our findings are based on data from one language only, raising questions about cross-linguistic and cultural generalization possibilities. Backchannel timing and frequency may vary significantly across languages and cultures (Sbranna et al., 2022; White, 1989). Comparative studies using casual speech corpora from other languages (e.g., Ernestus (2000) for Dutch, Ernestus et al. (2014) for Czech, or Torreira and Ernestus (2012) for Spanish) could offer valuable cross-linguistic insights into how and when backchannels are produced. In addition to cross-linguistic aspects, it is also important to investigate how backchanneling varies across different speaking styles. With the recent extension of the GRASS corpus, featuring the same speakers engaged in task-oriented dialogues with unfamiliar conversation partners (Berger et al., 2023), we plan to explore in future work how factors such as interaction context, speaker familiarity, and dialogue type influence backchanneling behavior. Finally, we plan to extend this research towards a model that can be implemented in human–robot interaction and tested in experiments with a large number of users participating in human–robot conversations. For this stream of future research we can build on the groundwork established in the first author’s previous study on real-time backchannel prediction (Paierl et al., 2025).

7. Conclusions

This study presented the following key contributions to the analysis of backchanneling and conversational dynamics: By combining acoustic and prosodic features with turn-taking function annotations of the interlocutor, we demonstrated that backchannel behavior cannot be fully understood through acoustic analysis alone. Our findings showed that the turn-taking function of the preceding utterance—captured by its PCOMP label—plays a central role in both the occurrence and timing of backchannels. We further highlighted the value of using continuous, functionally grounded turn-taking annotations, in this case, the PCOMP tier of the GRASS corpus (Kelterer & Schuppler, 2025), for studying backchanneling behavior. Unlike previous approaches that focus on isolated events or pre-selected tokens, our methodology enables a systematic and data-driven investigation of all utterances, offering a more comprehensive view of how backchannels are distributed and timed in naturally unfolding conversations. These resources, developed and validated by the second and last author, are freely available for non-commercial research and provide a robust foundation for further work on conversational structure by speech scientists and technologists.12.
Moreover, by relying on spontaneous, unscripted face-to-face conversations, this study offers an important perspective to existing research on the occurrence and timing of backchannels and the prosody of the preceding speech, which has often focused on controlled or task-oriented settings (e.g., Hirschberg & Gravano, 2009). Spontaneous interactions exhibit a broader range of turn-taking strategies, more natural timing patterns, and more frequent backchannels, providing a fuller picture of how backchannels emerge and function in natural conversations. By using such conversational data and annotations, we not only provided robust statistical comparisons across functional categories, but also opened new ways for integrating turn-taking behavior into research that supports more natural human–computer dialogue.

Author Contributions

Conceptualization, all authors; methodology, all authors; software, M.P.; validation, B.S.; formal analysis, M.P. and B.S.; data curation, A.K. and B.S.; writing—original draft preparation, M.P. and A.K.; writing—review and editing, all authors; visualization, M.P. and A.K.; supervision, B.S.; project administration, B.S.; funding acquisition, B.S. All authors have read and agreed to the published version of the manuscript.

Funding

This research was funded in part by the Austrian Science Fund (FWF) [10.55776/P32700].

Informed Consent Statement

Informed consent was obtained from all subjects involved in the study.

Data Availability Statement

The corpus used in this study, the GRASS corpus, is available free of cost to academic institutions exclusively for non-commercial research (see: https://www.spsc.tugraz.at/databases-and-tools/grass-the-graz-corpus-of-read-and-spontaneous-speech.html (accessed on 30 July 2025)).

Acknowledgments

For the purpose of open access, the author has applied a CC BY public copyright license to any Author Accepted Manuscript version arising from this submission.

Conflicts of Interest

The authors declare no conflicts of interest. The funders had no role in the design of the study; in the collection, analyses, or interpretation of data; in the writing of the manuscript; or in the decision to publish the results.

Abbreviations

The following abbreviations are used in this manuscript:
F0Fundamental Frequency
preHRTPre Hearer Response Token
noHRTNon-Hearer Response Token
PCOMP(point of) Potential Completion
CAConversation Analysis
TCUTurn Construction Unit
CITConditional Inference Tree
LMERLinear Mixed-Effects Regression Model
GBCGradient Boosting Classifier
AICAkaike Information Criterion

Appendix A

Table A1. Statistical summary with change as reference for the factor label and dependent variable time_gap, N = 468 .
PredictorEstimateStd. Errort-Valuep-Value
Intercept0.100.110.880.38
std_art_rate1.490.393.78<0.001
duration−0.110.02−4.53<0.001
slope_intensity−0.020.02−0.930.35
label (continuing)−0.120.12−1.010.31
label (incomplete)−0.370.16−2.410.02
label (hold)−0.030.10−0.290.78
label (hrt)0.110.120.930.35
duration:slope_intensity0.040.013.25<0.01
Table A2. Statistical summary with continuing as reference for the factor label and dependent variable time_gap, N = 468 .
PredictorEstimateStd. Errort-Valuep-Value
Intercept−0.020.10−0.160.87
std_art_rate1.490.393.78<0.001
duration−0.110.02−4.53<0.001
slope_intensity−0.020.02−0.930.35
label (change)0.120.121.010.31
label (incomplete)−0.260.15−1.740.08
label (hold)0.090.081.080.28
label (hrt)0.230.122.000.05
duration:slope_intensity0.040.013.25<0.01
Table A3. Statistical summary with hrt as reference for the factor label and dependent variable time_gap, N = 468 .
PredictorEstimateStd. Errort-Valuep-Value
Intercept0.210.102.230.03
std_art_rate1.490.393.78<0.001
duration−0.110.02−4.53<0.001
slope_intensity−0.020.02−0.930.35
label (change)−0.110.12−0.930.35
label (continuing)−0.230.12−2.000.05
label (incomplete)−0.490.15−3.14<0.01
label (hold)−0.140.10−1.480.14
duration:slope_intensity0.040.013.25<0.01
Table A4. Statistical summary with hold as reference for the factor label and dependent variable time_gap, N = 468 .
PredictorEstimateStd. Errort-Valuep-Value
Intercept0.070.090.850.40
std_art_rate1.490.393.78<0.001
duration−0.110.02−4.53<0.001
slope_intensity−0.020.02−0.930.35
label (change)0.030.100.290.78
label (continuing)−0.090.08−1.080.28
label (incomplete)−0.350.13−2.63<0.01
label (hrt)0.140.101.480.14
duration:slope_intensity0.040.013.25<0.01

Notes

1
The analyses presented here build on an earlier qualitative analysis by the first author (Paierl, 2024) in the same corpus. The paper also connects to our ongoing work on real-time prediction of backchannels for human–robot interaction (Paierl et al., 2025).
2
3
There is also one backward-looking label indicating when one speaker collaboratively finishes another speaker’s utterance. These (rare) cases always received a double-label with the respective forward-looking label, but are not relevant for the present investigation and are thus not described further here. For a description of this label, see Kelterer and Schuppler (2025, Section 4.2.2).
4
These units overlap to some degree with the concept of Turn Construction Units (TCU) (Sacks et al., 1974; Selting, 2000), not, however, taking into account prosody.
5
A detailed description of these labels illustrated by examples is provided in Kelterer and Schuppler (2025).
6
The annotation process and the training is documented in detail in Kelterer and Schuppler (2025).
7
Even though the second author did not annotate any of the other data, she also segmented the same 300   s for evaluation. The inter-annotator agreement for boundaries between this and the other two annotations by the primary annotator team is 0.93 and 0.95.
8
The category incomplete in Figure 3 comprises turn-holding as well as turn-yielding annotations (cf. Section 3.3). The main criterion for this group, which merged two different annotations, is that no PCOMP point is actually reached because speakers interrupted themselves.
9
We are aware that this is an oversimplification of the concept of TCUs (cf. Selting, 2000), since we neither considered prosody nor multi-unit turn projection for our concept of PCOMP.
10
Note that disruption is grouped together with incomplete in Figure 3 and Figure 4.
11
Half of the conversations in GRASS were also filmed, which is necessary for multi-modal analyses. So far, no multi-modal annotations exist of these video recordings.
12
For more information, see Kelterer and Schuppler (2025).

References

  1. Baayen, R. H., Davidson, D. J., & Bates, D. M. (2008). Mixed-effects modeling with crossed random effects for subjects and items. Journal of Memory and Language, 59(4), 390–412. [Google Scholar] [CrossRef]
  2. Bates, G. G., Mächler, M., Bolker, B., & Walker, S. (2015). Fitting linear mixed-effects models using lme4. Journal of Statistical Software, 67(1), 1–48. [Google Scholar] [CrossRef]
  3. Bavelas, J. B., Coates, L., & Johnson, T. (2002). Listener responses as a collaborative process: The role of gaze. Journal of Communication, 52(3), 566–580. [Google Scholar] [CrossRef]
  4. Beňuš, Š., Gravano, A., & Hirschberg, J. (2011). Pragmatic aspects of temporal accommodation in turn-taking. Journal of Pragmatics, 43(12), 3001–3027. [Google Scholar] [CrossRef]
  5. Berger, E., Schuppler, B., Pernkopf, F., & Hagmüller, M. (2023, September 20–22). Single channel source separation in the wild—Conversational speech in realistic environments. Speech Communication, 15th ITG Conference (pp. 96–100), Achen, Germany. [Google Scholar] [CrossRef]
  6. Blomsma, P., Vaitonyté, J., Skantze, G., & Swerts, M. (2024). Backchannel behavior is idiosyncratic. Language and Cognition, 16(4), 1158–1181. [Google Scholar] [CrossRef]
  7. Boersma, P., & Weenink, D. (2001). PRAAT, a system for doing phonetics by computer. Glot International, 5(9), 341–345. [Google Scholar]
  8. Bögels, S., & Torreira, F. (2021). Turn-end estimation in conversational turn-taking: The roles of context and prosody. Discourse Processes, 58(10), 903–924. [Google Scholar] [CrossRef]
  9. Bravo Cladera, N. (2010). Backchannels as a realization of interaction: Some uses of mm and mhm in Spanish. In Dialogue in Spanish: Studies in functions and contexts (pp. 137–155). John Benjamins Publishing Company. [Google Scholar]
  10. Breiman, L. (2001). Random Forests. Machine Learning, 45(1), 5–32. [Google Scholar] [CrossRef]
  11. Clancy, B., & McCarthy, M. (2014). Co-constructed turn-taking. In Corpus Pragmatics: A Handbook (pp. 430–453). Cambridge University Press. [Google Scholar] [CrossRef]
  12. Clancy, P. M., Thompson, S. A., Suzuki, R., & Tao, H. (1996). The conversational use of reactive tokens in English, Japanese, and Mandarin. Journal of Pragmatics, 26(3), 355–387. [Google Scholar] [CrossRef]
  13. Coates, J., & Sutton-Spence, R. (2001). Turn-taking patterns in deaf conversation. Journal of Sociolinguistics, 5(4), 507–529. [Google Scholar] [CrossRef]
  14. Devlin, J., Chang, M.-W., Lee, K., & Toutanova, K. (2019, June 2–7). BERT: Pre-training of deep bidirectional transformers for language understanding. NAACL: Human Language Technologies (pp. 4171–4186), Minneapolis, MN, USA. [Google Scholar] [CrossRef]
  15. Ekstedt, E., & Skantze, G. (2022, September 18–22). Voice activity projection: Self-supervised learning of turn-taking events. Interspeech (pp. 5190–5194), Incheon, Republic of Korea. [Google Scholar] [CrossRef]
  16. Ernestus, M. (2000). Voice assimilation and segment reduction in casual Dutch: A corpus-based study of the phonology-phonetics interface [Ph.D. thesis, Netherlands Graduate School of Linguistics, Vrije Universiteit te Amsterdam]. Available online: https://research.vu.nl/ws/portalfiles/portal/42168786/complete%20dissertation.pdf (accessed on 30 July 2025).
  17. Ernestus, M., Kočková-Amortová, L., & Pollak, P. (2014, May 26–31). The Nijmegen corpus of casual Czech. LREC (pp. 365–370), Reykjavik, Iceland. Available online: https://hdl.handle.net/11858/00-001M-0000-0018-66A2-3 (accessed on 30 July 2025).
  18. Friedman, J. H. (2001). Greedy function approximation: A gradient boosting machine. Annals of Statistics, 29(5), 1189–1232. Available online: https://www.jstor.org/stable/2699986 (accessed on 30 July 2025). [CrossRef]
  19. Fry, D. (1975). Simple reaction-times to speech and non-speech stimuli. Cortex, 11(4), 355–360. [Google Scholar] [CrossRef]
  20. Gardner, R. (1998). Between speaking and listening: The vocalisation of understandings. Applied Linguistics, 19(2), 204–224. [Google Scholar] [CrossRef]
  21. Geiger, B. C., & Schuppler, B. (2023, August 20–24). Exploring graph theory methods for the analysis of pronunciation variation in spontaneous speech. Interspeech (pp. 596–600), Dublin, Ireland. [Google Scholar] [CrossRef]
  22. Gravano, A., & Hirschberg, J. (2011). Turn-taking cues in task-oriented dialogue. Computer Speech & Language, 25(3), 601–634. [Google Scholar] [CrossRef]
  23. Harris, C. R., Millman, K. J., van der Walt, S. J., Gommers, R., Viranen, P., Cournapeau, D., Wieser, E., Taylor, J., Berg, S., Smith, N. J., Kern, R., Picus, M., Hoyer, S., van Kerkwijk, M. H., Matthew, B., Allan, H., Fernández del Río, J., Wiebe, M., Peterson, P., … Oliphant, T. E. (2020). Array programming with NumPy. Nature, 585(7825), 357–362. [Google Scholar] [CrossRef]
  24. Heinz, B. (2003). Backchannel responses as strategic responses in bilingual speakers’ conversations. Journal of Pragmatics, 35(7), 1113–1142. [Google Scholar] [CrossRef]
  25. Hirschberg, J., & Gravano, A. (2009, September 6–10). Backchannel-inviting cues in task-oriented dialogue. Interspeech (pp. 1019–1022), Brighton, UK. [Google Scholar] [CrossRef]
  26. Hjalmarsson, A. (2011). The additive effect of turn-taking cues in human and synthetic voice. Speech Communication, 53(1), 23–35. [Google Scholar] [CrossRef]
  27. Hothorn, T., Hornik, K., & Zeileis, A. (2006). Unbiased recursive partitioning: A conditional inference framework. Journal of Computational and Graphical Statistics, 15(3), 651–674. [Google Scholar] [CrossRef]
  28. Hothorn, T., Hornik, K., & Zeileis, A. (2015). ctree: Conditional Inference Trees. The Comprehensive R Archive Network, 8, 1–34. [Google Scholar]
  29. Inoue, K., Lala, D., Skantze, G., & Kawahara, T. (1998, April 29–May 4). Yeah, Un, Oh: Continuous and real-time backchannel prediction with fine-tuning of Voice Activity Projection. NAACL: Human Language Technologies (pp. 7171–7181), Albuquerque, NM, USA. [Google Scholar] [CrossRef]
  30. Jadoul, Y., Thompson, B., & de Boer, B. (2018). Introducing parselmouth: A Python interface to Praat. Journal of Phonetics, 71, 1–15. [Google Scholar] [CrossRef]
  31. Kelterer, A., & Schuppler, B. (2025). Turn-taking annotation for quantitative and qualitative analyses of conversation. arXiv, arXiv:2504.09980. [Google Scholar] [CrossRef]
  32. Kelterer, A., Zellers, M., & Schuppler, B. (2023, August 20–24). (Dis)agreement and preference structure are reflected in matching along distinct acoustic-prosodic features. Interspeech (pp. 4768–4772), Dublin, Ireland. [Google Scholar] [CrossRef]
  33. Landis, R. J., & Koch, G. G. (1977). The measurement of observer agreement for categorical data. Biometrics, 33(1), 159–174. [Google Scholar] [CrossRef]
  34. Levshina, N. (2021). Conditional inference trees and random forests. In M. Paquot, & S. T. Gries (Eds.), A practical handbook of corpus linguistics (pp. 611–643). Springer. [Google Scholar] [CrossRef]
  35. Linke, J., Wepner, S., Kubin, G., & Schuppler, B. (2023). Using Kaldi for automatic speech recognition of conversational Austrian German. arXiv, arXiv:2301.06475. [Google Scholar] [CrossRef]
  36. Local, J., & Walker, G. (2012). How phonetic features project more talk. Journal of the International Phonetic Association, 42(3), 255–280. [Google Scholar] [CrossRef]
  37. Maynard, S. K. (1986). On back-channel behavior in Japanese and English casual conversation. Linguistics, 24(6), 1079–1108. [Google Scholar] [CrossRef]
  38. Maynard, S. K. (1990). Conversation management in contrast: Listener response in Japanese and American English. Journal of Pragmatics, 14(3), 397–412. [Google Scholar] [CrossRef]
  39. McCarthy, M. (2003). Talking back: “Small” interactional response tokens in everyday conversation. Research on Language and Social Interaction, 36(1), 33–63. [Google Scholar] [CrossRef]
  40. Noguchi, H., & Den, Y. (1998, November 30–December 4). Prosody-based detection of the context of backchannel responses. ICSLP, Sydney, Australia. [Google Scholar] [CrossRef]
  41. Ogden, R. (2012). The phonetics of talk in interaction—Introduction to the special issue. Language and Speech, 55(1), 3–11. [Google Scholar] [CrossRef]
  42. Paierl, M. (2024). Modeling backchannels for human-robot interaction [Master’s thesis, Graz University of Technology]. [Google Scholar] [CrossRef]
  43. Paierl, M., Schuppler, B., & Hagmüller, M. (2025, August 17–21). Continuous prediction of backchannel timing for human-robot interaction. Interspeech, Rotterdam, The Netherlands. (Accepted for publication). [Google Scholar]
  44. Pedregosa, F., Varoquaux, G., Gramfort, A., Michel, V., Thirion, B., Grisel, O., Blondel, M., Prettenhofer, P., Weiss, R., Dubourg, V., Vanderplas, J., Passos, A., Cournapeau, D., Brucher, M., Perrot, M., & Duchesnay, E. (2011). Scikit-learn: Machine learning in Python. Journal of Machine Learning Research, 12, 2825–2830. [Google Scholar]
  45. Poppe, R., Truong, K. P., & Heylen, D. (2011). Backchannels: Quantity, type and timing matters. In H. H. Vilhjálmsson, S. Kopp, S. Marsella, & K. R. Thórisson (Eds.), Intelligent virtual agents (pp. 228–239). Springer. [Google Scholar] [CrossRef]
  46. Sacks, H., Schegloff, E., & Jefferson, G. (1974). A simplest systematics for the organisation of turn-taking for conversation. Language, 50(4), 696–735. [Google Scholar] [CrossRef]
  47. Sbranna, S., Möking, E., Wehrle, S., & Grice, M. (2022, May 23–26). Backchannelling across languages: Rate, lexical choice and intonation in L1 Italian, L1 German and L2 German. Speech Prosody (pp. 734–738), Lisbon, Portugal. [Google Scholar] [CrossRef]
  48. Schegloff, E. A. (1982). Discourse as an interactional achievement: Some uses of “uh huh” and other things that come between sentences. In D. Tannen (Ed.), Analyzing discourse: Text and talk (pp. 71–93). Georgetown University Press. [Google Scholar]
  49. Schuppler, B., Hagmüller, M., Morales-Cordovilla, J. A., & Pessentheiner, H. (2014, May 26–31). GRASS: The Graz corpus of Read And Spontaneous Speech. LREC (pp. 1465–1470), Reykjavik, Iceland. [Google Scholar]
  50. Schuppler, B., Hagmüller, M., & Zahrer, A. (2017). A corpus of read and conversational Austrian German. Speech Communication, 94, 62–74. [Google Scholar] [CrossRef]
  51. Schuppler, B., & Kelterer, A. (2021, October 4–5). Developing an annotation system for communicative functions for a cross-layer ASR system. First Workshop on Integrating Perspectives on Discourse Annotation (pp. 14–18), Tübingen, Germany. Available online: https://aclanthology.org/2021.discann-1.3/ (accessed on 30 July 2025).
  52. Selting, M. (2000). The construction of units in conversational talk. Language in Society, 29(4), 477–517. [Google Scholar] [CrossRef]
  53. Sikveland, R. O. (2012). Negotiating towards a next turn: Phonetic resources for ‘doing the same’. Language and Speech, 55(1), 77–98. [Google Scholar] [CrossRef]
  54. Stalnaker, R. (2002). Common ground. Linguistics and Philosophy, 25(5/6), 701–721. Available online: https://www.jstor.org/stable/25001871 (accessed on 30 July 2025). [CrossRef]
  55. Stubbe, M. (1998). Are you listening? Cultural influences on the use of supportive verbal feedback in conversation. Journal of Pragmatics, 29(3), 257–289. [Google Scholar] [CrossRef]
  56. Torreira, F., & Ernestus, M. (2012). Weakening of intervocalic/s/in the Nijmegen corpus of casual Spanish. Phonetica, 69(3), 124–148. [Google Scholar] [CrossRef]
  57. Virtanen, P., Gommers, R., Oliphant, T. E., Haberland, M., Reddy, T., Cournapeau, D., Burovski, E., Peterson, P., Weckesser, W., Bright, J., van der Walt, S. J., Brett, M., Wilson, J., Millman, K. J., Mayorov, N., Nelson, A. R. J., Jones, E., Kern, R., Larson, E., … van Mulbregt, P. (2020). SciPy 1.0: Fundamental algorithms for scientific computing in Python. Nature Methods, 17, 261–272. [Google Scholar] [CrossRef]
  58. Vogel, A. P., Maruff, P., Snyder, P. J., & Mundt, J. C. (2009). Standardization of pitch-range settings in voice acoustic analysis. Behavior Research Methods, 41(2), 318–324. [Google Scholar] [CrossRef]
  59. Ward, N., & Tsukahara, W. (2000). Prosodic features which cue back-channel responses in English and Japanese. Journal of Pragmatics, 32(8), 1177–1207. [Google Scholar] [CrossRef]
  60. White, S. (1989). Backchannels across cultures: A study of Americans and Japanese. Language in Society, 18(1), 59–76. [Google Scholar] [CrossRef]
  61. Yngve, V. H. (1970, April 16–18). On getting a word in edgewise. Chicago Linguistic Society (pp. 567–578), Chicago, IL, USA. [Google Scholar]
  62. Zellers, M. (2017). Prosodic variation and segmental reduction and their roles in cuing turn transition in Swedish. Language and Speech, 60(3), 454–478. [Google Scholar] [CrossRef] [PubMed]
  63. Zellers, M., Gubian, M., & Post, B. (2010, September 26–30). Redescribing intonational categories with Functional Data Analysis. Interspeech (pp. 1141–1144), Makuhari, Japan. [Google Scholar]
Figure 1. Temporal visualization of the extraction process. The reaction time threshold t reaction time = Δ t min = 200   m s accounts for the human reaction time. The 600   m s window represents the interval of the interlocutor’s turn used for label and prosodic feature extraction.
Languages 10 00194 g001
Figure 2. Visualization of case distinctions in the extraction of audio tokens and their corresponding labels, based on the PCOMP annotations of hearer response token and preHRT: (a) with no overlap, (b) with overlap, (c) with only a small overlap, (d) with a short preHRT and (e) with overlap and multiple annotations.
Languages 10 00194 g002
Figure 3. Absolute counts of the six most common PCOMP labels across all 12 conversations annotated in GRASS (left) and relative frequencies, where each bar is normalized (right). In both panels, the shaded areas represent the subset of PCOMPs that directly precede a hearer response token.
Languages 10 00194 g003
Figure 4. Absolute amount of PCOMP intervals produced by each speaker, sorted by the six most common turn-taking functions of the PCOMPs. The IDs of conversation partners are depicted next to each other. The shaded areas represent the subset of PCOMPs that directly precede a hearer response token.
Languages 10 00194 g004
Figure 5. 25 s of conversation from 001M002M. The time course is represented on the x-axis, each line represents one speaker, and boxes indicate PCOMP intervals. hrts are indicated in green, turn-holding PCOMPs in warm colors, and turn-yielding PCOMPs in shades of blue.
Languages 10 00194 g005
Figure 6. 32 s of conversation (038F039F) showing a narrative sequence. The time course is represented on the x-axis, each line represents one speaker, and boxes indicate PCOMP intervals. 038F’s turn-holding PCOMPs are indicated in warm colours, and 039F’s hrts are indicated in green.
Languages 10 00194 g006
Figure 7. 32 s of conversation (029F030F) showing a narrative sequence. The time course is represented on the x-axis, each line represents one speaker, and boxes indicate PCOMP intervals. 030F’s turn-holding PCOMPs are indicated in warm colours, and 029F’s one hrt is indicated in green.
Languages 10 00194 g007
Figure 8. Conditional Inference Tree (CIT) trained to classify whether a PCOMP segment is followed by a hearer response token (preHRT) or not (noHRT). The model was trained on a balanced dataset with parameters alpha = 0.05 , minsplit = 40 , minbucket = 40 , numsurrogate = TRUE , and maxsurrogate = 10 . Terminal nodes show the distribution of the two classes: dark gray indicates the proportion of preHRTs and light gray the proportion of noHRTs. The percentage in each bar reflect the occurrence frequency of a hearer response token given the feature-based splits above.
Languages 10 00194 g008
Figure 9. Feature importance of a Gradient Boosting Classifier of the 10 most important features for the classification if a PCOMP is followed or not followed by a hearer response token. The values were computed with default model parameters.
Languages 10 00194 g009
Figure 10. Histogram of the time_gap duration for all preHRTs. The distribution is right-skewed, with a median around 0.14 s , indicating that most hearer response tokens occur shortly after the preceding utterance. Negative values indicate overlap between preHRT and hearer response token.
Languages 10 00194 g010
Figure 11. Boxplot showing the distribution of time_gap durations (in seconds) between the preHRT and the hearer response token, across the five most frequent turn-taking functions. Pairwise statistical comparisons were conducted using a linear mixed-effects regression model, with significance levels indicated by asterisks above the boxes, with the following thresholds: * p < 0.05 , ** p < 0.01 .
Languages 10 00194 g011
Figure 12. time_gap vs. duration across varying intensity slopes. It shows how the relationship between duration and time_gap differs with slope_intensity. Shaded bands represent 95% confidence intervals. The results are adjusted for std_art_rate = 0.14 and label hold.
Languages 10 00194 g012
Table 1. Overview of all PCOMP labels used in this paper, adapted from Kelterer and Schuppler (2025). For a description of which labels were excluded or grouped together with other labels in this study, see Section 3.
PCOMP LabelDefinition
holdsame speaker continues speaking after the PCOMP by starting a new sentence
continuingsame speaker continues speaking after the PCOMP by continuing the same sentence with the addition of increments
changeother speaker continues speaking after the current speaker reaches a PCOMP
particlediscourse particle uttered after a PCOMP or at the beginning of a turn
question-particlequestion particle (tag question) that transforms a declarative utterance into a question or is used to elicit some kind of listener feedback (e.g., a backchannel)
questionsyntactic and/or prosodic question
hesitationhesitation particle uttered after a PCOMP or at the beginning of a turn
hrthearer response token; usually short backchannels, continuers, acknowledgments, etc., that do not contain a (new) proposition of their own and do not take up the turn (though a new turn may be started by the interlocutor who uttered the hrt if the previous speaker does not continue their turn after the hrt)
disruptioncurrent speaker does not reach a PCOMP, but interrupts themselves to rephrase and start a new sentence
incompletecurrent speaker does not reach a PCOMP before the other speaker takes up the turn
label_labelcombination of two of the labels above, e.g., when both interlocutors start speaking simultaneously after a pause
@indicates uncertainty about a label (cf. Section 2.2.3); may also co-occur with a combined label to indicate the uncertainty between two specific labels (cf. Section 2.2.4)
Table 2. Overview of all factors, features and feature categories used in this study. The feature set includes one categorical factor, two durational features, and eight features each for F0, intensity, and articulation rate, resulting in a total of 27 features.
Factor/FeatureTypeDescription
PCOMP labelcategoricalfunctional label assigned to each preHRT, indicating its turn-taking role (e.g., hold, change, hrt)
Durational featuresfloatthe total duration (in seconds) of the preHRT, the temporal gap (in seconds) between the end of the preHRT and the onset of the following hearer response token
F0 featuresfloatmean, median, standard deviation, slope, maximum (and its position), and minimum (and its position) of the fundamental frequency (F0)
Intensity featuresfloatmean, median, standard deviation, slope, maximum (and its position), and minimum (and its position) of the signal intensity
Articulation rate featuresfloatmean, median, standard deviation, slope, maximum (and its position), and minimum (and its position) of the articulation rate
Table 3. Token frequency: number of PCOMPs overall and those preceding a hearer response token for the six most common PCOMP labels.
PCOMP LabelnoHRT PCOMPspreHRT PCOMPsTotal
hold7412771018
hrt49057547
continuing32864392
change25347300
incomplete2592329
particle2060206
total22774682745
Table 4. Classification metrics for the Gradient Boosting Classifier model trained with default model parameters.
AccuracyRecallPrecisionF1
0.69170.69830.69440.6934
Table 5. Statistical summary with incomplete as reference for the factor label and dependent variable time_gap, N = 468 .
Predictor β Std. Errort-Valuep-Value
Intercept−0.270.15−1.800.07
std_art_rate1.490.393.78<0.001
duration−0.110.02−4.53<0.001
slope_intensity−0.020.02−0.930.35
label (change)0.370.162.410.02
label (continuing)0.260.151.740.08
label (hold)0.350.132.63<0.01
label (hrt)0.490.153.14<0.01
duration:slope_intensity0.040.013.25<0.01
Disclaimer/Publisher’s Note: The statements, opinions and data contained in all publications are solely those of the individual author(s) and contributor(s) and not of MDPI and/or the editor(s). MDPI and/or the editor(s) disclaim responsibility for any injury to people or property resulting from any ideas, methods, instructions or products referred to in the content.