1. Introduction
Heritage language studies often include comparison to a homeland/monolingual variety, whether that homeland variety is imagined/idealized or studied through data collected through psycholinguistic experiments or comparative variationist sociolinguistics. No matter the methodology, such studies often attribute variation within heritage speech to language interference from the dominant language to the heritage language. However, the situation is more complex. Some additional considerations are discussed in this section, before we turn to examine the case of vowel shift in Heritage Korean in the Greater Toronto Area (hereafter, Toronto), working within the comparative variationist sociolinguistic framework (cf.
Poplack & Tagliamonte, 2001;
Rickford & McNair-Knox, 1994).
While heritage speakers are generally considered to be multicompetent in terms of distinguishing the phonological systems of the heritage and dominant languages (
Cheng, 2021 for Heritage Korean;
Chang et al., 2011 for Heritage Mandarin;
McCarthy et al., 2013 for Heritage Sylheti), there are instances in which heritage speakers pattern differently from homeland speakers. These differences are frequently attributed to dominant language interference that causes a mixed phonological system (see
Godson, 2004 for Heritage Western Armenian;
Kim, 2011 for Heritage Spanish;
Asherov et al., 2016 for Heritage Russian). An alternative account exists: Heritage language variability demonstrates sociolinguistic competence. That is, HSs may either initiate or carry forward a pattern of variation from the homeland variety. In the case of participating in an ongoing change, there may be cases of incomplete transmission (rather than diffusion) of a homeland pattern (cf.
Labov, 2007).
Ongoing changes in the homeland may be reflected in heritage language but misattributed to dominant language interference in the HS context. For example, Heritage Russian speakers in Toronto show decreasing rates of null subjects across generations (
Nagy, 2015). This trend could be attributed to English interference, as English has a very low rate of null subjects (2–5%,
Harvie, 1998;
Benallick, 2010;
Marr, 2011). However, a trend of decreasing rates of null subjects is also reported in homeland speakers, with younger speakers using fewer than older speakers (
Nagy, 2015). Here, language change in the homeland is continued in heritage speakers’ production. In such cases, reproduction of patterns of effects of social factors, in particular, may be taken as evidence of sociolinguistic competence.
Additionally, it is not surprising that heritage speakers vary in how much they participate in language shifts from homeland varieties.
Tse (
2019) reported that Heritage Cantonese speakers in Toronto participate in some vowel shifts ([y] retraction, [i] fronting) but not others ([ɪ, ʊ, ɔ] backing, [ɛ] split). Importantly, heritage speakers show differences in conditioning effects for both linguistic and social factors. Namely, age is a significant predictor for homeland participation, but generation since immigration, not age, is a significant predictor for HS participation in the vowel shift. Linguistic constraints also exhibit variation, e.g., a linguistic constraint, presence of coda, is a significant predictor for /ɛ/-fronting in the Gen2 model but not for Gen1 or homeland speakers (
Tse, 2019, p. 209).
Heritage speakers also exhibit different degrees and directions of participation in homeland sound changes. Currently, homeland speakers in Seoul, South Korea, are reweighting the cues used to distinguish three series of stops, namely, fortis (such as [t*al] “
daughter”), lenis (such as [tal] “
moon”), and aspirated (such as [t
hal] “
disease”). The primary cue used to be Voice Onset Time (VOT) or the duration of the period of aspiration following the release of a stop. However, younger speakers increasingly use f0 (fundamental frequency of the sound wave) of the following vowel as the primary cue (cf.
H. Kang & Han, 2013;
Y. Kang, 2016;
Bang et al., 2018). Although females lead this change in the homeland, Heritage Korean speakers in Toronto do not show quite the same conditioning patterns (
Y. Kang & Nagy, 2016). Instead, Heritage Korean speakers are potentially slowing or reversing the shift to maintain the VOT contrast (
Y. Kang & Nagy, 2016). The reversal may be motivated by the English phonological system, as VOT is a salient cue used to differentiate voiced and voiceless stops (
Liberman et al., 1961;
Lisker, 1986;
Lisker & Abramson, 1964,
1967).
Previous research on heritage language participation in homeland vowel shifts often involves processes that are unattested or uncommon in the dominant language (for example, lenis vs. aspirated stop contrasts, pro-drop, and shifts involving vowels that are not in the English inventory). Additionally, it is harder to distinguish dominant language interference from heritage language influence when both the dominant and the heritage language are undergoing concurrent processes, the situation we address in this paper. To assist in this distinction, we draw on the framework presented in
Meyerhoff (
2009), which distinguishes types of cross-language influence according to how similar the patterns of constraints are between the languages, with the implication that greater similarity in constraint hierarchies (that is, how and if conditioning effects are shared) reflects more intense contact. We argue that this provides a more accurate picture of the system than comparing just the rates or degrees of vowel shift overall. Meyerhoff’s model is quoted in (i)–(iii), and in our work, we ask whether (or to what extent) English and Homeland Korean can each serve as the
model, if Heritage Korean is the
replica.
- (i)
Where the same factor groups are significant constraints on a variable in the model and in the replica varieties, let us call this weak transfer or replication;
- (ii)
Where the same factor groups are significant in both model and replica, and the ordering of these factor groups is the same in both model and replica, let us call this (strong) transfer;
- (iii)
Where the same factor groups are significant in both model and replica, and the ordering of these factor groups is the same in both model and replica, and the factors within groups have the same ranking in model and replica, let us call this
calquing (
Meyerhoff, 2009, p. 303) [italics added].
In particular, we show how it is possible to distinguish “Korean-based” from “English-based” u-fronting by comparing the behavior of the constraints on fronting in the two languages, as well as how /u/-fronting fits into broader vowel shifts ongoing in both languages.
1.1. Research Questions and Focus of Investigation
Both North American English and Seoul Korean’s /u/ are currently advancing (fronting) in the F2 dimension (for English, cf.
Denis et al., 2023;
Umbal, 2021;
Hall & Maddeaux, 2020;
Hoffman, 2016; for Korean, cf.
Han & Kang, 2013;
Y. Kang, 2016;
Kong & Kang, 2018). A fronted vowel is produced further forward in the vocal tract compared to its non-fronted equivalent, such as “
goose” realized as [gus] when non-fronted and as [gu̟s] when fronted. Examples of the relevant vowels in Korean are introduced below when we define the independent variables. Korean Canadians are described as participating in /u/-fronting in English (
S. Cho, 2023), and Heritage Korean speakers in California have /u/-fronting in their Korean (
Cheng, 2019). However, it is unclear what the sources of this sound change are. In this paper, we focus on Korean Canadians living in Toronto, and to better understand HSs’ sociolinguistic competence, we ask the following:
Are Heritage Korean speakers fronting /u/ in Korean due to Korean influence or due to English influence? Might the shift in one language influence the other?
Are Heritage Korean speakers fully participating in the three-vowel shift (involving /o/, /u/, and /ɨ/) that is underway in Seoul Korean?
Contemplating
Meyerhoff’s (
2009) model (see i–iii), what can the examination of the conditioning effects of social and linguistic factors tell us about heritage language variation and change?
In order to tease apart the effects of English and Korean on the heritage language (HL) change in progress, it is critical to examine not only /u/-fronting (see Research Question 1) but also the two other vowels that are part of the vowel shift in Seoul Korean. One vowel, /ɨ/, involved in the Korean shift is not present in English. A second is not shifting in the same direction: /o/ is fronting in Toronto English (
Hoffman, 2016) but raising in Seoul Korean (cf.
H. Kang & Han, 2013;
Y. Kang, 2016). Thus, they provide ideal counterpoints for determining the source of the Heritage Korean /u/-fronting pattern. These shifts are illustrated in
Figure 1. If Heritage Korean speakers are only fronting /u/ due to English interference, it is unlikely that they would participate in other homeland processes that are part of the same shift. Rather, if Heritage Korean speakers show overall participation in the homeland shift, it suggests that Homeland Korean influences /u/-fronting in Heritage Korean.
Seoul Korean has a back chain vowel shift where /o/ is raising and both /u/ and /ɨ/ are fronting (cf.
Han & Kang, 2013;
Y. Kang, 2016;
Kong & Kang, 2018). Similar to the case with stop contrasts originally distinguished by VOT (see above) but increasingly marked by f0, homeland speakers are in the process of reweighting the cues used to distinguish the back vowels. Whereas F1 (vowel height) was previously used to distinguish /u/ and /o/, younger speakers increasingly use F2 (vowel backness) to distinguish them (
Yang, 1996;
Moon, 2007). This change is described as beginning with /o/-raising and is led by younger female speakers (
Han & Kang, 2013).
Moon (
2007) suggested that the sex-based contrast is marked in vowel production, where females show a greater F2 difference between /o/ and /u/, but males instead show a greater F1 difference. Younger speakers of both genders are described as relying on F2 differences more than older speakers do, who use the conservative F1 cue (
H. Kang & Han, 2013;
Kong & Kang, 2018).
Griffin (
2023), in a preliminary examination of data from the same corpus we are using in this paper, did not find evidence of F1 differences between generations or age groups. This change appears to still be in progress as there is a mismatch between production and perceptual tasks, where it is unclear whether F1 or F2 is the dominant cue (
Igeta & Arai, 2011;
Igeta et al., 2014). The third vowel’s participation in the shift, /ɨ/, is relatively underexplored, so we investigate whether it shares the same conditioning as the other two vowels.
In contrast, /u/ and /o/ are both reported to be fronting (but not raising) across multiple Canadian English varieties, including those spoken in Toronto (
Denis et al., 2023;
Hoffman, 2016;
Hall & Maddeaux, 2020;
Umbal, 2021), Montreal (
Boberg, 2008;
S. Cho, 2023), and Vancouver (
S. Cho, 2023). In Toronto, this change is primarily advanced by younger female speakers (
Denis et al., 2023;
Hoffman, 2016). Ethnicity appears to be a conditioning factor, as
Hoffman (
2016) reported consistent /u/-fronting in speakers of Chinese, Anglo, and Portuguese (but much less so for Italian) descent, and
Umbal (
2021) found that the Filipino community in Toronto fronts /u/ more than Anglo Canadians do. In addition, cultural orientation can affect the degree of /u/-fronting, as younger Italian male speakers are found to exhibit less fronting of back vowels to resist association with the mainstream sound shift (
Hoffman, 2016). /ɨ/ is not part of the inventory of Canadian English phonemes, so we cannot consider a transfer of effect from English to Heritage Korean for that vowel.
1.2. Background: Conditioning of the Vowel Shifts
To determine the source of /u/-fronting in Heritage Korean, we compare its patterns of conditioning effects to those of Homeland Korean and English. If heritage groups share more conditioning effects with homeland speakers, e.g., social or linguistic predictors, then this similarity in their phonological grammars suggests that heritage speakers’ vowels are influenced by Homeland Korean. However, if HSs do not share many effects with homeland speakers, then this suggests that heritage speaker vowel production may have alternate influences (such as contact-based language change, or influence of contact with English). We consider whether Heritage Korean reflects replication, transfer, or calquing (as defined in
Meyerhoff (
2009), see i–iii above) from both Homeland Korean and English or just from one language. That is, to tease apart the effects of Korean and English on heritage speakers’ production of vowels in Korean, we compare the effects of a selection of linguistic and social factors. Previous studies have shown that two linguistic factors, WordPosition and Duration, affect vowel realization in Seoul Korean but not in Toronto English. In contrast, phonological context, particularly the Place of articulation (PoA) of the following segment, conditions /u/-fronting in English: /u/-fronting is favored following coronals and blocked following laterals (
Denis et al., 2023;
Hall & Maddeaux, 2020). Additionally, the gender of the speaker influences /u/-fronting differently in the two languages. Thus, these predictors may be used to distinguish the influence of each of these languages on Heritage Korean.
We next expand on these predictors, considering first the linguistic and then the social factors in
Table 1. Syllable prominence effects are attested for the vowel shift in Seoul Korean (
H. Kang & Han, 2013). Namely, /o/ and /u/ tend to be more fronted in non-initial syllables (
Y. Kang, 2016). Duration also correlates with the realization of vowels in Seoul Korean.
Y. Kang (
2016) and
Oh (
2016) both found that shorter duration is associated with greater degrees of raising and centralizing for vowels in this shift. If heritage speakers share these effects of WordPosition and Duration, this suggests that their participation in the vowel shift is transferred from the homeland process rather than being an effect of a contact-induced shift (since English has not been shown to have either WordPosition or Duration as factors governing vowel shift). In contrast, the effects of adjacent phonological context could suggest transfer from English. However, we must keep in mind that back vowel fronting in postcoronal contexts is cross-linguistically attested (
Hillenbrand et al., 2001;
Oh, 2008).
Relevant social factors include ethnic orientation (as measured by questionnaire scores), age, generation, and gender. Ethnic orientation is described as playing a role in determining which speaker groups participate or advance changes in varieties of English, such as Houston Urban English (
Niedzielski, 2013).
Jeon (
2017) found that ethnic orientation scores for Korean Americans in Texas are negatively correlated with /o/-fronting in Houston Urban English. That is, the more strongly the Korean Americans aligned themselves with their Korean identity, the less likely they were to participate in /o/-fronting. Based on this, and some findings from
Hoffman and Walker (
2010) regarding ethnic orientation effects in Toronto English, we predict that alignment to Korean identity will influence participation in Korean sound shifts and that higher ethnic orientation scores (more alignment towards Korea) are associated with greater degrees of /o/-raising, /u/-fronting, and /ɨ/-fronting in Korean.
Younger female speakers are attested as leading /u/-fronting in both Korean and English, so these social factors do not provide much information about the source of the shift. In contrast, the change is described as farther along in Korean than English, with all younger speakers using F2 as the primary production cue to distinguish Korean back vowels rather than F1. Primarily younger female speakers are described as advancing English /u/-fronting (
Denis et al., 2023). Our data given below indicate that there are no gender effects for homeland speakers for either /o/- or /ɨ/-fronting, although previous literature suggests that females are advancing the change for /o/-fronting (
Kong & Kang, 2018). This provides a further distinction from English, where o-fronting is led by females (
Hoffman, 2016). Lastly, we expect to see generational effects, with Gen2 speakers (children of immigrants) exhibiting more fronting than Gen1 (immigrants), based on the English pattern reported in
Hoffman (
2016).
To summarize, the effects of the linguistic and social factors listed in
Table 1 are compared to those in Heritage Korean speech to determine whether there is greater similarity to Homeland Korean or Canadian English vowel shift patterns. We interpret the greater similarity as evidence for the source of the change.
2. Materials and Methods
Vowel production data come from the Heritage Language Documentation Corpus (
Nagy, 2009,
2011), which comprises transcribed recordings from the Heritage Language Variation and Change in Toronto Project (
Nagy, 2024). Sociolinguistic interviews with 26 speakers were the source of spontaneous speech for the current analysis. This method differs from previous studies on Seoul Korean vowels, which principally used laboratory speech (
H. Kang & Han, 2013;
Oh, 2016;
Kong & Kang, 2018).
2.1. Social Variables Defined
We compare three speaker groups: Homeland (HOM), Generation 1 (Gen1), and Gen2 (Gen2). HOM speakers were born and remained in Seoul, South Korea. There are two generations of Heritage Korean speakers in the corpus. Gen1 speakers were born and raised in Seoul and moved to Toronto after the age of 18. They had lived in Toronto for at least 20 years at the time of recording. (One exception is K1F28A, who arrived as an 18-year-old but has only been in Canada for 10 years.) Gen2 speakers have at least one Gen1 parent (usually both) and were born in Toronto or arrived before the age of 5. Speakers were not tested for language proficiency. All participants self-reported that they were willing to converse for an hour in Korean. The Gender of the speaker is based on each speaker’s self-reported gender identity. The distribution of speakers by Generation, Gender, and Age is presented in
Table 2. Capitalization indicates factor and level labels.
We use two ethnic orientation scores to quantify heritage speakers’ linguistic and cultural practices. These are created by first quantifying open-ended responses to a 37-part ethnic orientation questionnaire, administered verbally after each sociolinguistic interview. Each question is scored on a 3-point scale, with higher values indicating stronger orientation to Korean language/culture/identity than to Canadian or English.
Second, scores for 230 speakers across eight languages were subjected to Principal Components Analysis to determine the most revealing response patterns. These patterns fell on two scales, which we defined as EO-Language and EO-Family. The EO-Language score is most influenced by the following questions, listed from greatest to least effect (for further details, see
Nagy (
2024):
Do you prefer to speak Korean or English?
What language do you speak with your friends?
What language do you speak when you are talking about something personal? When you are angry?
Where were you born (Seoul or Toronto)?
Where did you go to school (Seoul or Toronto)?
Thus, the EO-Language score primarily indicates the self-reported choices the speaker currently makes in whether to speak Korean or English. In contrast, the EO-Family score is most influenced by the following questions, again in descending order of how much they contribute to the score:
Did/do you speak to your parents in Korean? Your grandparents?
Do your parents think of themselves as Korean, Canadian, or Korean Canadian?
How old were your parents when they came to Canada?
Is your husband/wife/boyfriend/girlfriend Korean?
Does your partner speak Korean? Do you speak Korean to your partner?
While it is not easy to define a shared focus among these questions, the EO-Family score is based primarily on responses about the cultural identity of people close to the speaker—not the speaker’s own identity. We consider that a speaker has more agency in deciding what language to use with their partner than with older family members, as these latter practices are likely to be set when the speaker is young. Furthermore, parents and grandparents may not be the primary interlocutors of adult speakers at the time of the recordings.
Heritage Korean speakers in this vowel study were selected to provide a maximal spread of ethnic orientation scores, to maximally probe the effect of these scores. Subsequently, HOM speakers were selected to age-match the heritage speaker sample. The EO scores for the Korean speakers included in the cross-linguistic Principal Components Analysis range from −2.8 to 2.9 for EO-Language and from −1.6 to 3.6 for EO-Family.
1 Note that no EO questionnaires are administered with HOM speakers—we do not expect them to orient toward Canadian culture or the English language in a relevant way.
The 26 speakers selected for the vowel analysis include 13 younger speakers (15–39) and 13 older speakers (45–85). Because of our definitions for generations of heritage speakers, described above, coupled with the availability in the population, age and generation are collinear, with Gen2 including younger speakers than Gen1 (Pearson’s rho = −0.78,
p < 0.01). EO-Language is also correlated with both Age (Pearson’s rho = −0.56,
p = 0.02) and Generation (Pearson’s rho = 0.67,
p < 0.01), while EO-Family is correlated with neither Age (Pearson’s rho = 0.12,
p = 0.65) nor Generation (Pearson’s rho = −0.34,
p = 0.20). These patterns are illustrated in
Figure 2, in which speakers are arranged left to right by age. The Gen2 speakers are on the left side of the graph, and with one exception, the Gen1 speakers are on the right side. Each speaker is labeled with a code which includes “K” for Korean, “1” or “2” to indicate their heritage generation, “F” or “M” for their gender, two digits recording their age and a final letter to distinguish otherwise identically coded speakers. Note that Speaker K1F28A, the speaker who does not quite fit the “Gen1” definition because she had been in Toronto for only 10 years at the time of the recording, aligns with Gen2 women in their 20s for the EO-Family score.
2.2. Data Preparation
Based on the annotations created in ELAN, recordings were chunked into sentence-level segments using Praat (
Boersma & Weenink, 2023;
Wittenburg et al., 2006). These audio recordings and transcriptions were time-aligned at the segmental level using
Yoon and Kang’s (
2012) Korean-specific forced alignment system. Praat was then used to extract formants at five equidistant points from each vowel using the “To Format (burg)” method (
Boersma & Weenink, 2023). The durational midpoint measure was used in this analysis since it is the most stable value (less influenced by adjacent segments). Trial and error determined appropriate and reliable formant ceilings to apply for extracting formants. Male speakers were given a ceiling of 4500 Hz for back vowels and 5000 Hz for front vowels, while female speakers were given a ceiling of 5000 Hz for back vowels and 5500 Hz for front vowels. We measured 130,064 tokens across all speakers for all vowels, but here focus on a smaller set, culled as follows.
All tokens with undefined F1 and F2 values were removed (n = 242), as well as tokens shorter than 5 ms (n = 49,252) or longer than 200 ms (n = 15,031). Tokens shorter than 5 ms were excluded to remove potential instances of vowel devoicing, while tokens longer than 200 ms were usually due to alignment errors (
Y. Kang, 2016). These tokens were further processed in R (
R Core Team, 2024) to remove measurement errors and outliers (n = 5457), which were identified by converting F2 values to z-scores and removing all tokens that were at least two standard deviations away from the average values from each speaker group (separated by gender and by vowel). From this total, 26,329 tokens from non-target vowels (e.g., /e/ or /i/) were excluded. Lastly, tokens where the /o/ or /u/ vowel came from a code-switching component were removed (n = 41), e.g., if a speaker used the English word “Korean” during the interview. This left 33,753 tokens for analysis (approximately 26% of original tokens).
2.3. Dependent Variables
We normalize the raw formant measurements using a vowel-intrinsic, speaker-intrinsic method, following recommendations from
Thomas and Kendall (
2007) and
Watt et al. (
2011). We opted for a vowel-intrinsic method because we have culled the data set only for a subset of vowels, rather than the whole vowel space. That is, normalization of each vowel is based on measurements of only that vowel. Such methods are “immune to differences in the phonological inventories of dialects or languages” (
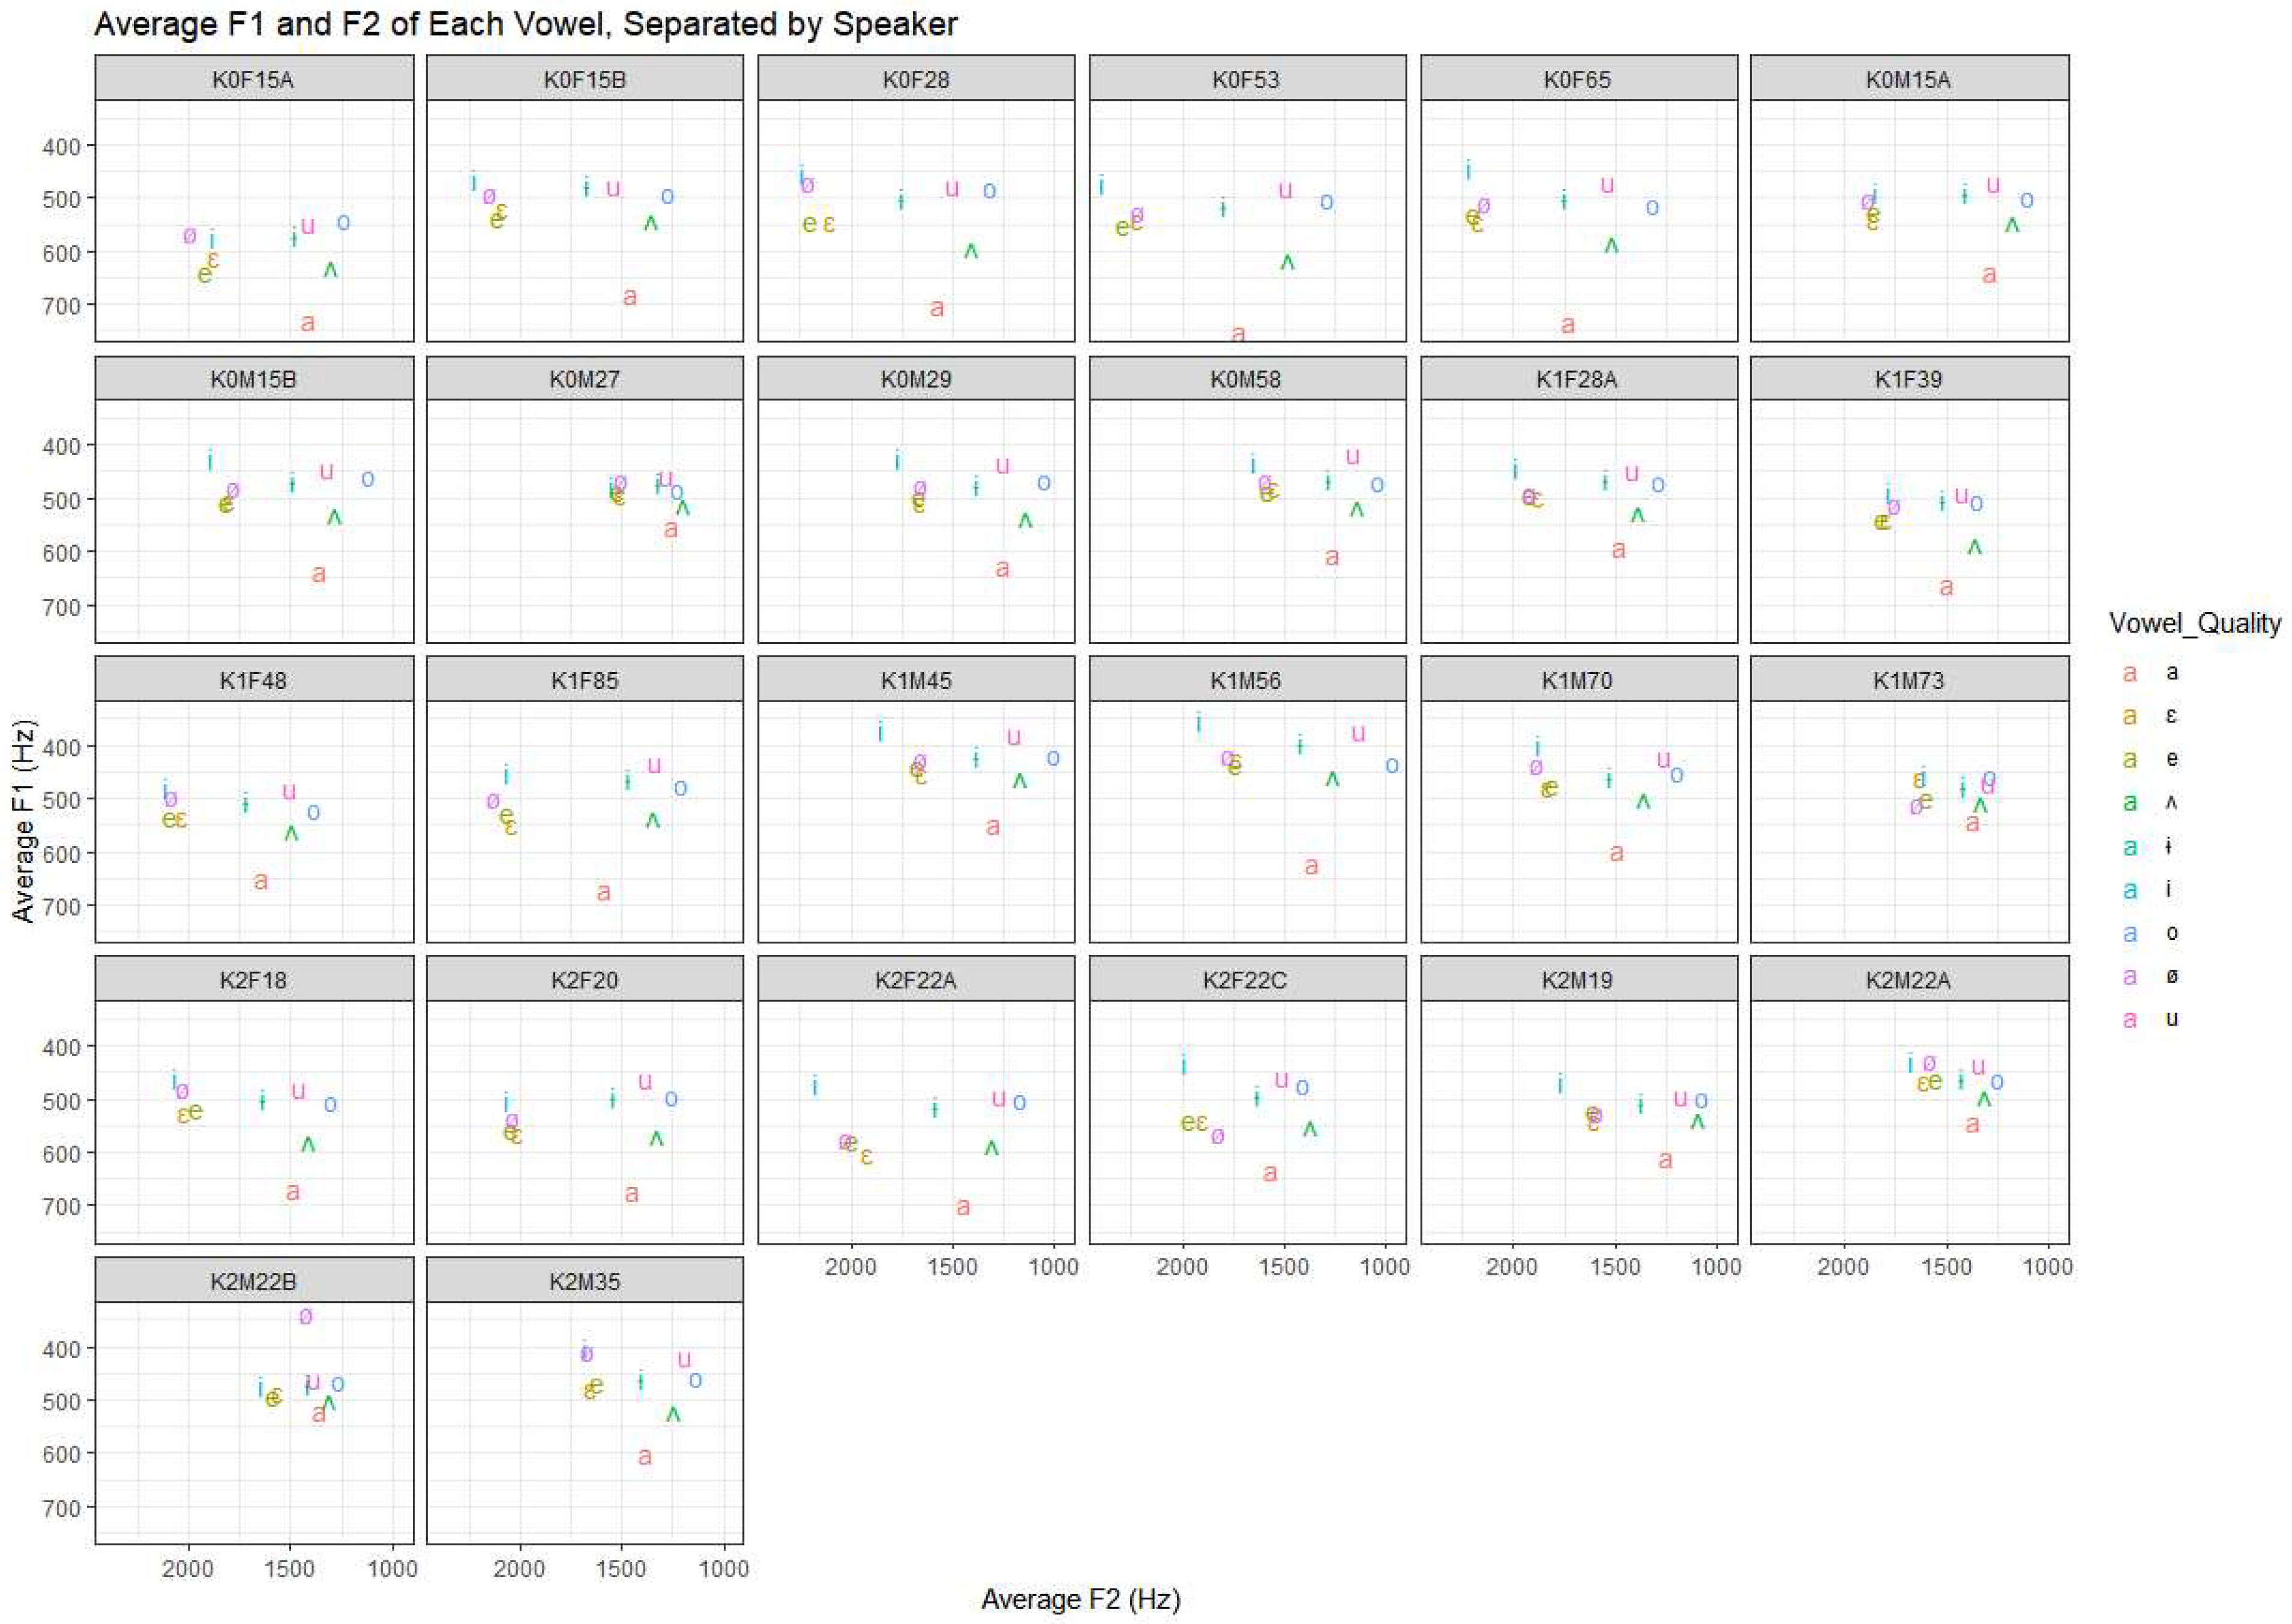
Thomas & Kendall, 2007)—a potential distinction across our speakers. The vowel /a/ was chosen as an anchor as it is not described as involved in any shifts in Korean and occurs in a consistent position across our speakers (see Speaker vowel spaces plotted in
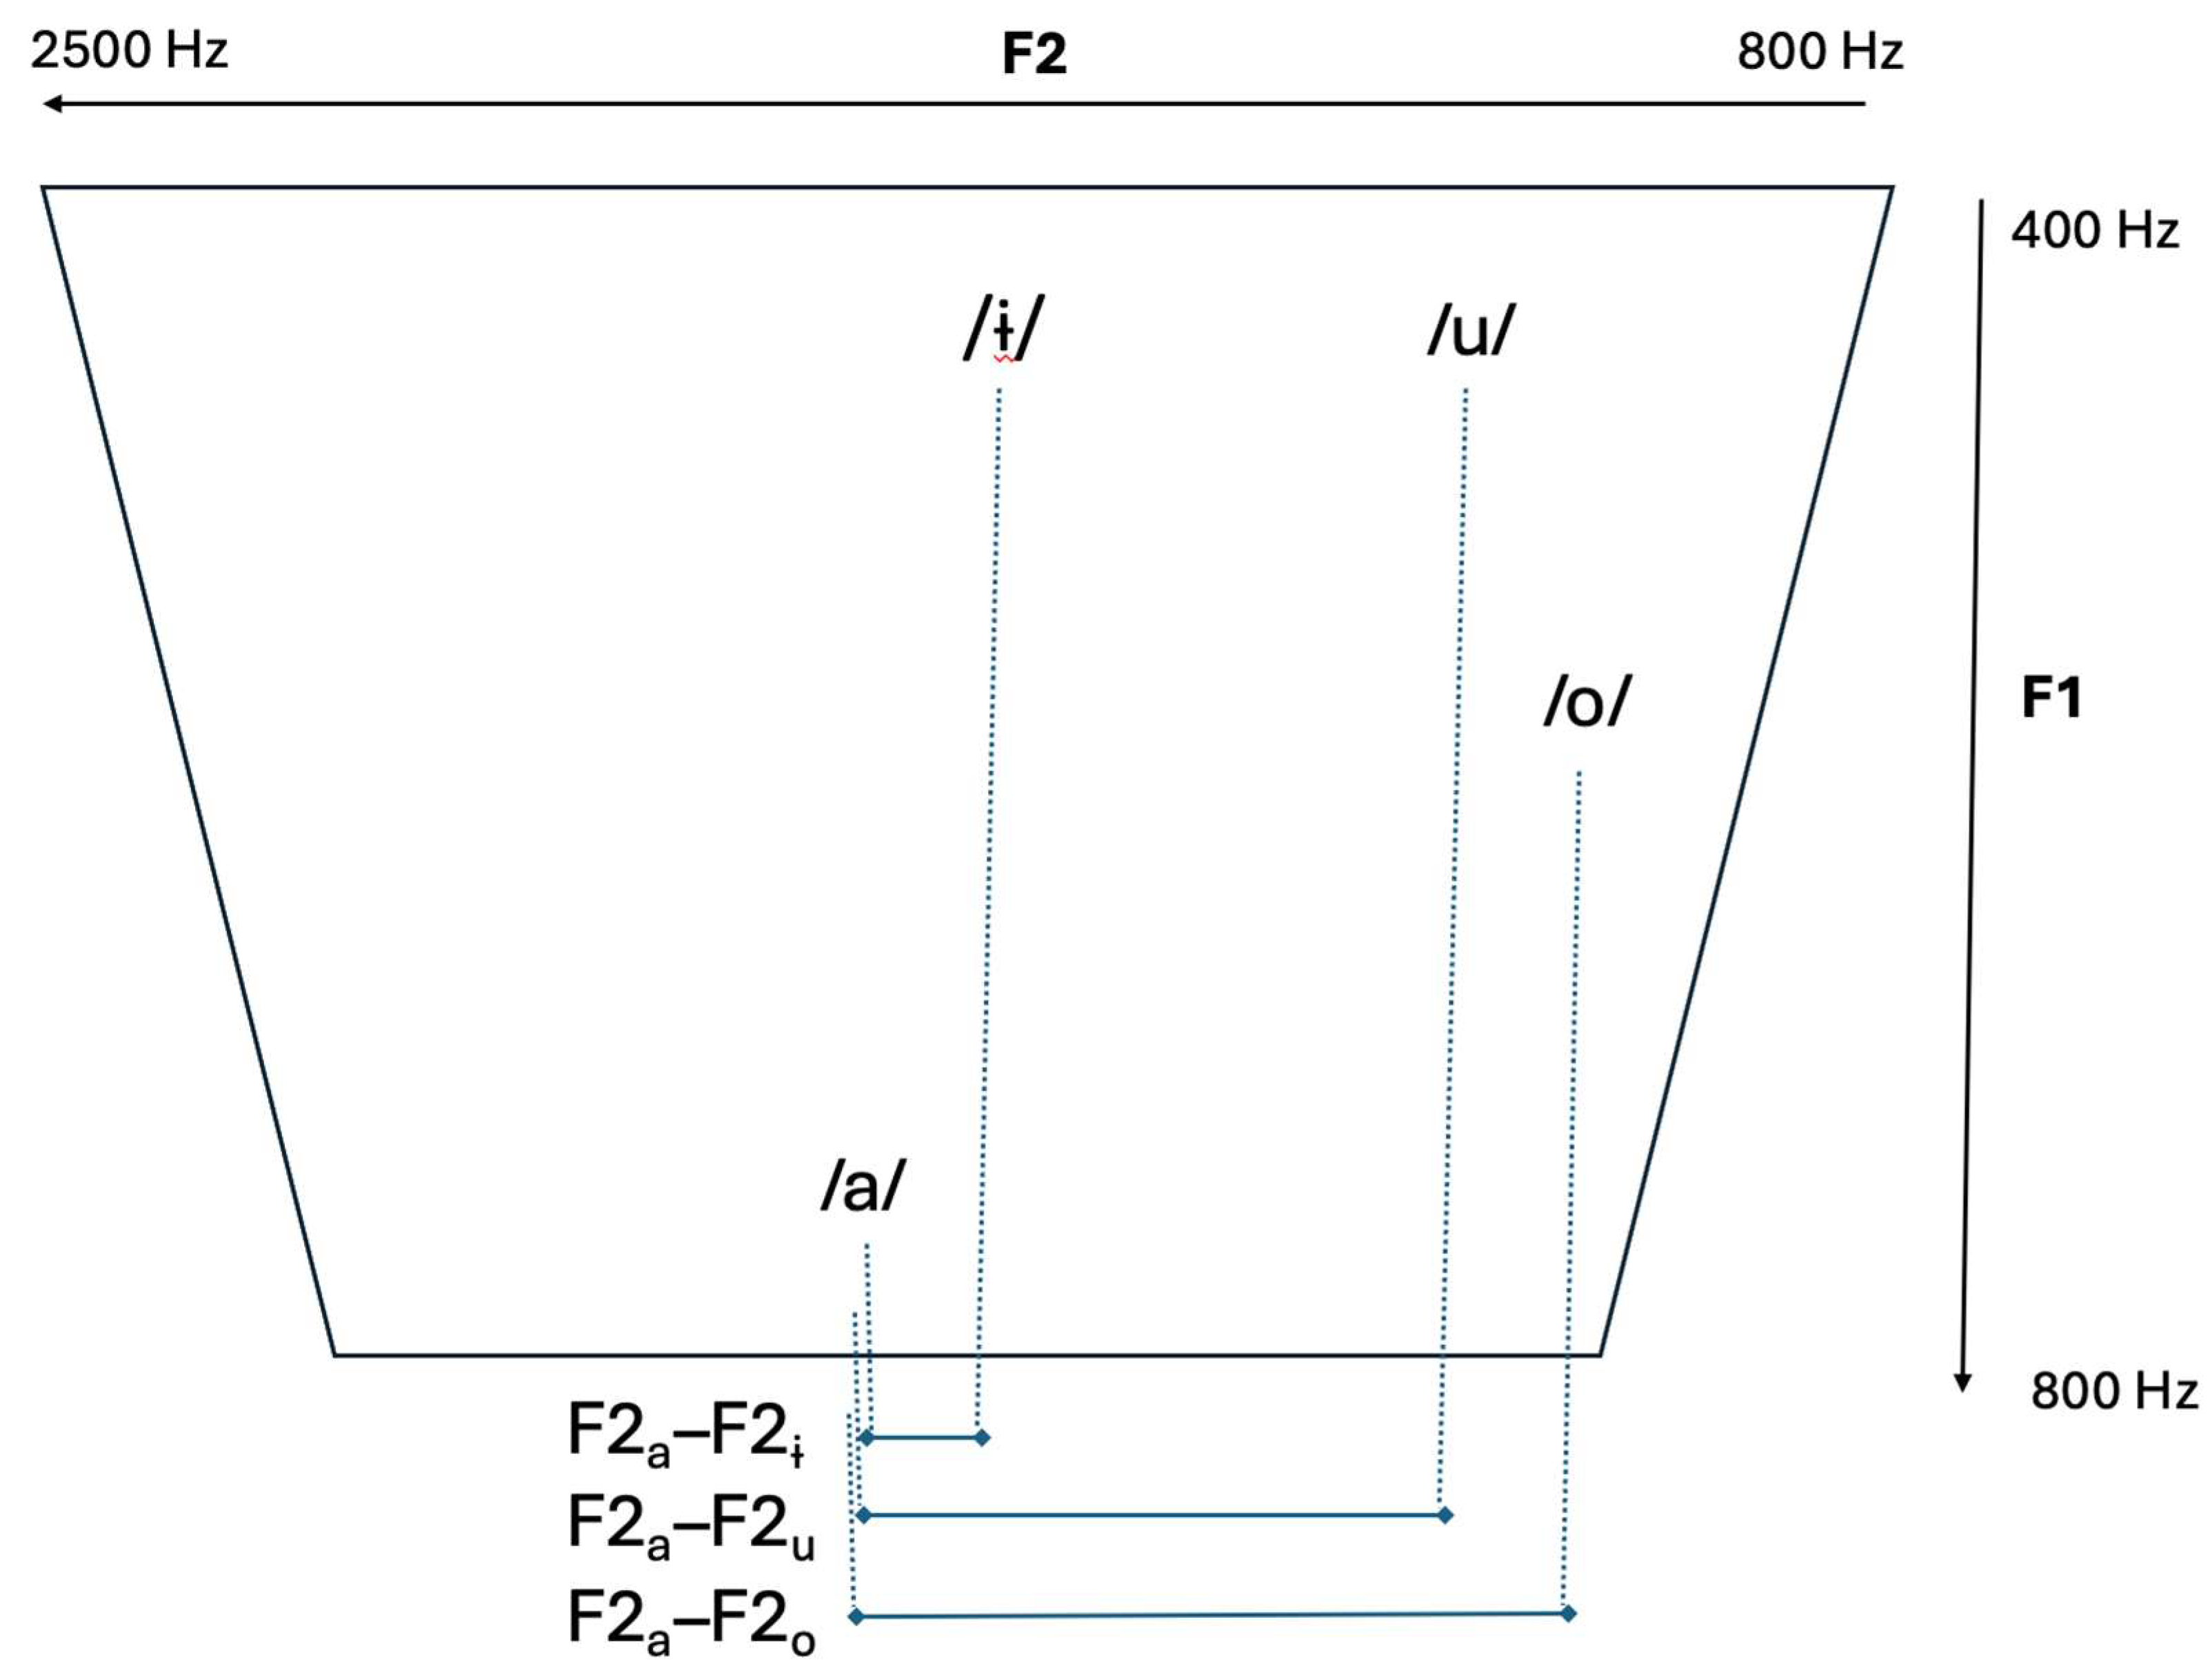
Appendix A). Each speaker’s average F2 for /a/ was subtracted from each measurement of that same speaker’s F2 for /o/, /u/, and /ɨ/, resulting in three dependent variables, illustrated in
Figure 3.
Frontness of /o/ F2a–F2o
Frontness of /u/ F2a–F2u
Frontness of /ɨ/ F2a–F2ɨ
These values represent the degree of fronting for each vowel token relative to the low central vowel /a/. For example, if a speaker’s average F2 of /a/ is 1500 Hz and a particular token of /o/ was measured at 1000 Hz, then the dependent variable value for that token would be 500 Hz, represented by the duration of the horizontal line next to “F2
a–F2
o” in
Figure 2. The smaller the value, the closer /o/ is in the F2 dimension to the center of the vowel space, which represents the degree of /o/-fronting for that speaker. The larger the value, the farther back that token of /o/ is.
2.4. Independent Variables
As illustrated in
Table 3, WordPosition was coded as a binary variable: The relevant vowel either appears in a syllable that is word-initial or not-word-initial. This binary coding does not consider the number of syllables in a word or the presence of an onset in a CV sequence. For example, both of the /u/ tokens in [pu.tɨ.ɾʌp.kɛ] “
smoothly” and [u.san] “
umbrella” were coded as word-initial, even though one token is a CV syllable and the second token is a V syllable. Similarly, both of the /o/ tokens in [t*a.ro] “
separately” and [nɛŋ.tɕaŋ.ko] “
refrigerator” were coded as non-initial, even though one word has two syllables and the other word has three. Vowels in single-syllable words were coded as occurring in word-initial position, such as the /o/ token in [tɕom] “
a little”, as monosyllables are likely to be subsumed into the initial position of a neighboring accentual phrase (
O. Kang, 1992).
Duration of the vowel token was the second linguistic factor, coded as a continuous variable. It is well-attested that longer vowels are likely to be more peripheral, so this is important to include as a control variable when considering spontaneous speech.
The place of articulation of the preceding consonant was coded to investigate positional effects that affect fronting. Preceding Place of Articulation of the preceding segment (PoA) was collapsed into three groups: Coronal, Dorsal, and Other (including all vowels, bilabials, and word-initial contexts). The member phonemes of each are provided in
Table 3. Due to low token counts (and because we do not have hypotheses that require separating them), bilabial phonemes were collapsed into one group with vowel and word-initial tokens, which showed similar patterns.
Age was included as a factor. Speakers were grouped into two levels, Younger (15–39) and Older (45–85). Generation was coded as one of three levels (HOM, Gen1, and Gen2). Gender was defined as a binary variable based on participants’ self-reported gender identity. Two ethnic orientation scores, one for language and one for family, were also included for models with only heritage speakers.
Lastly, Speaker was included as a random effect in mixed effects models (MEMs) to account for individual variation that may otherwise be masked. Word was not run as a random intercept due to the wide variety of words attested in the data and the low rate of repetition of many of them, patterns which preclude convergence in models.
With these factors, we develop three sets of statistical models in R 4.4.0 (
R Core Team, 2024). The first set determines whether there are intergenerational rate differences. The second set compares the conditioning effects for each generation, and for each vowel, allowing us to classify each pattern within Meyerhoff’s language transfer framework. The third set tests for evidence of participation in chain shifts, that is, the relationship of one vowel’s movement to another.
2.5. Models to Compare Rate or Degrees of Fronting Across Groups
Our first set of models shows, for each of the vowels separately, but with all speakers combined, which groups of speakers have significantly different
rates or degrees of fronting, when (linguistic and social) contextual effects are controlled. Models were constructed using the Rbrul package (
Johnson, 2009) in R (
R Core Team, 2024). In the first set, consecutively considering the F2 of each vowel as the dependent variable, step-up/step-down mixed effects linear regression models were compared to identify the best-fitting model that contained the fewest factors and accounted for the most variation in the data. These models first identify the factor that has the greatest effect on the variable being tested (accounts for the most variation), and then adds (in the case of step-up) factors one at a time until all but only significant factors are included in the model, and then reverses the set of comparisons (for the step-down) to start with all the variables and remove them one at a time (
Johnson, 2009). For each vowel, two versions of modeling that differed only in including either Age (coded as a binary factor) or Generation (coded as a ternary factor) were then run, as these collinear factors must not be included in the same model. Akaike Information Criterion (AIC), which measures the fit of a model to the data, was used to compare these two models (
Symonds & Moussalli, 2011). Models were selected as optimal if they scored the lowest AIC without any mismatch in ranking of levels between ranking of estimates and observed values. Finally, a one-level model with only those selected factors was constructed using the lme4 package (
Bates et al., 2015), which provides more statistics regarding the model’s fit (e.g., Std. error, t-value) than Rbrul’s step-up, step-down procedure. This best-fitting model is reported and discussed for each of the three vowels. We discuss the
effects of the other predictors, within each generation, in the second set of models. Models included the linguistic and social factors summarized in
Table 4 (except the average distances between vowels, reserved for the third set of models). The threshold for significance used in all models is
p < 0.05.
2.6. Models to Compare Conditioning Effects Across Generations
The second set of one-level models (again using the lme4 package), with the same predictors except Generation, was then constructed for each Generation so that their variables grammars could be compared. These models compare the grammars of heritage and homeland speakers to determine whether the same factors are significant across speaker groups and whether the direction of the effects are the same for each population. That is, they allow us to implement the comparisons described in (i)–(iii).
2.7. Models Seeking Evidence of a Chain Shift
The third set of models investigates the relationship between two parts of the vowel shift, /u/-fronting and /ɨ/-fronting, in more depth, again using the lme4 package. Here we determine whether the two high vowels are moving in coordinated fashion, as might be expected for a chain shift, and as reported for Seoul Korean. If, instead, we see that only /u/ is shifting, we might interpret it as evidence that the shift is replicating the English pattern (which does not, and cannot, implicate the high central vowel).
For this third set of models, to mitigate the influence of coarticulation, only vowels in tokens preceded by bilabial consonants or monophthongal vowels were included. The distribution of tokens for these models is presented in
Table 4 (n = 7948 tokens of /o/, /u/, /ɨ/, and /a/).
For these models, the dependent variable was a centered version of Average F2
a–F2
u and Average F2
a–F2
ɨ: That is, values were centered around the mean distance (for each speaker) between the anchor vowel /a/ and either /u/ or /ɨ/. Factors tested in these models are Age or Generation, Duration, Gender, WordPosition, EO-Language, EO-Family (with levels shown in
Table 3), plus whichever inter-vowel distance is not the dependent variable, to test whether a speaker’s inter-vowel distance was a predictor of other vowels’ locations in their vowel space. Since these models include an average value by speaker, no random effect of speaker was included.
3. Results
The first set of mixed effects models investigates fronting of /o/ in
Section 3.1, of /u/ in
Section 3.2, and of /ɨ/ in
Section 3.3. For each vowel, we first report a model of the data for all speakers combined and compare the rates of vowel shift for each generation. Then, we discuss models for each generational group and compare conditioning effects by generation. A summary of the models is provided for each vowel. The models may be reviewed in
Appendix B,
Appendix C and
Appendix D. As a follow-up analysis, models examining the relationship between fronting of /u/ and /ɨ/ are presented in
Section 3.4.
For each model, we report the estimate, or predicted difference in value from the reference level for each level; standard error; number of degrees of freedom; t-value; and
p-value. Estimates for categorical factors are differences from these reference levels: “Initial” for WordPosition, “Coronal” for PoA, “Older” for Age, and “Female” for Gender. For continuous factors, estimates show the predicted change in value of the dependent variable for one unit of the factor (e.g., in
Table 5, for each second of increasing duration, the estimate increases by 1348 Hz).
In each model, fixed factors are listed by decreasing estimate size. This allows us to see that, across vowels, Duration and PoA usually have the largest effect, while WordPosition has a small effect, with Age and EO-Language usually in between and EO-Family rarely reaching significance. Statistics for random effects are in a footnote for each cross-generational model.
3.1. /o/-Fronting
We first present one cross-generational model for /o/ in detail to illustrate our approach (
Table 5). Models for each generation for this vowel are in
Appendix B, and these models are summarized in
Table 6. The same approach is followed for each of the three vowels we investigate.
In
Table 5, a model with all speakers investigates whether each generation of heritage speakers participates in /o/-fronting to the same degree as HOM speakers. Here the dependent variable under investigation is F2
a–F2
o, the F2 distance between a token of /o/ and that speaker’s average value for /a/ (see
Figure 2). If /o/ is fronting, then there will be a shorter distance between /o/ and /a/, given the position of /a/ as a central and /o/ as a back vowel. However, if /o/ is not fronting, then there will be a greater distance between /o/ and /a/. Thus, larger positive Hz values in the Estimate column of
Table 5 indicate a more peripheral (less-fronted) vowel than smaller positive values. Negative values indicate a value for /o/ that is more fronted than the /a/ average.
Significant factors in this cross-generational model are Duration, Place of Articulation, Age, and WordPosition. Including Generation worsened the fit of the model to the data, so it is excluded. This indicates that generational differences are not the best way to characterize patterns of /o/-fronting. Rather, the Age effect indicates a change in progress, as has been reported for Seoul Korean.
From that model, however, it is unclear whether speaker groups have similar conditioning patterns. Individual models for each generation were constructed to answer this question. These models are compared and summarized in
Table 6, and, although not shown here, they are reported in
Table A1,
Table A2 and
Table A3 in
Appendix B. In
Table 6, the predominant direction of effect for each variable is listed in the first column. For example, we see that Younger speakers front more than Older speakers. The predictors are ordered from the biggest to smallest effect size. A checkmark indicates a group exhibiting a significant effect of that predictor, in the predominant direction indicated in the first column. Significance is indicated by asterisks.
2 Factors that are not significant for any groups are greyed out. A direction of effect is mentioned in greyed-out rows only for non-significant factors showing a trend that we will discuss later.
Table 6.
Significant predictors for /o/-fronting (F2a–F2o), 26 speakers, 5941 observations 1 .
Table 6.
Significant predictors for /o/-fronting (F2a–F2o), 26 speakers, 5941 observations 1 .
| Direction of Effect | HOM | Gen1 | Gen2 |
|---|
| n | 3232 | 1288 | 826 |
| PoA (Other > DOR > COR) | ✓ *** | ✓ *** | ✓ *** |
| Age (Younger > Older) | ✓ **** | | |
| WordPosition (Non-initial > Initial) | ✓ ** | ✓ ** | |
| Duration (Shorter > Longer) | ✓ * | ✓ * | ✓ ** |
| EO-Family (Less > More Korean oriented) | n/a | | ✓ * |
| Gender | | | |
| EO-Language (English > Korean) | n/a | | |
| Generation | n/a | n/a | n/a |
In the summary of models for /o/ in
Table 6, we see that two linguistic factors, PoA and Duration, are consistently significant across all three groups. These factors also show similar rankings of factor levels and directions of effect (one exception is the ordering of Dorsal vs. Other groups in the Gen1 model, see
Table A2 in
Appendix B). This consistency across models suggests that heritage and homeland speakers pattern similarly in these regards. HOM speakers have a bigger effect size for Age than for PoA. However, due to collinearity, Age effects cannot be tested among heritage speakers. Similarly, ethnic orientation effects cannot be tested in HOM speakers. Overall, where comparisons are possible, the three groups behave similarly in terms of the conditioning of /o/-fronting.
Additionally, HOM and Gen1 speakers show similar effects of WordPosition, where non-initial tokens favor /o/-fronting. The effect of WordPosition is best attributed to Korean input, as Korean has a syllable-initial prominence effect on vowel realization (
Y. Kang, 2016), but English does not. See, for example,
T. Cho (
2005), a study on /i/-fronting which shows accentual but not prosodic-boundary effects. Thus, this factor’s effect cannot be accounted for by reported patterns within English and, thus, is not attributed to English influence.
Lastly, EO-Family is significant in the Gen2 model, where an increase in the ethnic orientation score (higher engagement with Korean culture by people around the speaker) is associated with less /o/-fronting. This provides evidence that Gen2 speakers may not associate /o/-fronting with Korean language, and that heritage speakers may, in fact, resist fronting due to its overlap with English /o/-fronting.
3.2. /u/-Fronting
The second dependent variable we consider is the F2 of /u/ relative to /a/ (F2
a–F2
u), which measures the degree of /u/-fronting. The same interpretation of the estimates and Hz values from
Section 3.1 is used: If /u/ is fronting, then the distance between /u/ and /a/ will decrease (smaller positive number); if /u/ is not fronting, the distance between /u/ and /a/ will increase (larger positive number). Models are organized as for /o/-fronting in
Section 3.1.
Table 7 provides a model with all speakers to investigate generational effects on degree of /u/-fronting. The model with the best fit included significant effects of Preceding PoA, Age, and Duration. Including Generation worsened the fit of the model (in the step-up procedure), which indicates that, again, generational differences are not the best way to characterize variation in /u/-fronting. As with /o/-fronting, the relevant social factor is Age: Younger speakers front /u/ more than older speakers.
As seen in
Table 8, all three groups show identical PoA effects: /u/-fronting is favored in post-coronal contexts and disfavored in word-initial position or when /u/ follows a vowel or bilabial. Gen2 models include no other significant effects. The lack of Duration as a significant effect here is surprising. In contrast, HOM and Gen1 models share Age and Duration patterns, where /u/-fronting is favored in post-coronal contexts and in shorter vowels (Age cannot be tested in Gen2 due to the lack of a range of ages, see
Table 2). The shared social and linguistic effects between Homeland and Gen1 speakers again indicate similarities between their phonological grammars. The consistency of linguistic effects in these analyses suggests that /u/-fronting is associated with Korean rather than English language influence.
3.3. /ɨ/-Fronting
Next, we present models for /ɨ/-fronting. In the all-speaker model, shown in
Table 9, the same factors are significant as for the other vowels, and with the exception of WordPosition, the levels also rank in the same order as for /o/-fronting.
We provide a summary of conditioning effects on /ɨ/-fronting in
Table 10, with
Table A7,
Table A8 and
Table A9 showing models of each speaker group in
Appendix D. This summary again shows strong continuity between the HOM and Gen1 speakers. The same conventions are used in
Table 10 as for
Table 6.
As presented in
Table 10, Gender and PoA are significant across all three speaker groups. Overall, the factor ranking (by effect size) and direction of effects are also shared across three groups, with the exception of Gender, whose effect is reversed in Gen1 speakers (see
Table A8 in
Appendix D). The direction of Gender and Age effects in HOM speakers suggests a change in progress in Homeland Korean: Younger speakers and females have more fronted /ɨ/ than older and male speakers. This trend is fully replicated in Gen1 speakers and is partially replicated in Gen2 speakers (see
Table 2). Again, Age cannot be tested in Gen2 models due to collinearity with Generation.
Gen2 shows fewer significant factors than the other groups (see
Table 10). This suggests, perhaps, that the pattern for /ɨ/ has diffused, rather than being faithfully transmitted, from Gen1 (cf.
Labov, 2007). It may also be the result of a smaller sample. For the significant factors, the direction of effect is the same as for the HOM speakers, and the factors are ranked the same way by effect size (see
Table A9 in
Appendix D). This shows replication of some aspects of the HOM pattern in Gen2 speech. Moreover, the lack of significant ethnic orientation effects in Gen2 precludes attributing the difference to increasing contact with, or influence of, English.
3.4. Seeking Evidence of Chain Shifts
The models presented in
Section 3.1,
Section 3.2 and
Section 3.3 offer insights to movement of the three vowels independently, relative to a stable anchor vowel, but they do not shed light on whether speakers are participating equally across all three shifts (/o/-fronting, /u/-fronting, and /ɨ/-fronting). That is, they do not indicate whether the three vowels that have been posited to be part of a chain shift in Seoul Korean are behaving as a cohesive system in these speaker groups. We seek evidence of chain shift patterns in two ways. First, we look at plots of raw formant frequencies pairwise across pairs of vowels. These ignore any contextual conditioning effects. Those will be added in subsequently by modeling the relationship between the position of the pairs of vowels.
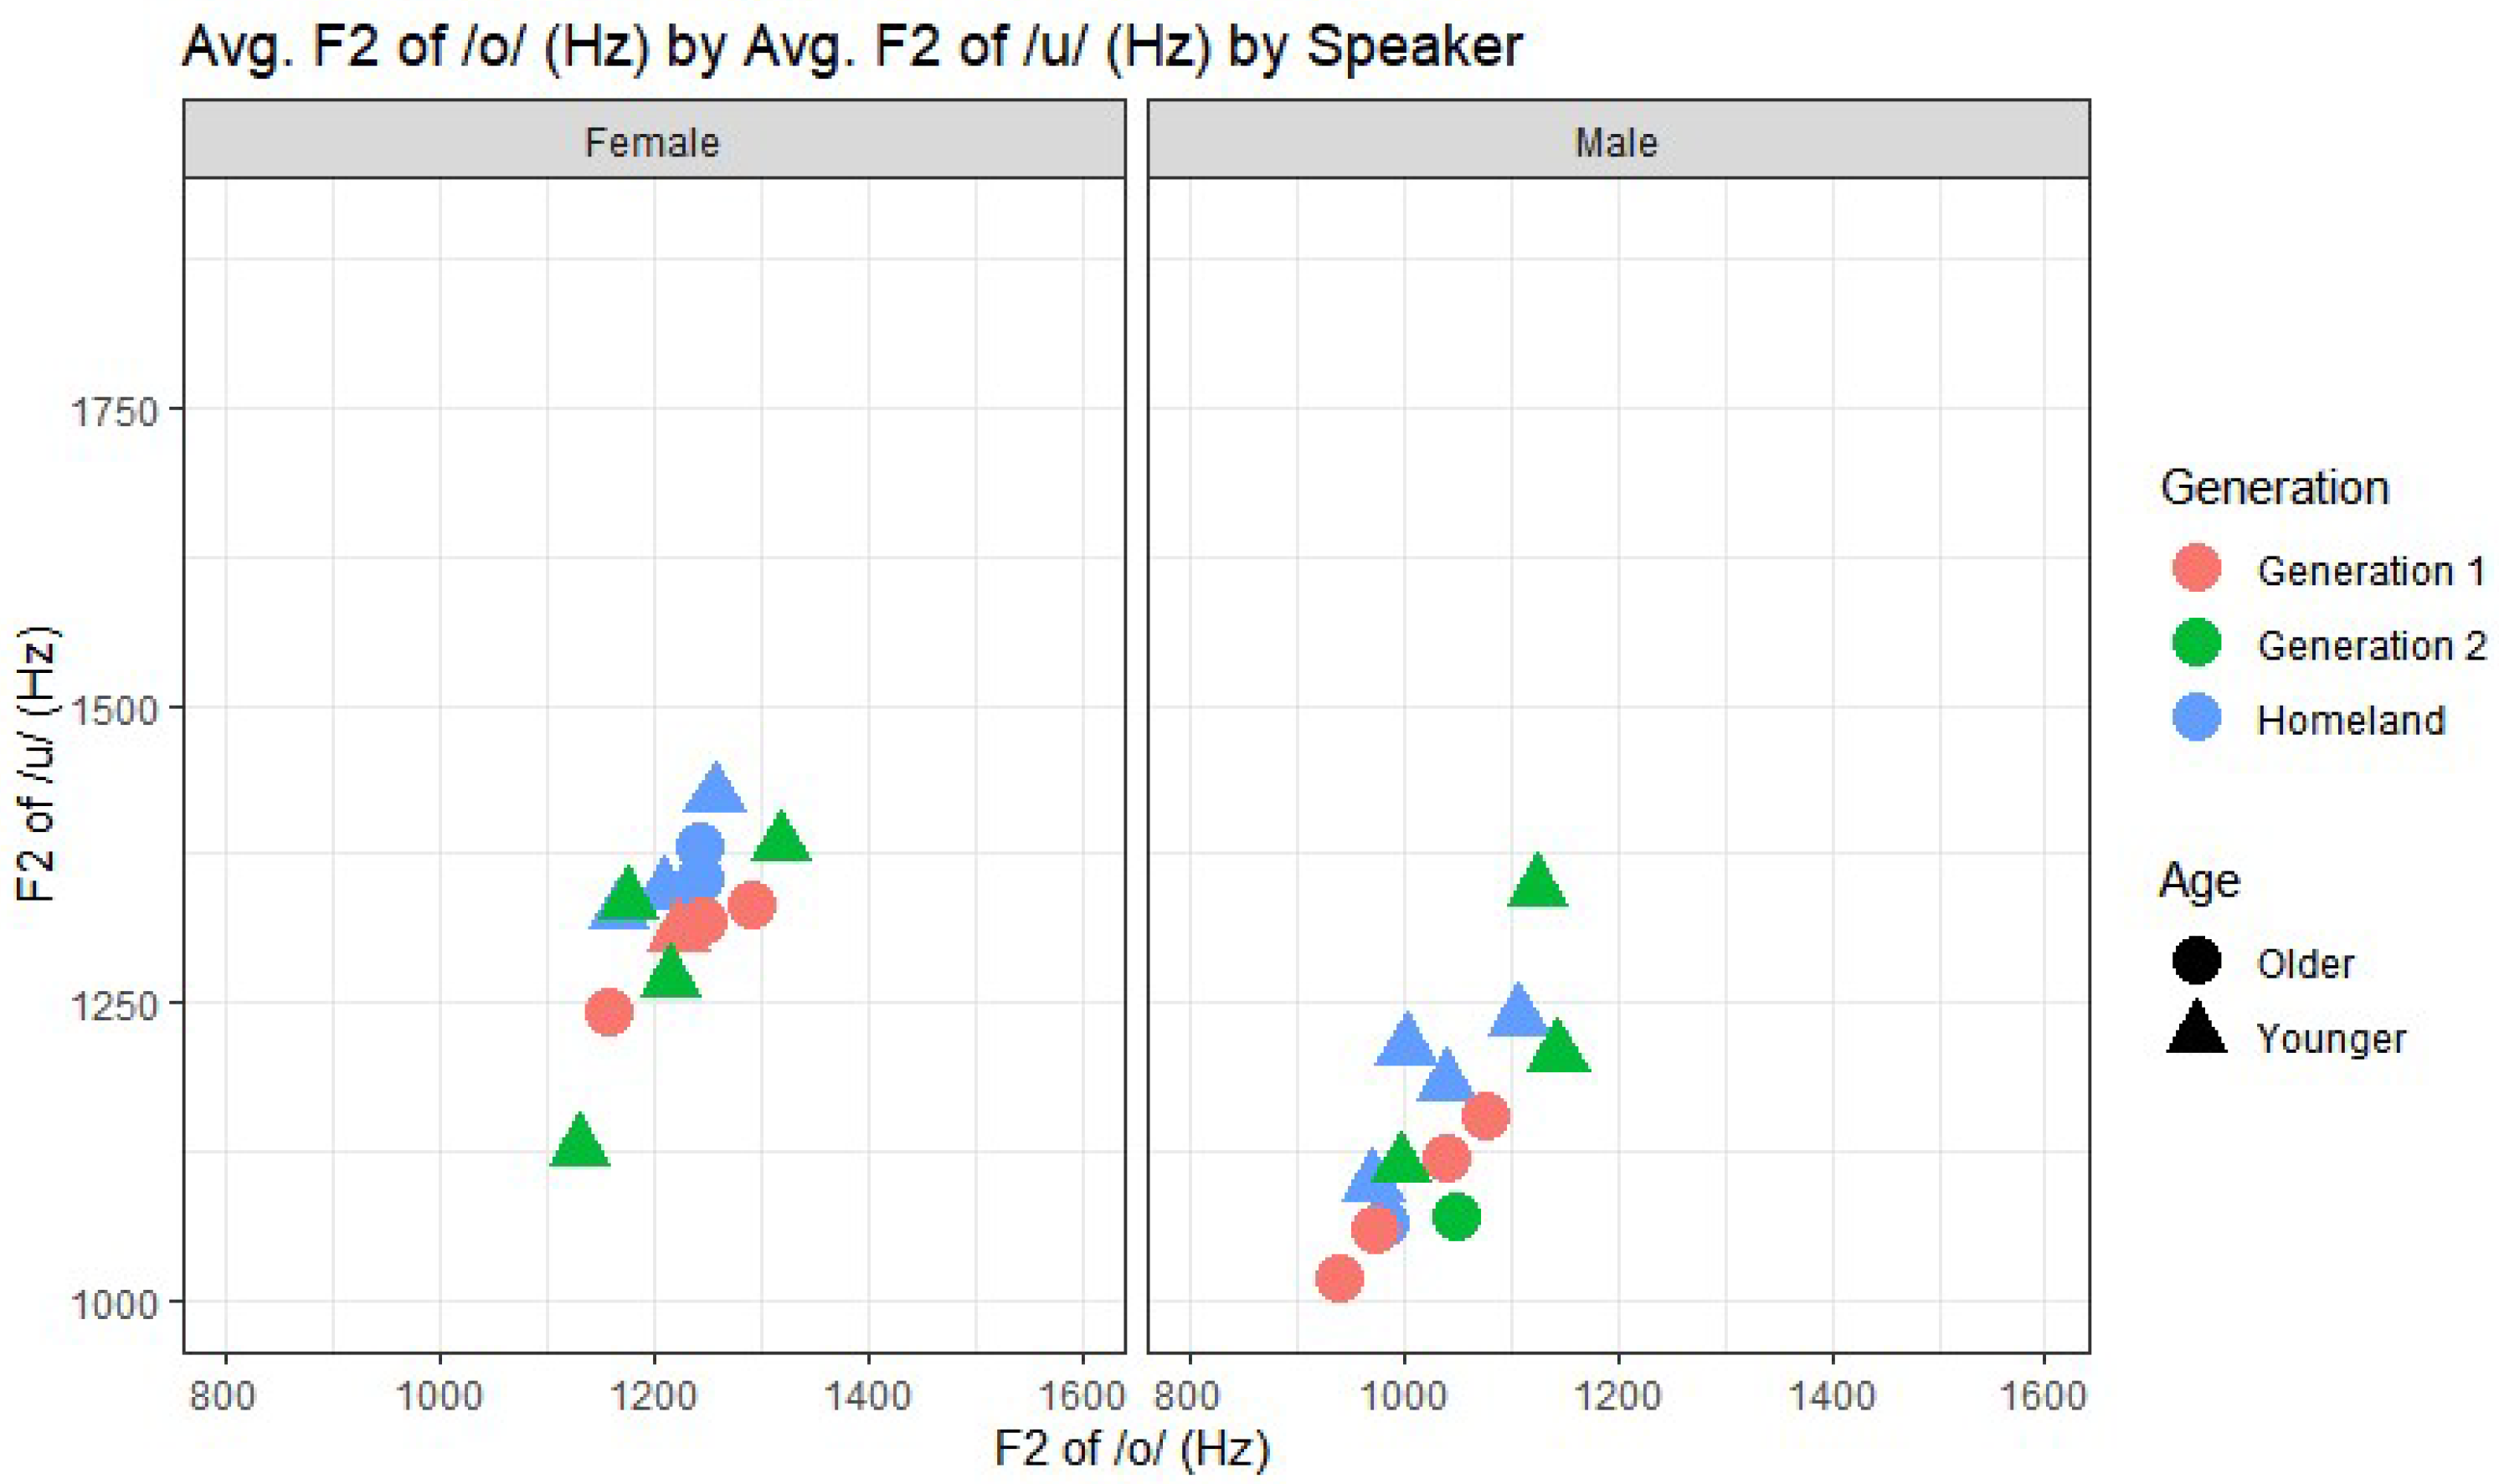
To see whether fronting of one vowel can predict fronting in another vowel, each speaker’s average F2 of each of the three vowels was first plotted pairwise.
Figure 4 shows the average F2 of /o/ by the average F2 of /u/ for each speaker, with female speakers on the left facet and male speakers on the right. The ranges of the axes are held constant across
Figure 4,
Figure 5 and
Figure 6 to facilitate comparison. There appears to be a relatively consistent pattern, where speakers with a higher F2 of /o/ (
x-axis) tend to have a higher F2 of /u/ (
y-axis). There are no visible Age-related patterns for female speakers. For male speakers, older speakers (in red) have lower F2 of both /o/ and /u/ than younger speakers (in blue). The younger males occupy a similar vowel space as the females, suggesting a change in progress where males are moving toward the female target, while females may be stable.
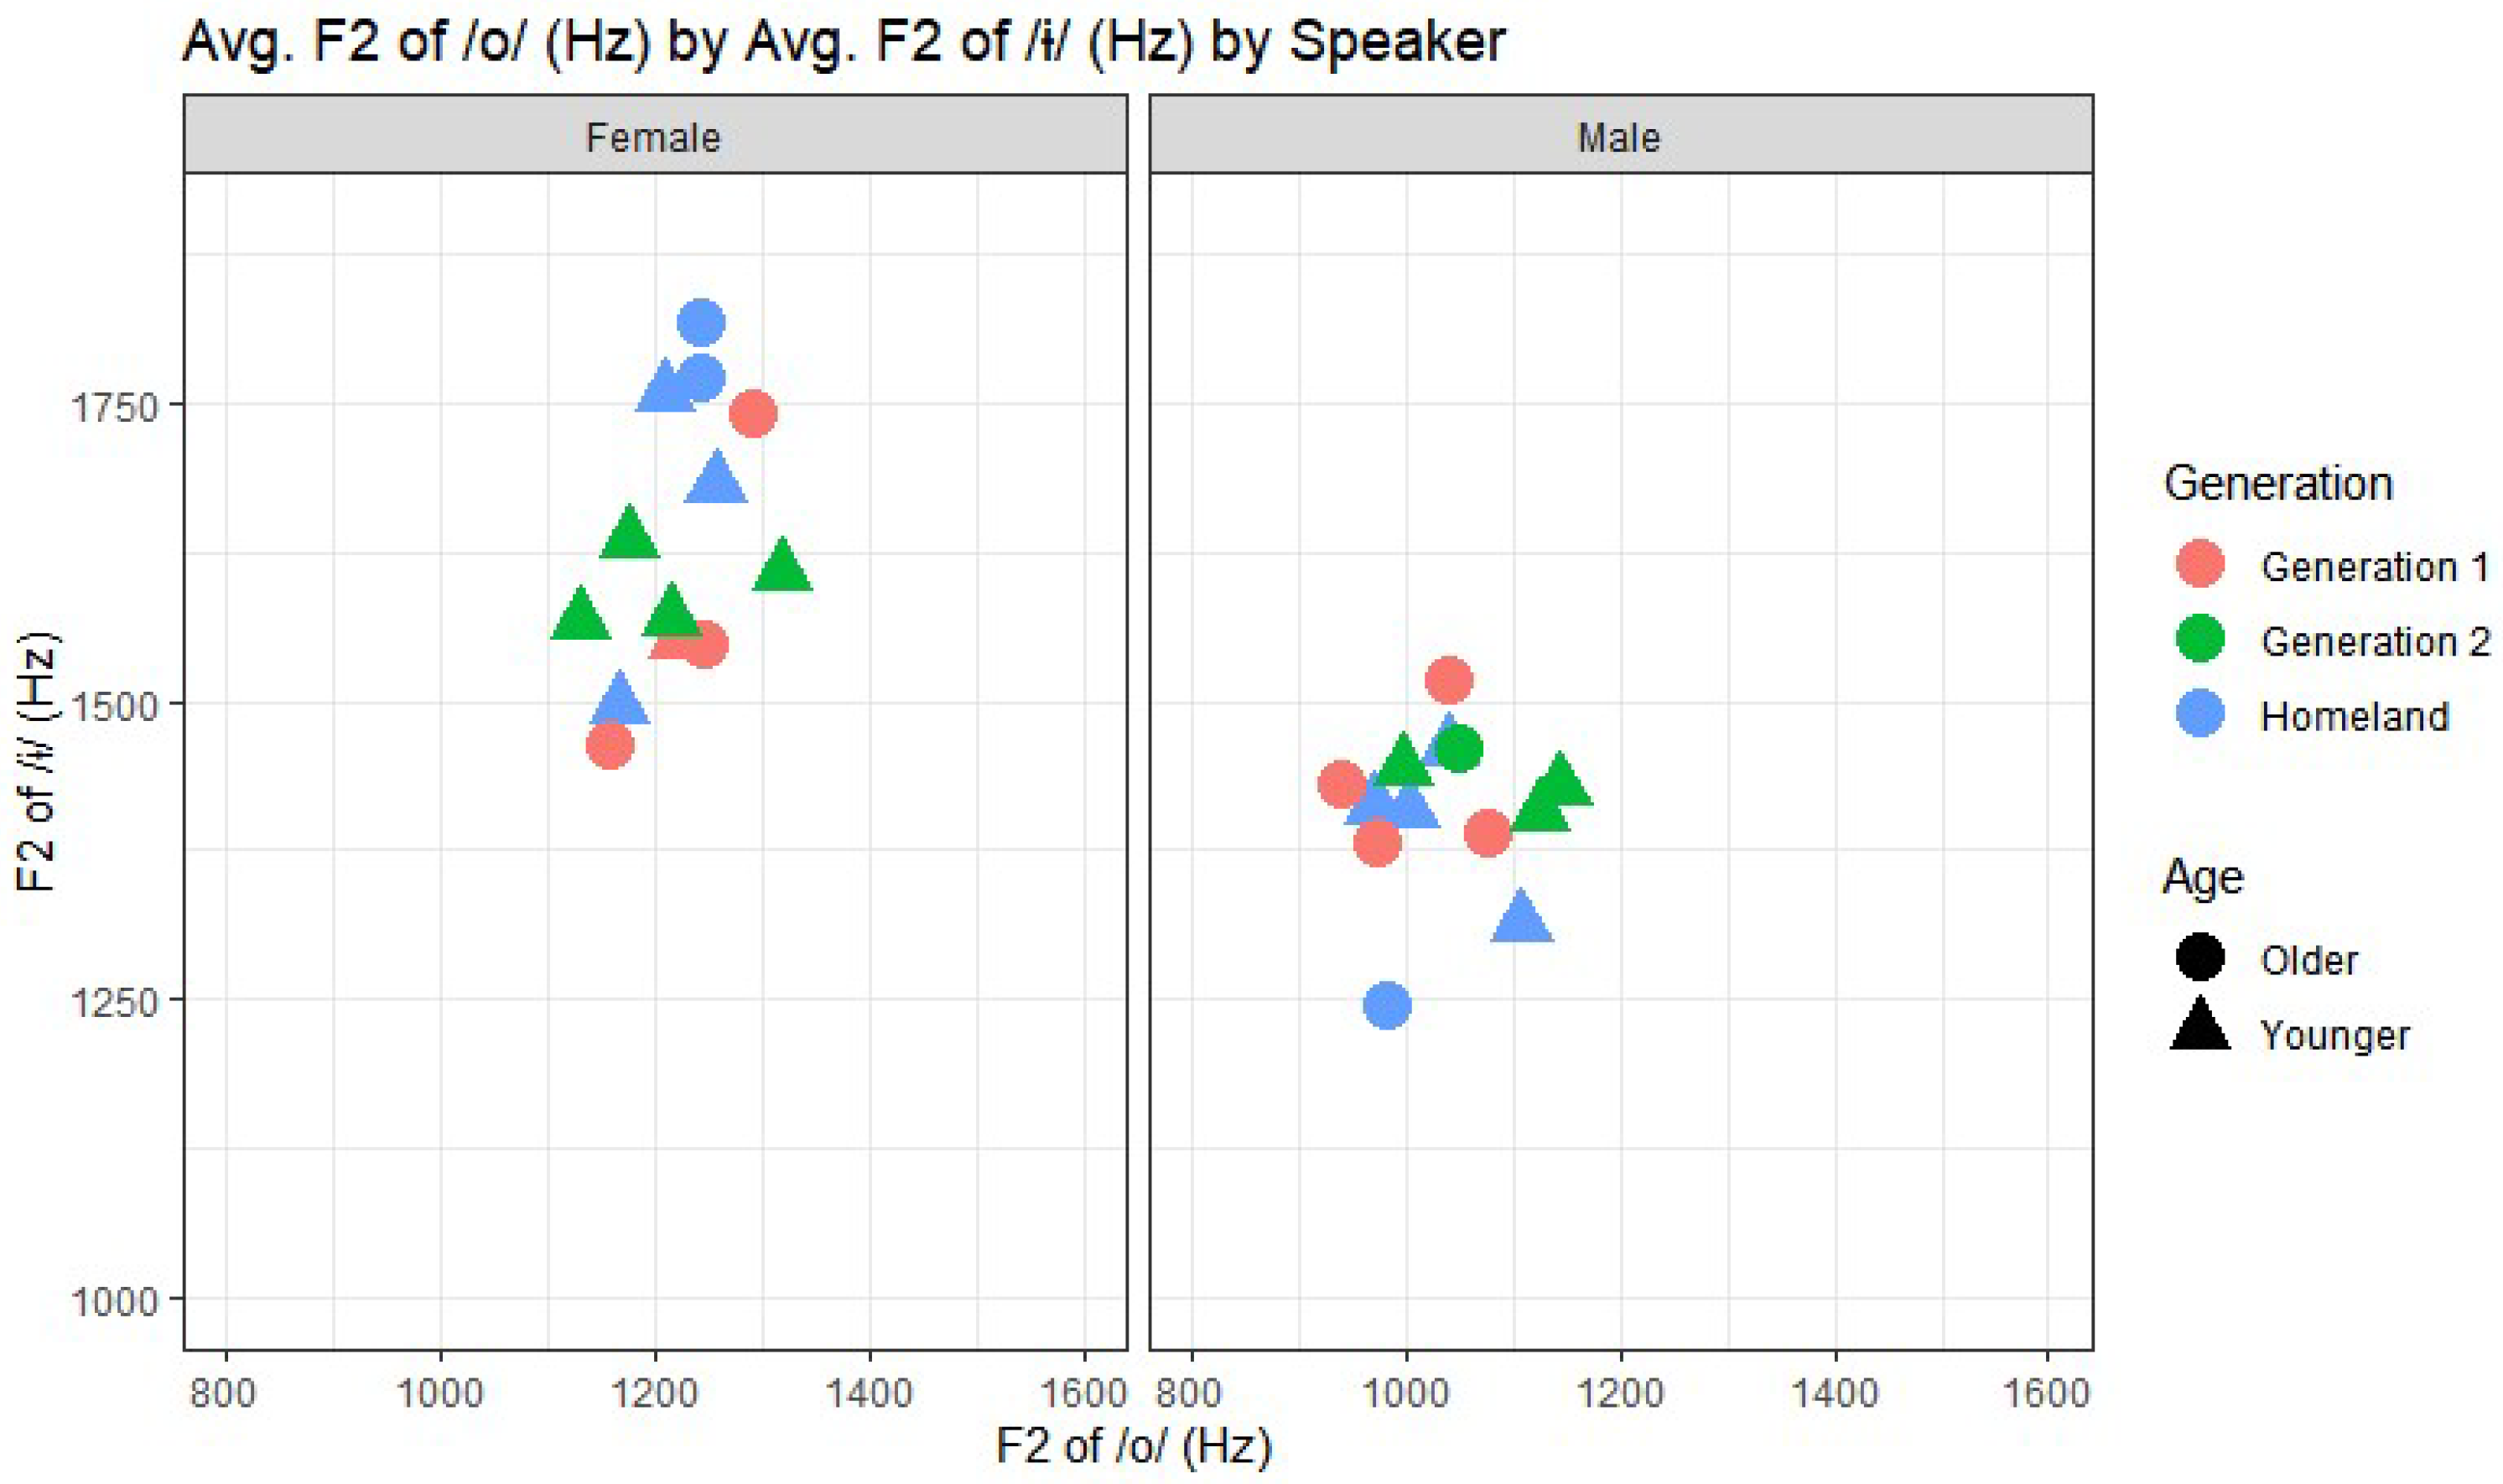
Plots of the average F2 of /o/ by the average F2 of /ɨ/ are presented in
Figure 5. No relationship between these two vowels appears. The age groups are not distinguished for either gender. Thus, we do not see clear evidence of a change in progress (age and gender effects) nor a relationship between the behavior of these two vowels. However, they have been posited to be part of a chain shift in Seoul Korean where /o/ raises as /u/ fronts. As stated earlier,
Griffin (
2023) found no evidence of /o/-raising in Seoul Korean. For all of these reasons, we do not further investigate /o/-fronting as a dependent variable in this examination of chain shifts.
Finally, we compare /u/- and /ɨ/-fronting in
Figure 6. Similarly to the case of /o/- and /u/-fronting, we see different patterns for female versus male speakers. For females, speakers with a higher F2 of /u/ tend to have a higher F2 of /ɨ/. No age-related pattern emerges. For male speakers, no relationship is apparent between the two vowels. Older male speakers have a lower F2 of /u/ compared to younger male speakers, suggesting a change in progress consisting of /u/-fronting among the males.
To further investigate the relationship between /u/- and /ɨ/-fronting that is illustrated in
Figure 6, linear regression models were constructed using a centered version of the dependent variables F2
a–F2
u and F2
a–F2
ɨ, respectively, and including the speakers’ average values for the other vowel as a predictor as well as the other factors, now familiar, from the earlier models. Here we simplify presentation of the models to focus on the estimates of significant predictors so that we can present Heritage (Gen1 and Gen2 combined) and HOM models side by side, for ease of comparison.
Results from models of F2
a–F2
u, with speaker’s average for /o/ and /ɨ/ as predictors, are presented in
Table 11. All estimates are in Hz. Significance levels are coded as in the summary tables above, see Note 2. Only one significant factor is shared across Heritage and HOM models, which is the speaker’s average F2 of /o/: For every increase of 1 Hz in the F2 of /u/, we see about a 0.7 Hz increase in the F2 of /o/. This suggests that a speaker’s participation in /o/-fronting correlates to fronting /u/, as suggested in
Figure 4. In contrast, the smaller effect size of speaker’s average F2 of /ɨ/ just misses the significance threshold for each speaker group. The degree of /ɨ/-fronting does not strongly predict whether a speaker will also participate in /u/-fronting. Yet, it does pattern in the same direction as /o/-fronting: A speaker’s participation in /u/-fronting is also positively associated with /ɨ/-fronting. Additionally, Duration is significant in the Heritage model. Duration patterns consistently with previous models, where longer tokens are more peripheral (further back). Lastly, for the HOM model, Age is a significant factor, where younger speakers exhibit more /u/-fronting than older speakers do, confirming the existence of an ongoing shift in Seoul Korean, but this is not replicated by heritage speakers.
The second model, presented in
Table 12, investigates the conditioning of /ɨ/-fronting. The relative fronting of /u/ does predict fronting of /ɨ/ for heritage but not homeland speakers. However, /ɨ/-fronting is not conditioned by /o/-fronting for either group. Age is significant only for homeland but not heritage speakers, where younger speakers have higher degrees of /ɨ/-fronting than older speakers do. Again, this confirms the existence of an ongoing shift in Seoul Korean that is not replicated by heritage speakers.
Two interesting patterns emerge from these last two models. One is that social factors play a much smaller role (than in the earlier models) when the position of other vowels is included as a predictor. This suggests an important phonetic cue for how effects that are normally reported as stochastic social factor effects may be perceived and transmitted. Perhaps speakers attune directly to the vowel system rather than, or, more likely, in addition to, the social characteristics of their interlocutors. The second is that Heritage and Homeland speaker models are, again, quite similar in terms of the effects of linguistic predictors—the outcome of successful transmission from one group to the other.
4. Discussion
We examine Heritage Korean speakers’ participation in three vowel shifts, /o/-, /ɨ/-, and /u/-fronting, querying whether this shift is due to English interference or, rather, reflects concurrent change in Seoul Korean (whose vowel shifts we also examine). Within
Meyerhoff’s (
2009) framework of language transfer types, we investigate the extent to which Heritage Korean speakers participate in the Homeland sound shift, seeing whether there is full participation, partial participation (cf. vowel shift in Heritage Cantonese in Toronto,
Tse, 2019), or even reversal of the shift (cf. VOT in Heritage Korean in Toronto,
Y. Kang & Nagy, 2016). This allows a deeper, more considered comparison than looking at rates alone. We begin the discussion, however, by remarking that generation did not play a significant role in distinguishing the degree of fronting for any of the three vowels (see all-speaker models in
Table 5,
Table 7 and
Table 9).
For the homeland vowel shift,
Y. Kang (
2016) described /u/- and /ɨ/-fronting in homeland speakers in Seoul based on read speech, finding that males lead /u/-fronting and younger and female speakers lead /ɨ/-fronting. We find similar patterns of these results in spontaneous speech by homeland speakers (see
Table A4 for /u/-fronting and
Table A7 for /ɨ/-fronting). While we find no gender effect for /u/-fronting for homeland speakers, we do see an age effect, where younger speakers exhibit greater /u/-fronting than older speakers do. We find stronger replication for /ɨ/-fronting, where younger and female speakers favor fronting. We next compare homeland and heritage speakers. Although we cannot test for age effects within heritage generations due to collinearity with generation, we might expect generational differences. However, the inclusion of generation as a factor in models worsened the fit to the model to the data, showing that generation is not a consistent predictor of participation in these shifts. Overall, our evidence indicates that heritage speakers are participating in all three vowels of the sound change occurring in Seoul Korean, with patterns influenced by much the same set of linguistic factors in homeland and heritage models (see
Table 6,
Table 8 and
Table 10). This is in keeping with the broader set of findings that have emerged from the HLVC project (
Nagy, 2024). Examination of ten variables across eight languages does not reveal
consistent differences between heritage and other languages.
Heritage languages may be defined by their migration history and ethnolinguistic vitality, but not by a set of features that distinguishes them from varieties spoken by monolinguals….
The studies reported in
Nagy (
2024) found that EO scores (factors relating to language use or preference, the same as used in this paper) had less effect than other factors. It also showed only a few cases of generational differences. Rather,
as in majority languages, many variable patterns are transmitted faithfully from one generation to another.
Although Gen2 speakers receive some input in the community’s majority language (English, in the case of Toronto), and concomitantly less input in their heritage language, this often shows no effect in their language production. Rather, as expected in a world where the majority of people develop bi- or multilingually, speakers of heritage languages also may fully develop multiple languages simultaneously (
Nagy, 2024, pp. 247–248).
This emerges from sampling ecologically valid (i.e., communication-oriented) speech rather than data from experimental tasks, which target differences between heritage and homeland speakers. Experimental approaches often discount the linguistic capabilities of heritage speakers, framing their skills as “deviant” from those of their homeland counterparts (
Nagy, 2024, p. 248).
Here, instead, we are able to illustrate strong similarities between the groups. To further interpret these similarities and differences between homeland and heritage speakers, we turn to
Meyerhoff’s (
2009) model (i–iii in
Section 1). Meyerhoff posited three types of contact effects, differing in the degree and extent of transfer through contact, and described how these are evidenced by particular patterns of significant factors and their respective rankings across languages. We propose that, for this classification task, social and linguistic factors be considered as two separate classes when comparing heritage and homeland speakers due to their different behaviors.
We first discuss the linguistic factors. Shared linguistic factors between homeland and heritage models show the similarities between these groups’ vowel patterns and the linguistic contexts where back-vowel fronting is observed. Shared factors between groups that are not also described as relevant to English back vowel fronting (see the literature reviewed in
Section 1) strongly suggest that heritage groups’ participation in the shift is not based on English input. However, linguistic factors that are significant in heritage models that are described as relevant to English back vowel fronting, and that are not significant in the Homeland Korean models, would be evidence that heritage speakers’ back vowel fronting is due to English influence. This would be further bolstered by ethnic orientation scores that show the more English input speakers have, the more strongly they exhibit these patterns.
The Gen1 grammar reflects strong transfer from homeland speakers: There is almost complete overlap between significant factor groups, and the ordering of factor groups is identical in the models for both groups (see
Table A2,
Table A5 and
Table A9). While some of these factors are more universal in nature (i.e., less fronting for longer vowel tokens is not unique to Korean), WordPosition accounts for syllable-initial prominence, which is not a feature of English phonology (
T. Cho, 2005;
T. Cho & Keating, 2009). The shared significance and ranking of domain-initial strengthening effects suggests that Gen1 speakers receive enough input to incorporate this factor into their overall grammars and also to apply the pattern to innovative sound changes. Gen1 and HOM speakers also show the same effect of WordPosition, where it is significant for /o/-fronting and /ɨ/-fronting but not for /u/-fronting. This is further evidence of strong transfer across the phonological grammars of these two speaker groups.
Gen2 speakers do not show even weak transfer effects for linguistic factors except PoA: There is no other overlap between significant factor groups between Generations 1 and 2 (see
Table 5,
Table 7 and
Table 9). The primary significant linguistic effect in Gen2 models shows that back vowels are fronted most in post-coronal contexts. This pattern is robustly attested cross-linguistically (
Hillenbrand et al., 2001;
Oh, 2008) and is not strong evidence for a shared phonological grammar between Gen2 and HOM speakers.
Social factors show more variation across speaker groups. One factor that was predicted to play a role does not emerge as significant in any relevant group: EO-Language. The variation in significant social effects leads us to consider the contact effect as
transfer. Gen1 speakers show strong transfer effects for the social factors Age and Gender for /u/-fronting, where Age has a similar relative effect size compared to other significant factors (see
Table A2,
Table A5 and
Table A8). The effect of Age is also in the same direction, with younger speakers advancing fronting. However, Gen1 speakers do not share the same direction of effect for Gender in /ɨ/-fronting, where males lead fronting rather than females. Gen2 speakers do not show any of the replication patterns (see
Table A3,
Table A6 and
Table A9). Since there are no shared significant social factors between Gen2 speakers and other speaker groups (except the cross-linguistic PoA effect), these results cannot be used to argue that there are even
weak transfer effects, when it comes to social factors.
However, that is not our final answer. To tease apart the linguistic systems of these three speaker groups with different degrees of influence from social factors, linear regression models were constructed that include cues from the other vowels. These models clarify the relationship between vowels in the shift. When we consider the vowel shifts as a system, we see more similarities across heritage and homeland groups. For F2 of /u/, two significant predictors are shared across speaker groups, namely, the effects of a speaker’s F2 of /o/ or /ɨ/ (see
Table 11). Their similar direction and degree of effect suggest
strong transfer: The same factor group and ranking between the model and replica groups indicate similar phonological systems. This indicates that the vowel shift, as a system, has been transmitted from homeland to heritage speakers. This third set of models provides evidence for Heritage Korean participation in the homeland chain shifts: The relationship across the vowels is maintained. These patterns present another possible interpretation of what heritage speakers know. Perhaps, as listeners, they tune into the phonemic system (i.e., the shift patterns), as much as or perhaps instead of, specific predictors, e.g., co-articulatory cues. Recognition of ongoing systemic shifts is another aspect of sociolinguistic competence that these heritage speakers have acquired.
Ethnic orientation scores have been explored to help shed light on motivation for heritage speakers’ participation in the sound change. The EO-Language scores show speakers’ relative alignment towards using Korean and English. In contrast EO-Family scores indicate the relative strength of the two languages and cultural orientations in the speakers’ immediate environment. Ethnic orientation of the speaker has been shown to correlate with participation in vowel shifts in the majority language, where a stronger orientation towards Korean identity is associated with less participation in English sound shifts (
Jeon, 2017). In this study, there is potential for ethnic orientation scores to show ambiguous results, as both languages are undergoing /o/ and /u/-fronting. However, we find that ethnic orientation scores are not a consistent predictor of speaker participation in these vowel shifts in the heritage language.
For /o/-fronting, the EO-Family scores, which indicate the degree of Korean vs. English orientation in the speakers’ environment, represent a significant predictor for Gen2, where a higher score (more “Koreanness” in their family, see topics in
Section 2.1) is associated with less /o/-fronting (see
Table A2). EO-Family is also significant for Gen1 for /ɨ/-fronting, where more Korean in the input environment is associated with greater /ɨ/-fronting (see
Table A8). Thus EO-Family can favor or disfavor participation in different vowel shifts. We posit that the difference here may be because /ɨ/-fronting has no reflex in English, while /o/-fronting does, and the speakers therefore reject the pattern. That is, although /o/-fronting is occurring in both Toronto English and Seoul Korean, Gen2 speakers who orient towards Korean culture resist /o/-fronting in their production of Korean. Their Korean identity in Canada may be linked to resisting vowel shifts that are present in the dominant language. In contrast, given that /ɨ/ is not in the Toronto English vowel inventory, this vowel may not carry the same connotations as /o/. Heritage speakers are advancing /ɨ/-fronting in Canada, similar to their Homeland counterparts, and may be doing so due to its lack of association with English.
The EO-Language score did not have a significant effect in any of these vowel shifts. Participation in the shifts is not influenced by how much the speaker uses English. Perhaps the reason that the ethnic orientation scores are not significant for /u/-fronting is that both poles (English orientation and Korean orientation) are associated with a language that exhibits this fronting, minimizing the utility of this feature as a tool for identity-marking. The lack of automatic or consistent effect of the EO-Family predictor suggests that language contact effects are mediated by attitude. This can be seen as attributing more agency to heritage speakers: They construct their identity, just like other speakers, rather than having contact effects thrust upon them.


