Article

The Investigation of Plume-Regolith Interaction and Dust Dispersal during Chang’E-5 Descent Stage

1
Science and Technology on Vacuum Technology and Physics Laboratory, Lanzhou Institute of Physics, Lanzhou 730000, China
2
School of Mechano-Electronic Engineering, Xidian University, Xi’an 710071, China
3
School of Earth and Space Sciences, University of Science and Technology of China, Hefei 230026, China
4
State Key Laboratory of Lunar and Planetary Sciences, Macau University of Science and Technology, Macau 999078, China
5
CNSA Macau Center for Space Exploration and Science, Macau 999078, China
6
Beijing Institute of Spacecraft System Engineering, China Academy of Space Technology, Beijing 100094, China
7
School of Astronautics, Beihang University, Beijing 100191, China
8
Beijing Institute of Space Mechanics and Electricity, China Academy of Space Technology, Beijing 100094, China
*
Authors to whom correspondence should be addressed.
Aerospace 2022, 9(7), 358; https://doi.org/10.3390/aerospace9070358
Submission received: 6 May 2022 / Revised: 29 June 2022 / Accepted: 30 June 2022 / Published: 5 July 2022
(This article belongs to the Section Astronautics & Space Science)

Abstract

:
The plume-surface interaction that occurs as a result of a variable-thrust engine exhaust plume impinging on soil during landings is critical for future lunar mission design. Unique lunar environmental properties, such as low gravity, high vacuum, and the regolith layer, make this study complex and challenging. In this paper, we build a reliable simulation model, with constraints based on landing photos, to characterize the erosion properties induced by a low-thrust engine plume. We focus on the low-thrust plume-surface erosion process and erosion properties during the Chang’E-5 mission, aiming to determine the erosion difference between high- and low-thrust conditions; this is a major concern, as the erosion process for a low-thrust lunar mission is rarely studied. First, to identify the entire erosion process and its relative effect on the flat lunar surface, a one-to-one rocket nozzle simulation model is built; ground experimental results are utilized to verify the simulated inlet parameters of the vacuum plume flow field. Following that, plume flow is considered using the finite volume method, and the Roberts erosion model, based on excess shear stress, is adopted to describe plume-surface interaction properties. Finally, a Lagrangian framework using the discrete phase model is selected to investigate the dynamic properties of lunar dust particles. Results show that erosion depth, total ejected mass, and the maximum particle incline angle during the Chang’E-5 landing period are approximately 0.2 cm, 335.95 kg, and 4.16°, respectively. These results are not only useful for the Chang’E-5 lunar sample analysis, but also for future lunar mission design.

1. Introduction

The lunar surface is covered by a layer of regolith several meters thick. It is formed primarily by various space weathering processes such as micrometeoroid collisions, solar wind sputtering, and cosmic ray radiation; thus, the ancient history of the Moon is recorded. The finer part of lunar regolith, several to ten microns in size, is called lunar dust, which has caused numerous difficulties in Apollo manned missions according to Apollo astronauts’ descriptions: “after several landing hours, lunar dust is the source of certain aggravating operational problems”, and “I think dust is probably one of our greatest inhibitors to a nominal operation on the Moon. I think we can overcome physiological or physical or mechanical problems except for dust” [1,2]. It is notable that lunar dust is a significant hazard during Apollo missions; the same can be expected for other lunar missions involving a soft landing and rocket return, or other lunar surface disturbances [3,4,5,6]. Related problems include surface obscuration, mechanism clogging, space suit pressurization leaks, and so on.
Although the lunar regolith is generally considered to be essentially static, because it is not subject to erosion induced by wind or water, it is disturbed by surface charging and levitation due to electrical force. It is also disturbed by micrometeoroids’ impact and is ejected, which is categorized as a natural mechanism disturbance [7,8]. In addition to natural mechanisms, human activities on the Moon also disturb uncountable lunar dust particles, resulting in serious latent hazards [9,10,11]. Of all human activities that disturb the lunar regolith, landing on the Moon has the most significant impact. During this process, the engine plume can strip off surface layers of lunar regolith and eject massive quantities of high-speed lunar dust with speeds up to kilometers per second due to the Moon’s almost complete vacuum and low gravity environment. These high-speed dust particles severely threaten the safety of nearby instruments or astronauts.
To investigate engine plume erosion characteristics, an in-situ lunar dust detector is used to measure the accumulation of ejected dust particles during Apollo and Chang’E missions. On Apollo missions, the lunar dust detector comprises three solar cells acting as sensors [12]. Such detectors on Apollo 11, Apollo 12, and Apollo 15 missions observed dust output variation during descent and ascent stages. Unfortunately, these three missions only measured the qualitative dust ejection phenomenon one hundred meters away from landing sites [13,14]. Lunar dust mass deposition at the landing site during the descent stage was approximately 0.83 mg/cm2 on the Chang’E-3 mission [15,16]. These four missions do not provide comprehensive landing erosion information because of the limited opportunities for dust detection. In addition, allocation height, distance from the landing site, and sensor sensitive areas significantly affect dust deposition results. Therefore, different approaches are required to effectively investigate the lunar dust erosion process within such difficult boundary conditions.
Earth experimental investigation is capable of obtaining lunar erosion information, including crater shape, crater depth, and erosion parameters. Many investigations were conducted to compile information about this problem. Carly et al. established a box (measuring 12 inches by 12 inches by 7 inches) to make the plume and lunar regolith interaction a reality [17]. In this experiment, gas velocities of 56 m/s, 40 m/s, and 37 m/s were adopted to obtain erosion crater depths over time under the influence of four different gases (Helium, Argon, Nitrogen and Carbon Dioxide), illustrating that variation in the erosion depth scale is independent of gas velocity and density, but that the time scale is dependent on gas velocity and density. Robert et al. investigated erosion properties by changing loose lunar particles’ density and mean diameter, finally finding that “crater-in-crater” geometry occurs under strong jet flow. Crater shape can be predicted in terms of an erosion parameter. In this study, the erosion parameter is extended to approximately five times that of previous laboratory experiments, which is a significant development [18]. Current experiments conducted on Earth all rely on the Earth’s environment, as a sustained vacuum and low-gravity environment are difficult to maintain. In addition, the engine nozzle geometry and gas flow properties differ significantly on Earth when compared to the actual situation. This overly simplistic model is inadequate to produce the erosion phenomenon obtained by lunar landing; therefore, some erosion phenomenon are missed.
Benefiting from computer development, in recent years plume flow properties and corresponding erosion models began to be calculated using simulations, which is an effective method at present. As with other methods, simulation also starts with qualitative analysis, and mainly focuses on plume flow coupling from the engine nozzle to vacuum flow and expansion, and the flow field structure [19,20]. Next, to better understand this process, the simulation model and erosion theory are continuously optimized using researchers’ increased understanding of the lunar surface fence effect, the erosion model, relative particle trajectories, and particle velocity distribution [19,20,21,22,23,24,25]. Although these investigations offer acceptable approximations of erosion characteristics to some degree, they have not been compared with actual landing erosion properties; it is therefore difficult to know if the results are reasonable. For example, He et al. and Li et al. [22,24] do not take actual engine thrust properties into consideration. Morries et al. [19,20] and Lane et al. [23] adopt landing thrust value as vacuum flow inlet parameters, but they use water vapor as inlet gas. The actual engine outlet gas comprises several types of gas, with different physical properties, including specific temperatures, thermal conductivities, and collision properties, which result in a change in flow properties such as density, velocity, and pressure. Additionally, the erosion process is not consistent with the actual landing trajectory. The addition of the fence on the lunar surface aims to study stones’ influence on flow shape and the flow field’s physical properties, which fails to combine with landing site stone or the lunar surface’s slope gradient to reflect these factors’ effects [21]. In addition, not only is the time spent corresponding engine altitudes during the landing process the main factor used to verify and adjust the simulation model, but it is also the basis used to calculate the mass erosion rate and total mass erosion, which has not been studied in previous works. Therefore, an accurate simulation model coupled with the actual parameters of the engine is necessary to identify accurate erosion processes and relative properties. Based on this, this study considers the actual plume properties of the Chang’E-5 mission, combining actual landing information and ground experimental results of engine plume gas properties to reveal erosion properties to their full extent. The engine-ground experimental results help to optimize flow inlet parameters, and the descent information helps offer landing trajectories and optimize simulation. In contrast with the Apollo missions, Chang’E-5’s mission designed a small thrust engine to accomplish a soft landing. With the help of the landing site dust properties’ analysis, the dust dispersal and ejection process will be obtained more accurately, making this work more comprehensive. These erosion results will help the research community better understand how the lander’s exhaust plume disturbs the regolith and its volatiles, and even guide future lunar dust protection methods.

2. Computational Models and Numerical Method

A 7500 N throttleable engine on the Chang’E-5 spacecraft provides the adjustable thrust required to realize a soft-landing. Figure 1a shows the landing trajectory of the Chang’E-5 mission. The lander descends with a vertical trajectory when its altitude is below 30 m. According to the analysis of landing photos, the dust begins to be ejected at an altitude of approximately 13.74 m; the corresponding engine thrust is approximately 2900 N during the dust ejection period before the engine is shut off. Figure 1b presents a schematic of the plume vacuum flow field associated with lunar surface erosion properties. On the outside, the plume flows towards the lunar surface with a slight expansion. Upon arriving, it collides with the lunar surface at a high velocity, and some of the gas molecules rebound to form strong flow shock; the remaining gas molecules are compressed in the stagnation region due to high pressure. As the gas continuously collides, the plume gas flows along the nozzle radius direction, and the lunar surface is disturbed where the gas arrives. In Figure 1b, r0 denotes the initial erosion radius, which is near the stagnation region; this is also illustrated in [26]. The erosion radius (r1) is the location where the erosion interaction finishes.

2.1. Compressible Plume Flow Simulation Model and Method

In this work, a one-to-one Chang’E-5 rocket model is built to simulate nozzle internal flow properties. The Chang’E-5 descent engine is throttleable, with a maximum thrust of approximately 7500 N. During the final 10 s before touchdown, the thrust is approximately a constant 2900 N. The flow and erosion process includes two stages: the nozzle internal gas flow stage and the plume vacuum flow stage. The simulation models of both stages are shown in Figure 2. Fluent software was used to simulate the two flow stages, which are verified as useful and effective in describing this type of flow when vacuum flow is near-field [28,29]. Figure 2a shows the nozzle geometry of the Chang’E-5 mission. Figure 2b illustrates the plume vacuum flow geometry in this study, which has a two-dimensional axial symmetry. In Figure 2b, the x coordinate denotes the lunar surface, the z coordinate denotes the nozzle centerline, L denotes the distance from the nozzle centerline, h denotes the nozzle altitude, r denotes the nozzle outlet radius with a value of 0.4015 m, vacuum boundary denotes the lunar environment, and nozzle wall denotes the wall boundary.
In this study, the key point is how to obtain accurate vacuum inlet flow parameters, which are needed to calculate nozzle outlet flow parameters accurately. With this aim, the nozzle simulation should be optimized and verified by comparison with ground experimental results, which is a useful way to check whether our simulation is reasonable or not. Next, the nozzle output flow parameters can be used to calculate the vacuum plume gas flow fields. Considering the active erosion thrust is 2900 N, all nozzle flow inlet parameters are adopted based on this thrust, which allows comparison with landing photo data and ground test results. At the first simulation stage, water vapor is the only gas included, to keep things simple. Water vapor’s average molecular weight value is 20.29 and its specific heat coefficient is temperature-dependent. At the second simulation stage (plume vacuum flow), simulated gas comprises H2O (Mass fraction 20%), N2 (Mass fraction 42%), CO2 (Mass fraction 31%), CO (Mass fraction 4%), and H2 (Mass fraction 3%), which is similar to the ground test results. Other inlet parameters adopt these same parameters from the output flow properties at the first simulation stage.

2.2. Lunar Dust Discrete Phase Model

In this study, the trajectory and behavior of lunar dust particles in the plume flow field are calculated in a Lagrangian framework using the discrete phase model (DPM). The particles will be affected by three external forces: lunar gravity force, plume gas drag force, and plume gas lift force. The lunar dust particles’ trajectories are predicted according to these three forces and accelerations acting on them [23]. The force acting on dust particles can be written as
a drag + a lift + g
where adrag denotes lunar particles’ drag acceleration, alift denotes lunar particles’ lift acceleration (both accelerations are dominated by the plume gas flow field), and g denotes lunar gravitational acceleration.
In this simulation, dust drag acceleration is written as
a drag = u g u p τ r
where ug denotes plume gas velocity, up denotes lunar dust particles’ velocity, and τr denotes lunar dust particles’ relaxation time. τr can be written as [30]
τ r = ρ p d p 2 18 μ 24 C d Re
where ρp denotes lunar dust particles’ density with a value of 3195.2 kg/m3 (measured using Chang’E-5 samples) [31], dp represents lunar dust particles’ diameter, μ denotes plume gas viscosity, Cd denotes drag force coefficient, and Re denotes Reynolds number. Re’s expression is listed below [32]
Re = ρ d p u p u g μ
Here, ρ denotes plume gas density, and its value is calculated using ideal gas mix-law. In the simulation, in order to omit particles’ rotation influence, lunar dust particles are assumed to be spherical, and their drag coefficients can be calculated as follows [33]
C d = a 1 + a 2 Re + a 3 Re 2
where a1, a2, and a3 are constant coefficients for spherical particles; the relationship between them is been listed in [34]. With the exception of drag force on a single lunar dust particle, lunar dust will undergo lift force from plume gas flow, and its expression can be written as [33].
a lift = 2 K v 1 2 ρ ρ p d p ( u g u p )
Here, K = 2.594, and v denotes kinematic viscosity. The integrated forces on lunar dust particles are equivalent to their acceleration, which can be written as different Taylor expansions about time point k for position and velocity listed in Equations (7) and (8),
u k = u k - 1 + a k - 1 Δ t
r k = r k 1 + u k 1 Δ t + 1 2 a k 1 Δ t 2
where uk represents particle velocity at kth time point, ak−1 represents particle acceleration at k-1th time, and rk represents particle position at kth time point. According to equations (7) and (8), lunar dust acceleration consists of three items; combining the above equations, the acceleration at kth time point can be written as
a k = a drag k + a lift k + g = v k u k τ r + ( 1 2 k μ 1 2 ρ f ρ p D p ) ( 6 π D p 3 ) + g = ( 3 μ C d Re 4 ρ p D p 2 ) ( v k u k ) + ( 3 k μ 1 2 ρ f π ρ p D p 4 ) ( v k u k ) + g

2.3. Lunar Surface Erosion Model

When lunar dust particles naturally accumulate on the lunar surface, internal particle force keeps them still. However, when plume gas impinges on these particles, the original balance is disturbed. The dominant erosion mechanism adopted here is viscous erosion in the lunar environment. In this investigation, the Roberts erosion model, based on the viscous erosion model, is adopted to describe the lunar surface erosion characteristics of the Chang’E-5 mission [28]. In this model, if the lunar surface shear stress exceeds the critical stress, surface erosion will take place, and the mass erosion rate in this moment will be
1 2 a u g d m d t = ( τ τ * )
where a denotes the fraction velocity that the dust particles gain from the plume gas, dm/dt is the dust mass erosion rate, and τ is the shear stress on the surface. If the shear stress on lunar dust reaches its critical value, its static state is immediately broken, and the erosion phenomenon occurs. The Mohr–Coulomb failure criterion is used to calculate the threshold shear stress τ* [28,34] as follows
τ * = c + P tan ϕ
where c is cohesive stress, which is obtained by assuming that the attractive forces between particles are van der Waals forces, and its value depends on particle diameter. P is the gas static pressure acting on the lunar surface. φ is the angle of internal friction representing the shear capacities of soil particles. Roberts defines a as
a = [ 1 2 + 1 4 + 1 ζ ] 1
where
ζ = 18 μ c h ρ p R T c ( 4 + k h y p e r ) [ 1 d p 2 + 1 d p ( 4 + k h y p e r ) C d 72 e 2 R T c F T h r u s t μ c h 2 ]
In the above equations, μc and Tc are the nozzle outlet viscosity and temperature, respectively; h, ρp, and dp are the nozzle altitude, particle density, and particle diameter of the regolith, respectively; R is the gas constant; Cd denotes the drag coefficient of the particle (assumed to be 0.2 by Roberts); FThrust = 2900 N; and Khyper represents the hypersonic parameter of the engine. Khyper is written as
K h y p e r = γ ( γ 1 ) M n 2
where γ denotes the ratio of the specific heat of the gas and Mn denotes the exit plane Mach number of the nozzle outlet.

3. Results and Discussions

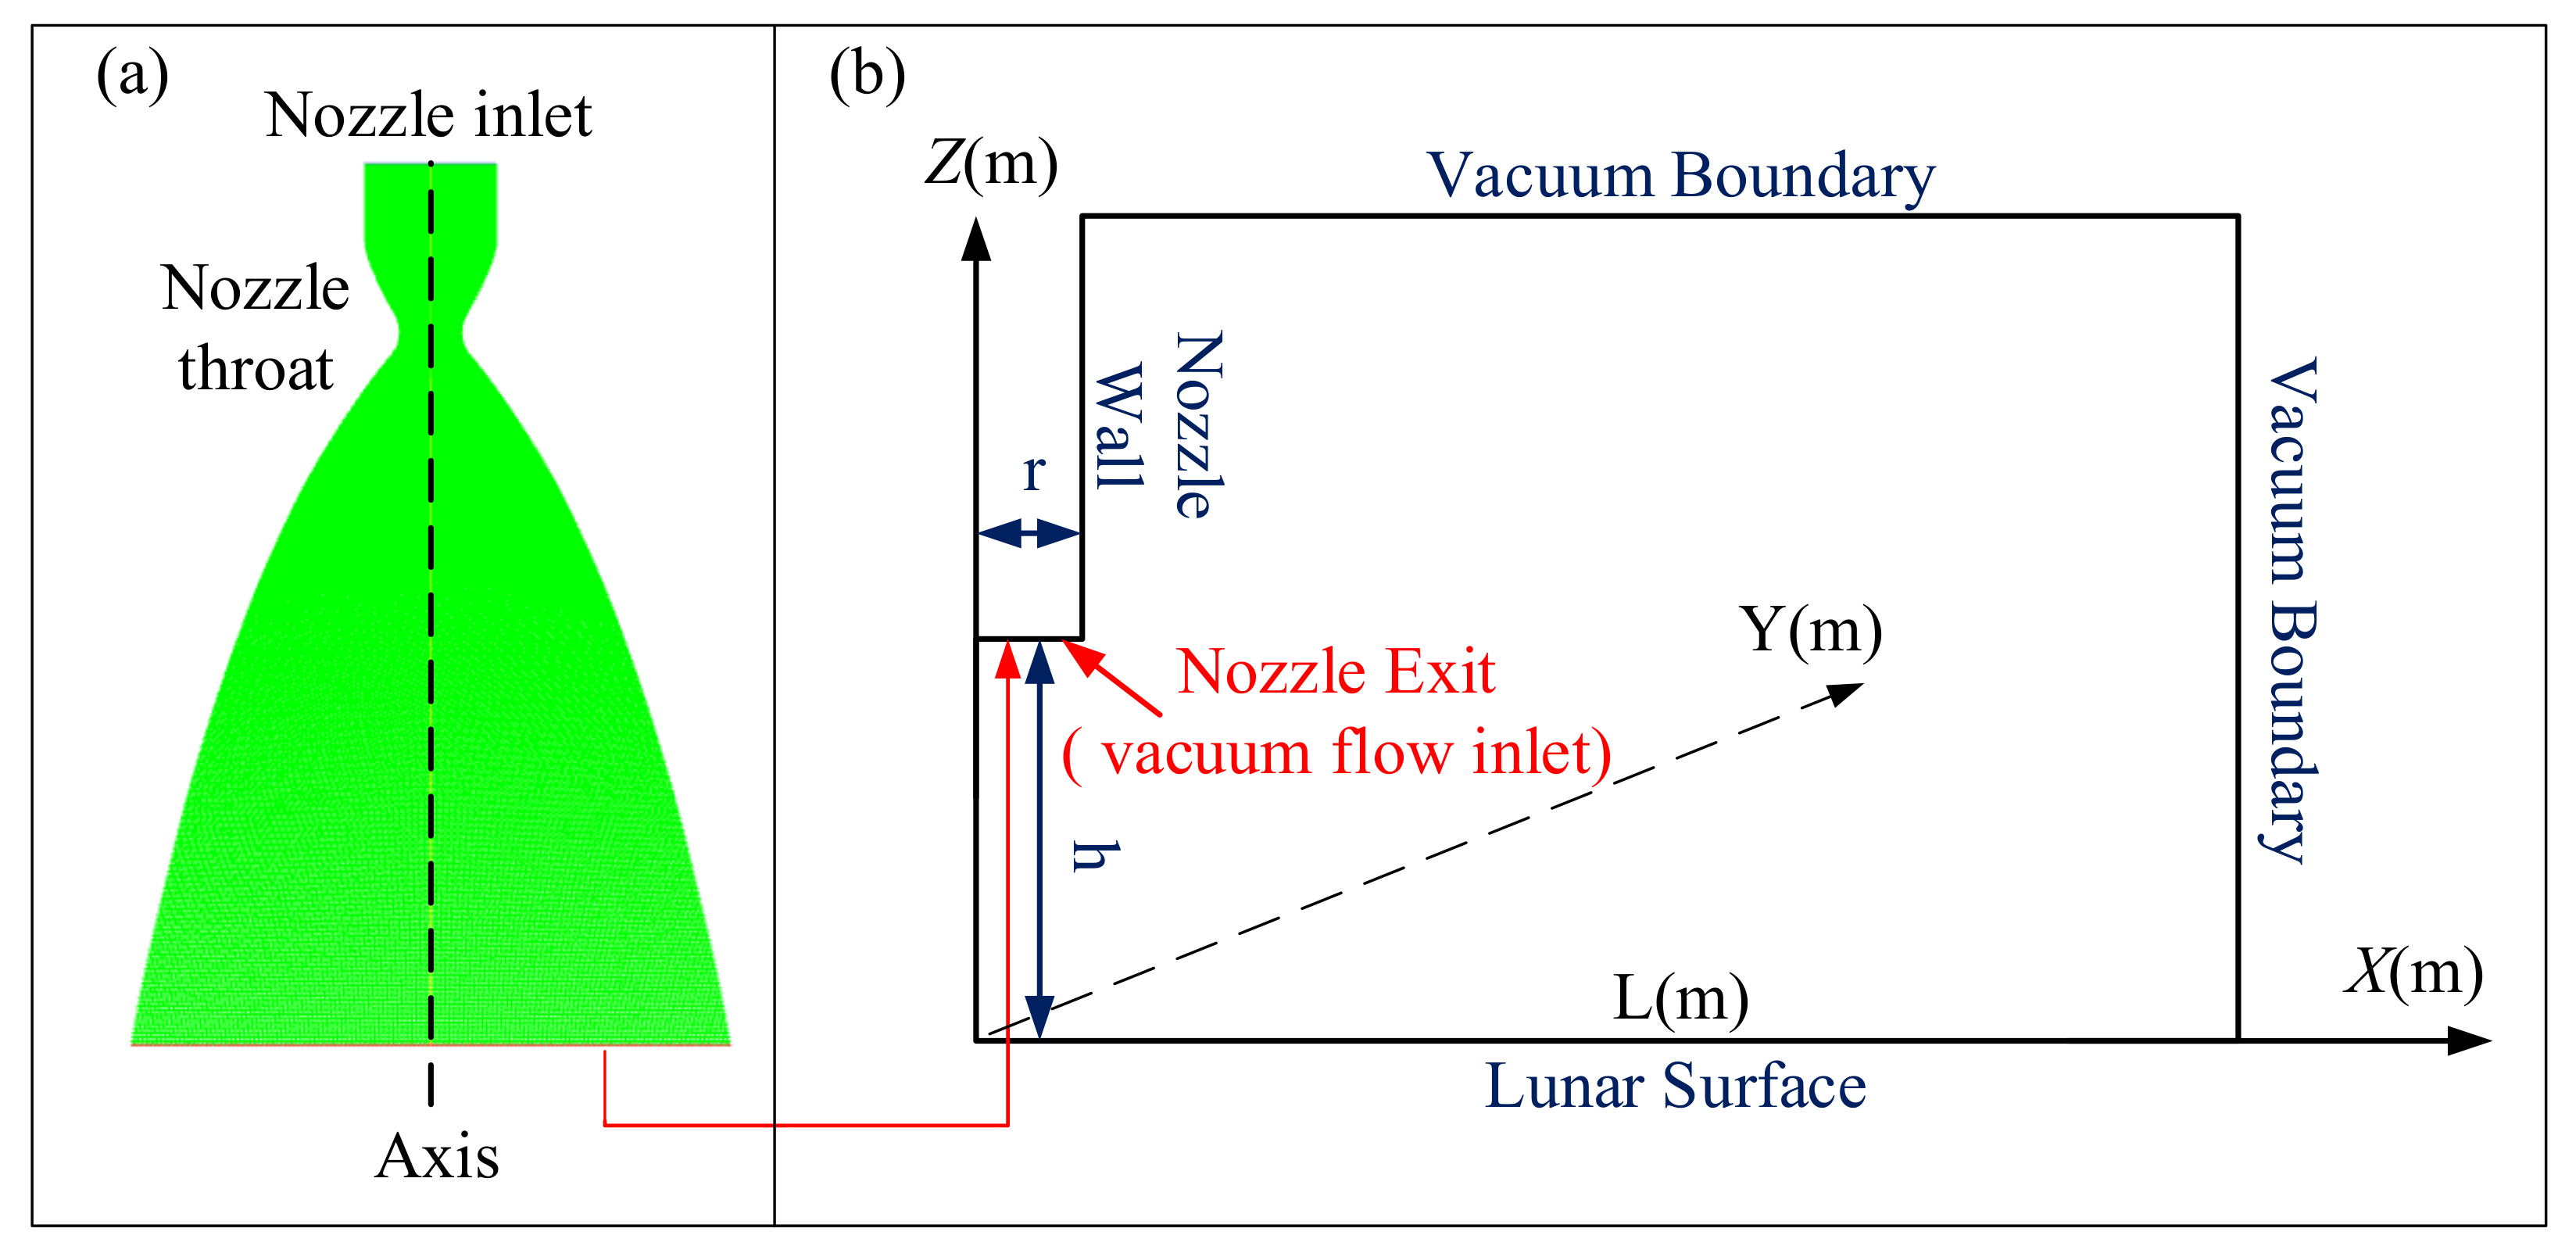
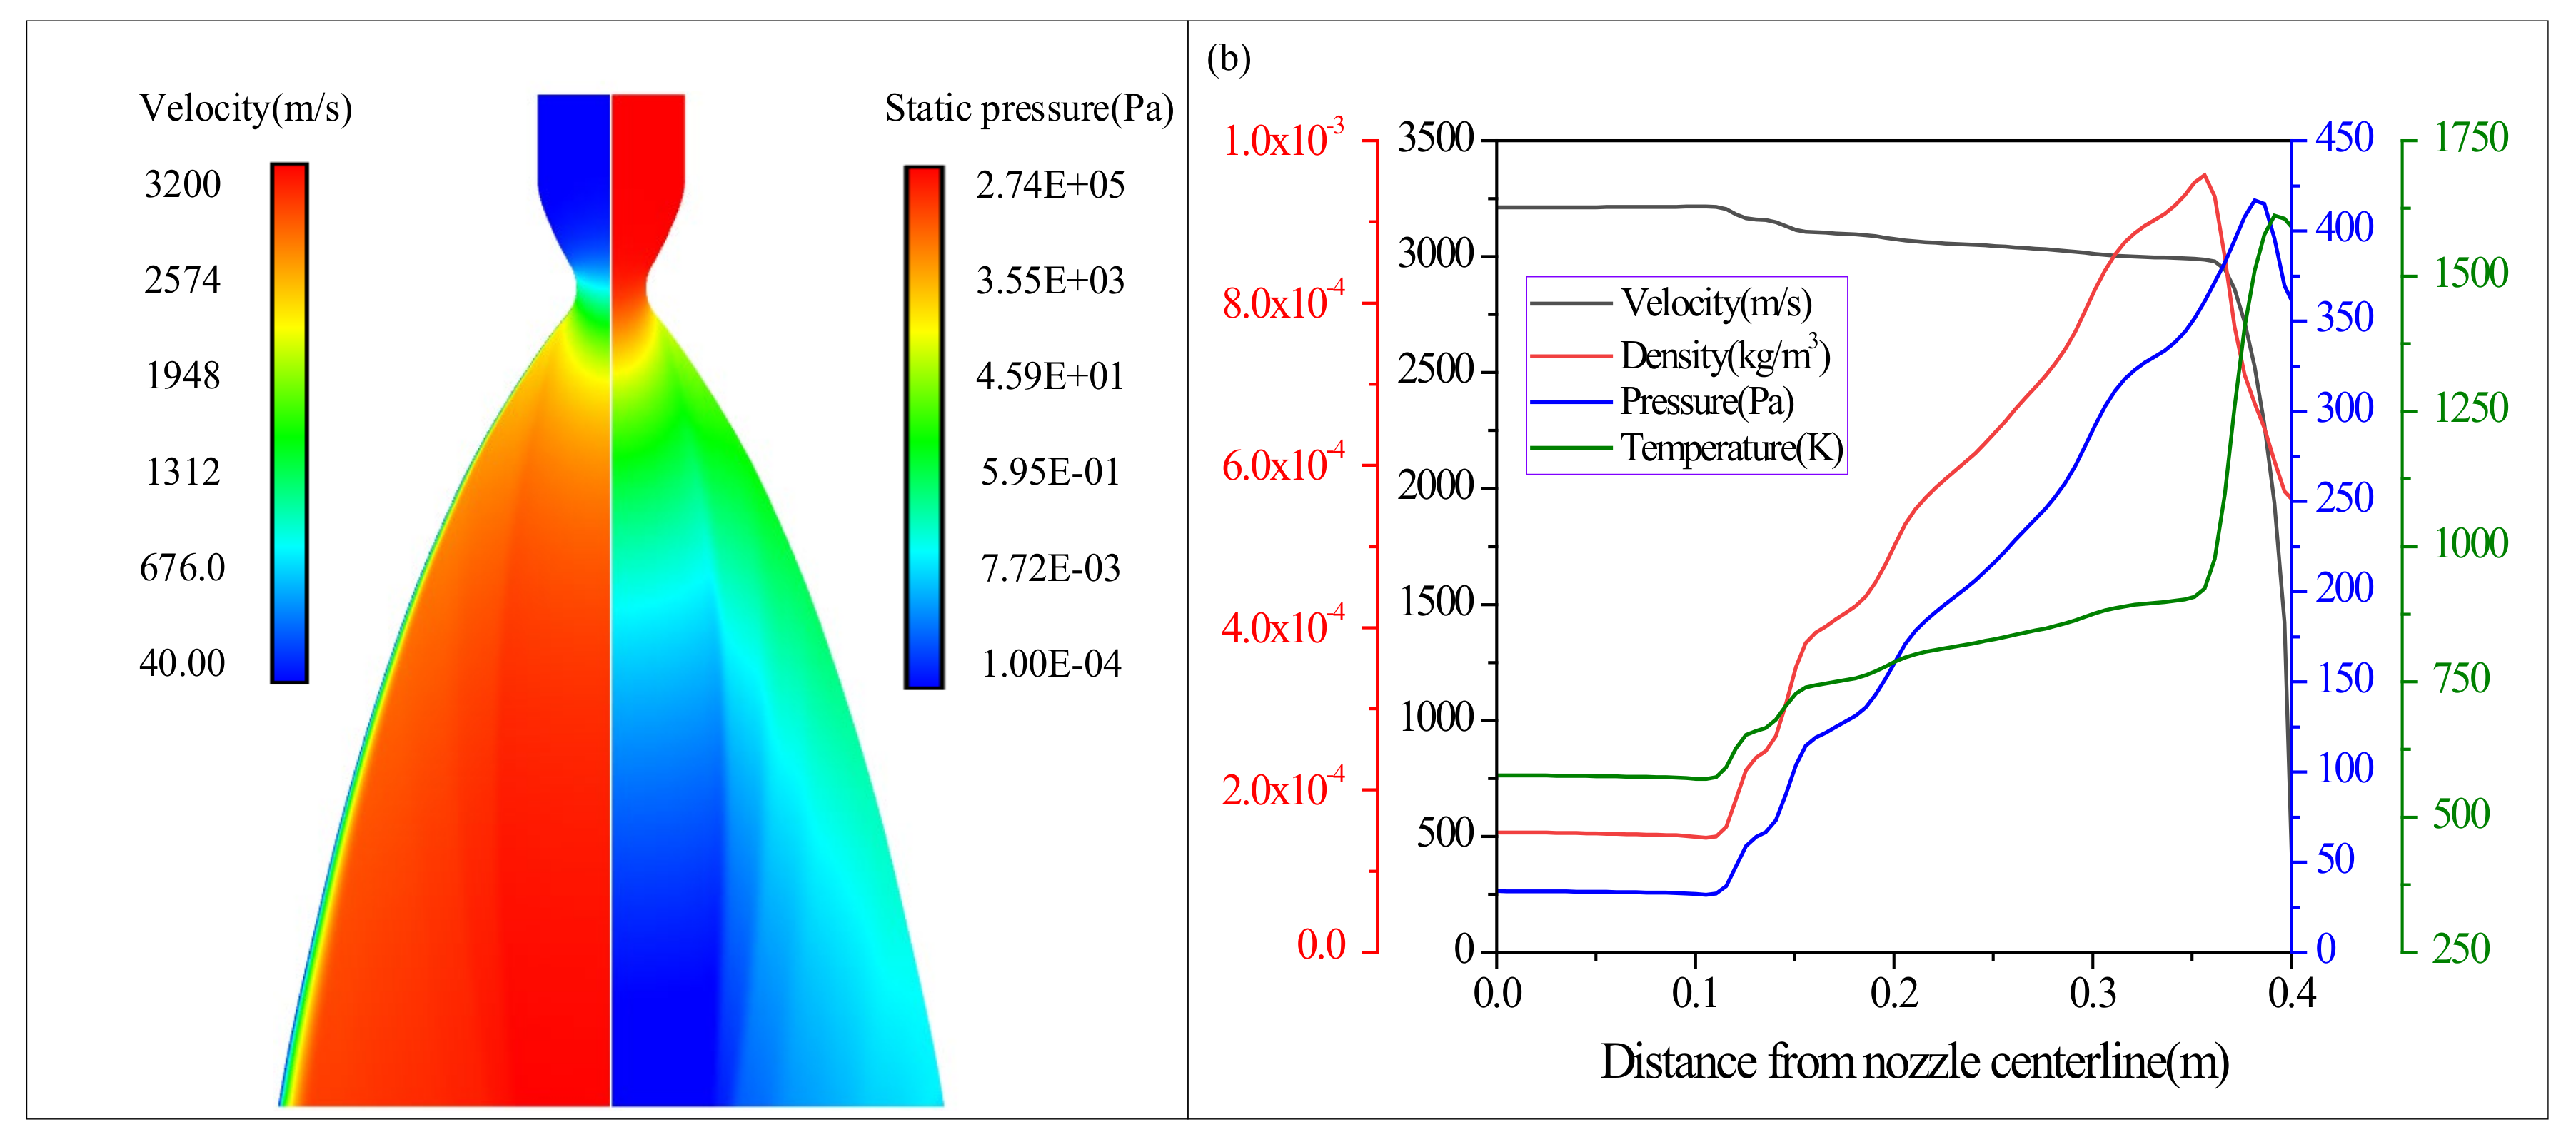
Figure 3 illustrates the nozzle internal flow properties of the Chang’E-5 mission. Figure 3a shows the nozzle velocity and static pressure contour; the left side illustrates velocity and the right side illustrates static pressure. In Figure 3a, one can see that the nozzle inlet velocity is low, but the static pressure is high compared to the static pressure at the outlet. Affected by the nozzle throat geometry, a compression wave occurs near the nozzle throat and spreads towards the nozzle exit, which induces a sudden change in internal gas flow properties including velocity, temperature, pressure, and density. After passing the throat, the gas gradually expands due to nozzle geometry expansion. Figure 3a also shows that a low-speed boundary layer exists in the nozzle wall, resulting from the viscosity of the gas flow. Figure 3b illustrates the nozzle outlet velocity, density, pressure, and temperature variation along the nozzle radial direction. The nonuniformity of nozzle outlet flow properties is induced by the compression wave at the nozzle throat. With the exception of velocity, the other flow parameters remain constant at first, then increase rapidly, and finally decrease suddenly. The position where these parameters start to increase is similar, at approximately 0.12 m from the nozzle centerline. The decrease positions are different, because decreases are led by the interplay between the compression wave and the subsequent expansion. Velocity has an inverse trend compared with the other parameters, and also has two jump points. The difference in the nozzle boundary layer results in a difference in the position of the second jump point position. Additionally, velocity, density, pressure, and temperature variation trends all agree well with those calculated during the Apollo mission, but differ in numerical values due to the thrust difference, which explains the rationality of the simulation to a certain extent [21].
According to previous studies and present experience, the most useful method to evaluate whether the nozzle flow is precise is to compare the simulation results with the ground test. Table 1 illustrates the nozzle exit plane flow values for the Mach number (Ma), pressure (P), temperature (T), and velocity (V) of the simulations and experiments for the Chang’E-5 and Apollo missions. The simulation results are very close to those obtained from the ground verification test results in the Chang’E-5 mission. In Table 1, it is obvious that the thrust of the Apollo mission is much larger than that of the Chang’E-5 mission; the Apollo mission was a manned lunar exploration with a greater landing mass. In addition, the nozzle outlet radius of the Apollo mission is almost twice the size of that of the Chang’E-5 mission. Regarding nozzle outlet flow properties, the nozzle outlet velocity and Mach number are similar, but the pressure and temperature are different. The differences are mainly a result of the mass flow rates of the two missions.
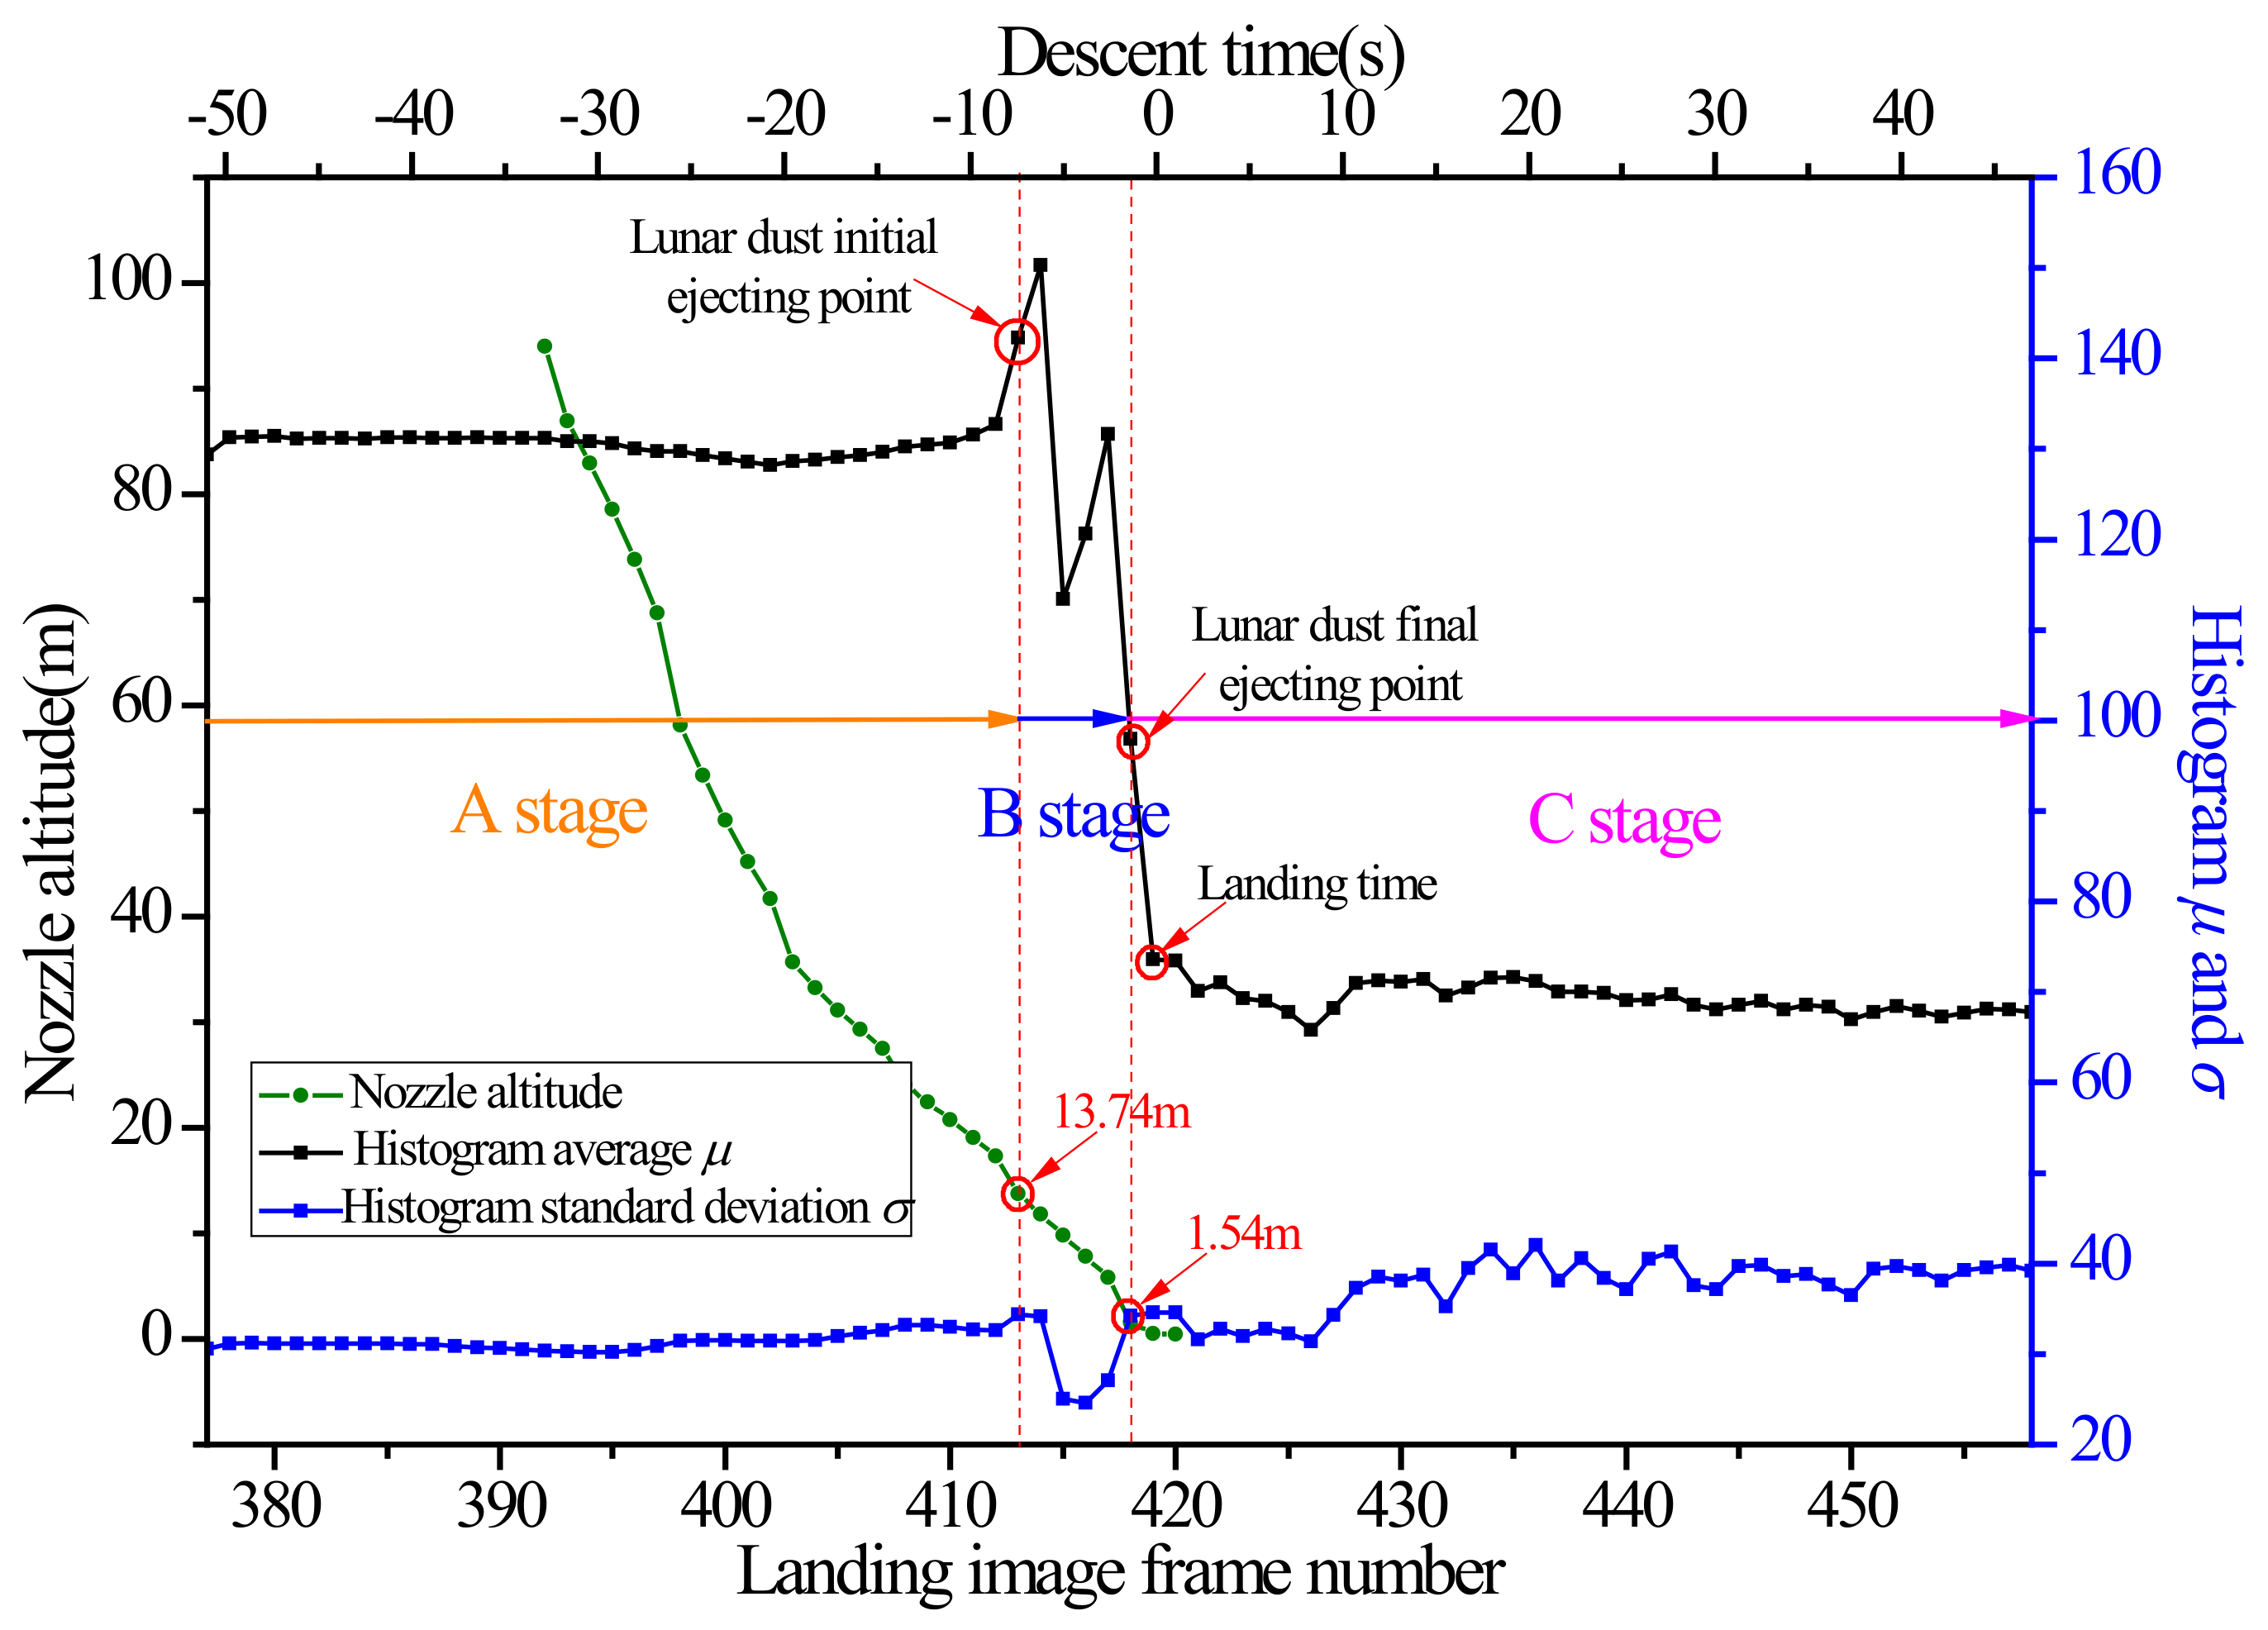
Figure 4 illustrates the variations in landing image histogram parameters and nozzle altitudes with landing time. Negative times denotes the period before landing, and positive times denotes the period after landing. The green line denotes nozzle altitude variation trends in image frame numbers 392 to 420. During this period, the nozzle altitude changes from approximately 94 m to 0.48 m. In this section, the entire histogram image of each landing photo was calculated using Matlab software to estimate if the lunar regolith was disturbed. The histogram average (µ) indicates the brightness change in the landing photos. The histogram deviation (σ) indicates the contrast change in the landing photos. The black line and blue line represent the µ and σ of landing images, respectively. These two lines remain almost constant in landing image frames 377 to 412, then fluctuate during landing image frames 413 to 418, and, finally, remain constant again. According to these changes, the process is divided into 3 stages (A stage, B stage, and C stage). In the A stage, the landing photo shows no obvious variation, indicating no ejection of lunar dust. When the nozzle altitude decreases, obvious fluctuations occur for µ and σ, resulting in two peaks of µ in the B stage. For the duration of this stage, obvious brightness variation exists in the landing images, demonstrating that dust was gradually ejected by the nozzle plume, which is also demonstrated by the landing images shown in Table 2. After that, µ and σ tend to be constant during the C stage, and the dust ejection phenomenon may stop when the lander engine is shut down. Photo number 412 is obviously brighter than photo number 411, which indicates that the initial ejection position of lunar dust occurs near this time point. This photo denotes 7 s before landing, when the relative height of the nozzle is 13.74 m. Therefore, this is defined as the beginning of the dust ejection point corresponding to the B stage. Next, the µ of landing photo number 414 reaches its peak for the landing period, as does its σ. The probable reason a decrease occurs in the histogram parameters of photo number 415 is the lander’s shadow effect. After photo number 418, the µ and the σ decrease slightly, indicating that only a small amount of lunar dust is ejected. As time passes, the two parameters will finally remain constant. No reverse peak point exists in Figure 4, indicating that no large crater shadow region exists in the vicinity of the Chang’E-5 landing site which significantly affect µ and σ. This surface condition can also be captured using a landing photo or a panorama photo. To guarantee landing photo analysis accuracy, photos numbered 380 to 405 can be selected as references for photo brightness to illustrate the local environment.
Table 2 lists corresponding landing photos at the B stage and a detailed description of each photo during the dust ejection period. In Table 2, the brightest region appears in the center of the photo, just below the nozzle outlet. This brightest region indicates that a thick layer of lunar regolith was blown away by the plume. As time passes, the nozzle comes closer to the landing site, and the bright region diminishes because the plume gas has a lower expansion rate before arriving at the lunar surface, resulting in a stronger collision with the lunar surface. Next, as the nozzle altitude decreases, the stronger plume dynamic pressure shapes a deeper erosion crater. At the same time, lunar dust particles are ejected with a beam shape, and fly along the radical direction. After that, a lunar surface erosion crater becomes evident. During the entire dust ejecting period, the brightest photo number is 414, which corresponds to the maximum µ in Figure 4. Its shutdown time and final thrust are recorded by the Chang’E-5 mission guidance navigation and control system [27].
In Table 2, the landing photos included at stage B are those with nozzle altitudes of 13.74 m, 11.83 m, 9.82 m, 7.83 m, 5.80 m, and 1.54 m. Hence, these six nozzle altitudes are used in the simulation to obtain lunar surface erosion process because this allows us to directly compare our simulation results with the actual Chang’E-5 landing. 
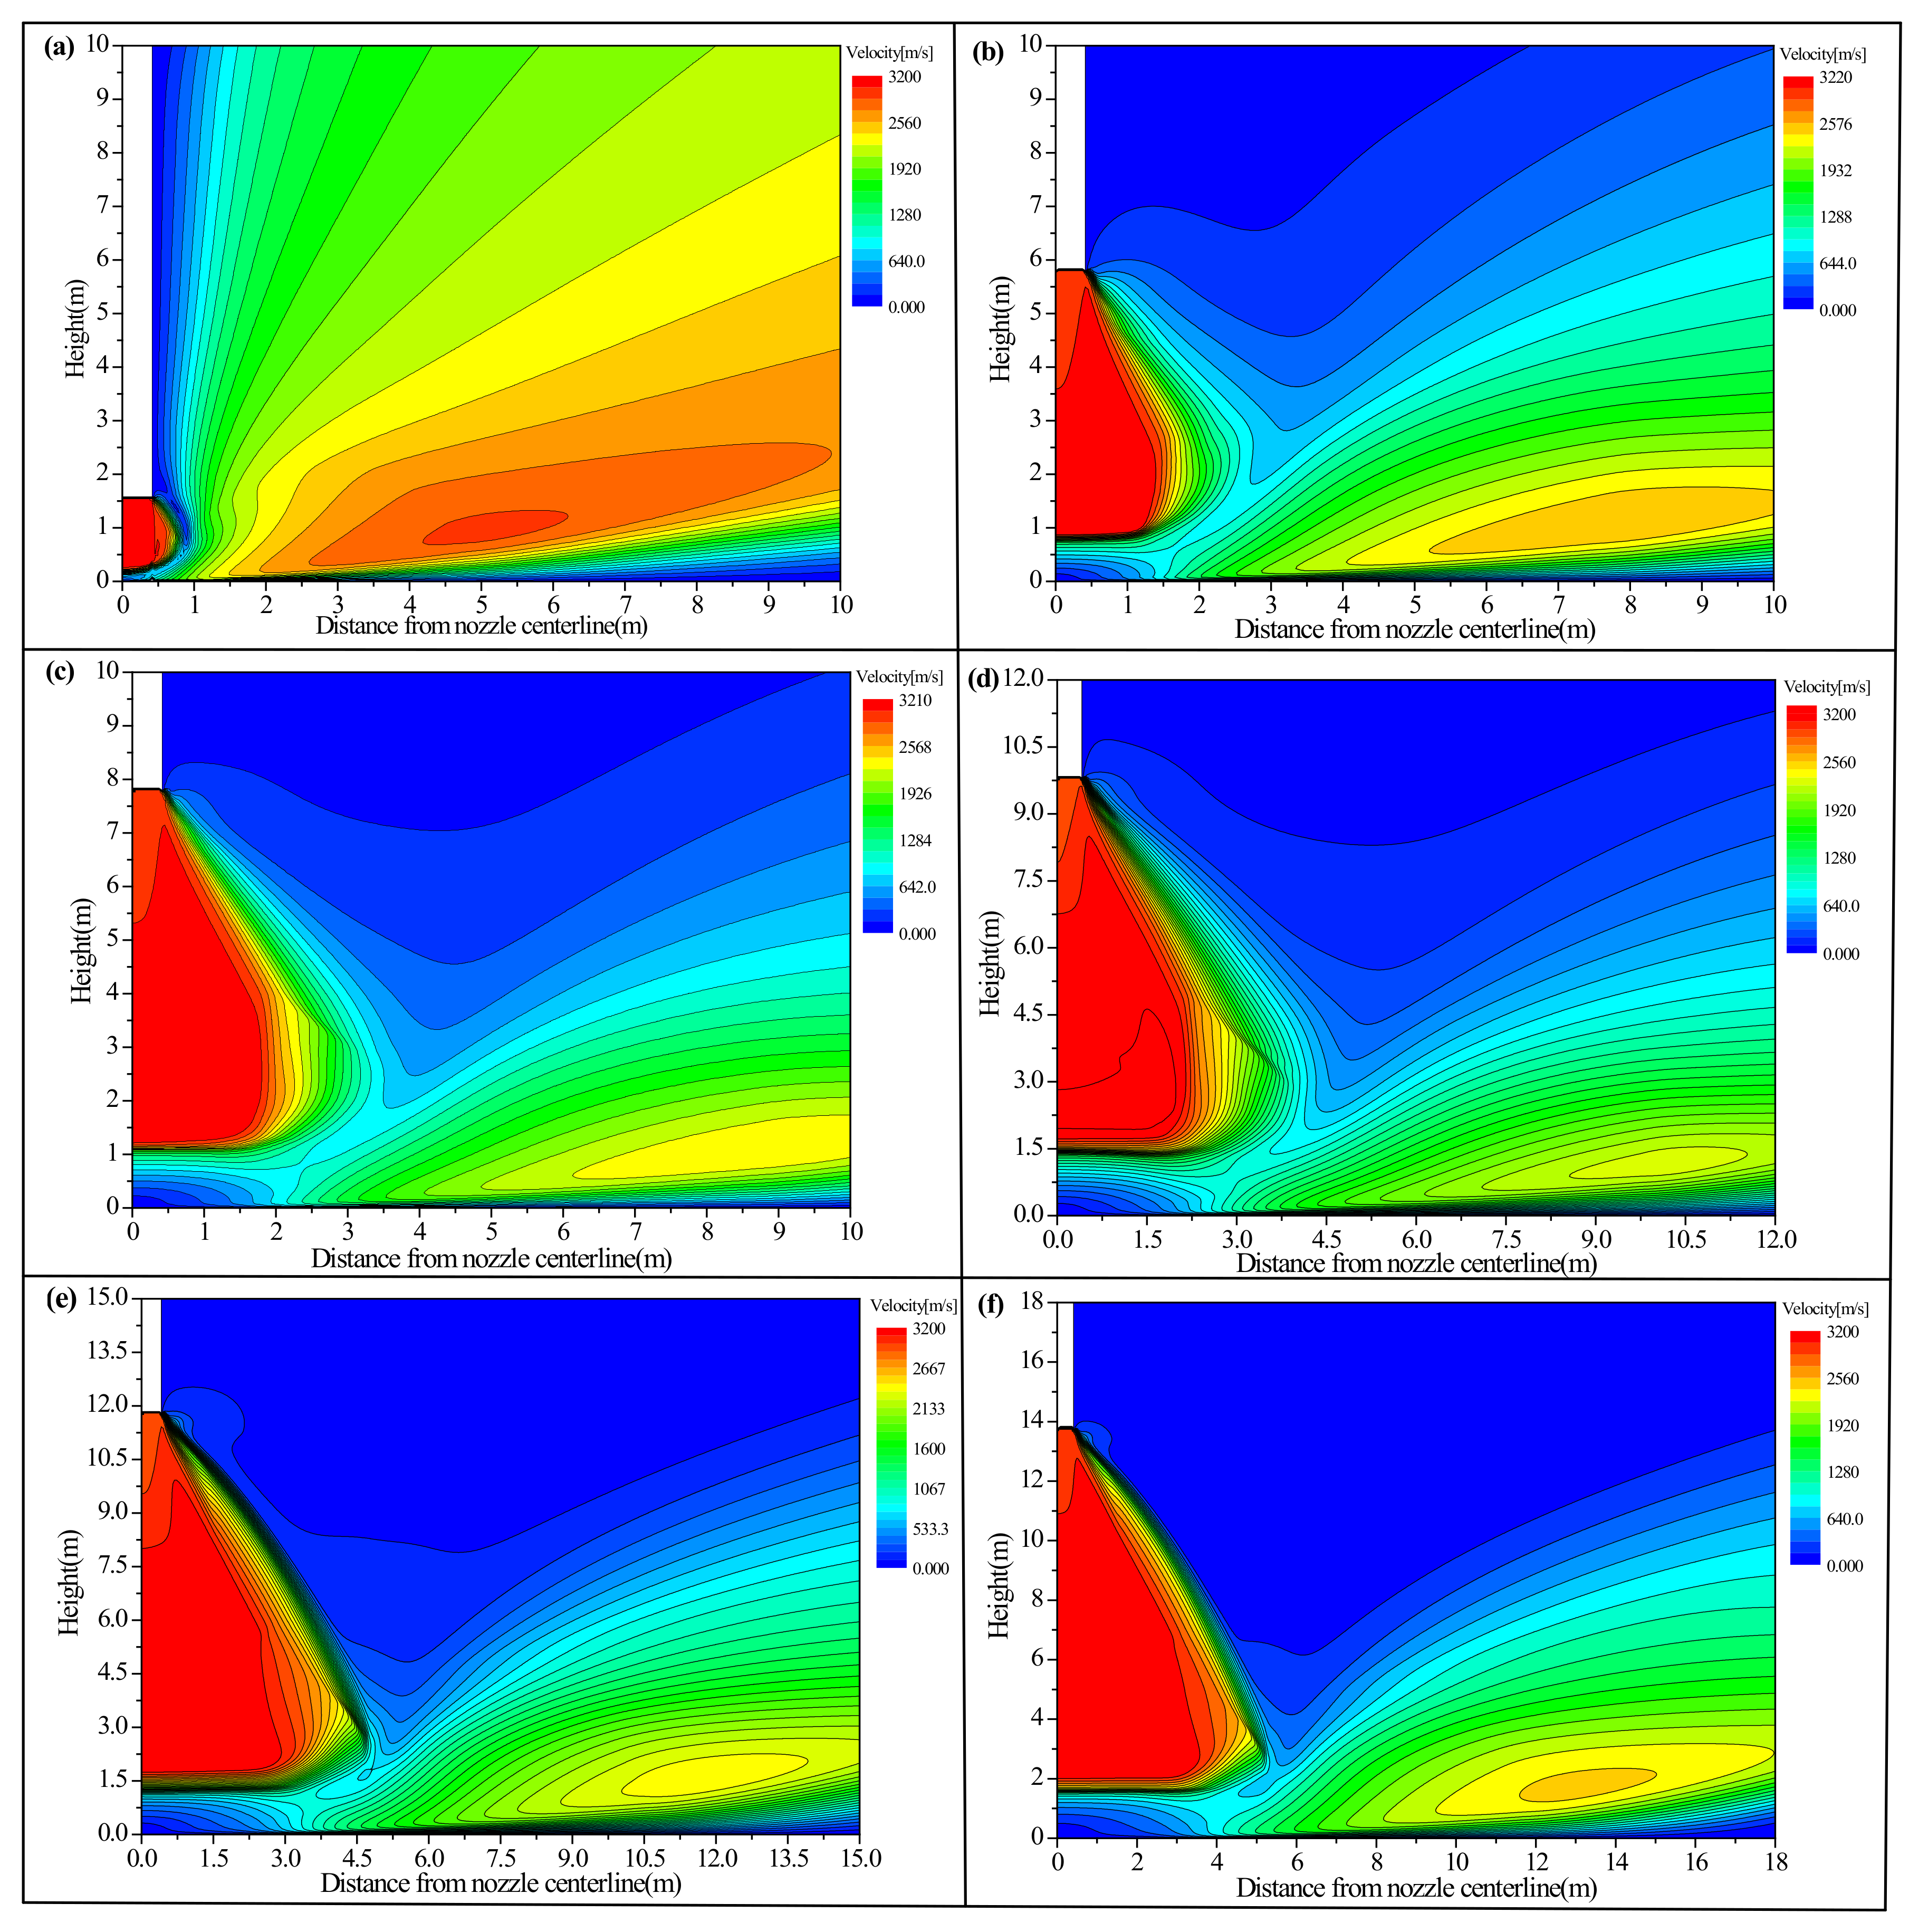
Figure 5 presents the plume velocity contours at these nozzle altitudes. Three noteworthy flow regions exist in the entire flow field. The high vacuum lunar environment condition makes the plume gas expand rapidly, forming a red flow region beneath the nozzle outlet, which is considered the first particular region. In this region, many plume gas molecules collide with each other and expand; thus, the plume gas velocity is at its maximum, and its expansion shape resembles a bowl. Comparing the six contours, it can be gathered that the area of this region decreases as the nozzle altitude decreases. For example, when the nozzle altitude is 1.54 m, this region’s boundary is approximately 0.8 m in the radical direction, but it increases to 5.1 m when the nozzle height is 13.74 m. Additionally, this region’s layer thickness also decreases with a reduction in the nozzle altitude. The probable explanation for the above phenomenon is a longer expansion time and a larger expansion space at higher altitudes. The second obvious flow region is between the first flow region and the lunar surface. Similar to the first flow region, its area also increases with nozzle height. However, when the nozzle altitude is 1.54 m, this region can scarcely be observed due to the strongest compression effect. In contrast to the first flow region, the impingement point beneath the bowl shock region occurs as a stagnation region, caused by bowl shock compression. Here, density and pressure are at their maximums, but velocity is at its slowest. After strong compression, a favorable pressure gradient takes place in the radical direction, resulting in outward plume flows in the radical direction, which define the third noteworthy flow region. This third region not only exists as a compression flow field, but also has an expansion flow field. Affected by the compression of the stagnation region, its initial flow shape is spiky; then, the plume flows in the radical direction with an expansion similar to a bow shock. What needs special attention in this region is that the center has a higher velocity, but the outer boundaries have a lower velocity, resulting in non-uniformity of velocity distribution, because the center flow has higher internal energy and less heat change, but the outer boundaries dissipate energy towards the lunar environment.
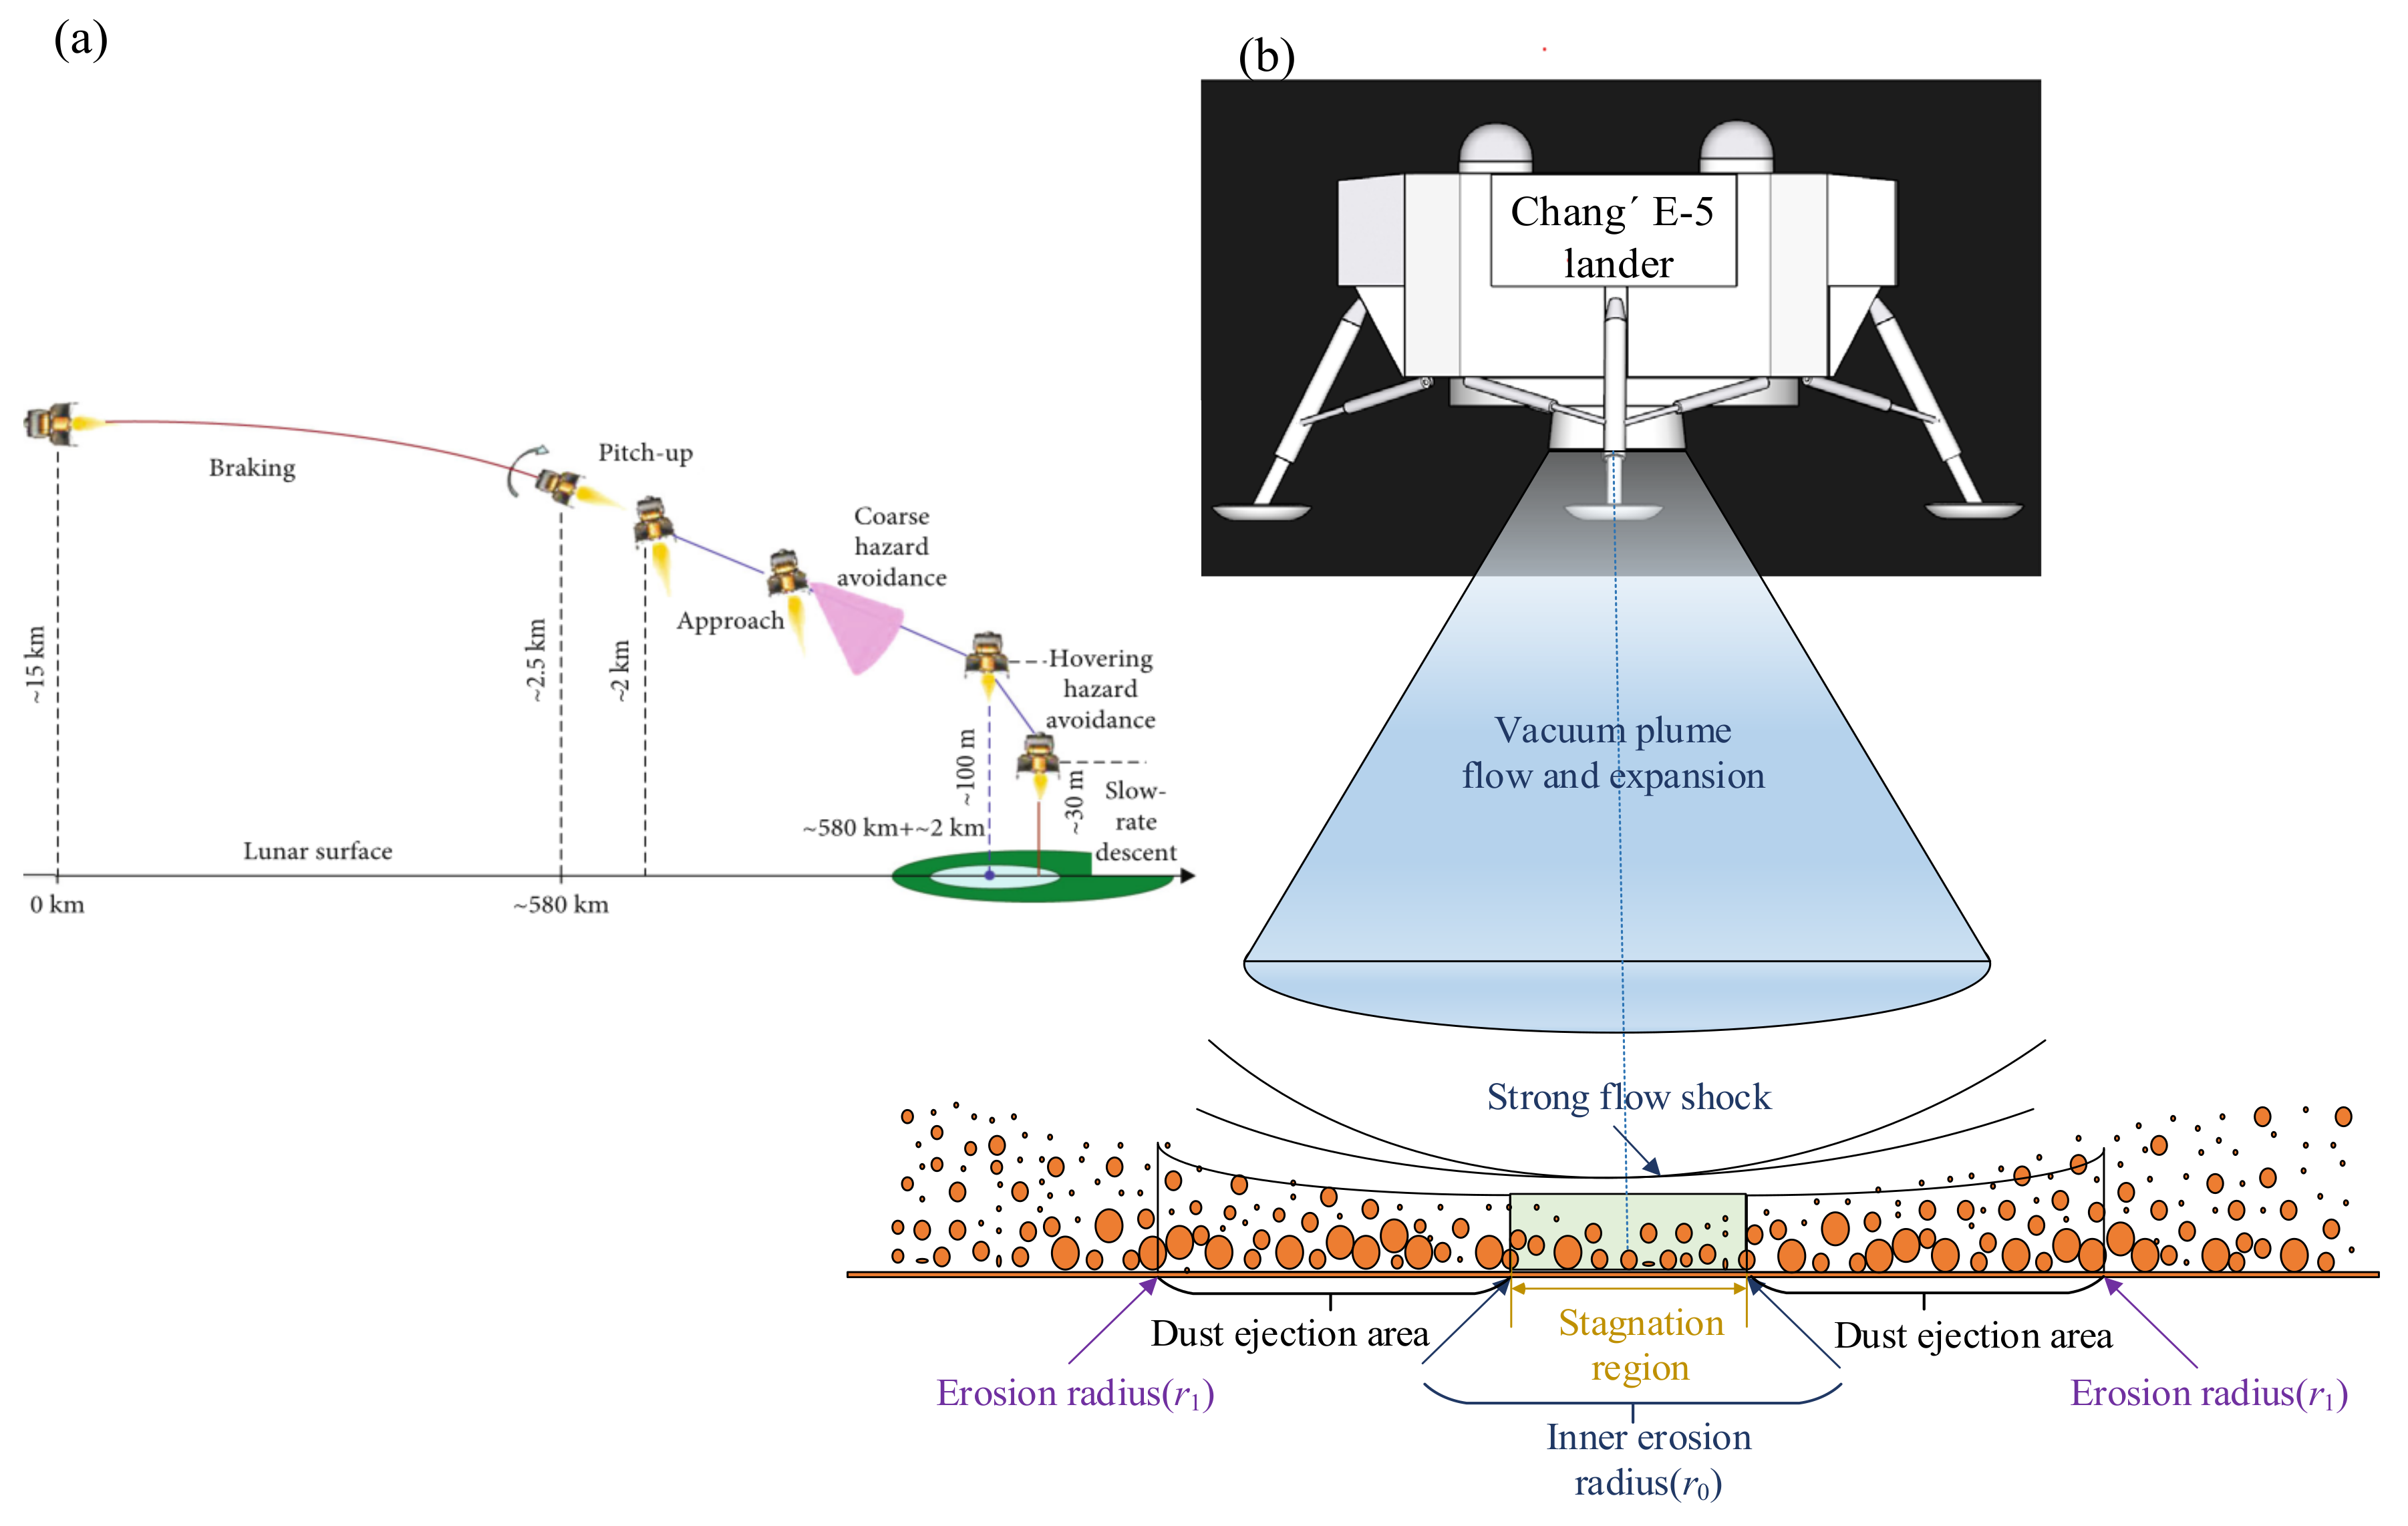
For a specific nozzle height, lunar regolith not only has an inner erosion radius (r0), but also has an erosion radius (r1), which was introduced in Figure 1. The r0 was introduced in Table 2. In the Chang’E-4 mission, we find that the shear stress and pressure of the plume at r0 obtained by simulation satisfy Equation (11) when the landing photos illustrate r0 [26]. Therefore, the same method is adopted to calculate the lunar regolith critical shear stress τ* in this study, which can be obtained by
τ * = 0.253 + P tan 0.714 °
Figure 6 presents the
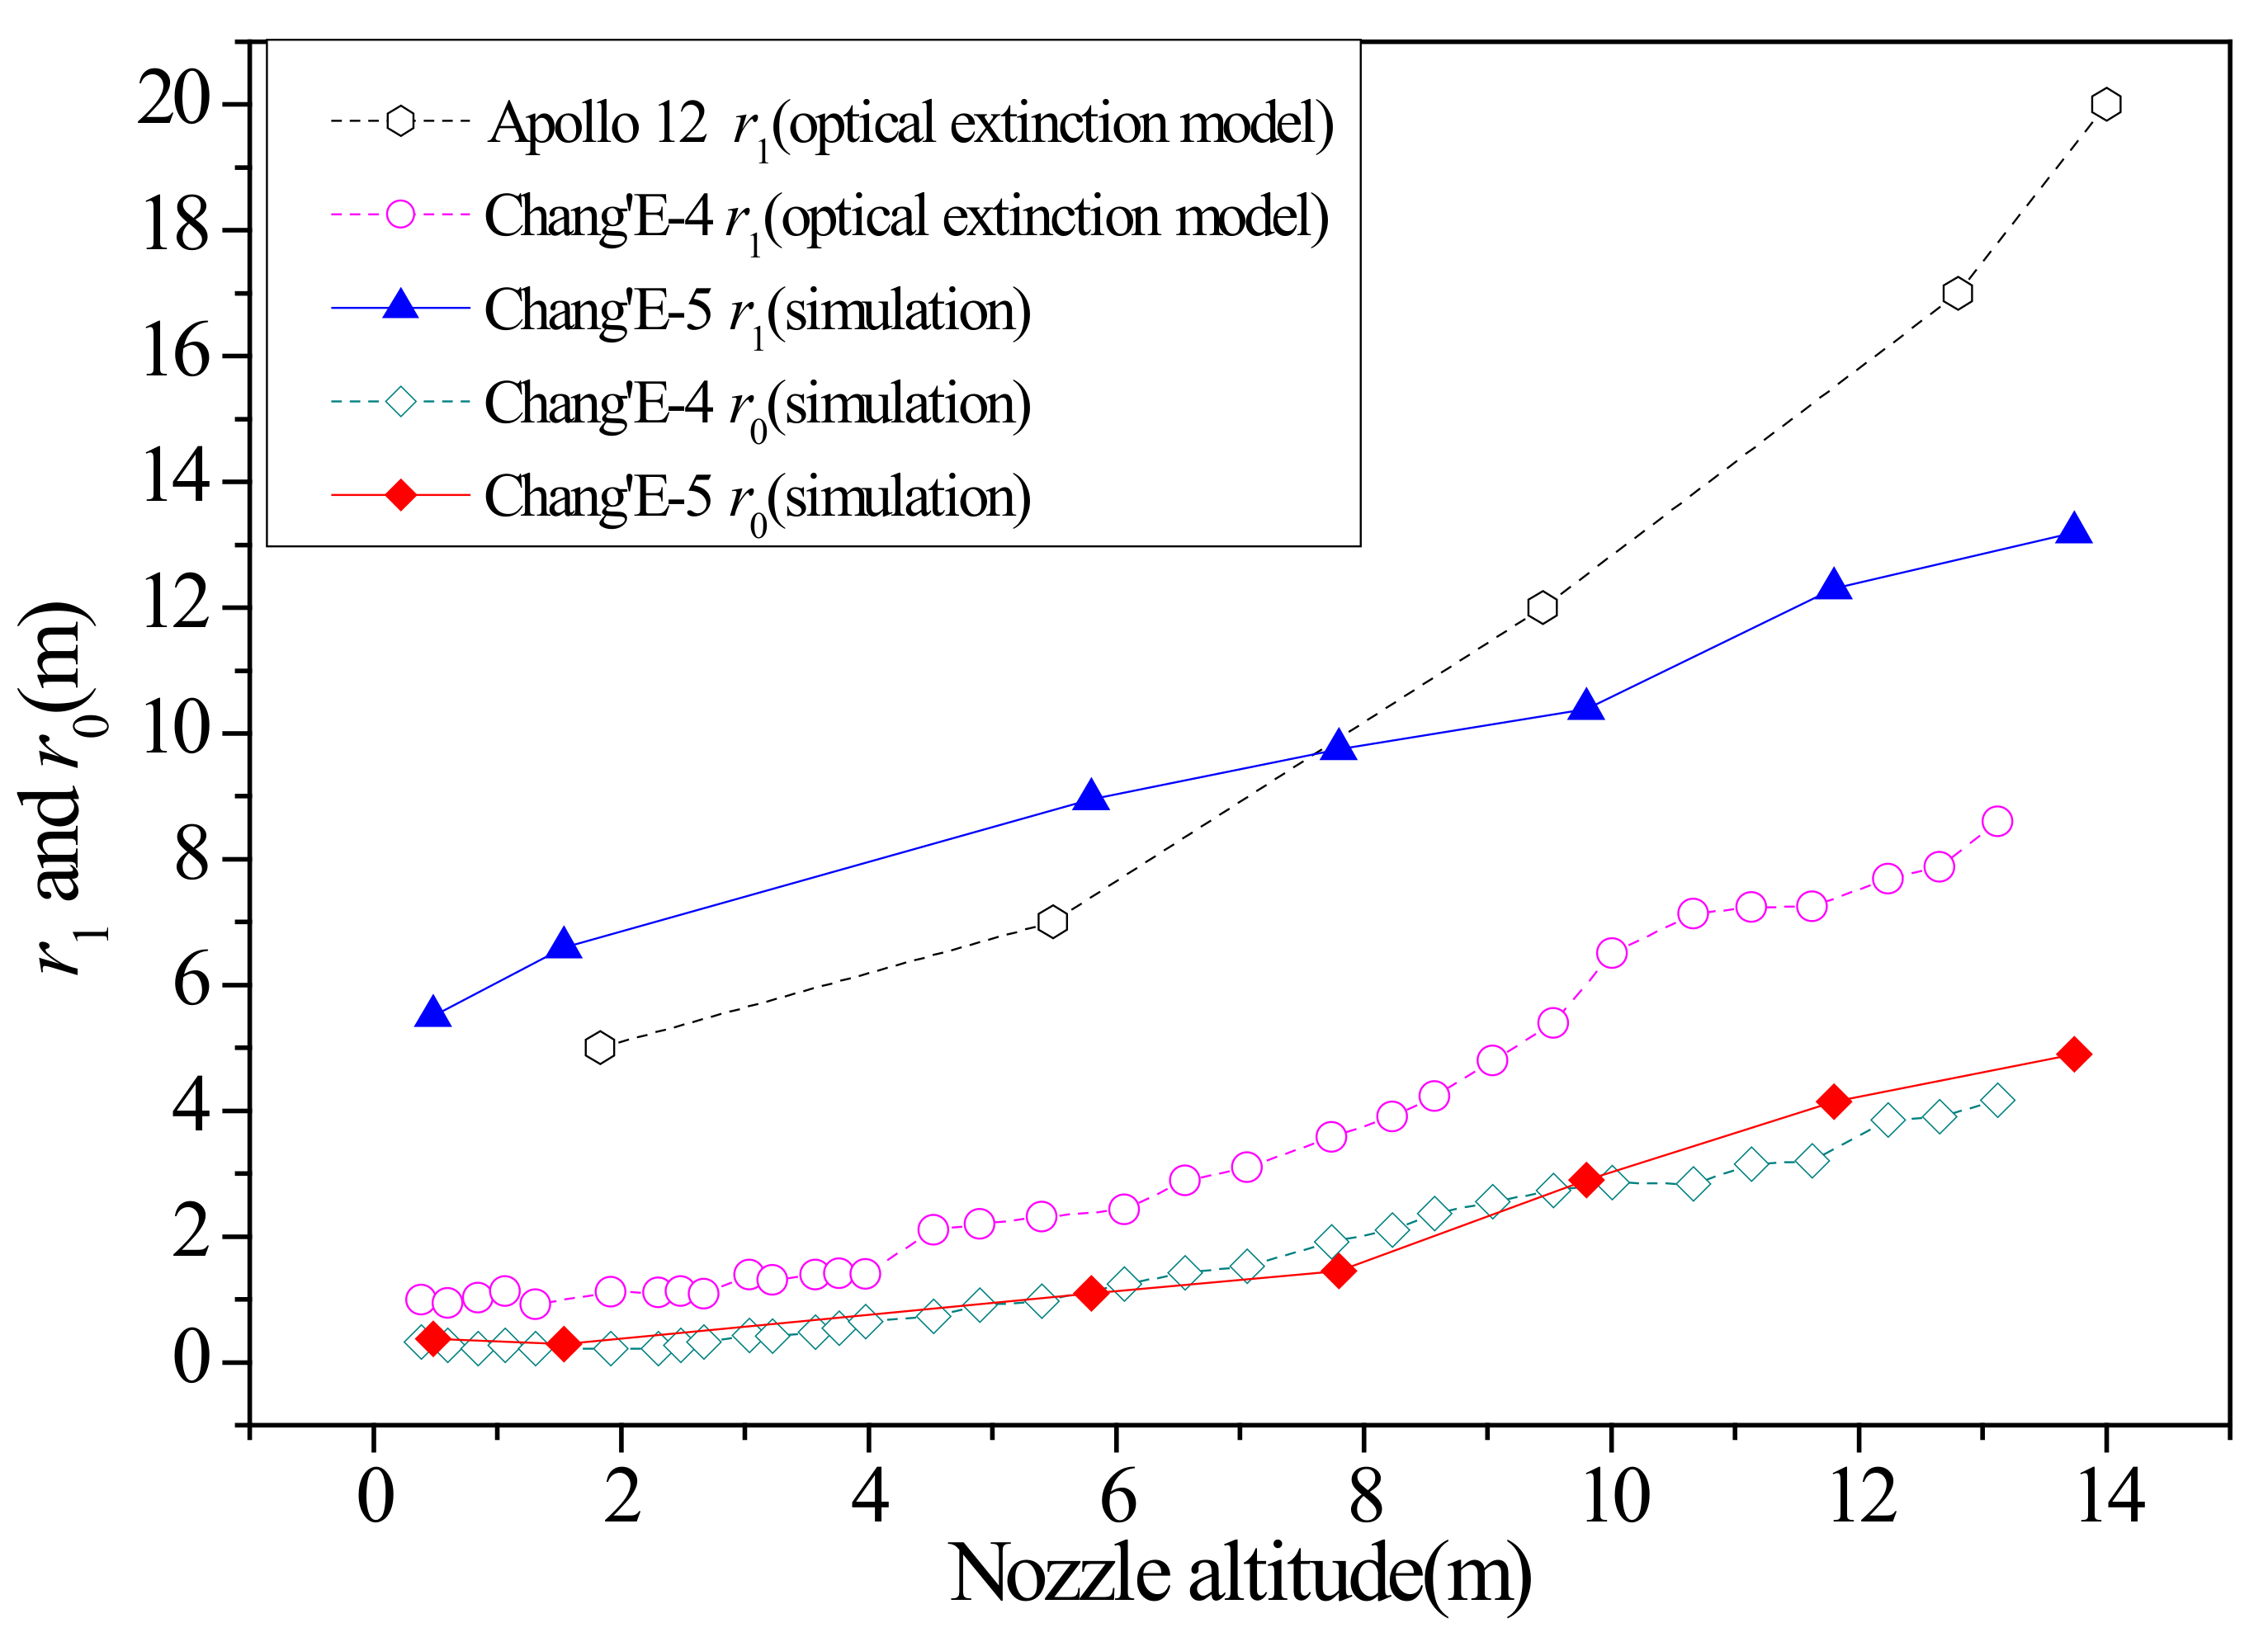
 r0 and the r1 at different nozzle altitudes for the Apollo 12 mission, the Chang’E-4 mission, and the Chang’E-5 mission. The r1 of the Apollo 12 mission and the Chang’E-4 mission shown in Figure 6 result from landing photos’ analysis (optical model), but the r0 of the Chang’E-4 mission and the r1 of the Chang’E-5 mission are calculated using this simulation. It can be seen that the r0 in the Chang’E-4 and Chang’E-5 missions are similar, because the τ* is obtained using the same Mohr–Coulomb failure criterion. In addition, the nozzle geometry is the same, and the final thrust for the two missions (Chang’E-4 = 2200 N and Chang’E-5 = 2900 N) differ only slightly, which may also be the reason for their similar r0. In the Apollo 12 mission, the r0 was not calculated. However, the r1 for these three missions differ significantly. The r1 calculated for the Chang’E-4 and Chang’E-5 missions have the same variation trends, but different values. Compared to the Apollo 12 mission, the erosion radius is bigger when the nozzle altitude is less than 8 m, but is smaller when the nozzle altitude is more than 8 m. In reality, only part of r0 can be found via landing photo observation (only part of the nozzle altitude is visible). To obtain the r0 at all erosion altitudes, we use the partial r0 to find a suitable Roberts erosion model, then calculate all r0 using simulation results. However, r1 is not visible in the landing photos; it has to be calculated based on an optical extinction model or the Roberts erosion model. The two models lead to different results. The Roberts erosion model has a bigger r1 because this model contains two types of erosion dust (dust particles ejecting towards lunar space and dust particles moving on the lunar surface); the optical extinction model only uses the dust particles ejecting towards lunar space.
According to Equations (12) and (13), it can be known that a is an integrative parameter influencing the dust erosion rate. Combining plume parameters and lunar dust density (3195.2 kg/m3) in the Chang’E-5 mission [32], the relationship between a and dp at different nozzle altitudes is shown in Figure 7a, and the relationship between a and nozzle altitude at different dp is shown in Figure 7b. From Figure 7a,b it can be seen that dust with a larger diameter has small a, indicating that larger dust will have a smaller velocity gain for a specific nozzle altitude. However, for a specific particle diameter, a increases as nozzle altitude increases. Using such variations, the mass erosion rate and crater depth variation with nozzle altitude of the Chang’E-5 mission are calculated based on Robert’s erosion model, which are shown in Figure 7c,d, respectively. The lower the nozzle altitude, the bigger the mass erosion rate. For example, the maximum erosion rate is approximately 0.6 kg/m2·s when the altitude is 1.54 m, but it is approximately 0.2 g/m2·s when the altitude is 13.74 m. The crater depth of the Apollo mission is much bigger than that of the Chang’E-5 mission. The deepest location of the Apollo mission is approximately 1.8 m from the nozzle centerline, with a crater depth of approximately 1.3 cm; however, the deepest location is approximately 3.5 m from the nozzle centerline of the Chang’E-5 mission, with a crater depth of approximately 0.2 cm. The difference in the craters’ deepest location is mainly a result of thrust (Apollo 12 = 13.3 KN), nozzle landing trajectory, and the calculated model. A larger thrust results in less expansion of the plume’s inner region, and the plume deviates less. In the Apollo mission, the engine landing trajectory is not vertical, but inclined, making the crater center close to the nozzle centerline. In addition, the erosion model (Chang’E-5 mission) has a larger erosion range than the optical extinction model (Apollo 12 mission), because this model considers the ejected dust particles moving along the lunar surface. The difference in crater depth mainly depends on thrust and landing time. For the Apollo 12 mission, the entire erosion timespan is approximately 60 s at the three nozzle altitudes, with a final thrust of 13.3 kN. However, for the Chang’E-5 mission, the entire erosion timespan is approximately 7 s at the six nozzle altitudes, with a final thrust of 2900 N. Finally, the total erosion mass for the Apollo 12 mission and the Chang’E-5 mission is 2600 kg (optical extinction model) and 335.95 kg (simulation), respectively.
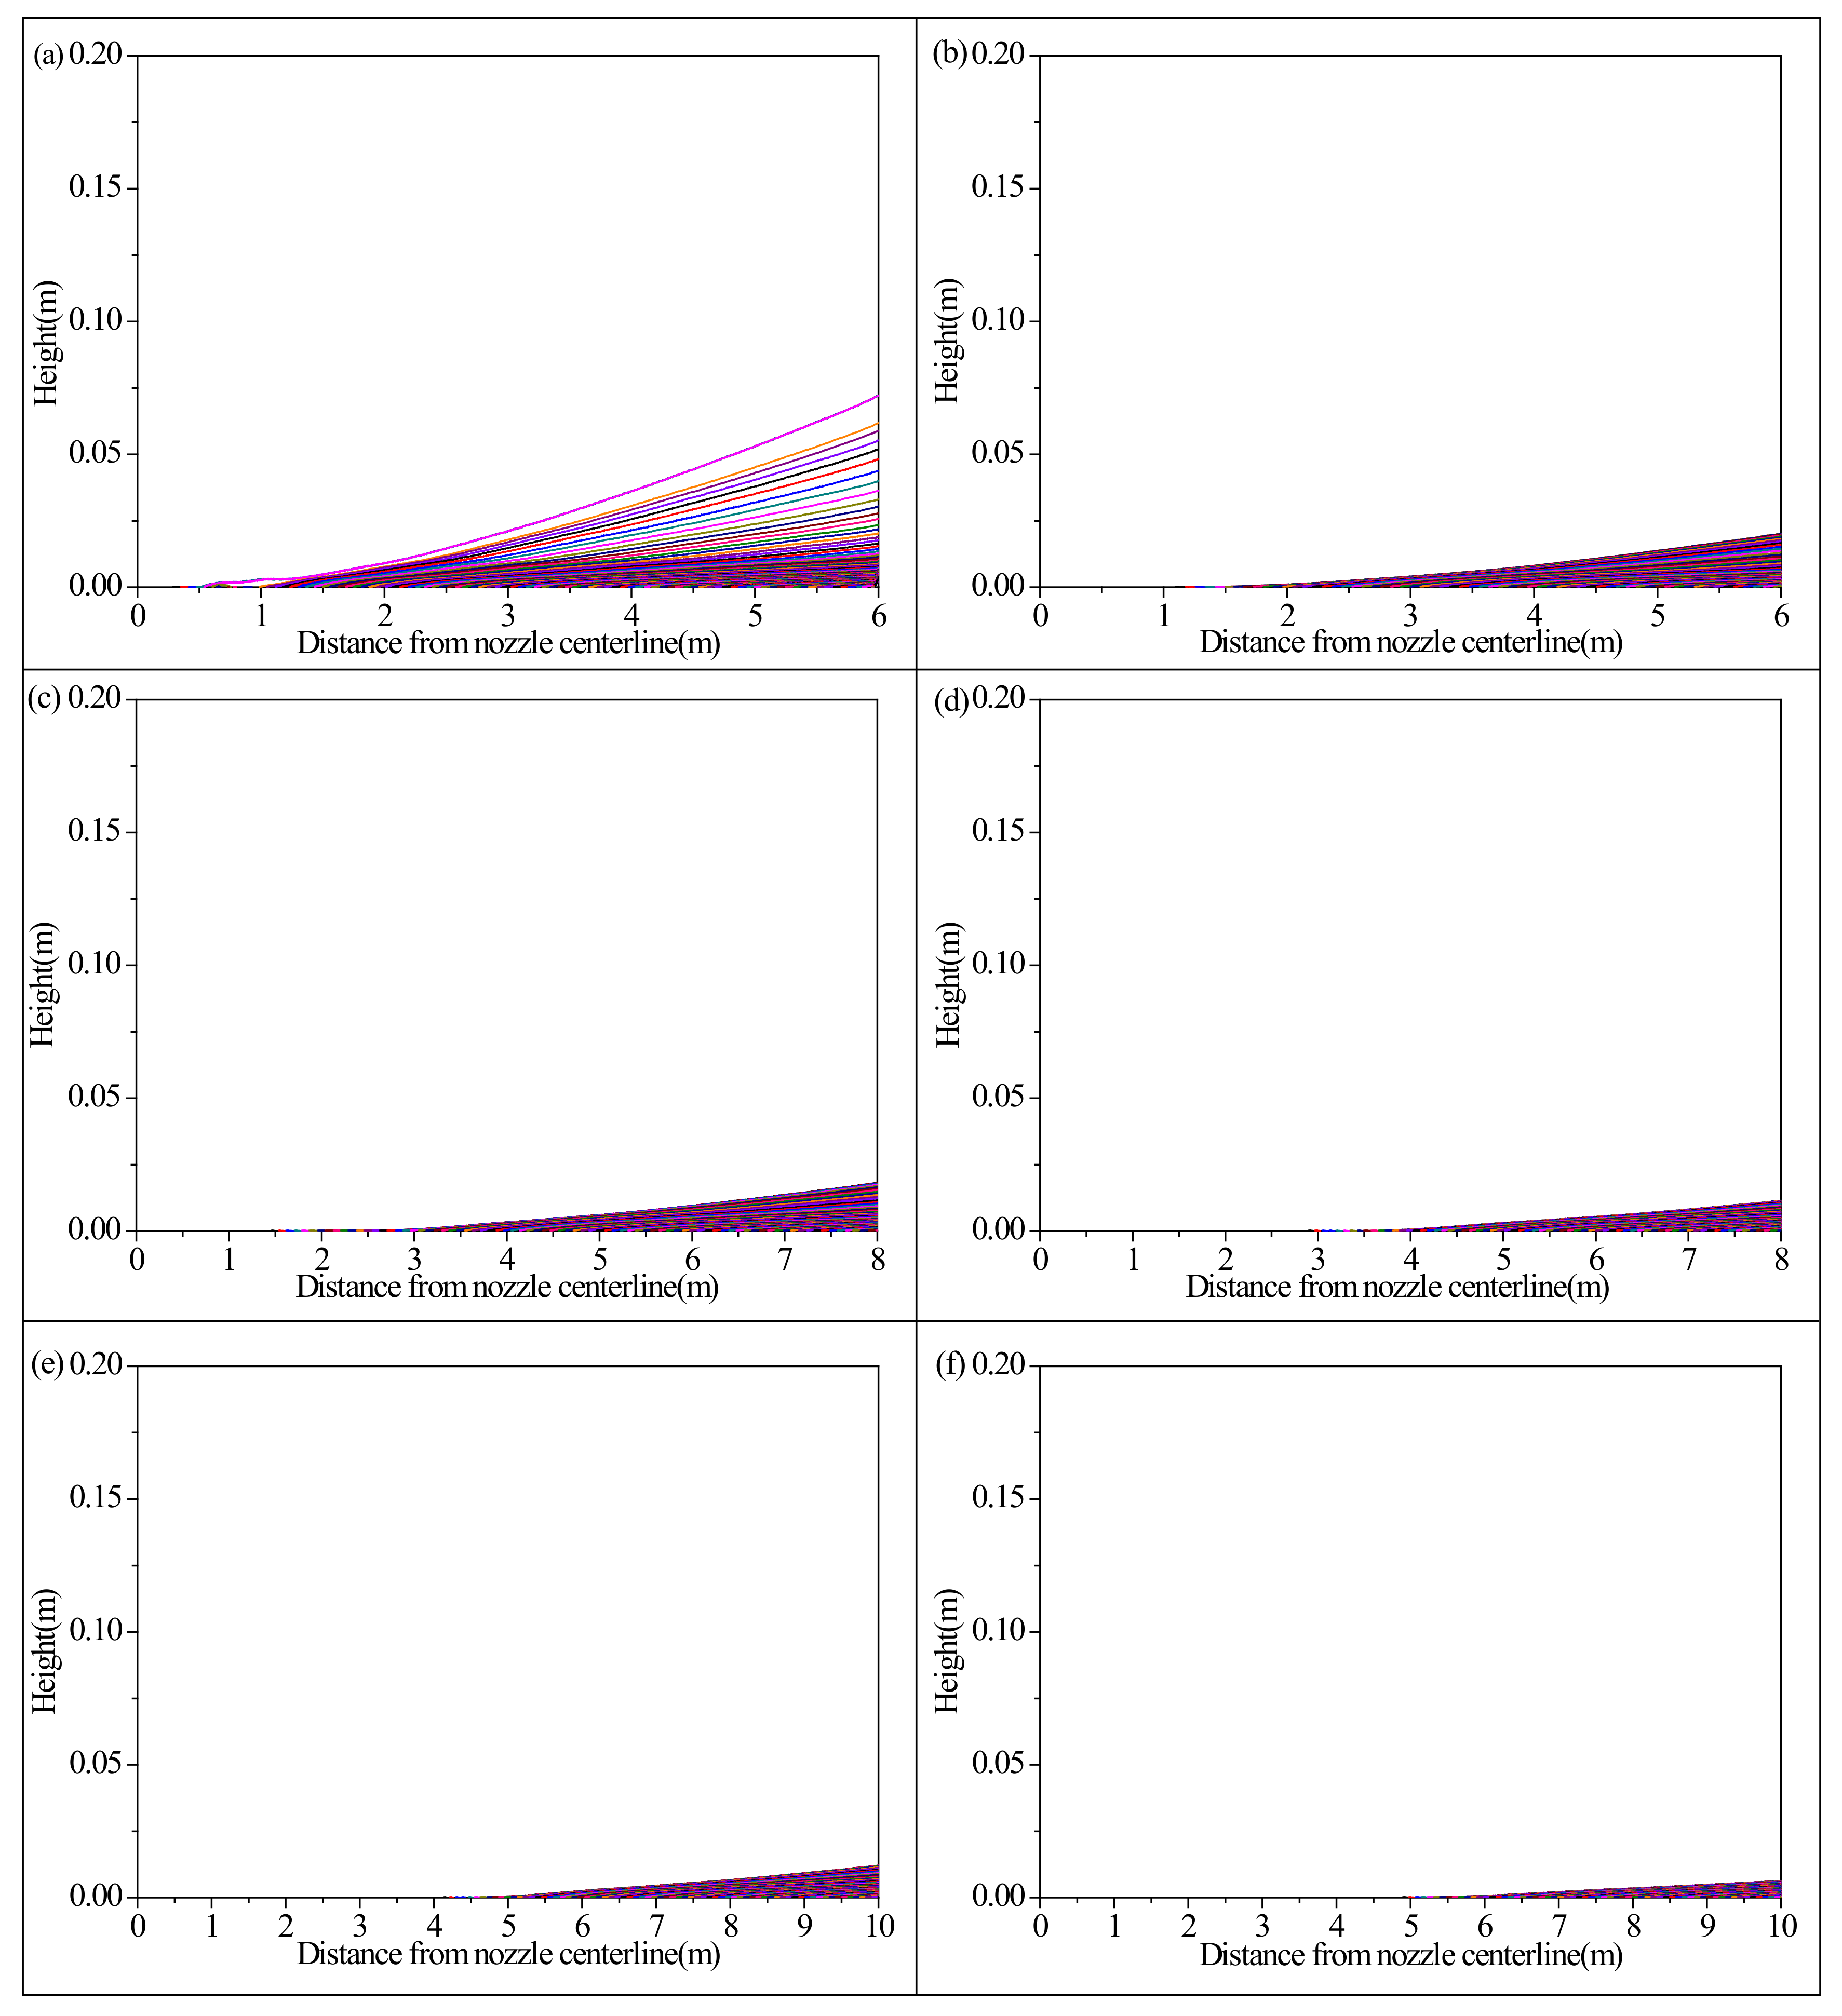
Figure 8 illustrates the 4.84 μm dust particles’ trajectories at different nozzle altitudes. The simulated particles are all injected at the six altitudes. However, the difference is that the higher the nozzle altitude, the lower the particles are, which is reasonable, due to a smaller shear stress at a higher altitude. The particles are blown away in the radical direction, and are finally no longer visible in the landing photo. The injected height for 1.54 m is much higher than for other distances, and thus the particles’ inclined angle is much larger as well.
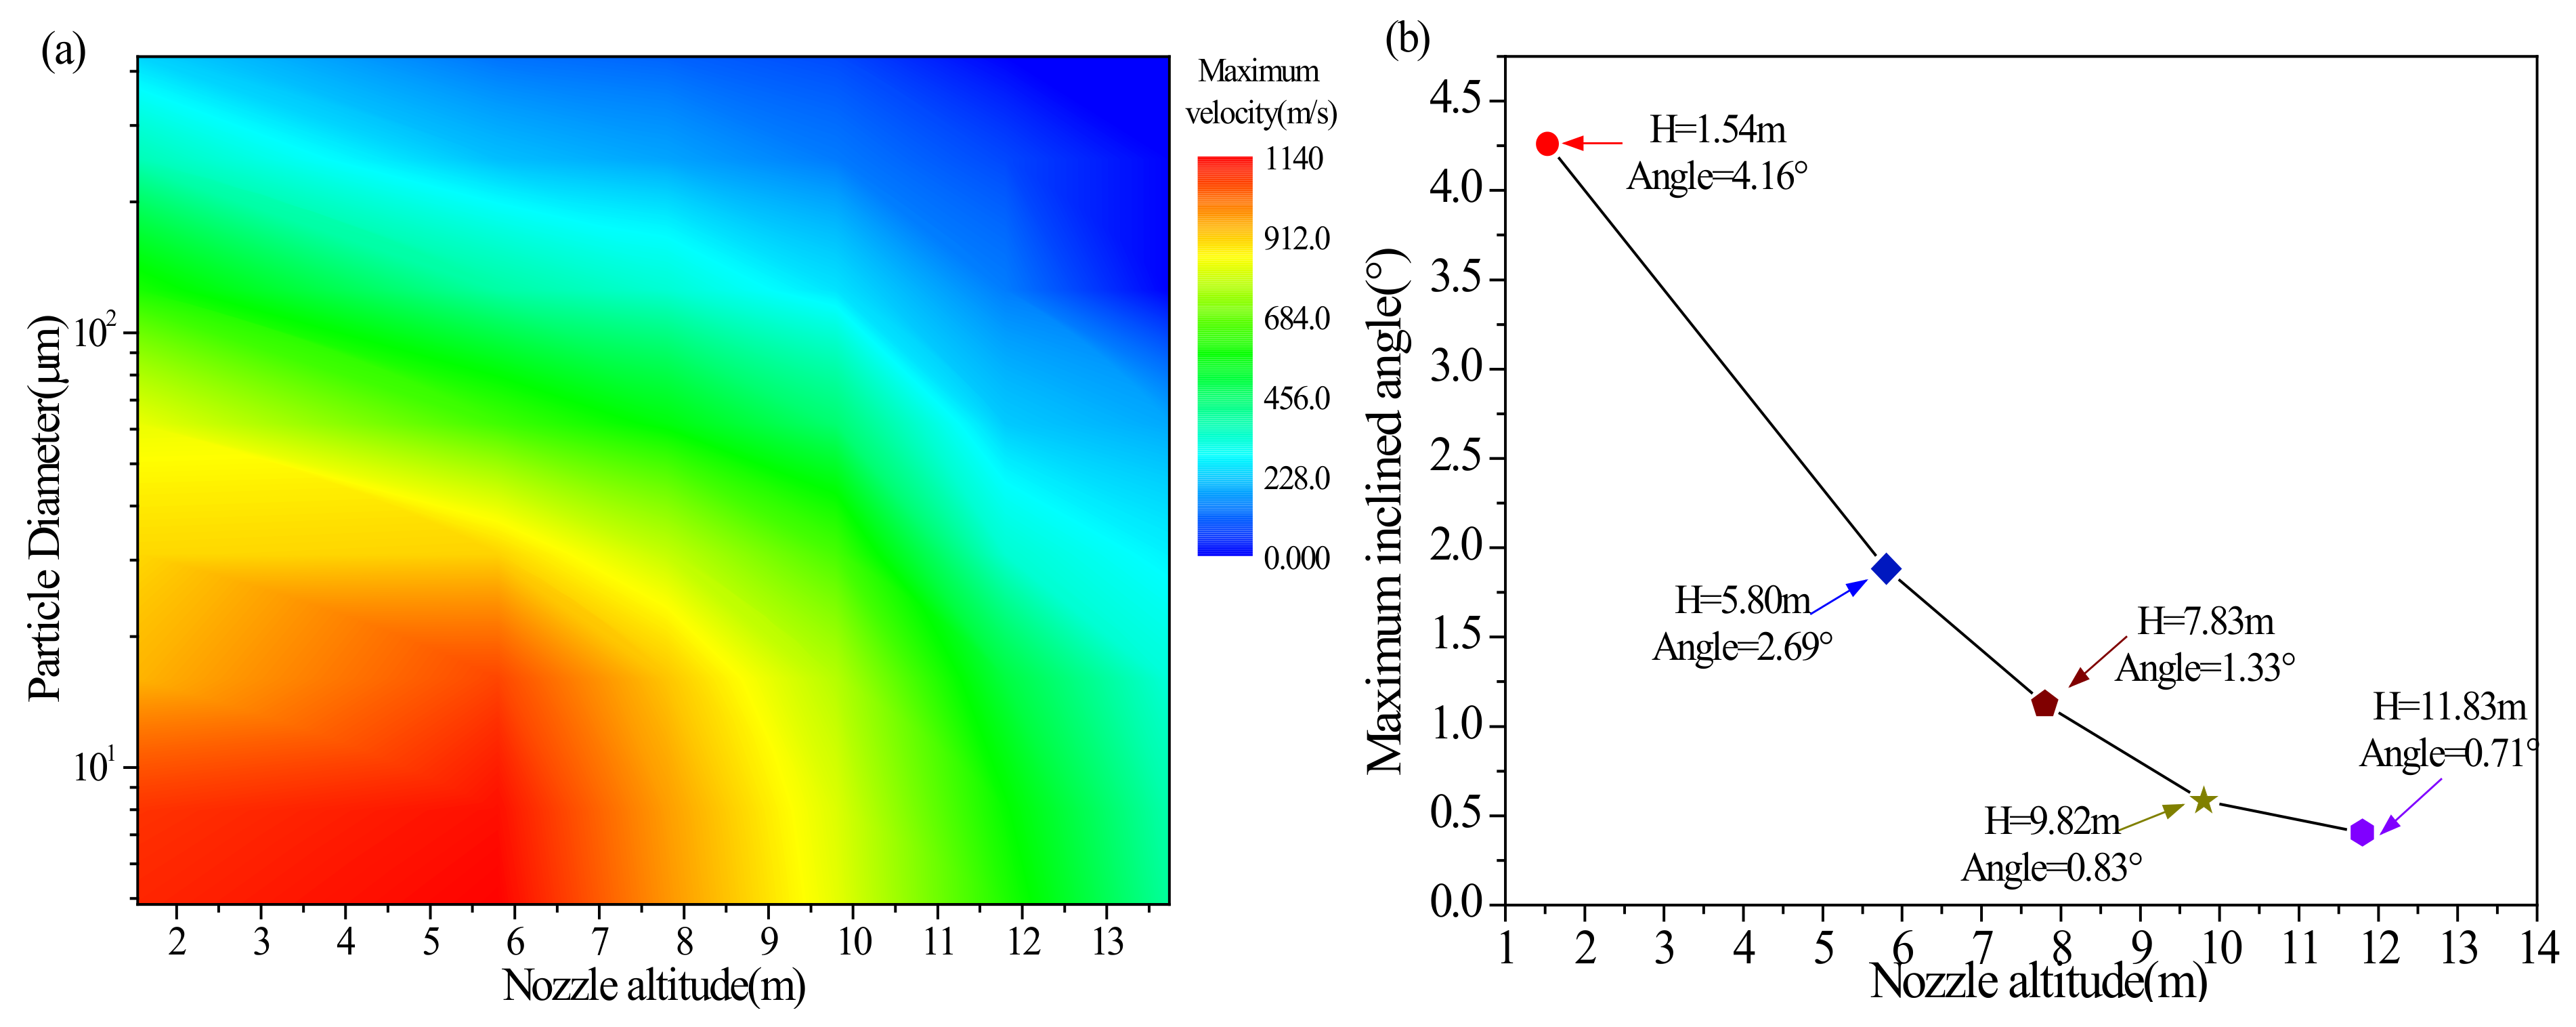
In addition to flat lunar surface erosion properties, single particle trajectory and velocity modeling (noted in Section 2) are also key points to investigate, based on CFD simulations of the Chang’E-5 mission. The maximum velocity distribution for particles with different diameters at different nozzle altitudes is described in Figure 9a, where the maximum velocity in the entire erosion process is 1140 m/s, which is less than the escape velocity. As predicted by previous investigations, the smaller the particle diameter is, the easier it will be to dislodge upwards and obtain a higher velocity. Therefore, as in the Apollo mission, all particles with a diameter above 1µm will not reach escape velocity. It is worth noting that the inclined angle is measured from the horizontal plane (x-y plane). Dust particles’ maximum inclined angles within the landing photo boundary at different nozzle altitudes are shown in Figure 9b, indicating that the maximum inclined angle is less than 4.16° in the Chang’E-5 mission. The inclined angle rapidly decreases as nozzle altitude increases.

4. Conclusions

A variable-thrust engine plume acting on the lunar surface can induce a large amount of dust disturbance and surface erosion when it approaches the objective landing site. Although descent videos and landing images can provide valuable quantitative or qualitative information regarding the erosion process of a specific lunar landing mission, they are insufficient to offer enough erosion parameters to guide lunar dust pollution protection and astronauts’ safety for future long-term lunar exploration. Based on this, an accurate model to reveal the erosion process and dust ejection properties in a specific landing situation is necessary. Therefore, the present study builds a reliable simulation model through verification and constraint using ground experimental results and landing images’ information extracted from the Chang’E-5 mission. The plume flow field includes nozzle internal compressible flow and vacuum near-field plume gas flow using the Euler framework, but the particle ejection properties are calculated using discrete particle models within a Lagrangian framework. First, initial dust ejection altitude and landing time are obtained via landing images. Next, two-stage plume flow models are built to calculate the plume flow field. Following this, the shear stress Roberts erosion model is adopted to simulate the surface erosion process. Our simulation shows that the erosion depth and total erosion mass during the Chang’E-5 landing are approximately 0.2 cm and 335.95 kg, respectively. Finally, through single dust velocity and trajectory analysis, we obtain the probable maximum inclined angle of 4.16° within the landing photo boundary at each nozzle altitude. The particle velocity and inclined angle in the Chang’E-5 mission are similar to those obtained for the Apollo 12 mission, but the erosion crater depth and total erosion mass are much smaller than that of the Apollo 12 mission; this is mainly the result of engine thrust differences during the dust ejection period (Apollo = 13.3 kN, Chang’E-5 = 2.9 kN). The flow velocity at the nozzle exit is similar for the Apollo mission and the Chang’E-5 mission, which results in similar particle ejection properties. These results show that a high-thrust engine can cause larger erosion mass, erosion depth, and erosion radius; however, the inclined angles and maximum velocities for dust particles are similar. These erosion results and erosion process parameters obtained on the Chang’E-5 mission provide important information about landing a low-thrust lander, which will benefit future lunar exploration.
In addition, the r0 and r1 of the Chang’E-5 mission are obtained. The r0 ranges from 0.38 m to 5.0 m, and the r1 ranges from 5.5 m to 13.0 m, which is similar to the r0 obtained for the Chang’E-4 mission (from 0.32 m to 4.17 m). The r1 calculated for the Chang’E-4 mission is smaller than that of the Chang’E-5 mission due to a smaller thrust (2200 N) and different calculation model (the Chang’E-4 mission adopts the optical extinction model based on landing photos, whereas the Chang’E-5 mission adopts the Roberts erosion model based on landing photos and simulation). We note that the dust that rolls along the lunar surface is also included in the erosion range calculation in this study. Another notable parameter is the lunar surface incline angle of the landing area, which may introduce substantial differences in erosion parameters. The fact that the lunar surface is horizontal on the Chang’E-5 mission was considered in this investigation. The mass flux in this study is much larger than that obtained by Golub et al. because the nozzle plume effects on the lunar regolith have a longer erosion time and stronger erosion strength than meteoroid impacts [36]. Furthermore, the dusty plasma environment is not included in this study, although it is important for dust lift [37]. The erosion phenomenon for nozzle plume is mainly induced by the two phase flow between nozzle plume gas and solid dust particles. However, the erosion phenomenon for meteoroid impacts is mainly induced by solid meteoroids with particular diameters and solid dust particles. In future work, more comprehensive improvements on the effect of local terrain will be made in this plume erosion model to reveal a more detailed physical process for this phenomenon, which may be very helpful for minimizing the hazards of lunar dust in future lunar exploration missions.

Author Contributions

H.Z.: Software, Investigation, Writing—Original Draft, Date curation, Validation, Funding acquisition. C.L.: Investigation, Writing—Review & Editing, Visualization, Resources, Project administration. J.Y.: Landing photo calculation, Date Curation. X.Z.: Investigation, Writing—Review & Editing, Visualization, Supervision, Funding acquisition. Y.W. (Yi Wang): Data Curation. L.C.: Resources. Q.F.: software. B.Z.: Resources. Y.W. (Yuming Wang). All authors have read and agreed to the published version of the manuscript.

Funding

This work received financial support from the National Natural Science Foundation of China (No. 42004157 and No. 41941001), the Science and Technology on Vacuum Technology and Physics (No. 6142207200202), the Natural Science Foundation of Gansu Province (No. 21JR7RA743), the Youth Talent Promotion Project of Gansu Province (No. GXH20210611-05), and the Science and Technology Development Fund (FDCT) of Macau (Grant numbers 008/2017/AFJ and 0042/2018/A2).

Institutional Review Board Statement

The study was conducted in accordance with the Declaration of Helsinki, and approved by the Institutional Review Board (or Ethics Committee).

Informed Consent Statement

Informed consent was obtained from all subjects involved in the study.

Acknowledgments

Scientific data of the Chang’E missions are provided by the China National Space Administration (CNSA). We are grateful for support from team members of the Ground Research and Application System (GRAS), who contributed to data receiving and preprocessing. The landing images used in this work are archived at http://moon.bao.ac.cn (accessed on 1 May 2022).

Conflicts of Interest

The authors declare that they have no known competing financial interests or personal relationships that could have appeared to influence the work reported in this paper.

References

  1. Katzan, C.M.; Jonathan, L.E. Lunar Dust Transport and Potential Interactions with Power System Components; No. NASA-CR-4404; National Aeronautics and Space Administration, Lewis Research Center: Cleveland, OH, USA, 1991. [Google Scholar]
  2. Wagner, S.A. The Apollo Experience Lessons Learned for Constellation Lunar Dust Management; NASA Technical Publication TP-2006-213726; National Aeronautics and Space Administration: Washington, DC, USA, 2006. [Google Scholar]
  3. Shen, Z. The survey of Apollo LM during the descent to the lunar surface. Spacecr. Recovery Remote Sens. 2008, 29, 11–14. [Google Scholar]
  4. Buhler, C. Experimental investigation of lunar dust impact wear for different grain sizes and impact angles. In Proceedings of the 2017 IEEE Conference, Big Sky, MT, USA, 4–11 March 2017; pp. 1–14. [Google Scholar] [CrossRef]
  5. Zupp, G.A. An Analysis and a Historical Review of the Apollo Program Lunar Module Touchdown Dynamics; Lunar and Planetary Institute, National Aeronautics and Space Administration: Houston, TX, USA, 2013; p. 605. [Google Scholar]
  6. O’Brien, B.J. Paradigm shifts about dust on the Moon: From Apollo 11 to Chang’e-4. Planet. Space Sci. 2018, 156, 47–56. [Google Scholar] [CrossRef]
  7. Colwell, J.E.; Robertson, S.R.; Horányi, M. Lunar Dust Levitation. J. Aerosp. Eng. 2009, 22, 2–9. [Google Scholar] [CrossRef]
  8. Renno, N.O.; Kok, J.F. Electrical Activity and Dust Lifting on Earth, Mars, and Beyond. Planet. Atmos. Electr. 2008, 137, 419–434. [Google Scholar] [CrossRef]
  9. Grün, E.; Horanyi, M.; Sternovsky, Z. The Lunar Dust Environment. Planet. Space Sci. 2011, 59, 1672–1680. [Google Scholar] [CrossRef]
  10. Zakharov, A.V.; Zelenyi, L.M.; Popel, S.I. Lunar dust: Properties and potential hazards. Solar Syst. Res. 2020, 54, 455–476. [Google Scholar] [CrossRef]
  11. Farr, B.; Wang, X.; Goree, J.; Hahn, I.; Israelsson, U.; Horányi, M. Dust mitigation technology for lunar exploration utilizing an electron beam. Acta Astronaut. 2020, 177, 405–409. [Google Scholar] [CrossRef]
  12. O’Brien, B.J. Review of measurements of dust movements on the Moon during Apollo. Planet. Space Sci. 2011, 59, 1708–1726. [Google Scholar] [CrossRef]
  13. O’Brien, B.J. Direct active measurements of movements of lunar dust: Rocket exhausts and natural effects contaminating and cleansing Apollo hardware on the Moon in 1969. Geophys. Res. Lett. 2009, 36. [Google Scholar] [CrossRef]
  14. O’Brien, B.J.; Hollick, M. Sunrise-driven movements of dust on the Moon: Apollo 12 Ground-truth measurements. Planet. Space Sci. 2015, 119, 194–199. [Google Scholar] [CrossRef]
  15. Zhang, H.; Wang, Y.; Chen, L.; Zhang, H.; Li, C.; Zhuang, J.; Wang, Y.; Yang, S.; Li, X.; Wang, W. In-situ lunar dust deposition amount induced by lander landing in Chang’E-3 mission. Sci. China Technol. Sci. 2020, 63, 520–527. [Google Scholar] [CrossRef]
  16. Li, D.; Wang, Y.; Zhang, H.; Zhuang, J.; Wang, X.; Wang, Y.; Yang, S.; Sun, Z.; Wang, X.; Chen, L.; et al. In situ measurements of lunar dust at the Chang’E-3 landing site in the northern Mare Imbrium. J. Geophys. Res. Planets 2019, 124, 2168–2177. [Google Scholar] [CrossRef]
  17. Donohue, C.M.; Metzger, P.T.; Immer, C.D. Empirical Scaling Laws of Rocket Exhaust Cratering. arXiv 2021, arXiv:2104.05176. [Google Scholar]
  18. Haehnel, R.B.; Dade, W.B.; Cushman-Roisin, B. Crater Evolution Due to a Jet Impinging on a Bed of Loose Particles. In Proceedings of the 11th Biennial Aerospace Division International Conference on Engineering, Science, Construction and Operations in Challenging Environments, Long Beach, CA, USA, 3–5 March 2008. [Google Scholar] [CrossRef]
  19. Metzger, P.; Lane, J.; Immer, C.; Clements, S. Cratering and Blowing Soil by Rocket Engines during Lunar Landings. In Lunar Settlements, 1st ed.; CRC Press: Boca Raton, FL, USA, 2010; pp. 551–576. [Google Scholar] [CrossRef]
  20. Morris, A.B.; Goldstein, D.B.; Varghese, P.L.; Trafton, L.M. Plume Impingement on a Dusty Lunar Surface. AIP Conf. Proc. 2011, 1333, 1187. [Google Scholar] [CrossRef] [Green Version]
  21. Morris, A.B.; Goldstein, D.B.; Varghese, P.L.; Trafton, L.M. Modeling the Interaction between a Rocket Plume, Scoured Regolith, and a Plume Deflection Fence. In Proceedings of the Thirteenth ASCE Aerospace Division Conference on Engineering, Science, Construction, and Operations in Challenging Environments, and the 5th NASA/ASCE Workshop on Granular Materials in Space Exploration, Pasadena, CA, USA, 15–18 April 2012; pp. 189–198. [Google Scholar] [CrossRef]
  22. He, X.; He, B.; Cai, G. Simulation of rocket plume and lunar dust using DSMC method. Acta Astronaut. 2012, 70, 100–111. [Google Scholar] [CrossRef]
  23. Lane, J.E.; Metzger, P.T.; Immer, C.D.; Li, X. Lagrangian Trajectory Modeling of Lunar Dust Particles. In Proceedings of the 11th Biennial ASCE Aerospace Division International Conference on Engineering, Science, Construction, and Operations in Challenging Environments, Long Beach, CA, USA, 3–5 March 2008. [Google Scholar] [CrossRef]
  24. Li, Y.; Ren, D.; Bo, Z.; Huang, W.; Ye, Q.; Cui, Y. Gas-particle two-way coupled method for simulating the interaction between a rocket plume and lunar dust. Acta Astronaut. 2019, 157, 123–133. [Google Scholar] [CrossRef]
  25. Metzger, P.T.; Smith, J.; Lane, J.E. Phenomenology of soil erosion due to rocket exhaust on the Moon and the Mauna Kea lunar test site. J. Geophys. Res. Planets 2011, 116. [Google Scholar] [CrossRef]
  26. You, J.; Zhang, X.; Zhang, H.; Li, C.; Xu, Y.; Yan, Q.; Yu, H.; Liu, J.; Li, Y.; Wang, Y.; et al. Analysis of plume–lunar surface interaction and soil erosion during the Chang’E-4 landing process. Acta Astronaut. 2021, 185, 337–351. [Google Scholar] [CrossRef]
  27. Zhang, H.; Li, J.; Wang, Z.; Guan, Y. Guidance Navigation and Control for Chang’E-5 Powered Descent. Space Sci. Technol. 2021, 2021, 1–15. [Google Scholar] [CrossRef]
  28. Rahimi, A.; Ejtehadi, O.; Lee, K.; Myong, R. Near-field plume-surface interaction and regolith erosion and dispersal during the lunar landing. Acta Astronaut. 2020, 175, 308–326. [Google Scholar] [CrossRef]
  29. Marsell, B. Crater Formation Due to Lunar Plume Impingement. In Proceedings of the 2nd Workshop for Lunar/Martian Plume Effects and Mitigation (No. KSC-2011-014), Merritt Island, FL, USA, January 2011. [Google Scholar]
  30. Wan, G.; Sun, G.; Xue, X.; Shi, M. Solids concentration simulation of different size particles in a cyclone separator. Powder Technol. 2008, 183, 94–104. [Google Scholar] [CrossRef]
  31. Li, C.; Hu, H.; Yang, M.-F.; Pei, Z.-Y.; Zhou, Q.; Ren, X.; Liu, B.; Liu, D.; Zeng, X.; Zhang, G.; et al. Characteristics of the lunar samples returned by the Chang’E-5 mission. Natl. Sci. Rev. 2022, 9, 1–13. [Google Scholar] [CrossRef]
  32. Reddy, R.K.; Joshi, J.B. CFD modeling of pressure drop and drag coefficient in fixed beds: Wall effects. Particuology 2010, 8, 37–43. [Google Scholar] [CrossRef]
  33. ANSYS FLUENT. User Manuals V14.0; ANSYS, Inc.: Canonsburg, PA, USA, 2012. [Google Scholar]
  34. Morsi, S.A.; Alexander, A.J. An investigation of particle trajectories in two-phase flow systems. J. Fluid Mech. 1972, 55, 193–208. [Google Scholar] [CrossRef]
  35. Morris, A.; Goldstein, D.B.; Varghese, P.L.; Trafton, L.M. Approach for Modeling Rocket Plume Impingement and Dust Dispersal on the Moon. J. Spacecr. Rocket. 2015, 52, 362–374. [Google Scholar] [CrossRef]
  36. Popel, S.I.; Zelenyi, L.M.; Golub’, A.P.; Dubinskii, A.Y. Lunar dust and dusty plasmas: Recent developments, advances, and unsolved problems. Planet. Space Sci. 2018, 156, 71–84. [Google Scholar] [CrossRef]
  37. Golub, A.P.; Popel, S.I. On the Fluxes of Dust Particles Detected near the Lunar Surface by the Chang’e 3 Lander. Sol. Syst. Res. 2021, 55, 389–397. [Google Scholar] [CrossRef]
Figure 1. The lander descent trajectory and erosion schematic: (a) the lander descent trajectory at different altitudes [27] and (b) the vacuum plume flow field associated with lunar surface erosion properties.
Aerospace 09 00358 g001
Figure 2. Plume flow simulation model: (a) Chang’E-5 nozzle geometry and (b) lunar vacuum flow simulation model.
Aerospace 09 00358 g002
Figure 3. The nozzle flow properties: (a) nozzle internal flow contour of velocity (left) and static pressure (right) and (b) nozzle exit plane flow properties.
Aerospace 09 00358 g003
Figure 4. Histogram parameters and nozzle altitude information from landing photos of the Chang’E-5 mission.
Aerospace 09 00358 g004
Figure 5. The velocity contours at different nozzle altitudes: (a) h = 1.54 m, (b) h = 5.80 m, (c) h = 7.83 m, (d) h = 9.82 m, (e) h = 11.83 m, and (f) h = 13.74 m.
Aerospace 09 00358 g005
Figure 6. The r1 and r0 of the Chang’E-4 and Chang’E-5 missions and the Apollo missions.
Aerospace 09 00358 g006
Figure 7. The parameter a, mass erosion rate, and crater depth of the Chang’E−5 mission.
Aerospace 09 00358 g007
Figure 8. The lunar dust particle trajectories at different nozzle altitudes: (a) H = 1.54 m, (b) H = 5.80 m, (c) H = 7.83 m, (d) H = 9.82 m, (e) H = 11.83 m, and (f) H = 13.74 m).
Aerospace 09 00358 g008
Figure 9. Lunar dust particle maximum velocity contour and inclined angle for different altitudes.
Aerospace 09 00358 g009
Table 1. Nozzle exit plane flow properties in Chang’E-5 and Apollo missions [21,35].
MissionMethodRadiusMaP (Pa)T (K)V (m/s)Thrust (N)
Chang’E-5Ground test0.40155.22170.02744.693218.562900
Simulation0.40154.93175.83802.323032.122900.84
ApolloGround test0.815.03296589299213,353
Simulation0.814.41418869304813,070
Table 2. Detailed landing photo description at the B stage.
Stage NameLanding PhotosDescription
Stage A Aerospace 09 00358 i001Photo number = 412
Nozzle altitude = 17.34 m
Time = −9 s
The last photo at A stage
Stage B Aerospace 09 00358 i002Photo number = 413
Nozzle altitude = 13.74 m
Time= −7 s
Initial dust ejection time
The first photo at B stage
Aerospace 09 00358 i003Photo number = 414
Nozzle altitude = 11.83 m
Time = −6 s
Aerospace 09 00358 i004Photo number = 415
Nozzle altitude = 9.82 m
Time = −5 s
r0 denotes the initial erosion position
Aerospace 09 00358 i005Photo number = 416
Nozzle altitude = 7.83 m
Time = −4 s
Aerospace 09 00358 i006Photo number = 417
Nozzle altitude = 5.80 m
Time = −3 s
Aerospace 09 00358 i007Photo number = 418
Nozzle altitude = 1.54 m
Time = −1 s
Final dust ejection time
The last photo at B stage
Stage C Aerospace 09 00358 i008Photo number = 419
Nozzle altitude = 0.48 m
Time = 0 s
The first photo at C stage
Publisher’s Note: MDPI stays neutral with regard to jurisdictional claims in published maps and institutional affiliations.

