Article

An Analysis of Fixed-Wing Stall-Type Accidents in the United States

Mechanical and Aerospace Engineering, Oklahoma State University, Stillwater, OK 74078, USA
Aerospace 2022, 9(4), 178; https://doi.org/10.3390/aerospace9040178
Submission received: 18 February 2022 / Revised: 11 March 2022 / Accepted: 22 March 2022 / Published: 24 March 2022
(This article belongs to the Section Aeronautics)

Abstract

:
Spin training has not been required for students working towards their private or commercial certificates for the past 70 years. Switching to a stall-prevention mindset within training aimed to make spin recovery unnecessary; however, stall-type accidents, consisting of stalls, spins, and spirals, still occur and are highly fatal. Although past studies have analyzed accidents, interviewed pilots at different levels, and made recommendations for changes in the industry, stall-type accidents are no less fatal now, at a fatality ratio of approximately 40–50% yearly. The research discussed in this paper aims to summarize and present accident stall-type statistics in aggregate over the past five decades and motivate future pilot- and training-centered research to address the high presence of stall-type accidents in aviation. Specifically, this article uses NTSB accident reports to answer the research question of whether there have been changes in the prevalence of spins among both fatal and non-datal fixed-wing accidents in the United States over the past sixty years. The methodology breaks down the accident analysis in three groups, based on the time period in which they occurred, due to differences in the reporting methods used. This paper finds that the prevalence and fatality ratio of stall-type accidents has remained high over the past six decades and that stall-type accidents are more than twice as fatal as an average accident. To remedy the high accident count, we recommend experimental ground and simulator-based training to improve pilot knowledge, skill, and performance.

1. Introduction

All pilots in training become familiar with the aerodynamics of stalls and proficient in how to recover from stalls before they become certified pilots. On their checkride, they have to demonstrate their ability to maneuver at slow airspeeds and enter and recover from power-on and power-off stalls. However, whereas for stalls they need to demonstrate skills, for spins they only have to demonstrate knowledge. Flight students are evaluated for “spin awareness” through their understanding of the aerodynamics associated with spins, causes of a spin, identification of the three phases of a spin (entry, incipient, and developed), and spin-recovery procedures [1].
The Federal Aviation Administration (FAA) eliminated the spin training requirement from the private pilot syllabus in 1949, citing a high presence of stall/spin accidents in training flights [2]. Spin accidents remain highly fatal, but recent research has not focused on the human performance behind these accidents. Research in the 1970s tried to uncover the weaknesses in flight training and recommend improvements [2], after the NTSB issued a safety recommendation asking that “directed research and development, improvement, and innovation with respect to design as well as to pilot’s training and educational curricula are necessary if the stall/spin enigma is to be adequately resolved” [3]. In more recent years, we have transitioned to research on the aircraft flight dynamics of spins, automated spin recovery and spin-resistant aircraft design, and the aircraft certification process in response to spins [4,5,6,7,8]. However, homebuilt aircraft, which are subject to a different certification process, are highly involved in accidents occurring as a result of causes related to aerobatic maneuvers [9], suggesting that changes in technology and certification may not completely solve the problem.
In the meantime, stalls and spins continue to contribute to General Aviation (GA) Loss of Control-Inflight (LOC-I) accidents. LOC accidents are a major type of transport aircraft accidents [10], and in an analysis of 126 Part 121 operations accidents most LOC accidents were a result of inappropriate crew input rather than vehicle failure [11]. In another study of upset and LOC events in transport aircraft, aerodynamic stalls made up for most accidents (36%) and fatalities (26%) out of all causes in the set analyzed [10]. Lack of recent flying experience due to the cost of flying or weather may also result in increased LOC accidents [12].
With the demand for flights and airline pilots continuously increasing, we can expect that more people will be going through flight training and eventually becoming the ones providing the flight training while building time for their careers. More flight hours will unavoidably be accompanied by more accidents, and with spins being so fatal, unfortunately, more deaths. Although private pilots are not required to have ever experienced a spin, the FAA still requires spin recovery demonstration or proof that they have gone through spin training (through a spin endorsement) for certification at the Certified Flight Instructor (CFI) level [13]. The FAA issued an advisory circular that outlines the stall/spin awareness ground and flight training recommended for pilots [14]. However, a lot of pilots may not experience a spin recovery in practice until their CFI training, if they even choose to pursue flight instructor certification. Veillette did a survey-based study in 1993 comparing the spin training requirements and success in military and civilian training [15]. He reviewed past recommendations and whether they have been applied in the industry and administered a survey among military and civilian pilots, flight instructors, and designated pilot examiners (DPEs) to test their awareness and knowledge of spins. Military pilots, both students and instructors, demonstrated good working knowledge of spins, but civilian pilots, even DPEs and instructors, demonstrated poor to average knowledge. Additionally, flight instructors who aspired to become airline pilots performed more poorly than those who had different goals for their aviation careers [15].
While the results should have been impactful, and despite decades having passed since the study, Veillette’s recommendations remain unimplemented. Research on heavier aircraft has identified similar opportunities in simulators through Upset Prevention and Recovery Training (UPRT) [16]. With human error accounting for 60–80% of mishaps yearly [17], it is important to address the human factors of the problem alongside the aircraft and flight deck design improvements, especially because aircraft owners and operators fly and maintain an aging fleet. Surveyed pilots and flight instructors in Veillette’s study reported using popular periodicals and relying on their own flight instructors for information and knowledge on spins [15].
Addressing weaknesses and enhancing spin training has the potential of saving airframes and the lives of pilots and their passengers. However, any future policy with regard to spins, whether on flight training or aircraft certification, will have to be data-driven. The sparse research on human performance in spin situations has left us with deficiencies in accident statistics over time. This paper aims to do a comprehensive analysis of all fixed-wing spin-related accidents in the United States, building on [18]. The NTSB has maintained accident information databases dating back to as early as 1962 [19]. Researchers in the past have used the NTSB database for various applications. Retrieving information and statistics from the database has resulted in improved knowledge on the use of medication among pilots [20,21,22] and an understanding of accident causation [23,24,25]. Others have developed accident-causation models to model or visualize the accidents in the database and the event sequences that precede the accident, for example, with a state-based accident model [26] or a Bayesian network model [27]. Qualitative analyses have used text mining to classify aviation accidents and develop knowledge [28,29,30,31,32].
In this paper, we analyze and present the information on spin-related accidents over the past sixty years. Specifically, we look at trends in the prevalence of such accidents, their severity and fatality record, and events associated with them. We query the NTSB accident database for accidents that fulfill inclusion criteria described in Section 2. Section 3 describes the results of the analysis to answer the research questions for this paper: (1) have spin-related accidents decreased over the years (due to either advancements in technology/airframes or training)? and (2) have spin-related accidents become less fatal over the years?

2. Materials and Methods

The NTSB has maintained records of accidents involving civil aircraft since it was formed. Each accident or incident that the NTSB investigates results in a summarized narrative of the event in textual form, as well as coded information that describes “the aircraft, operations, personnel, environmental conditions, consequences, the probable cause, and contributing factors” of the event [19].
Researchers have historically used the NTSB accident database extensively for analyses of U.S.-based aviation accidents and have also added to its capabilities through accident modeling and statistical inference methods [26,27,33,34,35,36,37]. These researchers provide information on how the NTSB accident database works. This paper will summarize the tables and information in the database to the level necessary to reproduce the work. All the coded information and key findings are cataloged in relational databases. The NTSB uses three relational databases; the first database covers accidents from 1962 through 1981 (pre–1982) and the newer database includes accidents since 1982 (post–1982). The data is stored in two different databases because of the changes in the schema used between the two time periods. While all accidents post-1982 are stored in the same relational database, the NTSB changed coding manuals in 2008, changing the way accident events are coded and named [26,35,37]. Because of the varying schemas, we will also present the analysis in this paper in three parts, corresponding to the three different schemas: 1962–1982, 1982–2008, and 2008–present.
In this analysis we included NTSB-reported accidents that involved US-registered fixed-wing aircraft. Overall, we excluded incidents for consistency because the NTSB only investigates some incidents (but all accidents). We discuss exclusion criteria that are specific to one sub-database in the appropriate subsection.

2.1. Accidents Prior to 1982 (1962–1981)

The pre-1982 database codes the “accident type” for each accident record, with codes for stall, stall/spin, stall/spiral, and stall/mush. While data are available for some accidents in 1962 and 1963, the NTSB records are incomplete. Those two years were therefore excluded from any trends.
In this first sub-database, the NTSB includes codes for the Accident/Incident Class and the Aircraft Type, which are useful for filtering events. We set the Accident/Incident Class code to Accident-U.S. Reg. Aircraft and the Aircraft Type code to Fixed Wing, which reduced the number of records for this time frame from 87,039 to 80,560.
This database includes a maximum of two type codes per accident or event. Table A1 in Appendix A lists the different possible codes and their associated meaning. The codes that are relevant to this research are Q, Q1, Q2 and Q3: Stall, Stall/spin, Stall/spiral, and Stall/mush. We therefore only include all accidents that have one of the four stall-related codes as one of their two accident types. Spins, spirals, and mush are what can happen after a stall is initiated, i.e., after the aircraft’s wing exceeds its critical angle of attack. Depending on factors such as control surface deflection and power at the time of the stall, the aircraft can “mush” and start descending, enter a spin, or enter a spiral. In this first iteration of the database, the NTSB included enough resolution in the accident type codes to differentiate between the different results of the stall.

2.2. Accidents between 1982 and before 2008

The second database schema is more complicated than the single-table approach of the early days. The NTSB switched to using multiple tables combined through common identifiers rather than having all information in tabular format, allowing accidents to be coded with more detail. Another advantage of the new schema is that it makes it easier to include accidents that involve multiple aircraft and/or multiple contributing factors and events. In this research, we focus on the events, aircraft, and sequence of events tables.
Although the new schema adds some resolution to the accident information, the changes in how events are coded make it difficult to maintain consistency in the results of the three timeframes. For example, the database for the first period included a variable for the aircraft type that made it easy to segregate “fixed wing” accidents. The new format also includes a variable for aircraft category, but it adds more aircraft type information to describe the involved aircraft: airplane, balloon, blimp, glider, gyrocraft, helicopter, powered-lift, ultralight, powered parachute, weight shift, and unknown. To keep the types of accidents included consistent, we include all aircraft types that would constitute a “fixed wing aircraft;” airplanes, gliders, and ultralights. Both ultralight and unknown aircraft types resulted in no accidents in the database.
This second schema expands the “accident types” from Table A1 in Appendix A through 1598 different subject codes, which are considered “findings” from the accident investigation. The subject codes are used to identify what contributed to the event’s occurrences and are used in conjunction with other codes (modifiers and cause/factor binary designators) to specify what happened. Each accident is described through occurrence codes, which characterize what physically happened to the aircraft, and each occurrence may have multiple subject codes depending on accident complexity to identify what led to the occurrence. For example, Table 1 shows the findings from a non-fatal accident in 1985 in Oklahoma involving a Cessna 150M with registration N187AR (NTSB Accident Number: FTW85LA303). The accident consisted of three occurrences in series: the aircraft suffered a non-mechanical partial loss of engine-power (Occurrence 354) followed by an in-flight collision with an object (Occurrence 220) and an in-flight collision with terrain or water (Occurrence 230). Each occurrence code is further explained by the combination of the subject and modifier codes. For example, the partial loss of engine power happened because (1) the weather (Subject 20000) was such that would enable carburetor icing to form (Modifier 2202) but (2) carburetor heat (Subject 22304), which would have potentially rectified the situation, was not selected (Modifier 3133) by the pilot (Person code 4000) because (3) the weather evaluation (Subject 24022) was not understood (Modifier 3130) by the pilot (Person code 4000). The NTSB has essentially developed their own dictionary and syntax that can be used to summarize accidents.
In this second period, the NTSB continued reporting the types of stall accidents (spins, spirals, mush, and unspecified stalls) using four different subject codes. Subject codes 24550, 24551, 24552, and 24553 mean “spiral,” “stall,” “stall/spin,” and “stall/mush”, respectively.

2.3. Accidents after 2008

The third schema is housed in the same relational database as the second period and has the same general structure. However, the NTSB changed the dictionary and syntax used to code accident findings. The events and aircraft tables remained the same; therefore, separating the fixed wing U.S.-registered aircraft worked similarly to the second schema described in Section 2.2. The differences only started becoming apparent in the events sequence table (not to be confused with the sequence of events table from the second schema).
In this last iteration of the coding dictionary, the NTSB uses six-digit occurrence codes to describe each event that happened in the accident. The first three-digit group indicates the phase of flight for the occurrence, and the second group refers to the event code. Lastly, the schema also includes a binary variable for each occurrence that identifies the event as a defining event. The NTSB reduced the resolution of the event description in this schema by combining all types of stalls into one code (xxx241—Aerodynamic Stall/Spin), which impacts the data analysis of post-2008 accidents. However, the introduction of a Findings table provides more detailed information on the events or decisions that contributed to the accident. Ten-digit finding codes consist of a series of five two-digit codes for category, subcategory, section, subsection, and modifier. Each finding is also assigned a variable to identify it as a cause or a factor in the accident.
Table 2 and Table 3 show the occurrences and findings of a 2018 fatal accident (NTSB Accident Number: MIA08FA038) as an example. The pilot of the Cessna 172 lined up with the wrong runway in Clearwater, Florida during approach (Phase of flight 500) and maneuvered abruptly (Event code 270) to correct his mistake. Following the abrupt maneuver, the aircraft entered an aerodynamic stall/spin (Event code 241). The aircraft transitioned into an uncontrolled descent (Phase of flight 650), during which it suffered a collision with terrain (Event code 470). The defining event of this accident was the aerodynamic stall/spin. The accident was caused by the lack of aircraft control by the pilot (Occurrence code 0206304044) and the proper aircraft airspeed not being maintained (Occurrence code 0106201020). A contributing factor to the accident was the aircraft being over its weight limitations (Occurrence code 0106103508). The coding transition between pre- and post-2008 accidents was extensive, and additional examples will help clarify various combinations of codes [26,35], but the information summarized here is sufficient for the purposes of identifying stall-type accidents.

3. Results

Because of the differences in the three coding schemas, we will also present the results in three sections (one for each timeframe). The last subsection of the results discusses generalized trends over the three periods for the data that was consistently reported throughout.

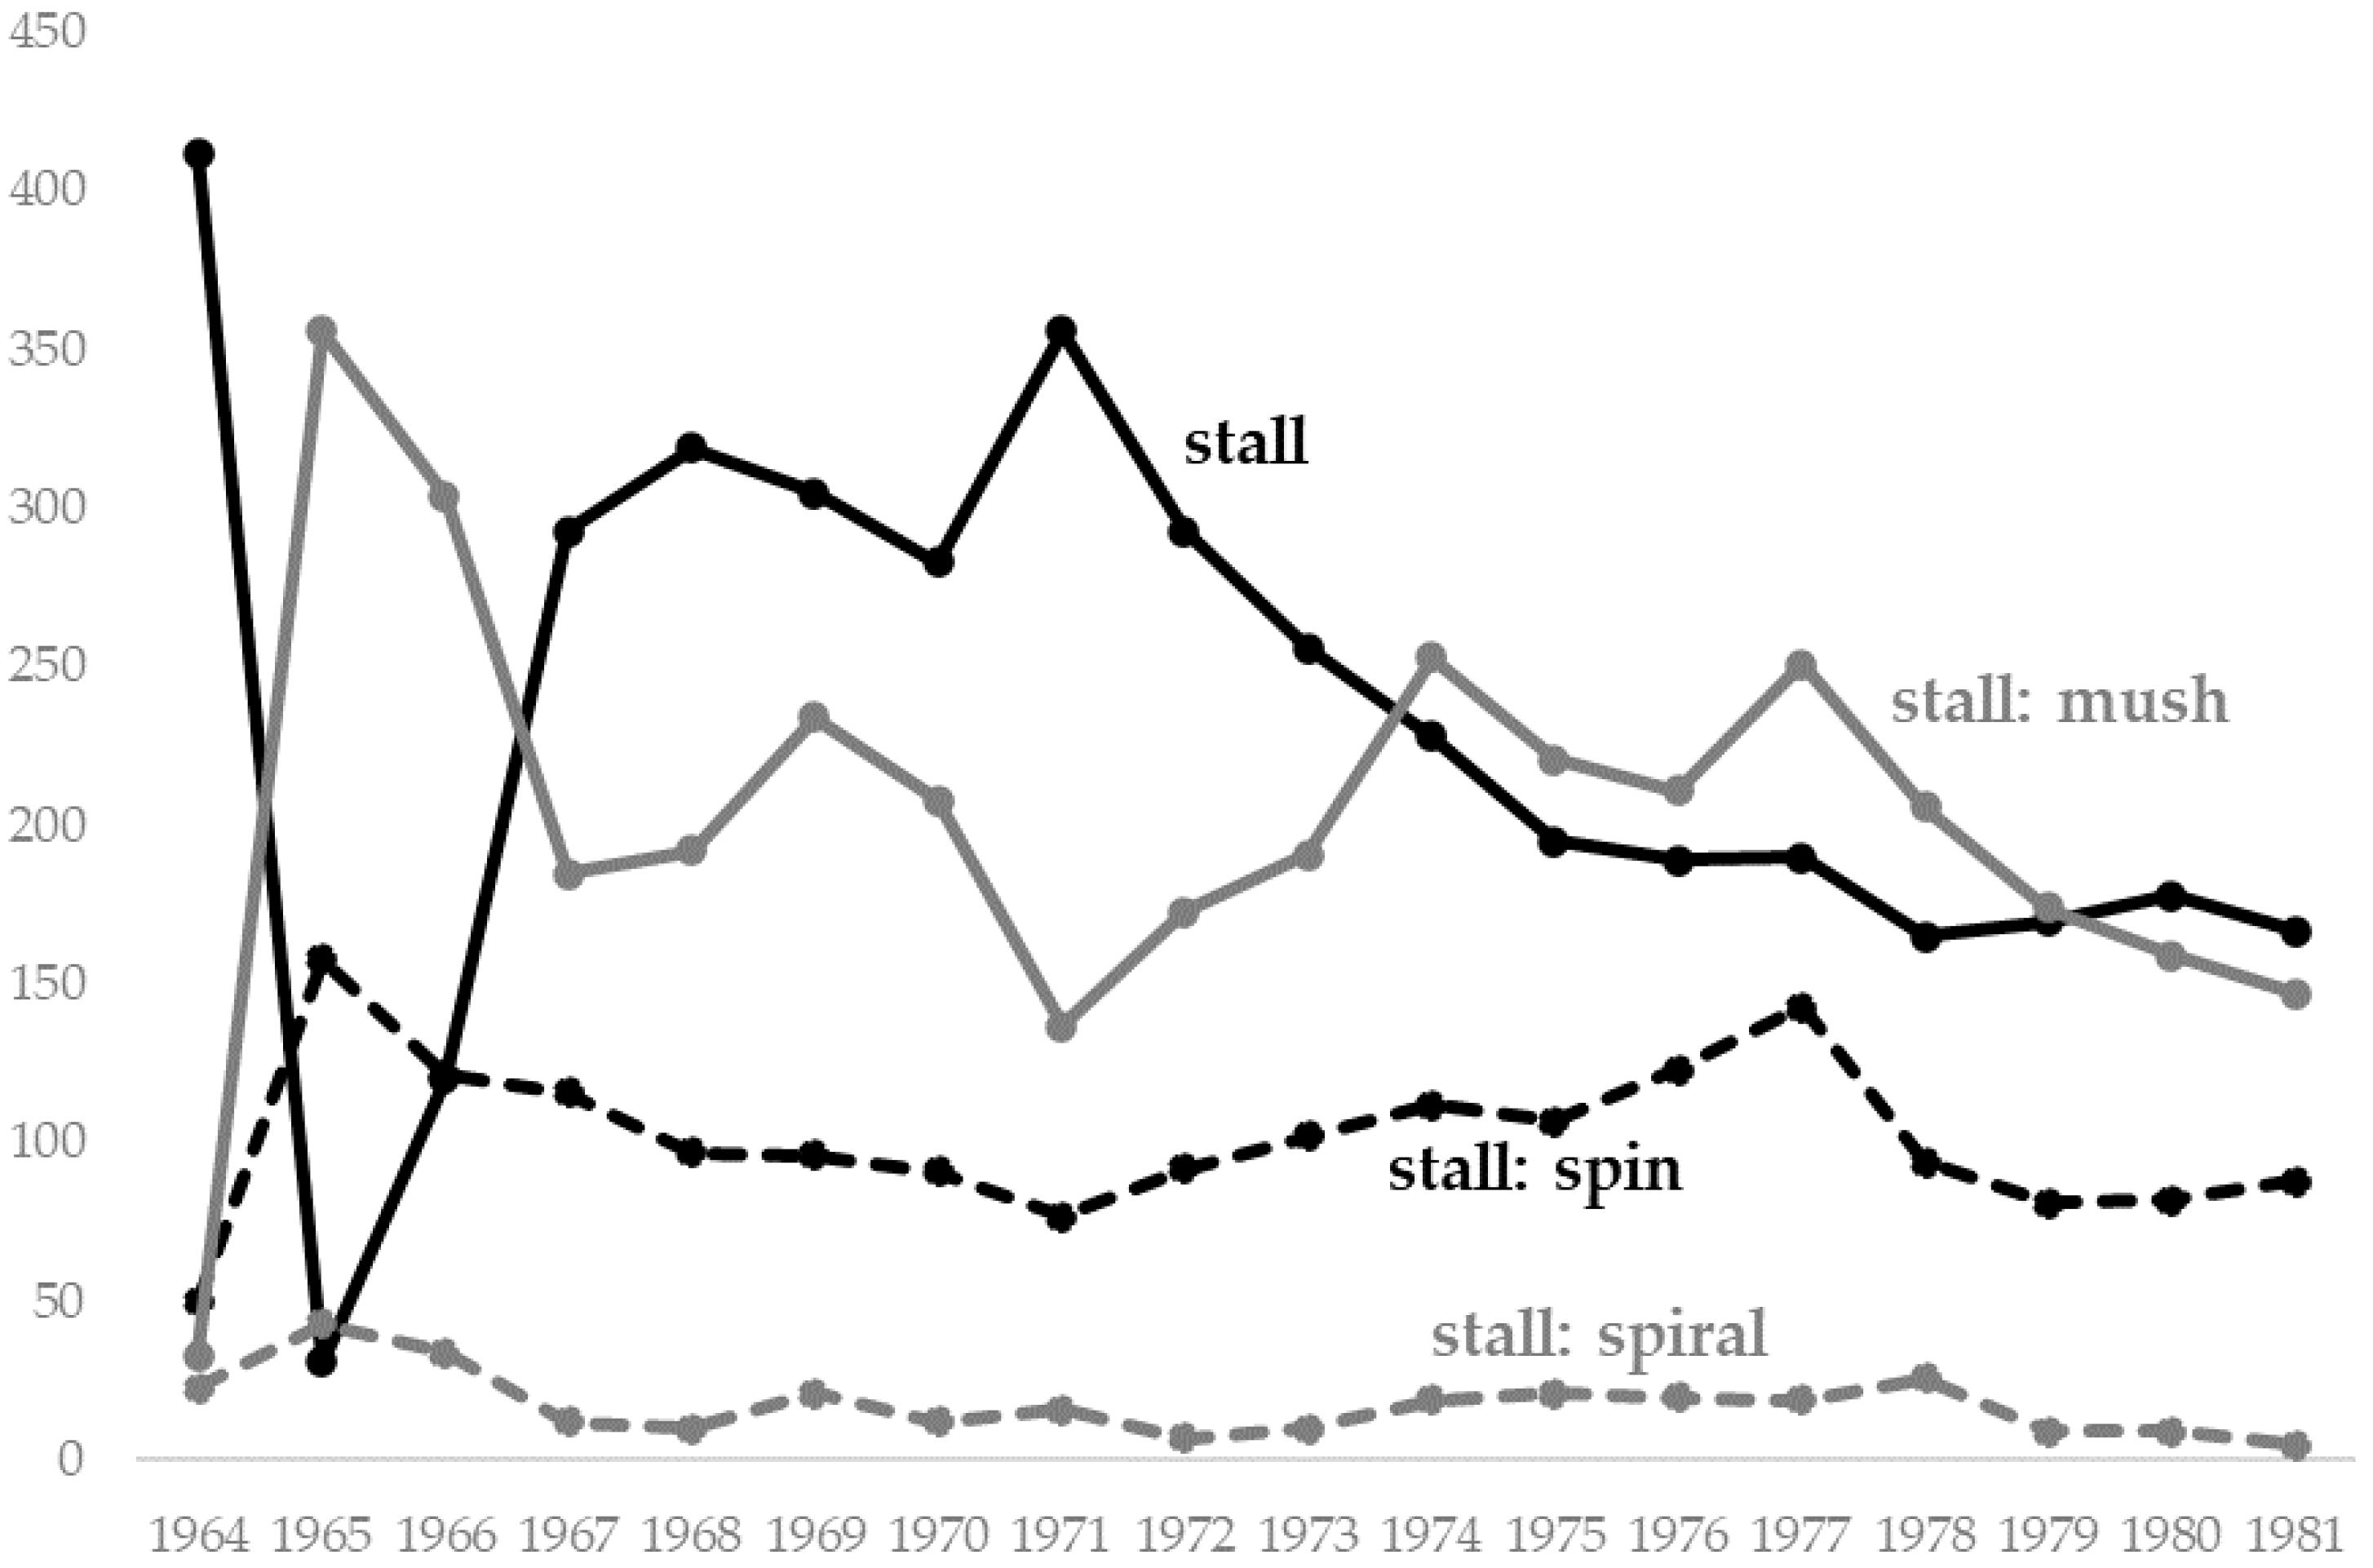
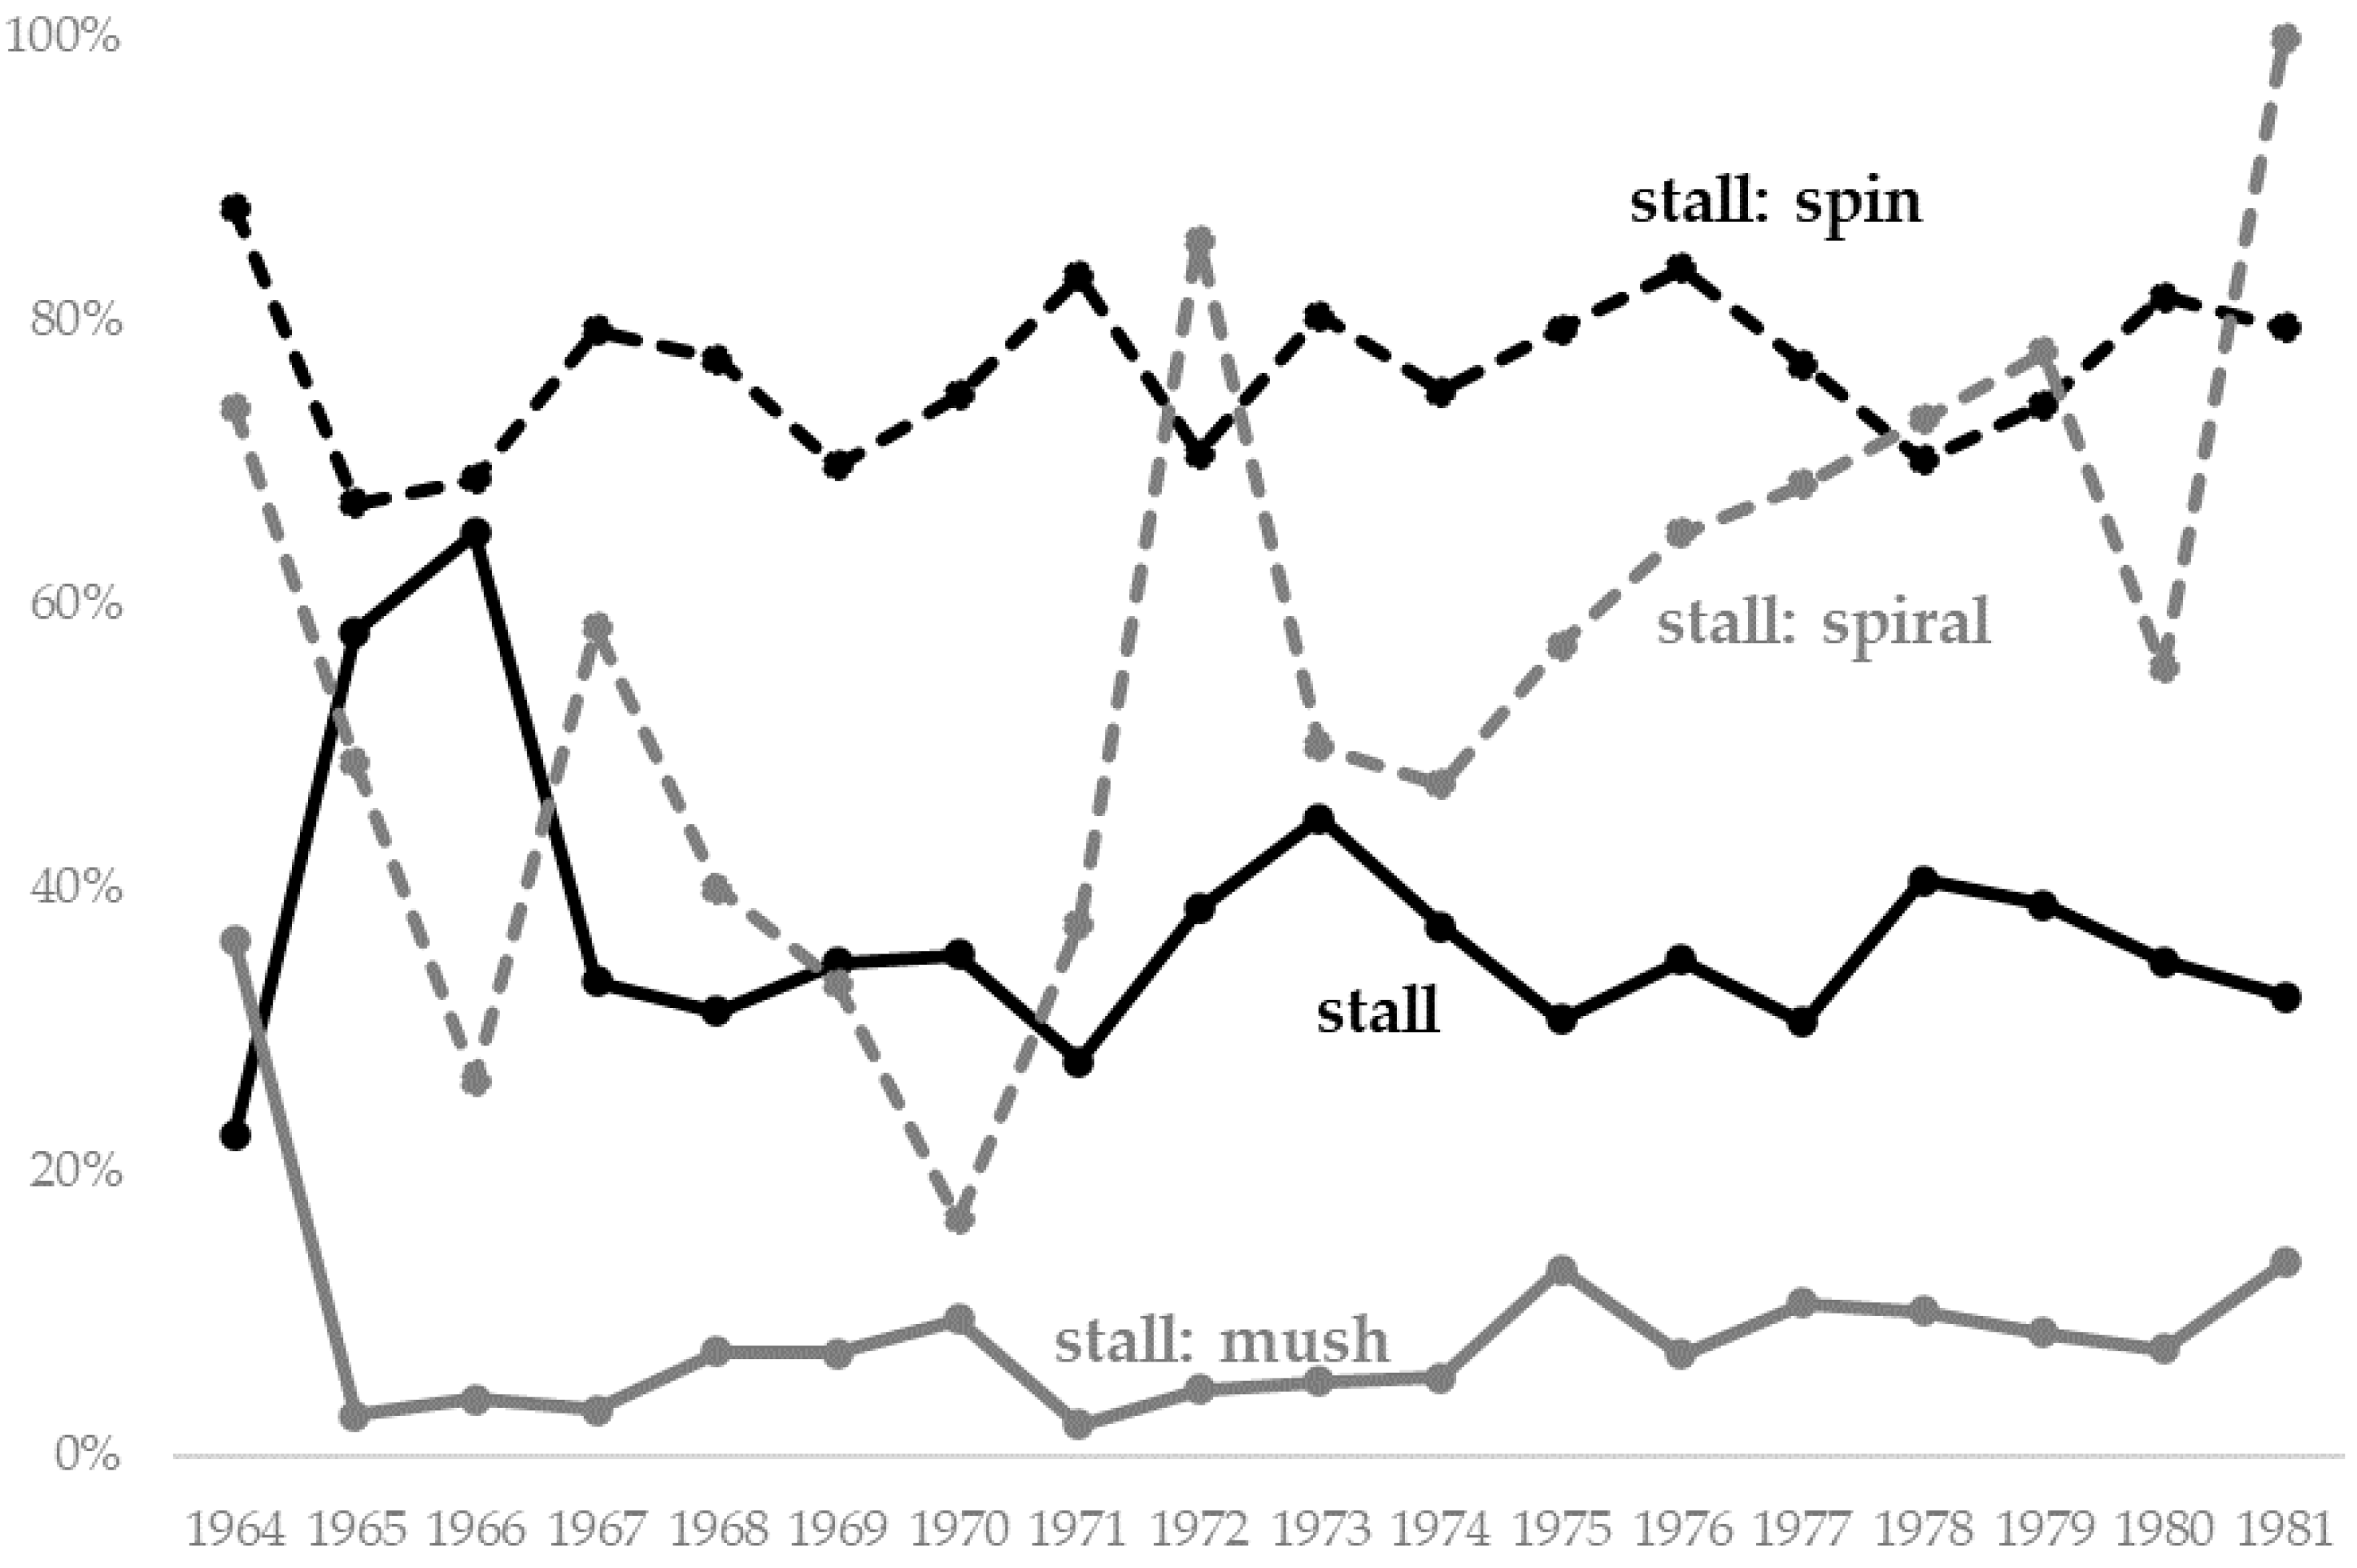
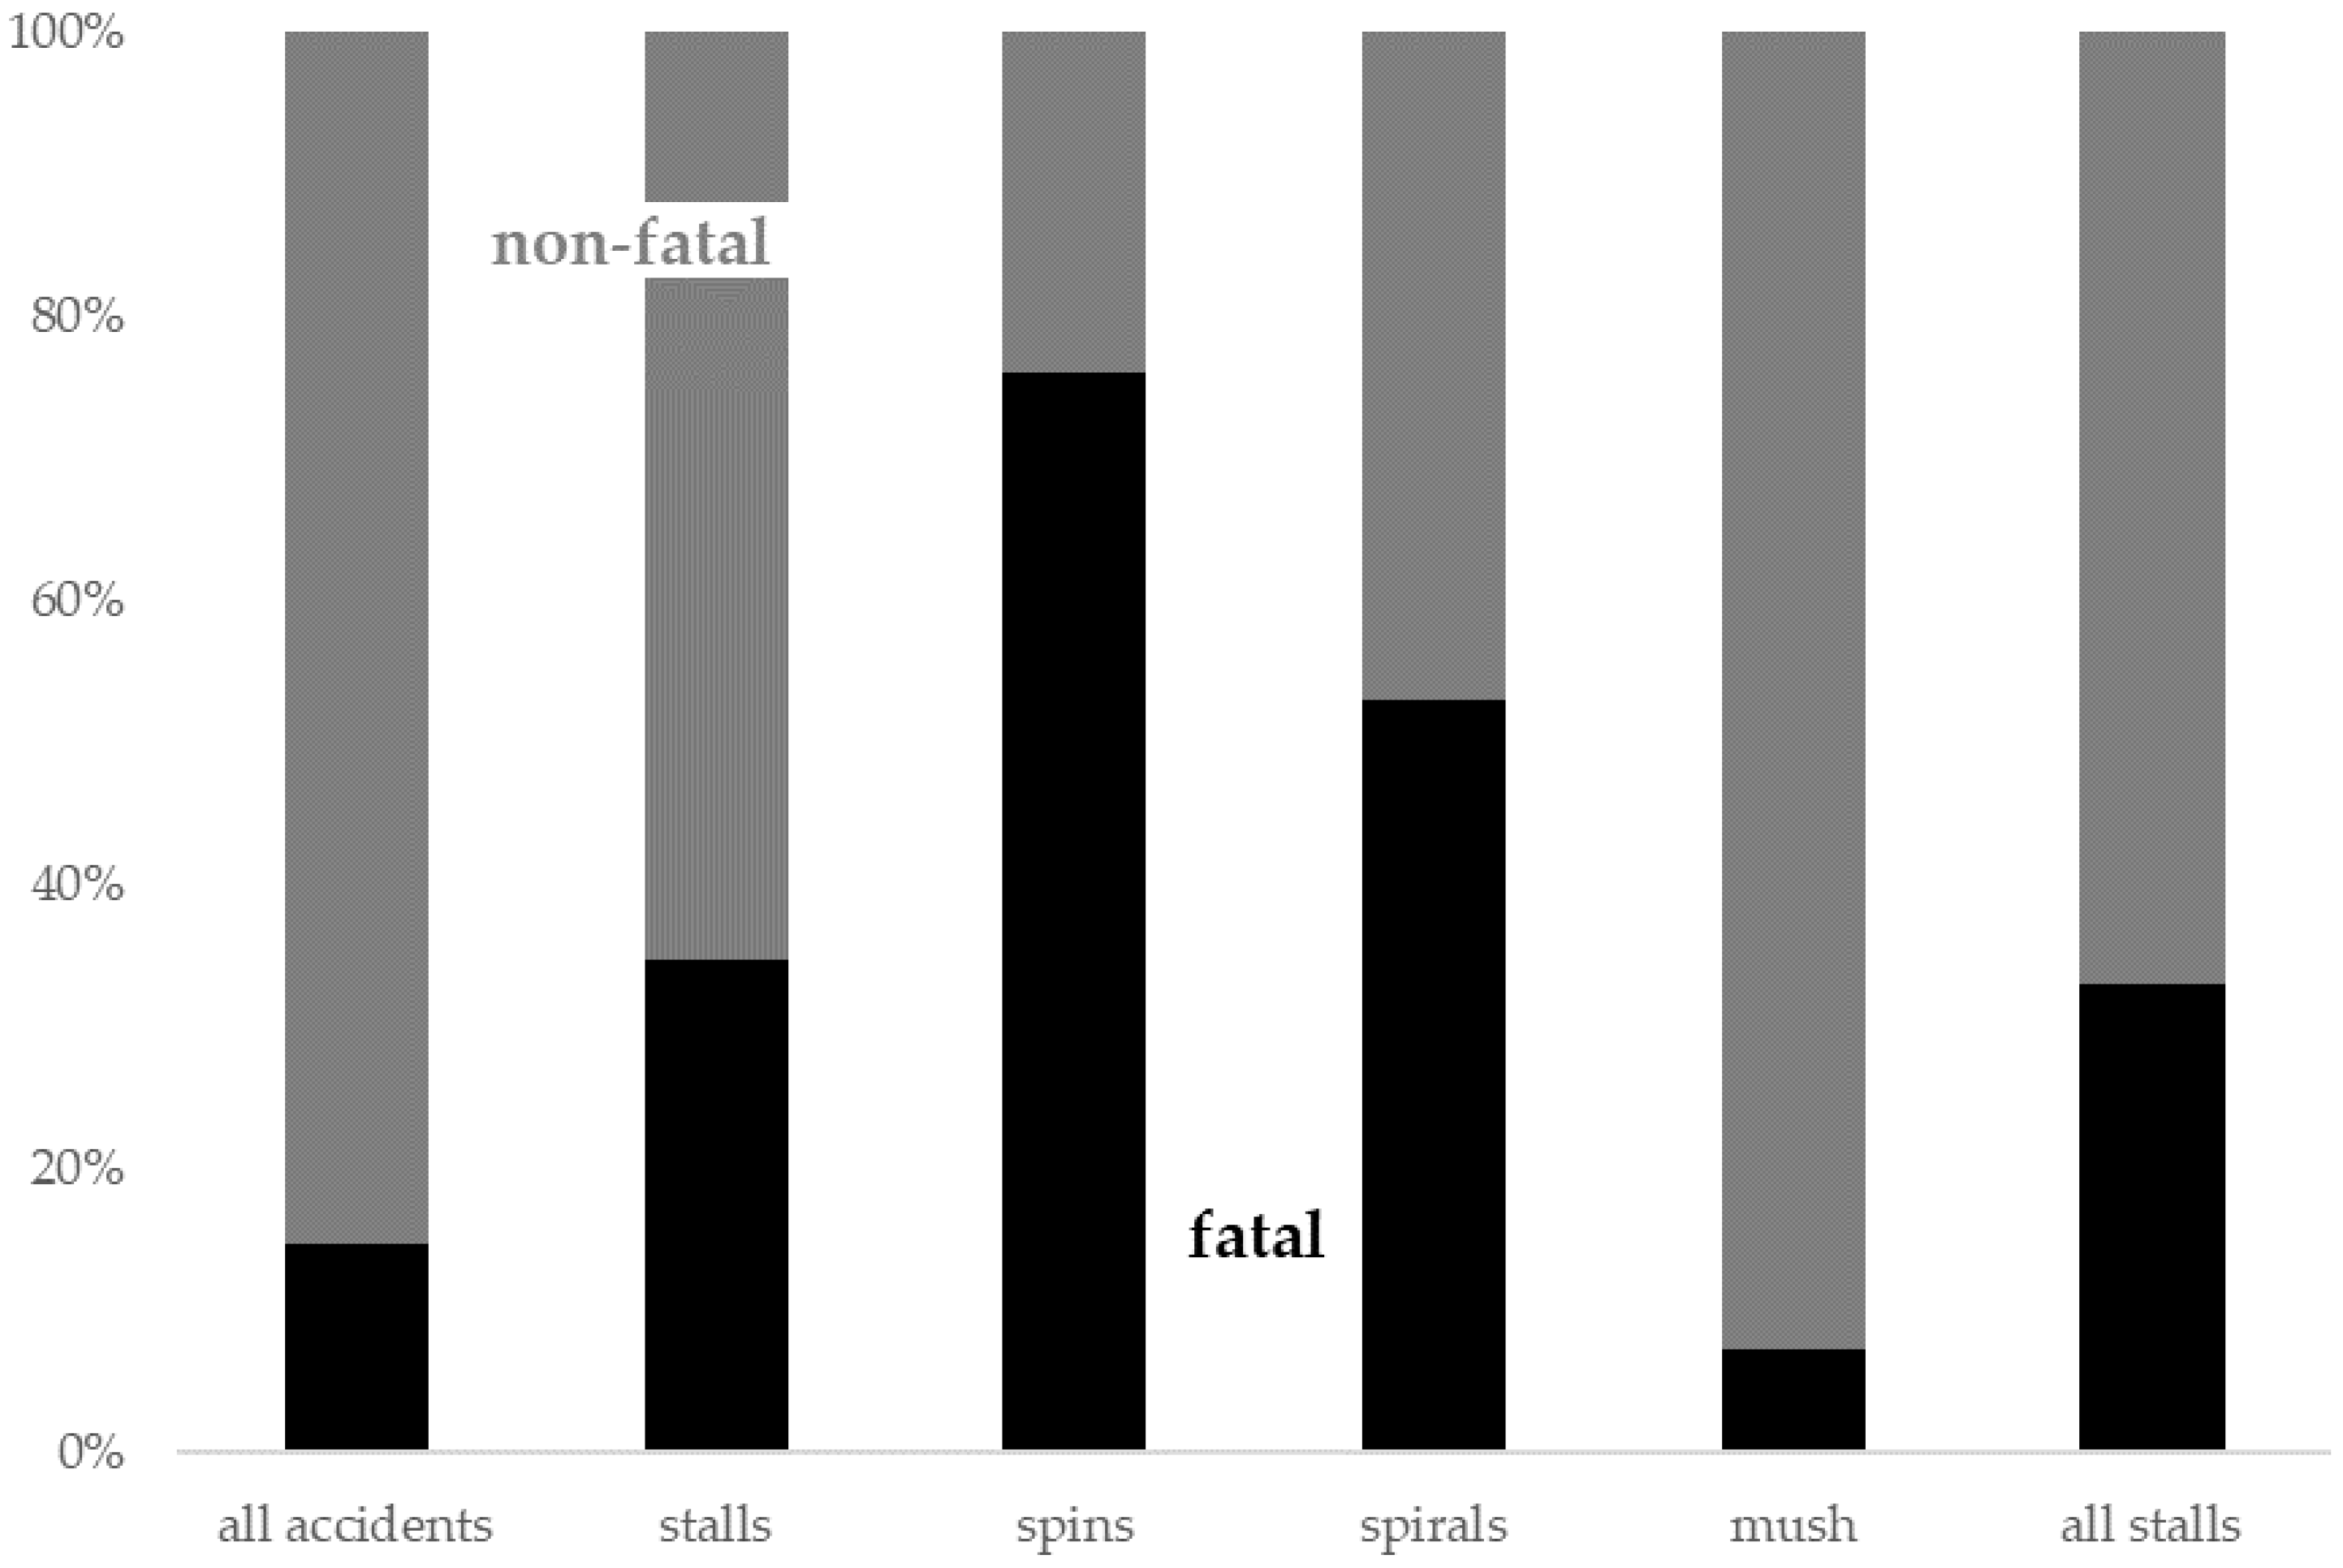
3.1. Accidents Prior to 1982 (1962–1981)

During this first timeframe, accidents marked as Q, Q1, Q2, or Q3 made up 12% of all accidents and 28% of fatal accidents. Figure 1 shows the number of accidents for each code over the years between 1964 and 1981. While spin and spiral accidents are relatively stable, uncategorized stalls and mush have large changes, especially in the first few years, suggesting that there may be uncertainties on how to define the various types of stall accidents.
Prior to 1982, stall-type accidents accounted for 12.3% of all accidents, but fatal stall-type accidents made up 27.6% of all fatal accidents. Stall-type accidents have been more fatal than an average accident. Figure 2 indicates the fatality ratio of the four categories of stall-type accidents—76% of all spins in this first period resulted in fatalities. The overall fatality ratios for spirals, unspecified stalls, and mush were 53%, 35% and 7%, respectively, making the fatality ratio of spins disproportionally high. Figure 3 shows the disproportional fatality ratios for all types of stalls reported. Overall, stall accidents are more fatal than the general accident. Although spins and spirals are not as frequent as mush or unspecified stalls, they are a lot more fatal than accidents in general. Mush accidents are less fatal than accidents in general.

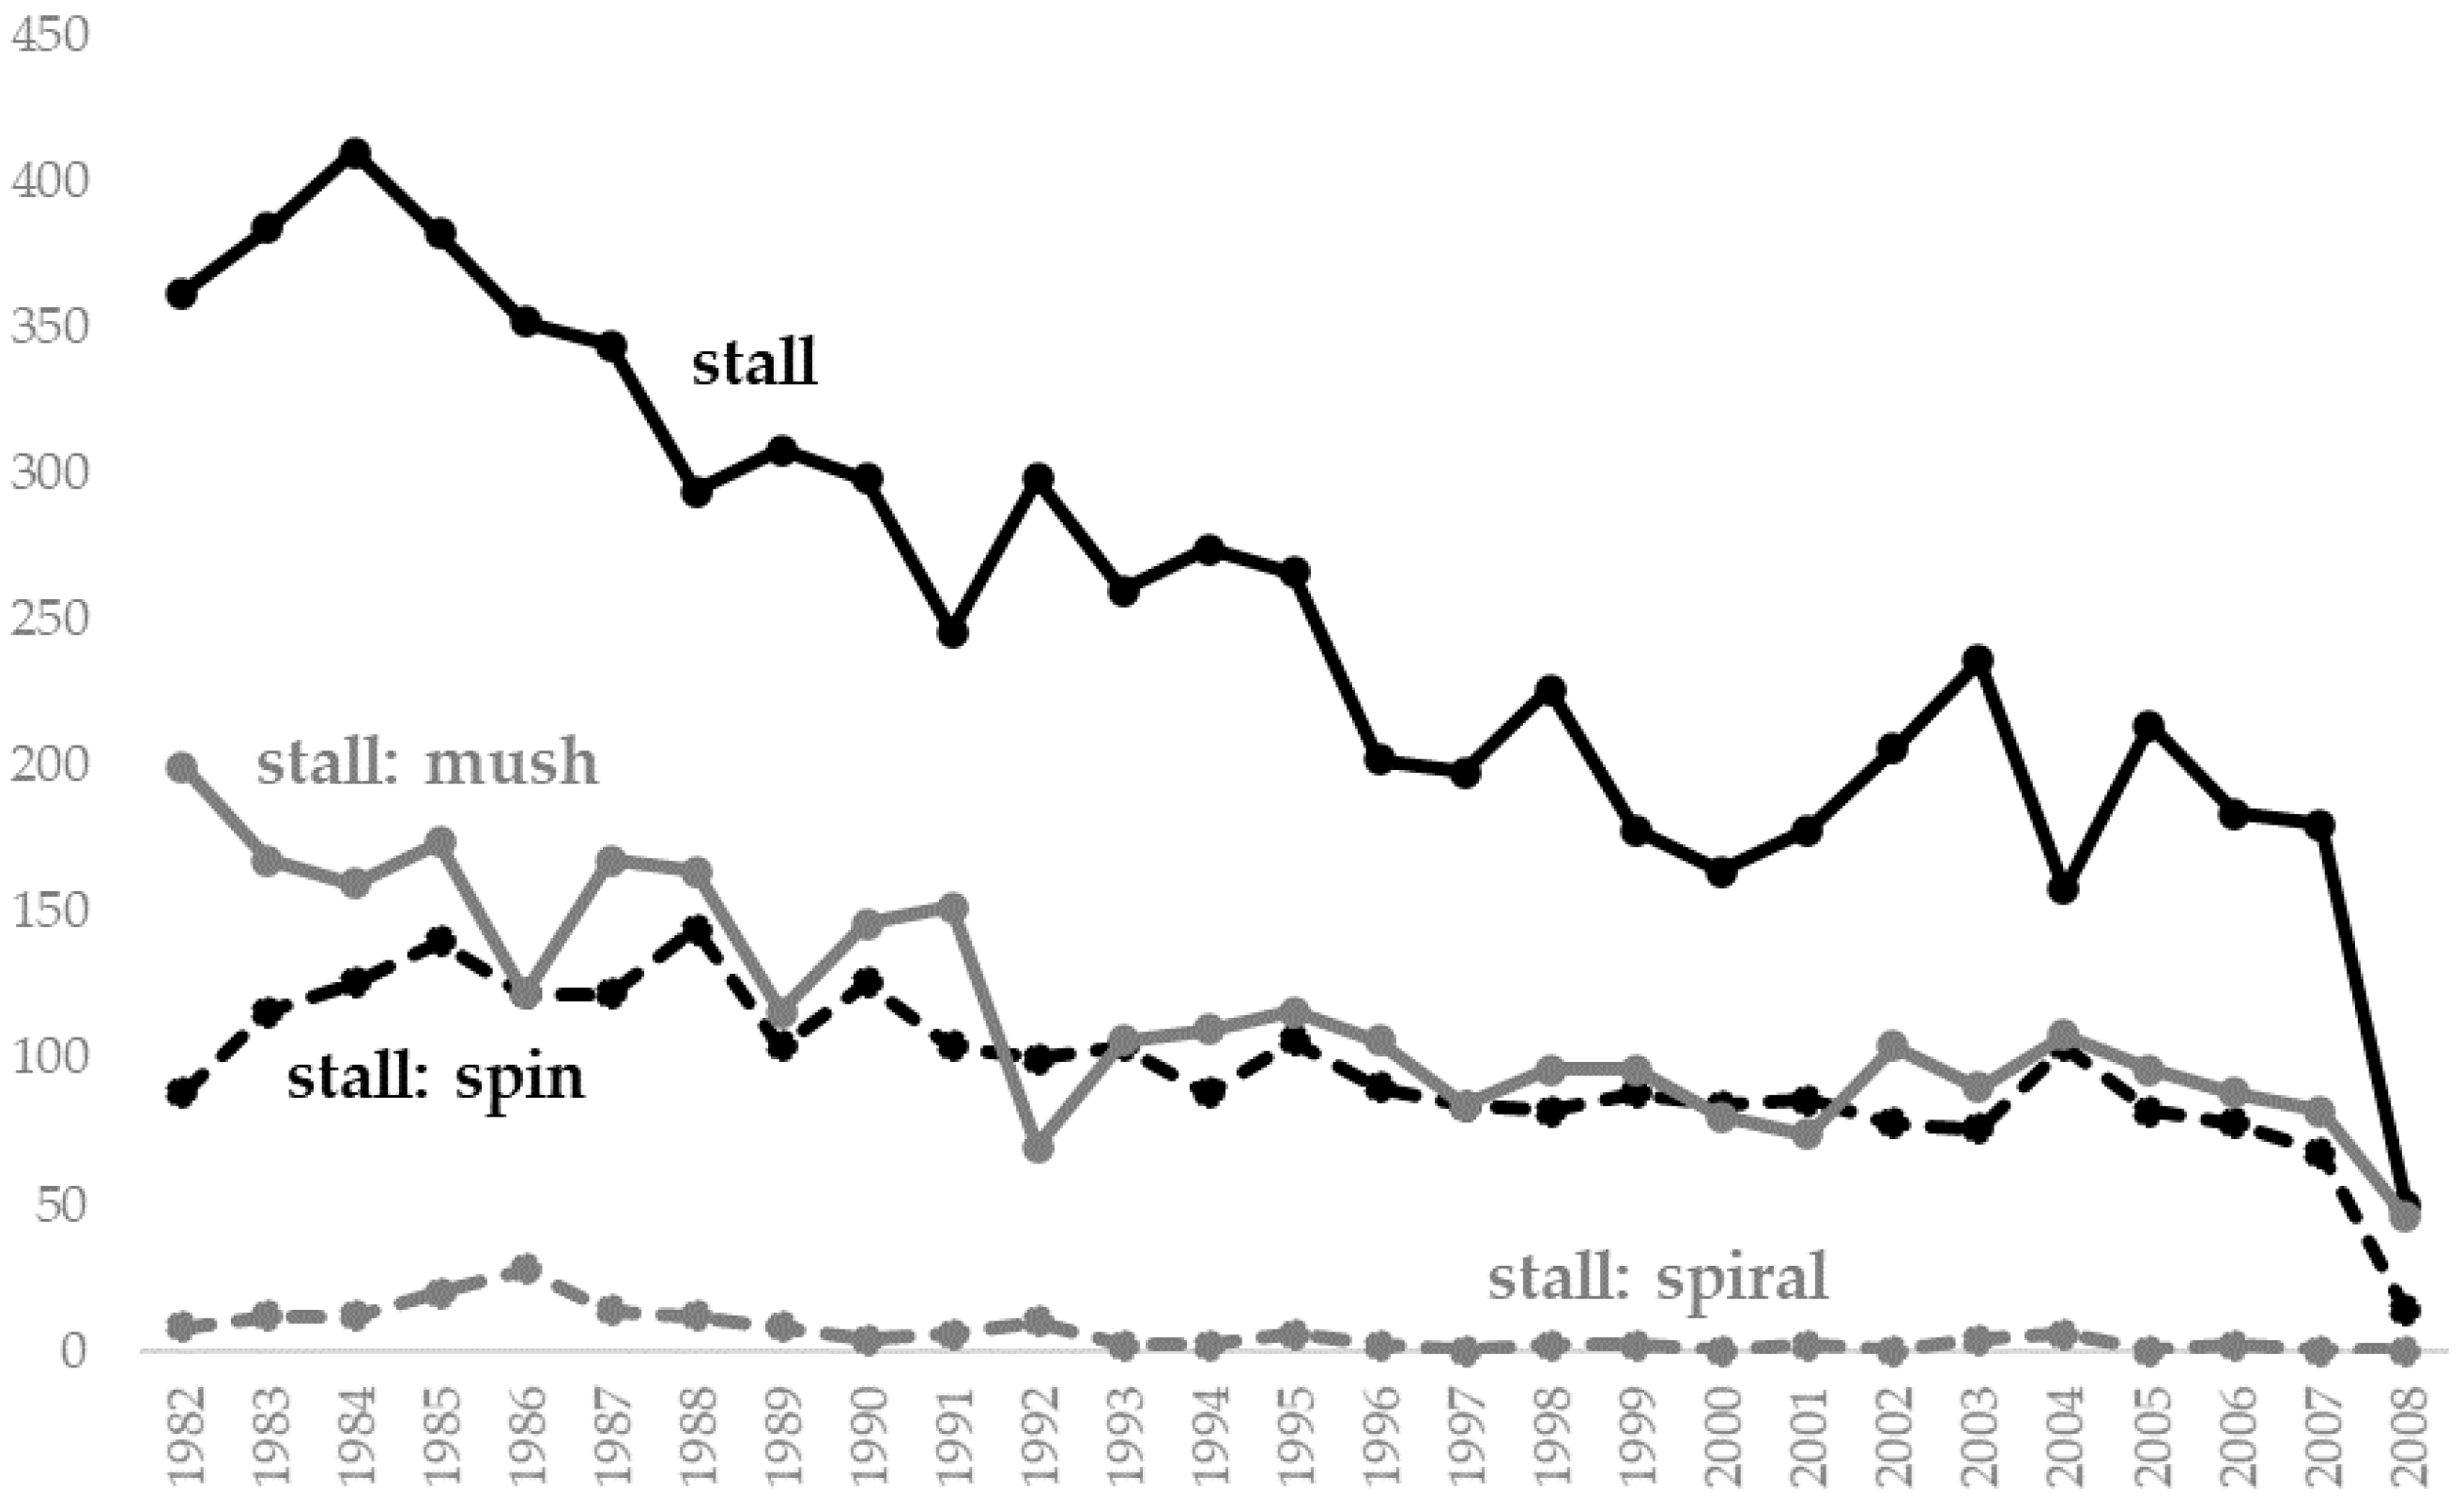
3.2. Accidents between 1982 and before 2008

Between 1982 and 2008, stall-type accidents characterized by Subject codes 24550–24553 made up for 11.5% of all accidents and 24% of all fatal accidents. These proportions are similar to those of the pre-1982 accident period. Figure 4 shows the number of accidents corresponding to each type of stall each year. There is a downwards trend among all types of accidents, particularly the unclassified stalls, which can be deceiving. In reality, the number of all accidents decreased overall during this time, resulting in decreasing accidents of most types. Figure 5 shows the ratio of each type of stall accident to all accidents from the same year. The ratios are overall stable over the years for each type of stall.
The number of stall: spiral accidents during this period is very low, ranging from 0 to 28, with an average of 6 per year, compared to an average of 18 per year in the first period. Notably the number of spiral accidents remained very low after 1992, suggesting that the NTSB may have changed how they identify or define these accidents. The accidents for year 2008 are outliers in both Figure 4 and Figure 5, likely because 2008 was a transition year between large database schema and dictionary changes. Some of the accidents were coded in this second schema, using subject codes, while others were directly coded in the third schema, which made subject codes obsolete.
The fatality ratios for each type of stall accident for the second schema are overall very similar to those of the first schema (Figure 3 and Figure 6, respectively). The fatality of spirals differs between the two periods; however, using spiral numbers to calculate ratios is unreliable since so few of them happened each year.

3.3. Accidents after 2008 (2008–2020)

The analysis for post-2008 accidents cannot be broken down by stall type. Instead, all stall-type accidents are reported in aggregate. Figure 7 shows the number of accidents each year that included event code 241. With the new data dictionary, the number of stall-type accidents reported decreased. However, this is not indicative of a real change in the number of accidents that occurred. The NTSB has also introduced event code 240: loss of control in flight at the same level as the aerodynamic stall/spin code, and some of the accidents that would have been characterized as spins or stalls in earlier years may now fall in the loss of control category. In the earlier schema, loss of control was an occurrence code, while spin was a subject code. As shown in Table 1, an occurrence code can have one or more subject codes, which means that an accident could be classified as a LOC accident due to a spin. In the latest schema, such an accident could get assigned the LOC and/or spin event codes. However, there is no overlap between the event code 240 and event code 241 accident subsets. The introduction of event code 271: inflight upset may also include accidents that would have originally been classified as stall-type accidents, but only an average of six accidents per year included that code, and it was therefore not included in the following figures. The fatality of both aerodynamic stall/spin and loss of control accidents remains around 50%, as shown in Figure 8. On average, 48% and 53% of aerodynamic stall/spin and loss of control accidents were fatal over these twelve years.

3.4. Overall Results

Because of the changes and the inconsistencies in the three database and coding schemas, it is difficult to compare the data year-to-year. The three metrics for which we have information each year are (1) the number of accidents, (2) the prevalence of stall-type accidents (i.e., the ratio of stall-type accidents to all accidents), and (3) the fatality of stall-type accidents. The challenge with all metrics is that it is not clear exactly which accidents fall in each NTSB accident category or code. The additional challenge with the first metric (number of accidents) is that a decreasing trend may not necessarily correspond to improved safety but may instead be indicative of a reduction in flights, flight time, and therefore overall accidents. The prevalence metric solves that problem by normalizing the total number of accidents. Figure 9 represents the prevalence of stall-type accidents in the population of all accidents and the equivalent prevalence in fatal accidents (i.e., the ratio of fatal stall-type accidents to all fatal accidents). Figure 10 shows the fatality ratio of stall-type accidents, i.e., the ratio of fatal stall-type accidents to all stall-type accidents for each year. Note that the information until 2008 includes all stall categories in the NTSB coding schemas (spiral, stall, stall/spin, and stall/mush). The information post 2008 includes the aerodynamic stall/spin code.

3.5. Uncategorized Events

All three schemas of the database include codes for events in the accident that were undetermined, unknown, or uncategorized. In the first two schemas, the accidents that include such events are not sufficient to make a difference to the results. In the first schema, 27 accidents per year (or less than 1% of the accidents that met the inclusion criteria of involving a U.S. registered fixed-wing aircraft) on average included at least one event that was in some way uncategorized. The second schema exhibited similar results—16 accidents per year on average or 0.5% of the accidents that met the inclusion criteria. In the last schema, however, we identified many accidents with uncategorized events—98 accidents or 7.7% on average each year. If we assume that all uncategorized events were aerodynamic stalls/spins, they could change the trend of these accidents over the years. Figure 11 modifies Figure 9 to show the change in numbers in the hypothetical extreme that all uncategorized events were unidentified stalls/spins.

4. Discussion

The work presented in this paper summarized U.S.-registered fixed-wing stall-type accident information since the early 1960s as reported by the NTSB and filled in the gap of having incomplete data on stall-type accidents. The results were partitioned in three periods based on changes in the NTSB coding schema. While the inconsistencies in how accidents are reported using the different coding dictionaries and the lack of information on how exactly the NTSB differentiates and defines the different kinds of stalls, or, in more recent years, how they determine differences between stalls/spins and loss of control make it difficult to make conclusions across the board, it is clear from the results presented in Section 3.2 that stall-type accidents not only occur consistently, they are also highly fatal. Throughout the past sixty years, an accident involving a fixed-wing U.S.-registered aircraft was 18% likely to result in a fatality. A stall-type accident in the same time period, however, was more than twice as likely to be fatal, at 39%.
With the demand for both commercial and non-commercial flights increasing, we can expect that more people will be going through flight training and participating in recreational flights. Reducing the number of stall-type accidents may therefore improve aviation safety statistics overall and save many pilots and their passengers. At this point, there are no apparent improvements in the safety record with regards to spins and general stall-type accidents.
Most of the limitations to this work are due to uncertainty regarding the specifics of how the NTSB makes decisions when coding accidents and inconsistencies in the resolution of the three coding schemas. An additional limitation is that the NTSB accident database, by definition, only includes stalls and spins that resulted in accidents. We do not have information about all the flights where the pilot stalled inadvertently and then recovered without issues, missing a link that could point to the differentiating factor between successful recoveries and accidents. Additionally, the last schema includes many uncategorized events, which could impact the results, especially when evaluating prevalence percentages. Using fatality ratios is one way to normalize results and remove the effect of most of the limitations, but is not always the most useful metric when trying to make changes to how we operate aircraft safely.
In future work, we plan to (1) enhance the data analyzed in this paper by adding information on how the accident occurred, through an analysis of the prior occurrence sequences and the phase of flight where the events happened and by identifying patterns in accident causation for stall/spin accidents and (2) develop and evaluate ground and simulator-based spin awareness modules that will aim to provide pilots with knowledge to understand the aerodynamics that contribute to their aircraft’s response to a stall or a spin and skills to respond to spins in realistic flight scenarios and workloads. With how prevalent these types of accidents are based on our findings, improving the theoretical and practical pilot education surrounding the stall-type accident environment has the potential of improving aviation safety overall. Additionally, efforts to reduce the number of stall-type accidents or make stall-type accidents less fatal through education could have a positive effect on other types of accidents because of the improved aircraft and aerodynamics understanding and improved workload management.

Funding

This research received no external funding.

Data Availability Statement

Publicly available datasets were analyzed in this study. This downloadable data can be found here: https://www.ntsb.gov/Pages/AviationQuery.aspx (accessed on 18 February 2022).

Conflicts of Interest

The author declares no conflict of interest.

Appendix A

Table A1. The NTSB coded accidents based on various Accident Types listed here. In this schema, the NTSB can include up to two accident types per event. For example, an accident with types R0; S0 will have had a fire or explosion in flight followed by airframe failure in flight. Code values relevant to this research are indicated in bold and a gray background.
CodeMeaningCodeMeaning
0Hail damage to aircraftN6Collided with runway or approach lights
1Lightning strikeN7Collided with airport hazard
2Evasive maneuverN8Collided with animals
3Uncontrolled altitude deviationsN9Collided with crop
4DitchingNACollided with flagman, loader
5Missing aircraft, not recoveredNBCollided with ditches
6MiscellaneousNCCollided with snowbank
7UndeterminedNDCollided with parked aircraft
AGround-water loop-swerveNECollided with automobile
BDragged wingtip, pod, or floatNFCollided with dirt bank
CWheels-upNYCollided with object
DWheels-down landing in waterPBird strike
EGear collapsedQStall
FGear retractedQ1Stall/spin
GHard landingQ2Stall/spiral
HNose over/downQ3Stall/mush
IRoll overRFire or explosion
JOvershootR0Fire or explosion in flight
KUndershootR1Fire or explosion on ground
LCollision with aircraftSAirframe failure
L0Collision with aircraft—both in flightS0Airframe failure in flight
L1Collision with aircraft—one airborneS1Airframe failure on ground
L2Collision with aircraft—both on groundTEngine tearaway
MCollision with ground/waterUEngine failure or malfunction
M0Controlled collision with ground/waterVPropeller/rotor failure
M1Uncontrolled collision with ground/waterV1Propeller failure
NCollided with unspecified objectV2Tail rotor failure
N0Collided with wires/polesV3Main rotor failure
N1Collided with treesWPropeller/rotor accident to person
N2Collided with residence(s)XJet intake/exhaust accident to person
N3Collided with building(s)YPropeller/jet/rotor blast
N4Collided with fence, fencepostsZTurbulence
N5Collided with electronic towers

References

  1. Flight Standards Service. Private Pilot—Airplane Airman Certification Standards; FAA: Washington, DC, USA, 2018.
  2. Hoffman, W.C.; Walter, M.H. General Aviation Pilot Stall Awareness Training Study; U.S. Department of Transportation: Washington, DC, USA, 1976.
  3. Committee on Government Operations. FAA Certification of Light Aircraft, 1st ed.; U.S. Government Printing Office: Washington, DC, USA, 1973.
  4. Anderson, S.B. Historical Overview of Stall/Spin Characteristics of General Aviation Aircraft. J. Aircr. 1979, 16, 455–461. [Google Scholar] [CrossRef]
  5. Belcastro, C.M.; Jacobson, S.R. Future Integrated Systems Concept for Preventing Aircraft Loss-of-Control Accidents. In AIAA Guidance, Navigation and Control Conference; AIAA: Toronto, ON, Canada, 2010. [Google Scholar]
  6. Lee, D.-C.; Nagati, M.G. Momentum Vector Control for Spin Recovery. J. Aircr. 2004, 41, 1414–1423. [Google Scholar] [CrossRef]
  7. Venkateswara, R.D.M.K.K.; Go, T.H. Optimization of Aircraft Spin Recovery Maneuvers. Aerosp. Sci. Technol. 2019, 90, 222–232. [Google Scholar] [CrossRef]
  8. Bunge, R.; Kroo, I. Automatic Spin Recovery with Minimal Altitude Loss. In 2018 AIAA Guidance, Navigation, and Control Conference; AIAA: Kissimmee, FL, USA, 2018. [Google Scholar]
  9. de Voogt, A.J.; van Doom, R.R. Accidents Associated with Aerobatic Maneuvers in U.S. Aviation. Aviat. Space Environ. Med. 2009, 80, 732–733. [Google Scholar] [CrossRef] [PubMed]
  10. Lambregts, A. Gregg Nesemeier, Richard Newman, and James Wilborn. Airplane Upsets: Old Problem, New Issues. In AIAA Modeling and Simulation Technologies Conference and Exhibit; AIAA: Honolulu, HI, USA, 2008. [Google Scholar]
  11. Belcastro, C.M.; Foster, J.V. Aircraft Loss-of-Control Accident Analysis. In AIAA Guidance, Navigation and Control Conference; AIAA: Toronto, ON, Canada, 2010. [Google Scholar]
  12. Taylor, A.; Dixon-Hardy, D.W.; Wright, S.J. Simulation Training in U.K. General Aviation: An Undervalued Aid to Reducing Loss of Control Accidents. Int. J. Aviat. Psychol. 2014, 24, 141–152. [Google Scholar] [CrossRef] [Green Version]
  13. Flight Standards Service. Flight Instructor Practical Test Standards for Airplane; FAA: Washington, DC, USA, 2012.
  14. Federal Aviation Administration. Stall and Spin Awareness Training; AC 61-67C; FAA: Washington, DC, USA, 2000.
  15. Veillette, P.R. Reexamination of Stall and Spin Prevention Training. Transp. Res. Rec. 1993, 26–33. [Google Scholar]
  16. Advani, S.; Field, J. Upset Prevention and Recovery Training in Flight Simulators. In Proceedings of the AIAA Modeling and Simulation Technologies Conference, Portland, OR, USA, 8–11 August 2011. [Google Scholar]
  17. O’Hare, D.; Wiggins, M.; Batt, R.; Morrison, D. Cognitive Failure Analysis for Aircraft Accident Investigation. Ergonomics 2007, 37, 1855–1869. [Google Scholar] [CrossRef]
  18. Fala, N. A Review of Stall-Type Accident Statistics over the Past Fifty Years. In Proceedings of the Human Factors and Ergonomics Society Annual Meeting, Los Angeles, CA, USA, 5–9 October 2020; pp. 127–128. [Google Scholar]
  19. National Transportation Safety Board. NTSB Accident Database. Available online: https://www.ntsb.gov/Pages/AviationQuery.aspx (accessed on 18 February 2022).
  20. Canfield, D.V.; Chaturvedi, A.K.; Dubowski, K.M. Carboxyhemoglobin and Blood Cyanide Concentrations in Relation to Aviation Accidents. Aviat. Space Environ. Med. 2005, 76, 978–980. [Google Scholar]
  21. Sen, A.; Akin, A.; Canfield, D.V.; Chaturvedi, A.K. Medical Histories of 61 Aviation Accident Pilots with Postmortem Ssri Antidepressant Residues. Aviat. Space Environ. Med. 2007, 78, 1055–1059. [Google Scholar] [CrossRef]
  22. Dulkadir, Z.; Chaturvedi, A.K.; Craft, K.J.; Hickerson, J.S.; Cliburn, K.D. Tricyclic Antidepressants Found in Pilots Fatally Injured in Civil Aviation Accidents. J. Forensic Sci. 2017, 62, 164–168. [Google Scholar] [CrossRef]
  23. Boyd, D.D. Causes and Risk Factors for Fatal Accidents in Non-Commercial Twin Engine Piston General Aviation Aircraft. Accid. Anal. Prev. 2015, 77, 113–119. [Google Scholar] [CrossRef] [PubMed]
  24. Ison, D.C. Comparative Analysis of Accident and Non-Accident Pilots. J. Aviat. Technol. Eng. 2015, 4, 20. [Google Scholar] [CrossRef]
  25. Politano, P.M.; Walton, R.O. Analysis of Ntsb Aircraft-Assisted Pilot Suicides: 1982–2014. Suicide Life -Threat. Behav. 2016, 46, 234–238. [Google Scholar] [CrossRef] [PubMed]
  26. Rao, A.H.; Marais, K. A State-Based Approach to Modeling General Aviation Accidents. Reliab. Eng. Syst. Saf. 2020, 193, 106670. [Google Scholar] [CrossRef]
  27. Zhang, X.; Mahadevan, S. Bayesian Network Modeling of Accident Investigation Reports for Aviation Safety Assessment. Reliab. Eng. Syst. Saf. 2021, 209, 107371. [Google Scholar] [CrossRef]
  28. Srinivasan, P.; Nagarajan, V.; Mahadevan, S. Mining and Classifying Aviation Accident Reports. In Proceedings of the AIAA Aviation 2019 Forum, Dallas, TX, USA, 17–21 June 2019. [Google Scholar]
  29. Tanguy, L.; Tulechki, N.; Urieli, A.; Hermann, E.; Raynal, C. Natural Language Processing for Aviation Safety Reports: From Classification to Interactive Analysis. Comput. Ind. 2016, 78, 80–95. [Google Scholar] [CrossRef] [Green Version]
  30. Anderson, C.; Smith, M.O. Qualitative Analysis of Loss of Control Aircraft Accidents Using Text Mining Techniques. Int. J. Aviat. Aeronaut. Aerosp. 2017, 4, 2. [Google Scholar] [CrossRef]
  31. Dong, T.; Yang, Q.; Ebadi, N.; Luo, X.R.; Rad, P. Identifying Incident Causal Factors to Improve Aviation Transportation Safety: Proposing a Deep Learning Approach. J. Adv. Transp. 2021. [Google Scholar] [CrossRef]
  32. Goh, Y.M.; Ubeynarayana, C.U. Construction Accident Narrative Classification: An Evaluation of Text Mining Techniques. Accid. Anal. Prev. 2017, 108, 122–130. [Google Scholar] [CrossRef]
  33. Boyd, D.D. A Review of General Aviation Safety (1984–2017). Aerosp. Med. Hum. Perform. 2017, 88, 657–664. [Google Scholar] [CrossRef]
  34. Zhang, X.; Srinivasan, P.; Mahadevan, S. Sequential Deep Learning from Ntsb Reports for Aviation Safety Prognosis. Saf. Sci. 2021, 142, 105390. [Google Scholar] [CrossRef]
  35. Rao, A.H.; Fala, N.; Marais, K. Analysis of Helicopter Maintenance Risk from Accident Data. In Proceedings of theAIAA Infotech@ Aerospace, San Diego, CA, USA, 4–8 January 2016. [Google Scholar]
  36. Goldman, S.M.; Fiedler, E.R.; King, R.E. General Aviation Maintenance-Related Accidents: A Review of Ten Years of NTSB Data; US Department of Transportation: Washington, DC, USA, 2002.
  37. Rao, A.H. A New Approach to Modeling Aviation Accidents; Purdue University: West Lafayette, IN, USA, 2016. [Google Scholar]
Figure 1. The number of accidents characterized by a stall are broken down by code into spirals, spins, mush, and uncategorized stalls.
Aerospace 09 00178 g001
Figure 2. The fatality ratio of the four types of stall-type accidents varies, with mush having a much lower fatality ratio than spins.
Aerospace 09 00178 g002
Figure 3. The fatality of each type of stall in the data is the ratio between the number of fatal accidents of a particular type (for example, stall: spin) to the total number of accidents in that same category.
Aerospace 09 00178 g003
Figure 4. The numbers of accidents all types of stalls decreased from 1982 to 2008.
Aerospace 09 00178 g004
Figure 5. Despite the decreasing numbers of stall-type accidents, their prevalence among the general number of accidents remained constant overall.
Aerospace 09 00178 g005
Figure 6. The fatality of each type of stall in the data in the second time period is similar to that of the first period, other than the fatality of spirals.
Aerospace 09 00178 g006
Figure 7. The reported number of stall-type accidents decreased a lot with the new coding dictionary, suggesting that the NTSB is now potentially using other categories to characterize these accidents.
Aerospace 09 00178 g007
Figure 8. The fatality of post-2008 stall-type accidents and loss of control accidents was approximately 50%, with a slight decrease in recent years.
Aerospace 09 00178 g008
Figure 9. Fatal stall-type accidents are more highly represented in fatal overall accidents than all stall-type accidents among all accidents, suggesting that stall-type accidents are disproportionally fatal.
Aerospace 09 00178 g009
Figure 10. The fatality ratio of stall-type accidents remains high every year throughout the three different NTSB coding schemas.
Aerospace 09 00178 g010
Figure 11. Theoretically including uncategorized accidents in the latest schema makes the fatality trend more stable over time. However, it is not likely that all uncategorized accidents are stall-type accidents.
Aerospace 09 00178 g011
Table 1. The NTSB summarizes the accident investigation findings using a series of codes.
Occurrence NumberOccurrence CodeOccurrence DescriptionSubject Code NumberSubject Code Subject DescriptionModifier CodeModifier Description
1354Loss of engine power (partial)—nonmechanical120000weather condition2202carburetor icing conditions
222304carburetor heat3133not selected
324022weather evaluation3130not understood
2220In flight collision with object120200object2522wire static
220200object2517trees
3230In fight collision with terrain/water-----
Table 2. The NTSB uses occurrence codes to summarize the events that define each accident and the phase of flight in which they happened.
Occurrence NumberOccurrence CodePhase of Flight CodeEvent CodeOccurrence DescriptionDefining Event?
1500270500270Approach—Abrupt maneuverNo
2500241500241Approach—Aerodynamic stall/spinYes
3650470650470Uncontrolled descent—Collision with terrain/object (non-CFIT)No
Table 3. The latest coding schema also identifies and repots findings for each accident investigated and separates them into accident causes and contributed factors.
Finding NumberFinding CodeFinding DescriptionCause/Factor
10106103508Aircraft–Aircraft operation/performance/capability–Aircraft capability–Maximum weight–Capability exceededFactor
20106201020Aircraft-Aircraft operation/performance/capability–Performance/control parameters–Airspeed–Not attained/maintainedCause
30206304044Personnel issues–Task performance–Use of equipment/information–Aircraft control–PilotCause
Publisher’s Note: MDPI stays neutral with regard to jurisdictional claims in published maps and institutional affiliations.

