Article

Reynolds Number Effect on Aerodynamic and Starting Characteristics of a Two-Dimensional Hypersonic Inlet

1
College of Energy and Power Engineering, Nanjing University of Aeronautics and Astronautics, Nanjing 210016, China
2
Science and Technology on Scramjet Laboratory, China Aerodynamics Research and Development Center, Mianyang 621000, China
*
Author to whom correspondence should be addressed.
Aerospace 2022, 9(12), 811; https://doi.org/10.3390/aerospace9120811
Submission received: 16 November 2022 / Revised: 7 December 2022 / Accepted: 8 December 2022 / Published: 9 December 2022

Abstract

:
The Reynolds number effect induced by model scaling and inflow conditions will affect the aerodynamic and starting characteristics of a two-dimensional hypersonic inlet. This effect is investigated through a numerical simulation method. First, the numerical simulation method is validated through experimental data. The static pressure from the numerical simulation method agreed well with wind tunnel tests. Then, this simulation method is used to study the Reynolds number effect on a two-dimensional hypersonic inlet caused by the model scaling and inflow conditions. The numerical simulation results indicate that as the Reynolds number decreases from 4.86 × 10⁶ to 9.71 × 10⁴ with model scaling increases from 1 to 1/50, the relative boundary layer thickness at the entrance of the inlet increases from 10.4% to 21.2%; as the flight altitude increases from 25.5 km to 36.5 km, which causes the Reynolds number to decrease from 5.67 × 10⁶ to 1.07 × 10⁶, the relative boundary layer thickness at the entrance of the inlet increases from 9.8% to 13.2%. Finally, the Reynolds number effect on the aerodynamics and starting characteristics caused by these two different factors are compared. The results show that the effect of scaling the model is similar to the effect of changing the altitude. As the relative boundary layer thickness increased by 1.0%, the total pressure recovery at the throat section decreased by 0.8%, and the inlet starting Mach number increased by 0.1.

1. Introduction

During the preliminary design phase of supersonic or hypersonic vehicles, computational fluid dynamic (CFD) calculation and wind tunnel tests are two main approaches to predict the aerodynamic characteristics, including lift, drag and pitch moment, of an aircraft [1,2]. During the ground test, the experimental model needs to be scaled down due to the limitation of wind tunnel size, which causes Reynolds number differences between ground tests and flight conditions. These differences in the Reynolds number may cause variation in aerodynamic characteristics. Therefore, CFD calculation is used to correct the ground test [3]. For a long time, great efforts have been made to improve the accuracy of CFD results compared to experimental tests [4]. Nowadays, CFD simulation is accurate enough to predict aerodynamic characteristics at different flight conditions. Meanwhile, it has been used to correct the results of ground tests [5,6,7].
The Reynolds number is a very important similarity criterion in the study of the correlation between flight conditions and ground wind tunnel tests. Jia et al. [8] proved that aerodynamic characteristics from wind tunnel tests are accurate enough to predict real flight conditions, even when the Reynolds number in the ground tests is 1~2 orders of magnitude lower than that in the flight conditions. The Reynolds number effect of external flow characteristics, including lift, drag and pitch moment, have been investigated extensively. Madi et al. [9] investigated cruise drag, pitching moments and the Reynolds number effects of an aircraft based on RANS technology. Recently, Fukushima et al. [10] used wall-modeled large-eddy simulations at realistic high Reynolds numbers (Rec ≈ 107) to investigate the Reynolds number effect on the airfoil flow fields. They qualitatively predicted the decrease in boundary layer thickness and increase in lift coefficient with the Reynolds number effect, and that a thin boundary layer thickness induces the backward displacement of the shock wave in a transonic case.
Since a hypersonic inlet couples the external and internal flow, it is often integrated with the hypersonic forebody [11]. During the hypersonic inlet ground tests, the inlet model should be scaled down based on the wind tunnel size. For instance, during the ground tests of the X-43A hypersonic vehicle, the experiment was scaled down 1:3 compared to the baseline model [12]; an F-15 aircraft inlet was scaled down 1:6 during the ground tests [13]. The Reynolds number effect of the sub-scale model will impact the aerodynamics and starting characteristics of the inlet [14]. Therefore, the scaling effect cannot be ignored during the investigation of a hypersonic inlet, especially in the estimation of the starting Mach number of the hypersonic inlet. A great deal of research has been conducted on the influence of the scale effect on the aerodynamic and starting characteristics of hypersonic inlets. Lin et al. [14] used numerical and wind tunnel tests to study the model-scaling effect on the starting Mach number of a hypersonic inlet. They found that, as the model scaled up to 1/10, the starting Mach number increased from 4.7 to 7.6. Wang et al. [15] studied the model-scaling effect on the aerodynamic performance parameters of a hypersonic inlet. The results indicated that, for the sub-scale model, the total pressure recovery decreased by 0.7% as the relative boundary layer thickness increased by 1.0%.
As mentioned previously, the Reynolds number of the wind tunnel test is 1~2 orders of magnitude lower than that of the flight conditions. These Reynolds number differences can be induced by the model scaling and inflow conditions. Therefore, we use a numerical simulation method to study the Reynolds number effect of these two different induced factors on the aerodynamic and starting characteristics of a two-dimensional hypersonic inlet.

2. Methods

The geometry of the two-dimensional hypersonic inlet is shown in Figure 1. It consists of two external compression ramps. The first ramp has an angle that starts at 4 deg and increases gradually to 8.5 deg with a length of 3.3 m. The second ramp has an angle that is 9.5 deg with a length of 2.6 m. The external contraction ratio of the hypersonic inlet is 3.63. The shock-on-lip condition is achieved at Mach number 6. The height of the inlet capture area is 1.28 m, and the throat height is 0.2 m, which results in a total contraction ratio of the hypersonic inlet of 6.4.
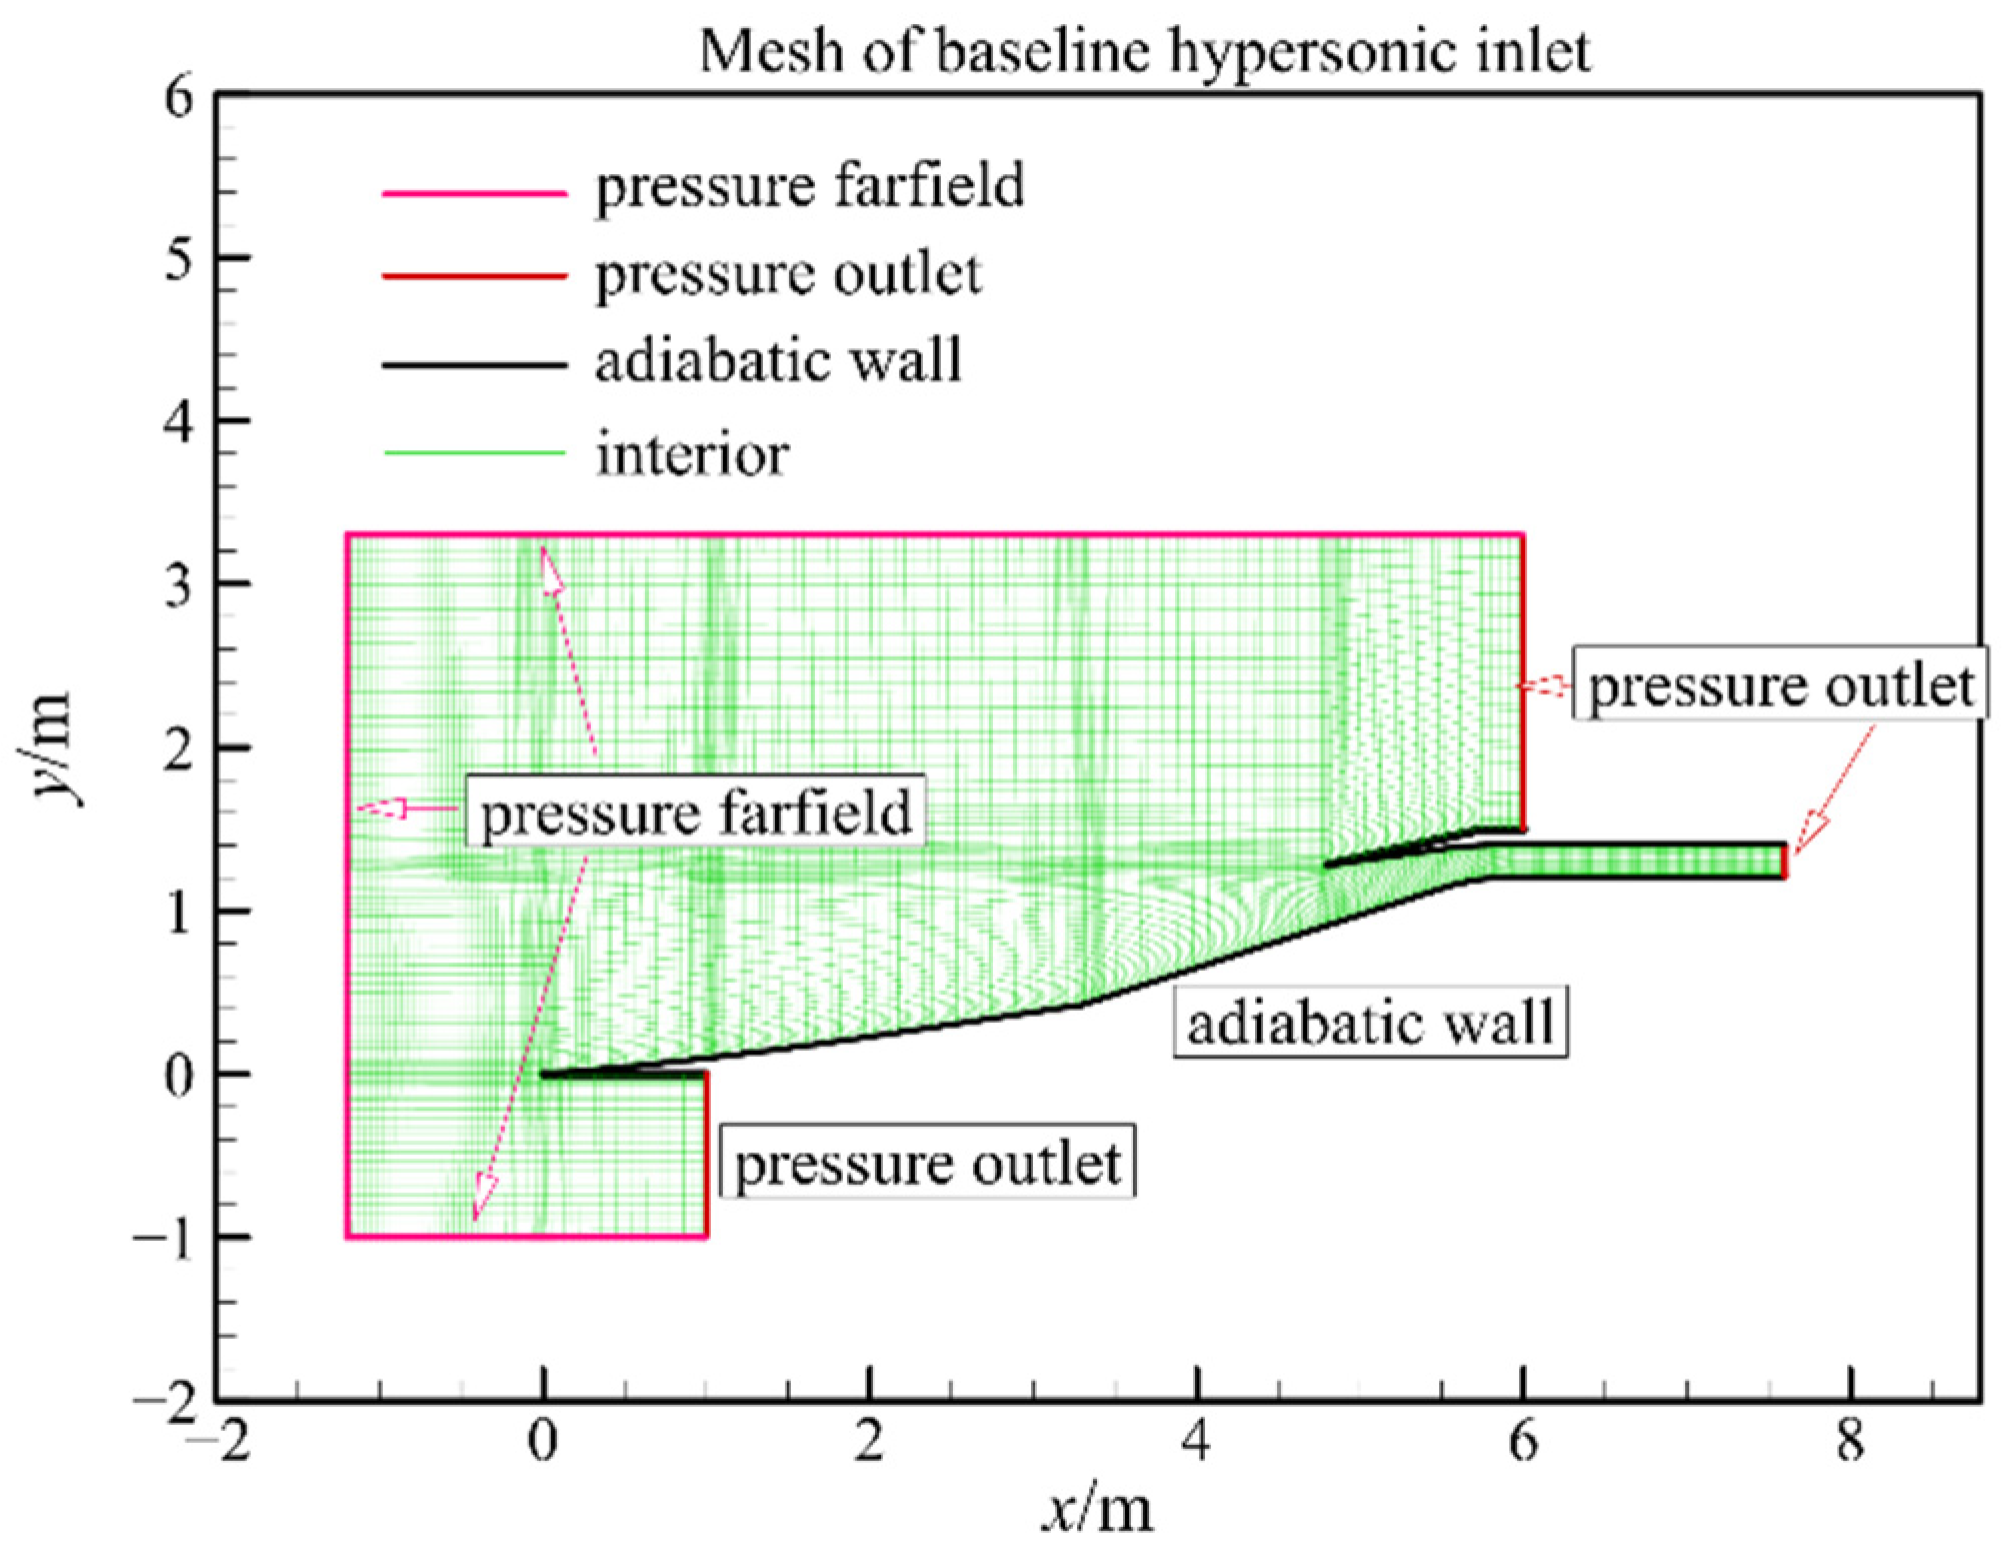
In this paper, a finite volume method is used to discretize the Reynolds-averaged Navier–Stokes equations. Inviscid flux is discretized through the Roe scheme based on MUSCL interpolation, and viscous flux is discretized through a second-order central difference scheme [16]. A point-implicit method is used in time marching. Turbulence flow is modeled with the k-ω SST turbulence model. Structure mesh is used in the hypersonic inlet; the total elements of the mesh are approximately 60,000. The mesh near the wall is refined, and the wall y+ is smaller than 1. The mesh and boundary conditions of the two-dimensional hypersonic inlet are shown in Figure 2. The inflow Mach number is 6.0 at an altitude of 26.5 km. The pressure farfield and pressure outlet boundary conditions are set according to the inflow conditions. The non-slip adiabatic wall boundary condition is used. The ideal gas model is used, and the viscosity is calculated based on the Sutherland equation. The convergence of simulation is determined by a decrease of at least 3 orders of magnitude in the residual of each equation, and the flow quantities are stable at critical sections [17].
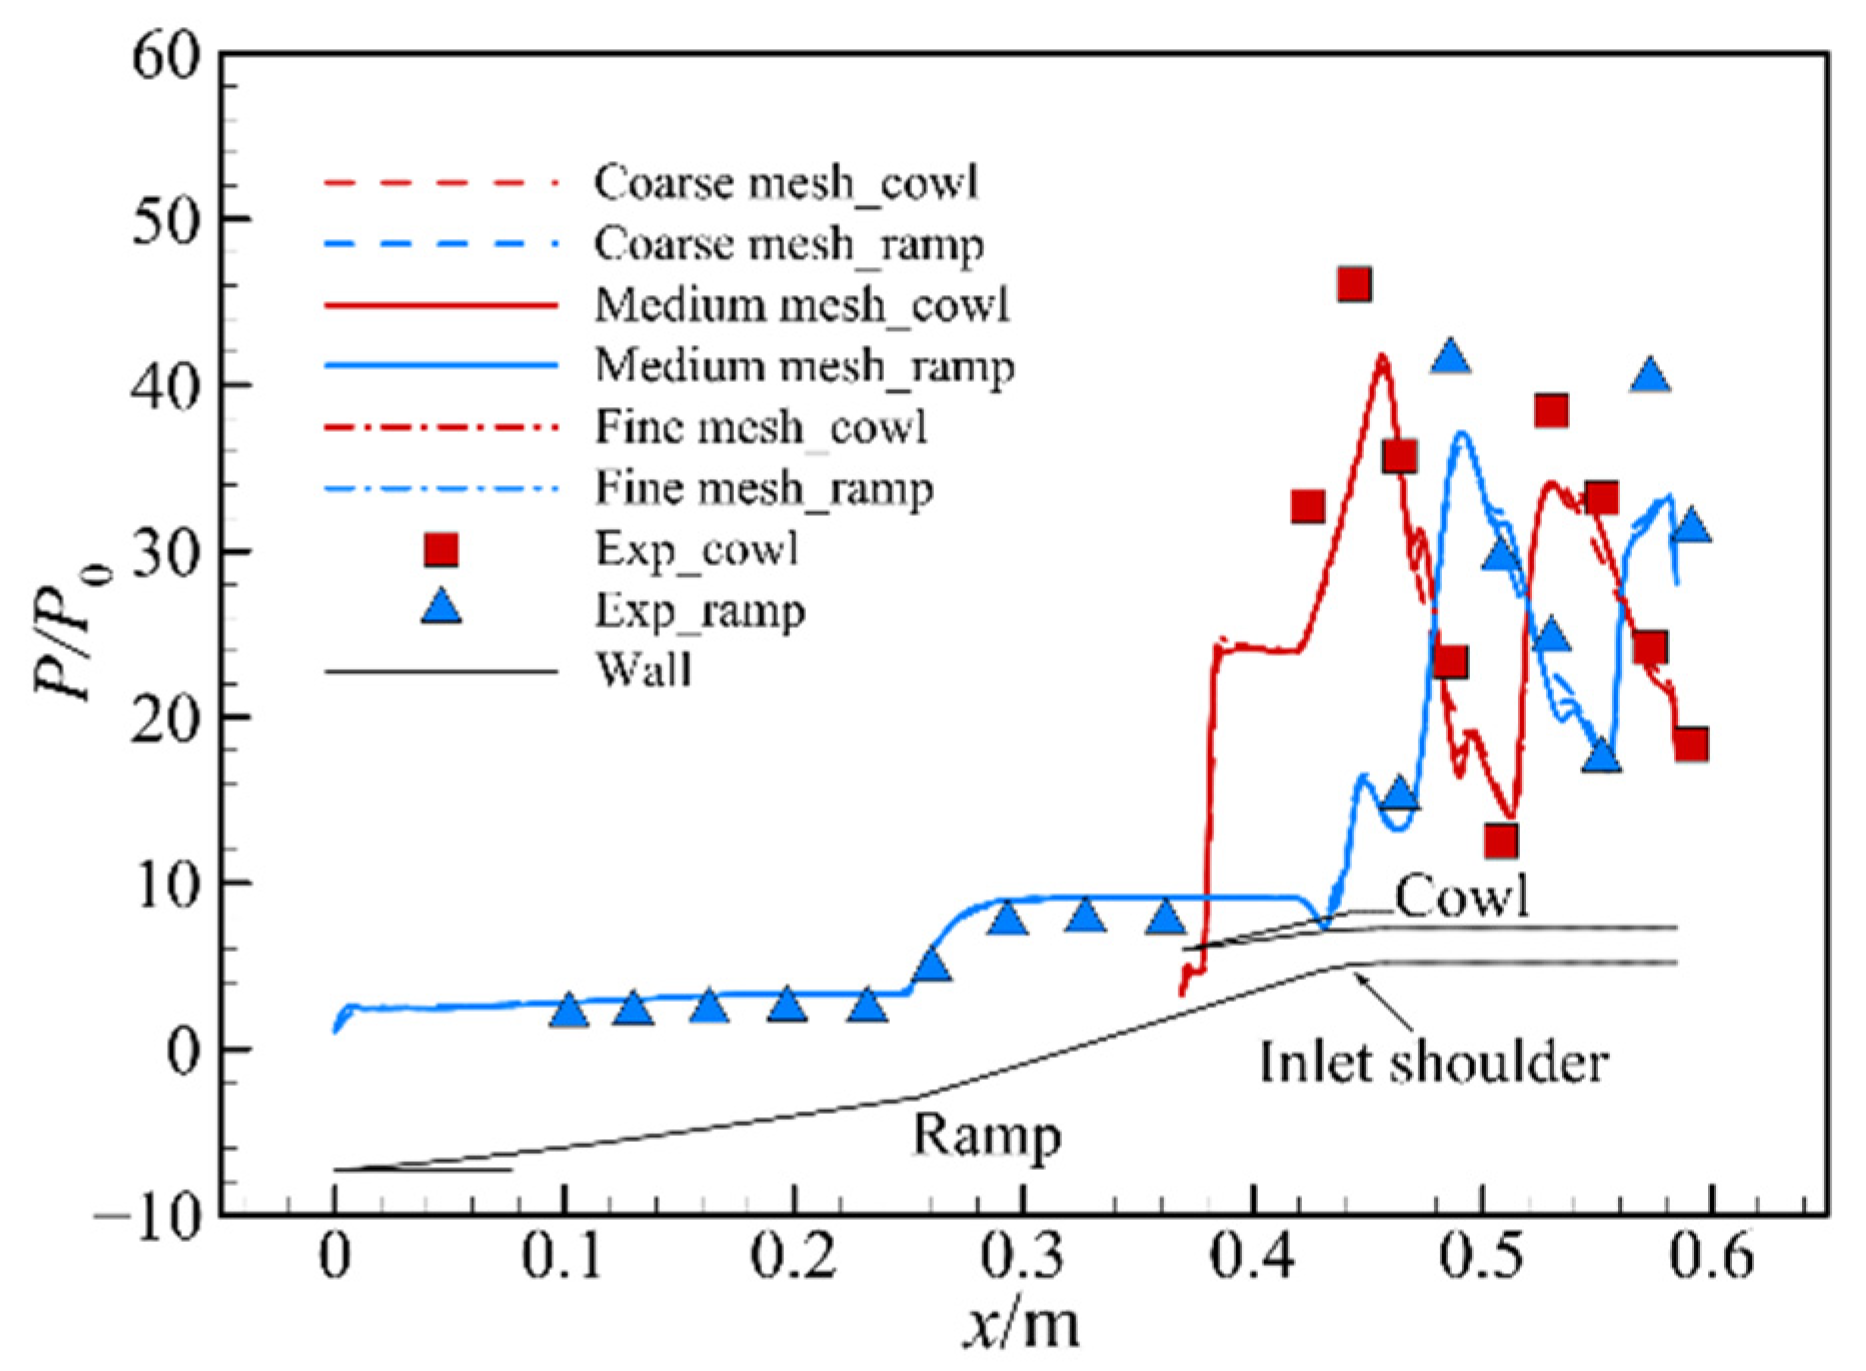
The experimental model was scaled down 1:13 from the baseline model shown in Figure 1. The comparison of the static pressure along the ramp and cowl side of the hypersonic inlet between the numerical simulation and experimental test is illustrated in Figure 3. The rectangle and triangle symbols represent the static pressure along the cowl side and the ramp side from the wind tunnel tests, respectively. Dash lines, solid lines and dash-dot lines represent the simulation results from the numerical simulation at mesh number ranges from 2000 to 10,000. The results from the numerical simulation agree well with those of the experimental test, including external oblique shocks and internal reflection shocks, which indicates that this method can be used to investigate the Reynolds number effect of the hypersonic inlet.

3. Results

During the wind tunnel tests, geometric and kinematic similarities with the flight tests can be guaranteed. As we know, the criterion of kinematic similarity is Mach number. It is similar to the flight condition in the wind tunnel test. However, dynamic similarity is not easily satisfied because of the limitation of the wind tunnel cross-section size. The criterion of dynamic similarity is the Reynolds number. Therefore, we focus on the influence of the Reynolds number caused by model scaling and inflow conditions on the aerodynamic and starting characteristics of a two-dimensional hypersonic inlet.

3.1. Model Scaling on Two-Dimensional Hypersonic Inlet Aerodynamic Characteristics

The baseline model of the two-dimensional hypersonic inlet model is 7.6 m in length. The model scaling ratios studied in this paper are 1/2, 1/5, 1/10, 1/20 and 1/50 of the baseline model. The inflow Mach number is 6.0 at a flight altitude 26.5 km. The capture height of the hypersonic inlet is used as the characteristic length during the calculation of the Reynolds number. The Reynolds numbers ranging from 9.71 × 10⁴ to 4.86 × 10⁶ at different model scaling ratios are shown in Table 1.
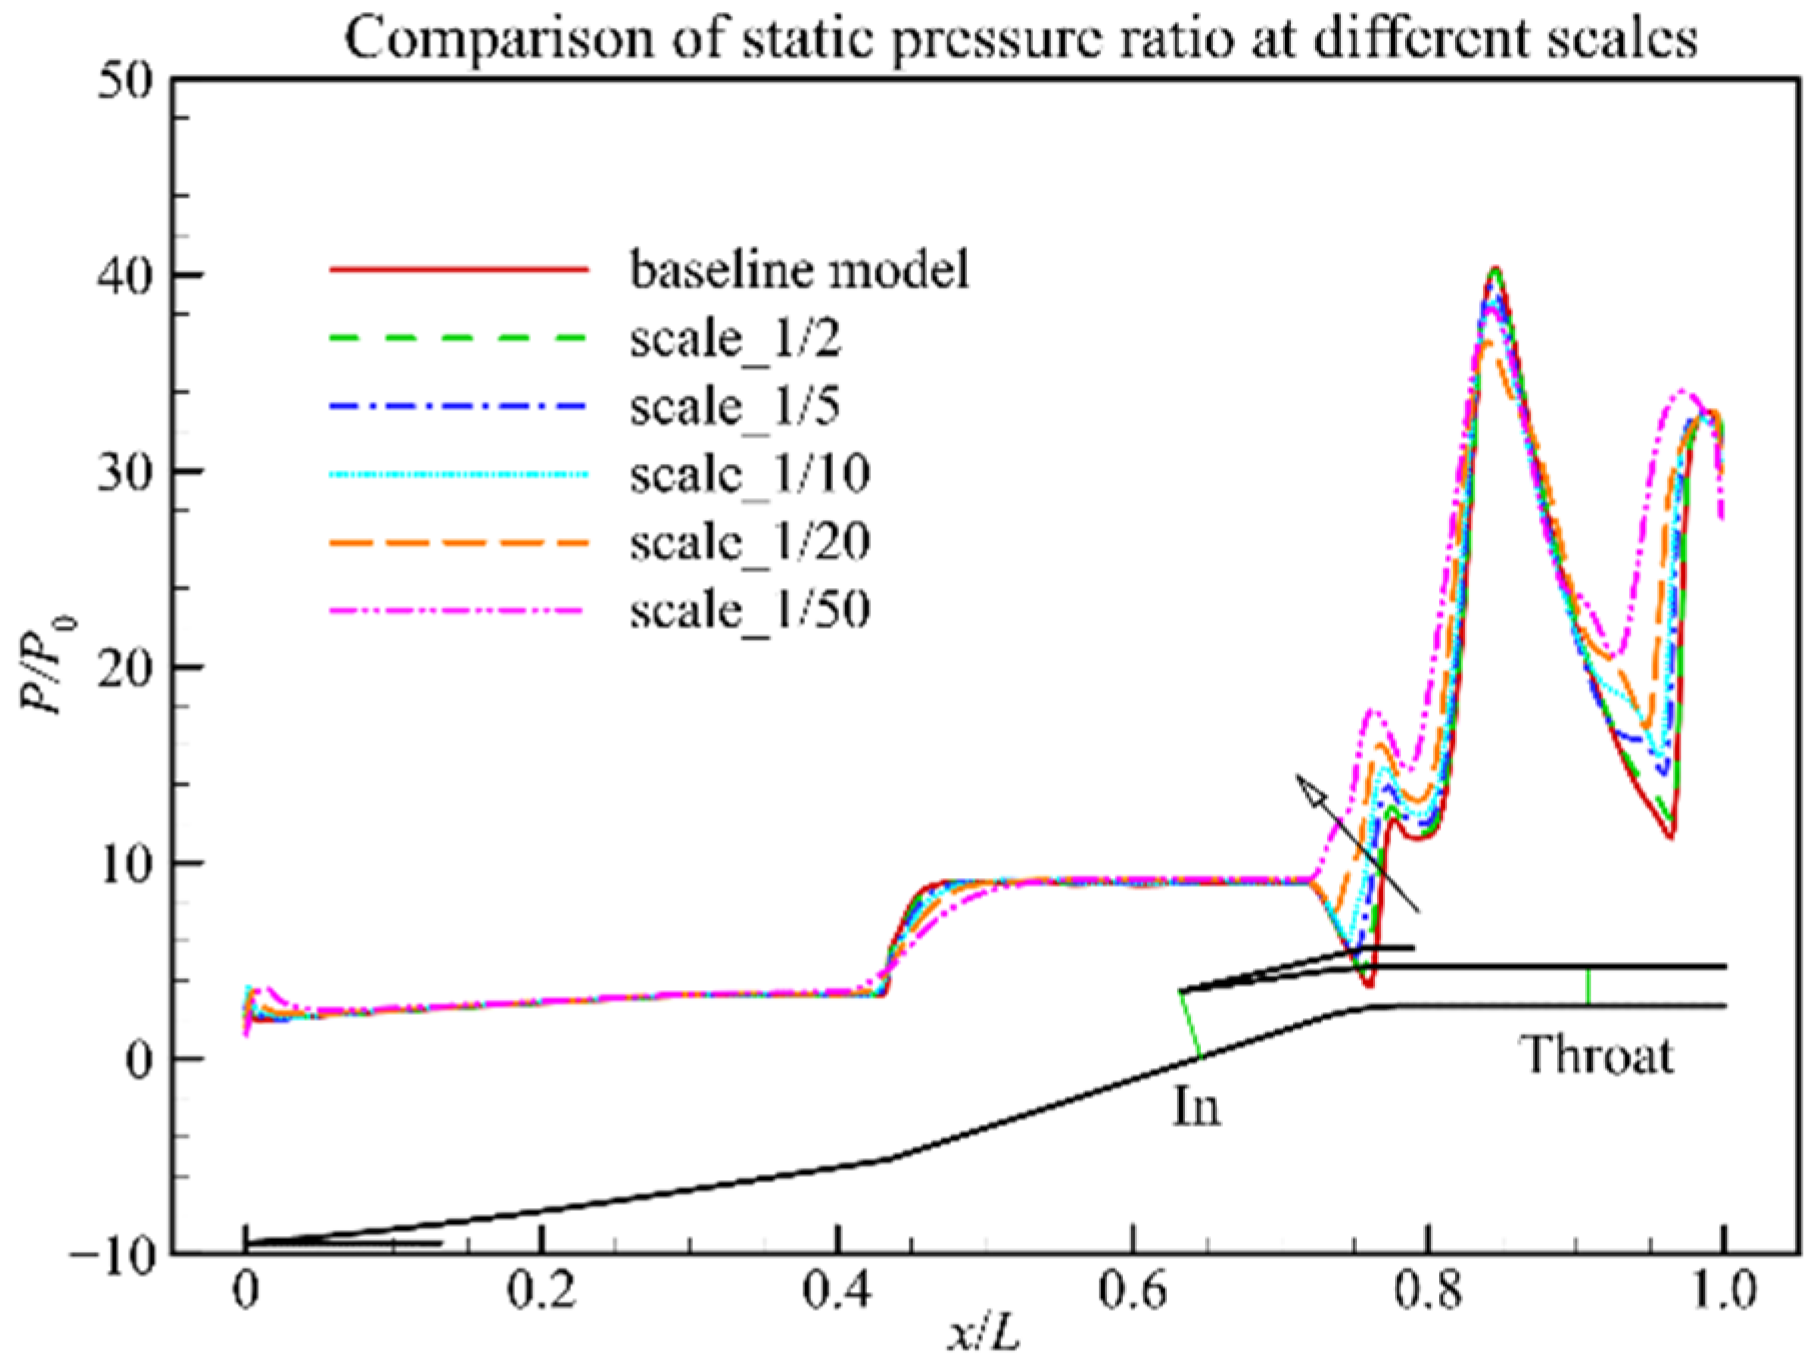
The Mach number contour at two different scales is shown in Figure 4. As illustrated in Figure 4a, the shock-on-lip condition is achieved in the baseline hypersonic inlet model, and the reflection shock from the cowl lip incline at the shoulder of the hypersonic inlet reflects between the upper and lower walls of the hypersonic inlet. According to this Mach number contour, there is no separation bubble at the inlet shoulder downstream of the incident oblique shock. The Reynolds number decreases with the model scaling, indicating that the viscosity effect increases gradually. Therefore, the relative boundary layer thickness of the hypersonic inlet increases and results in the intense shock/boundary layer interaction [10,19]. As shown in Figure 5, the static pressure along the ramp side of the hypersonic inlet is compared at model scaling from 1 to 1/50. The major difference of static pressure appears at the shoulder of the hypersonic inlet where the shock/boundary layer interaction occurs. There is no separation bubble at the hypersonic inlet shoulder at high Reynolds numbers. The supersonic flow accelerates, and static pressure decreases during the shoulder of the supersonic inlet. The relative boundary layer thickness increases with model scaling. A separation bubble appears at the hypersonic inlet shoulder. The separation bubble size increases as the Reynolds number decreases. The expansion fan at the hypersonic inlet shoulder disappears gradually. As shown in Figure 4b, at a Reynolds number of 9.71 × 10⁴, the expansion fan disappears, and the separation bubble at the shoulder induces a separation shock, which causes the static pressure to increase in this area. As the separation reattaches, an expansion fan occurs, and the static pressure decreases mildly.
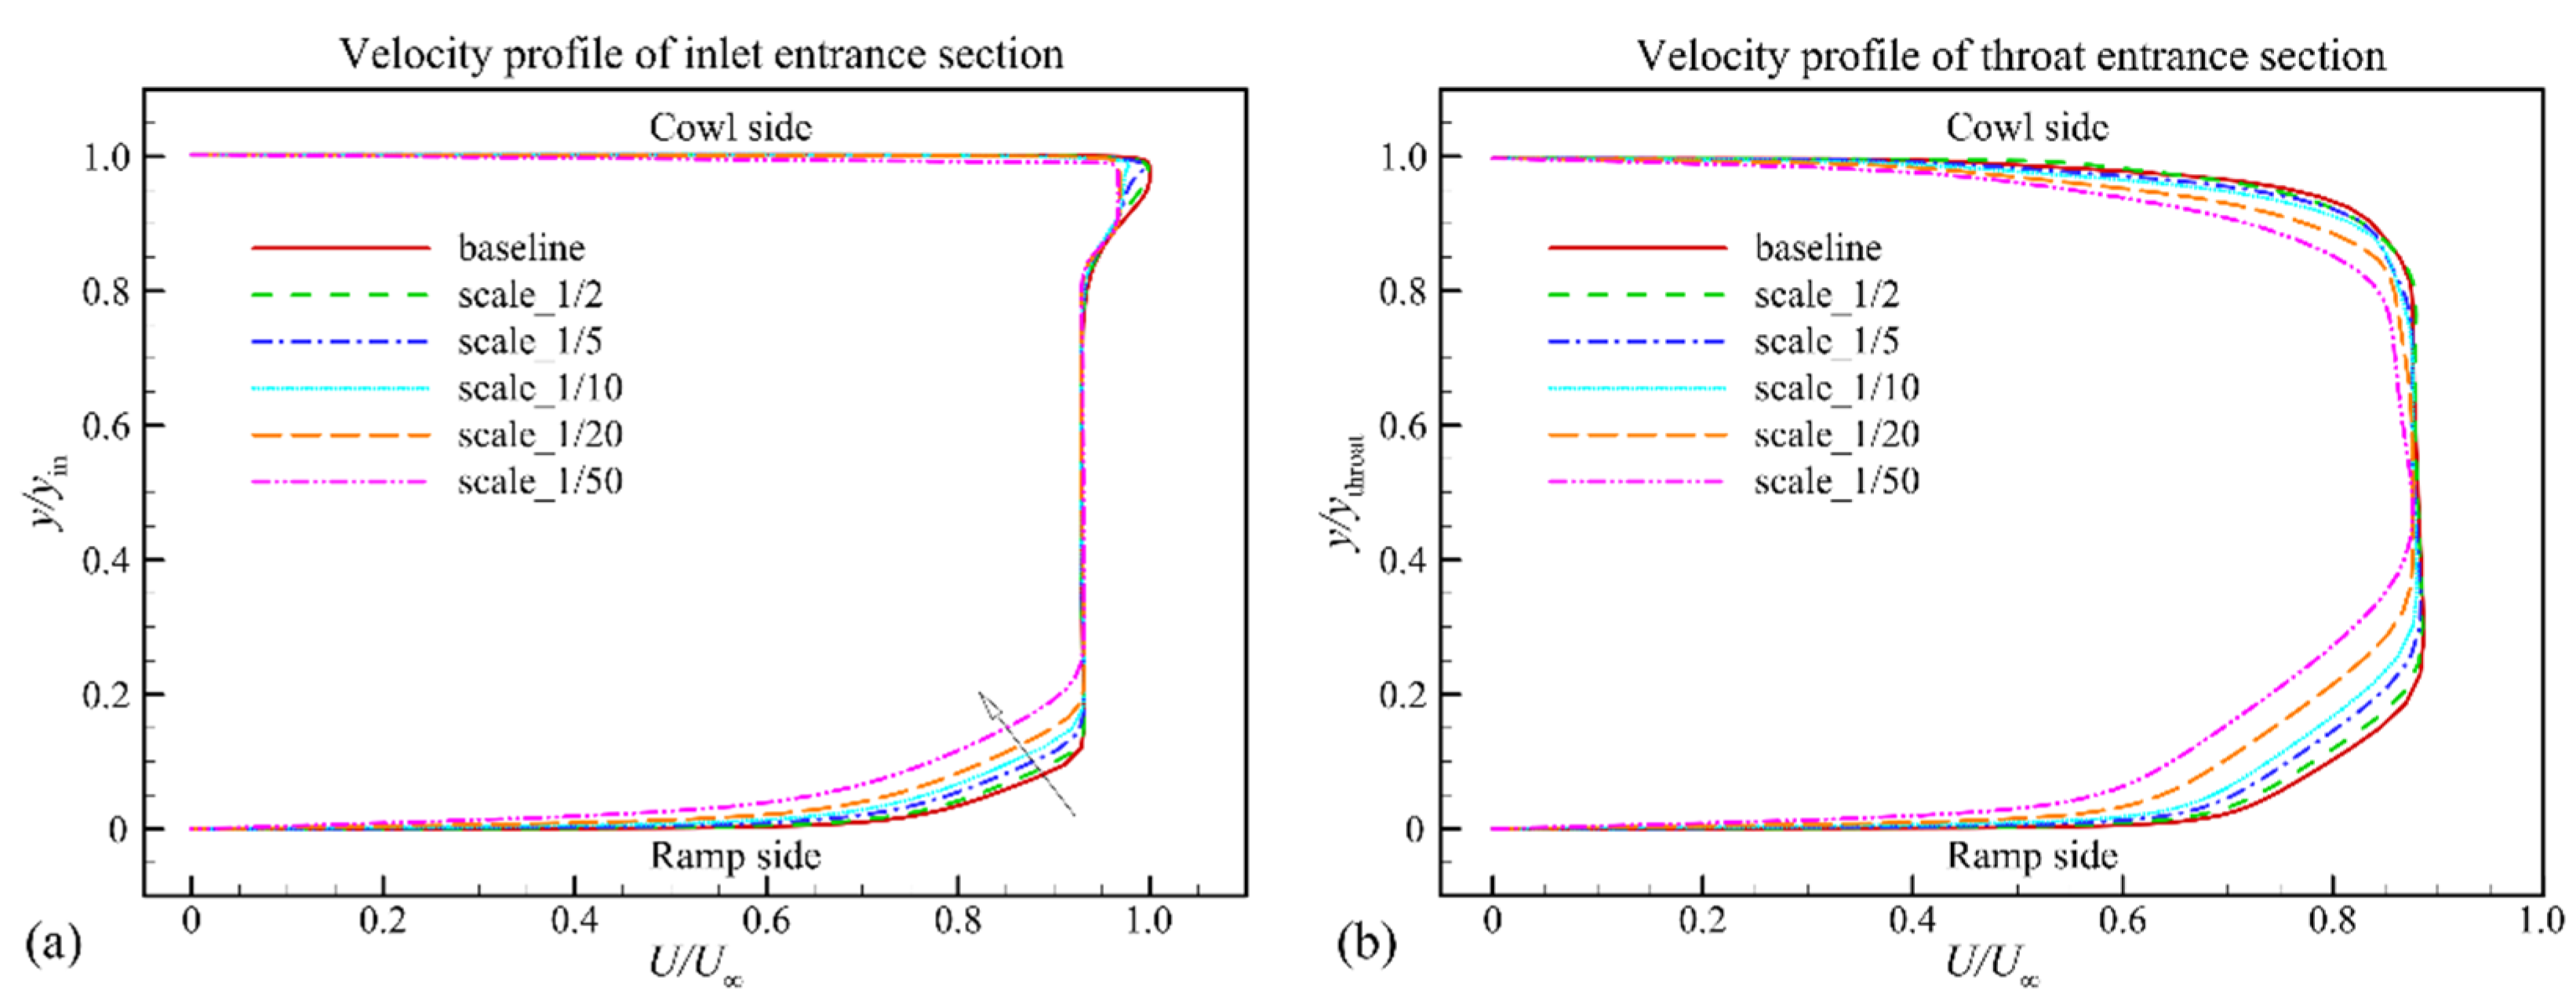
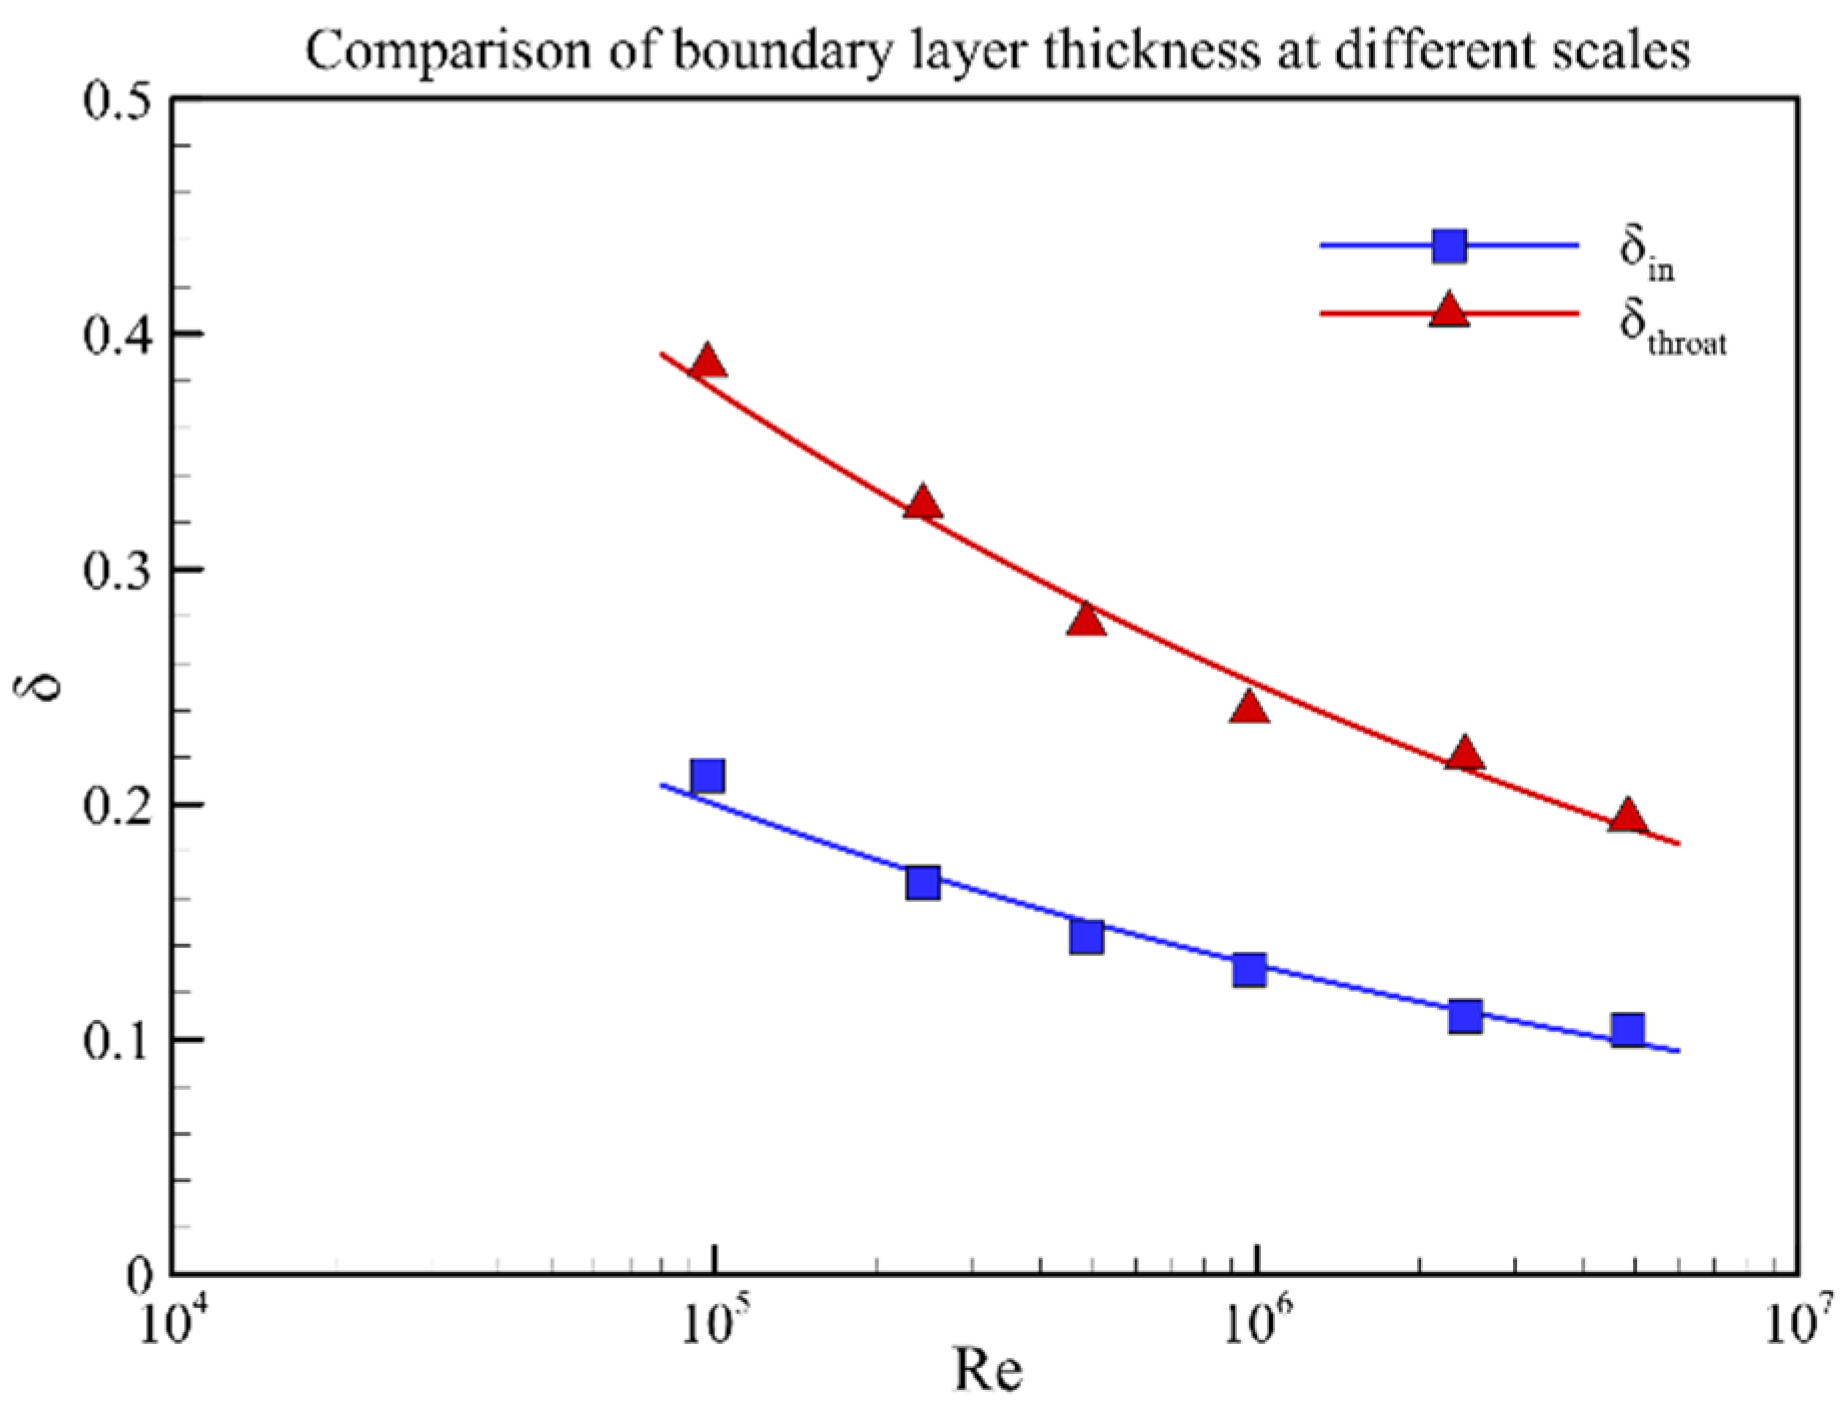
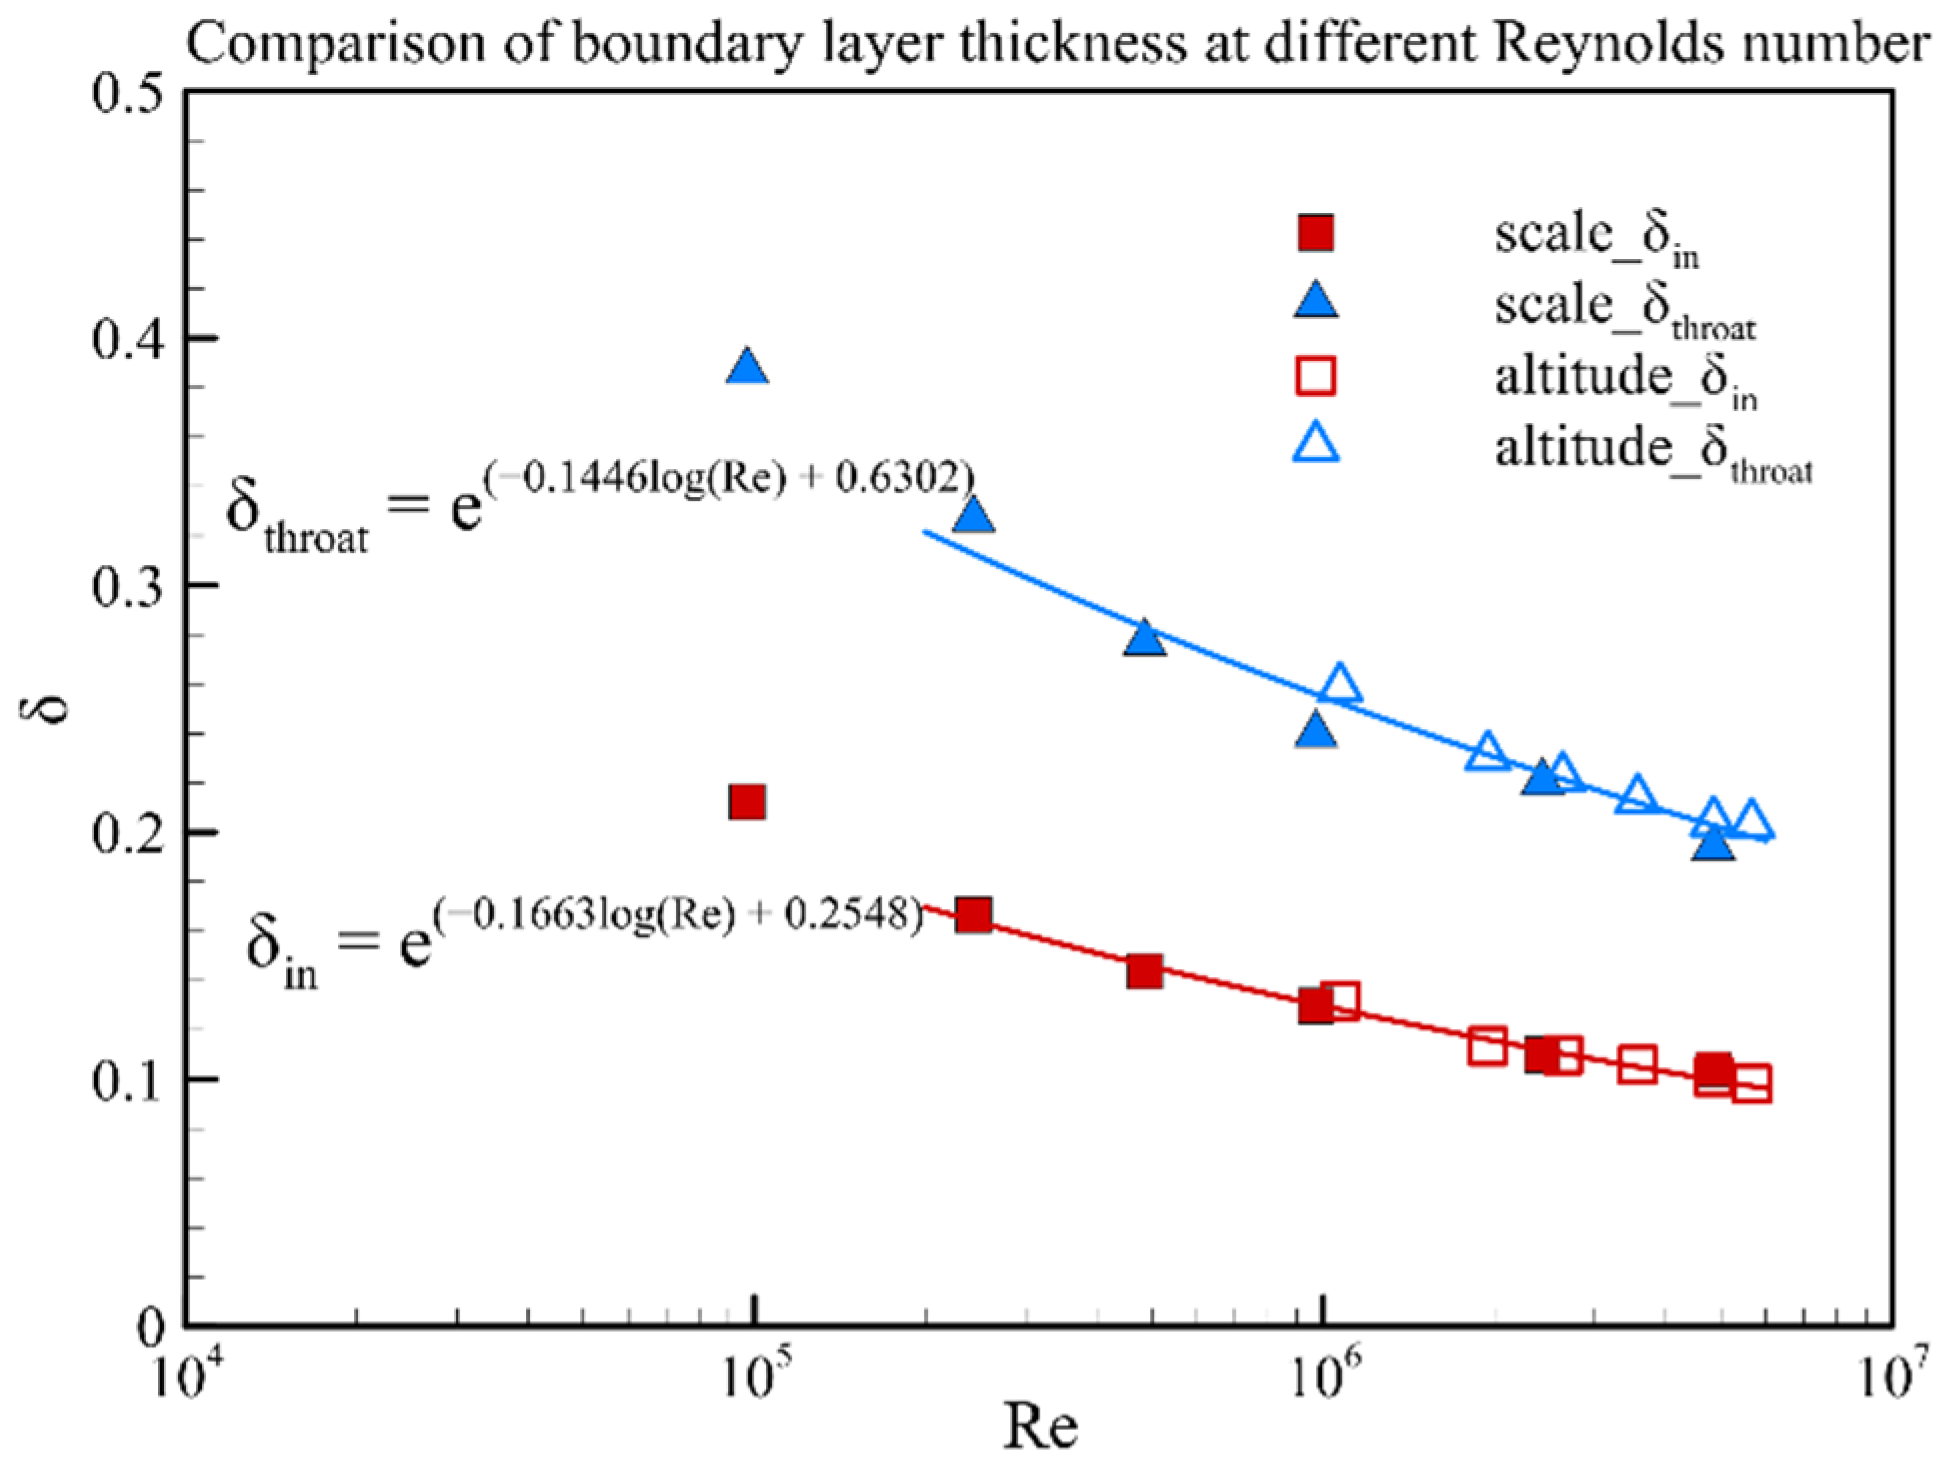
According to previous analysis, the Reynolds number difference caused by model scaling leads to the difference in relative boundary layer thickness. Therefore, the velocity profiles of different model scaling are analyzed, especially for the difference near the ramp side of the hypersonic inlet. The velocity profiles at the inlet entrance and throat sections of the hypersonic inlet are illustrated in Figure 6. The detail position of these two sections is shown in Figure 5. The relative boundary layer thickness of the entrance section increases from 10% to 20% with the model scaling; meanwhile, it is double at the throat section. The boundary layer thickness at different scales is then calculated based on the definition of boundary layer thickness. The results at the inlet and throat sections are shown in Figure 7. It is obvious that the relative boundary layer thickness at the throat section is more sensitive than the inlet section to inflow Reynolds number.
As we know, the development of the boundary layer will increase the angle of flow defection and, thus, the oblique shock angle. This will affect the mass flow ratio φ of the hypersonic inlet, which is defined as Equation (1). It is used to evaluate the capture ability of the hypersonic inlet,
φ = m . e m . c
where m . e indicates the mass flow at the throat section, and m . c indicates the mass flow captured by the inlet, theoretically [20]. Meanwhile, with the increasing of the proportion of boundary layer, the low momentum flow increases; this will reduce the total pressure recovery coefficient σ at the throat section, which is defined as Equation (2),
σ = P e P 0
where P e is the mass-weighted total pressure at the throat section, and P 0 is the free-stream total pressure [20].
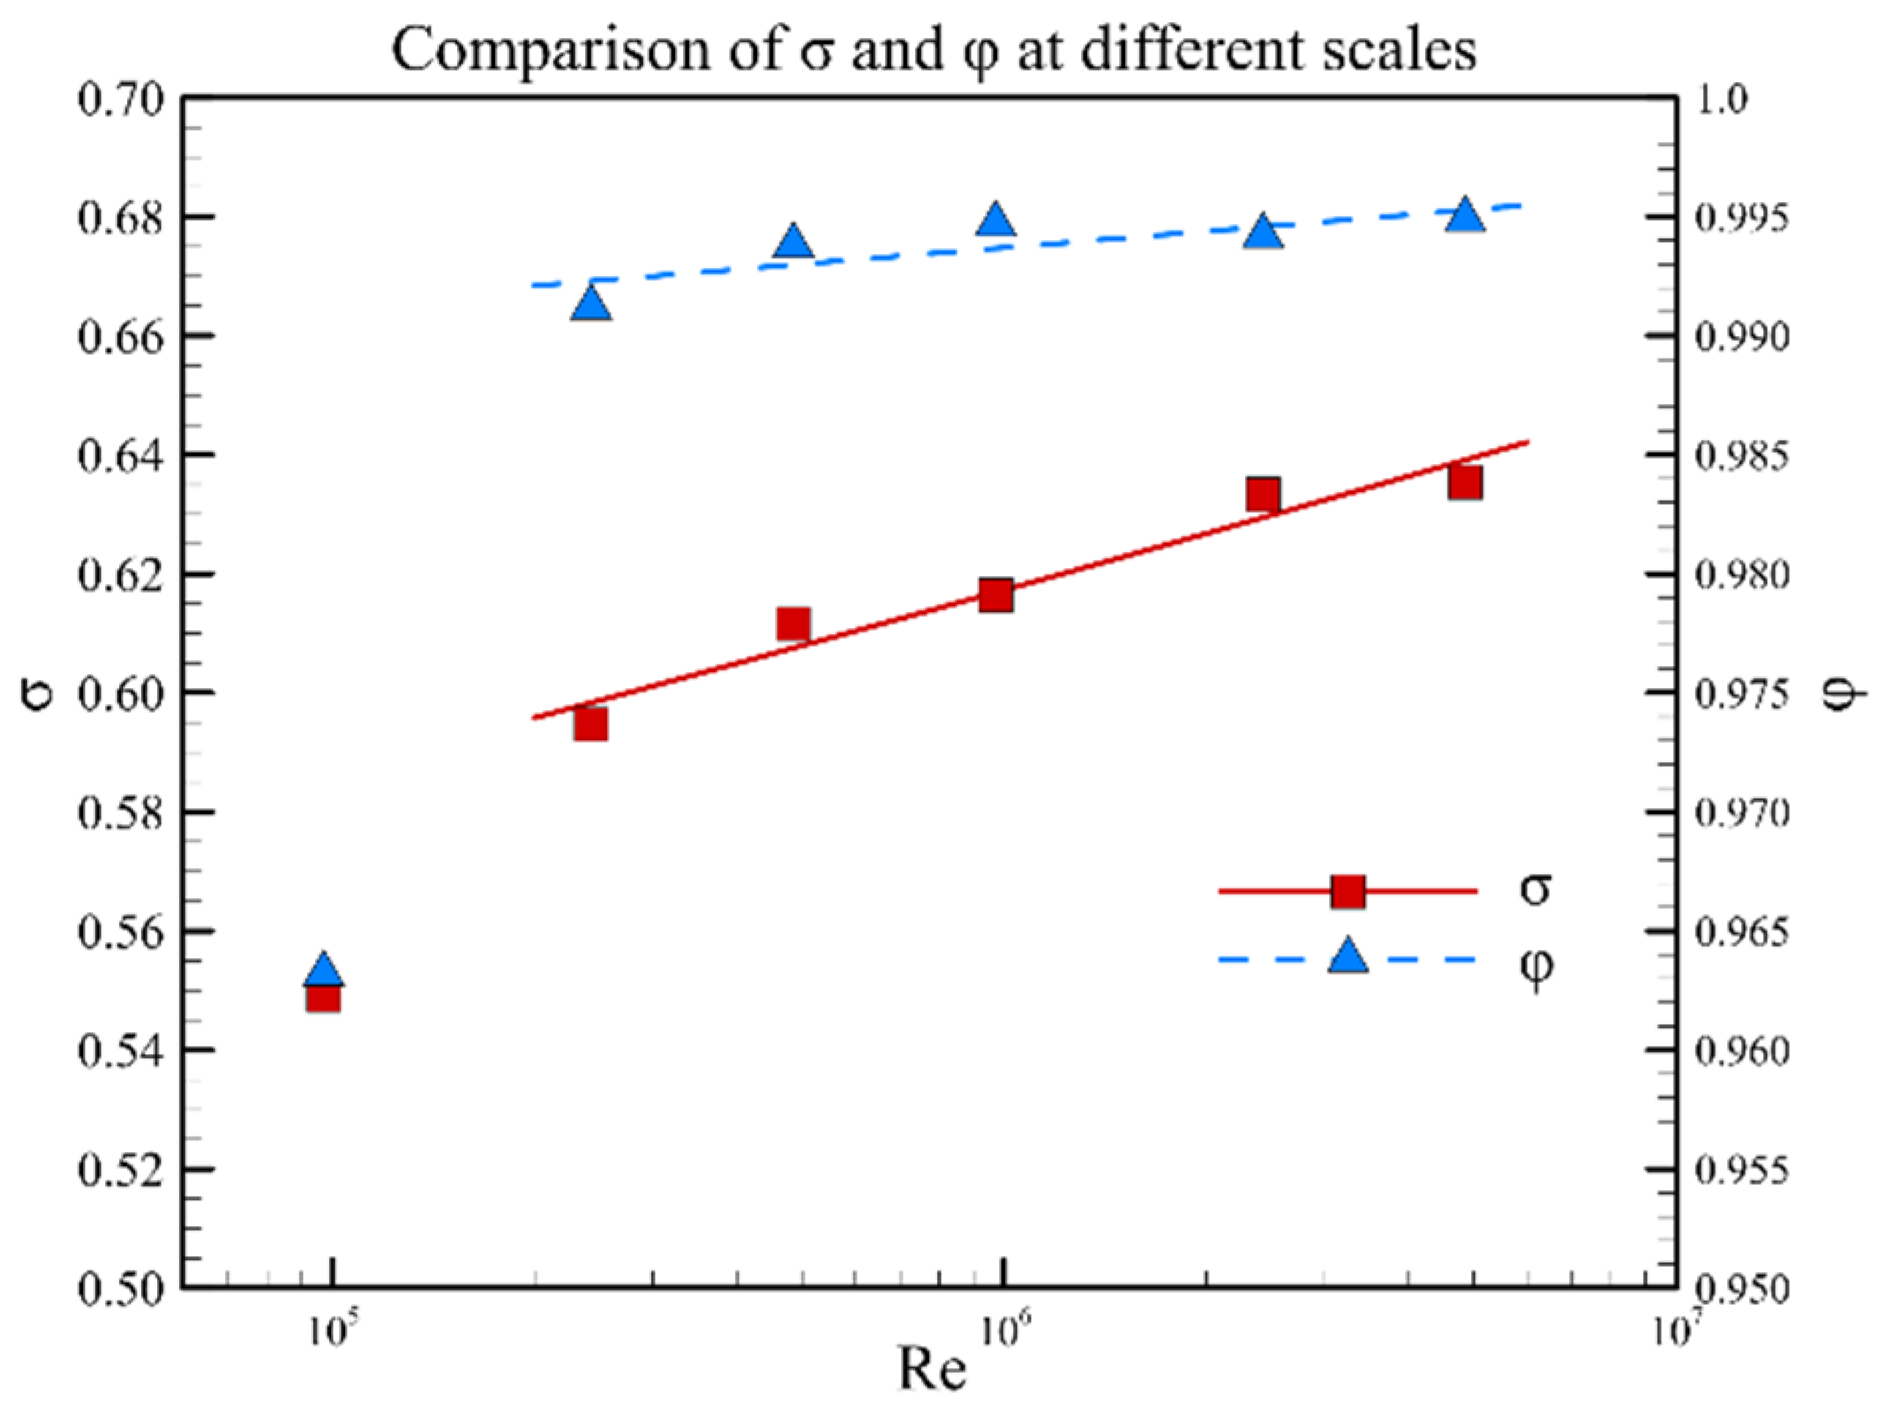
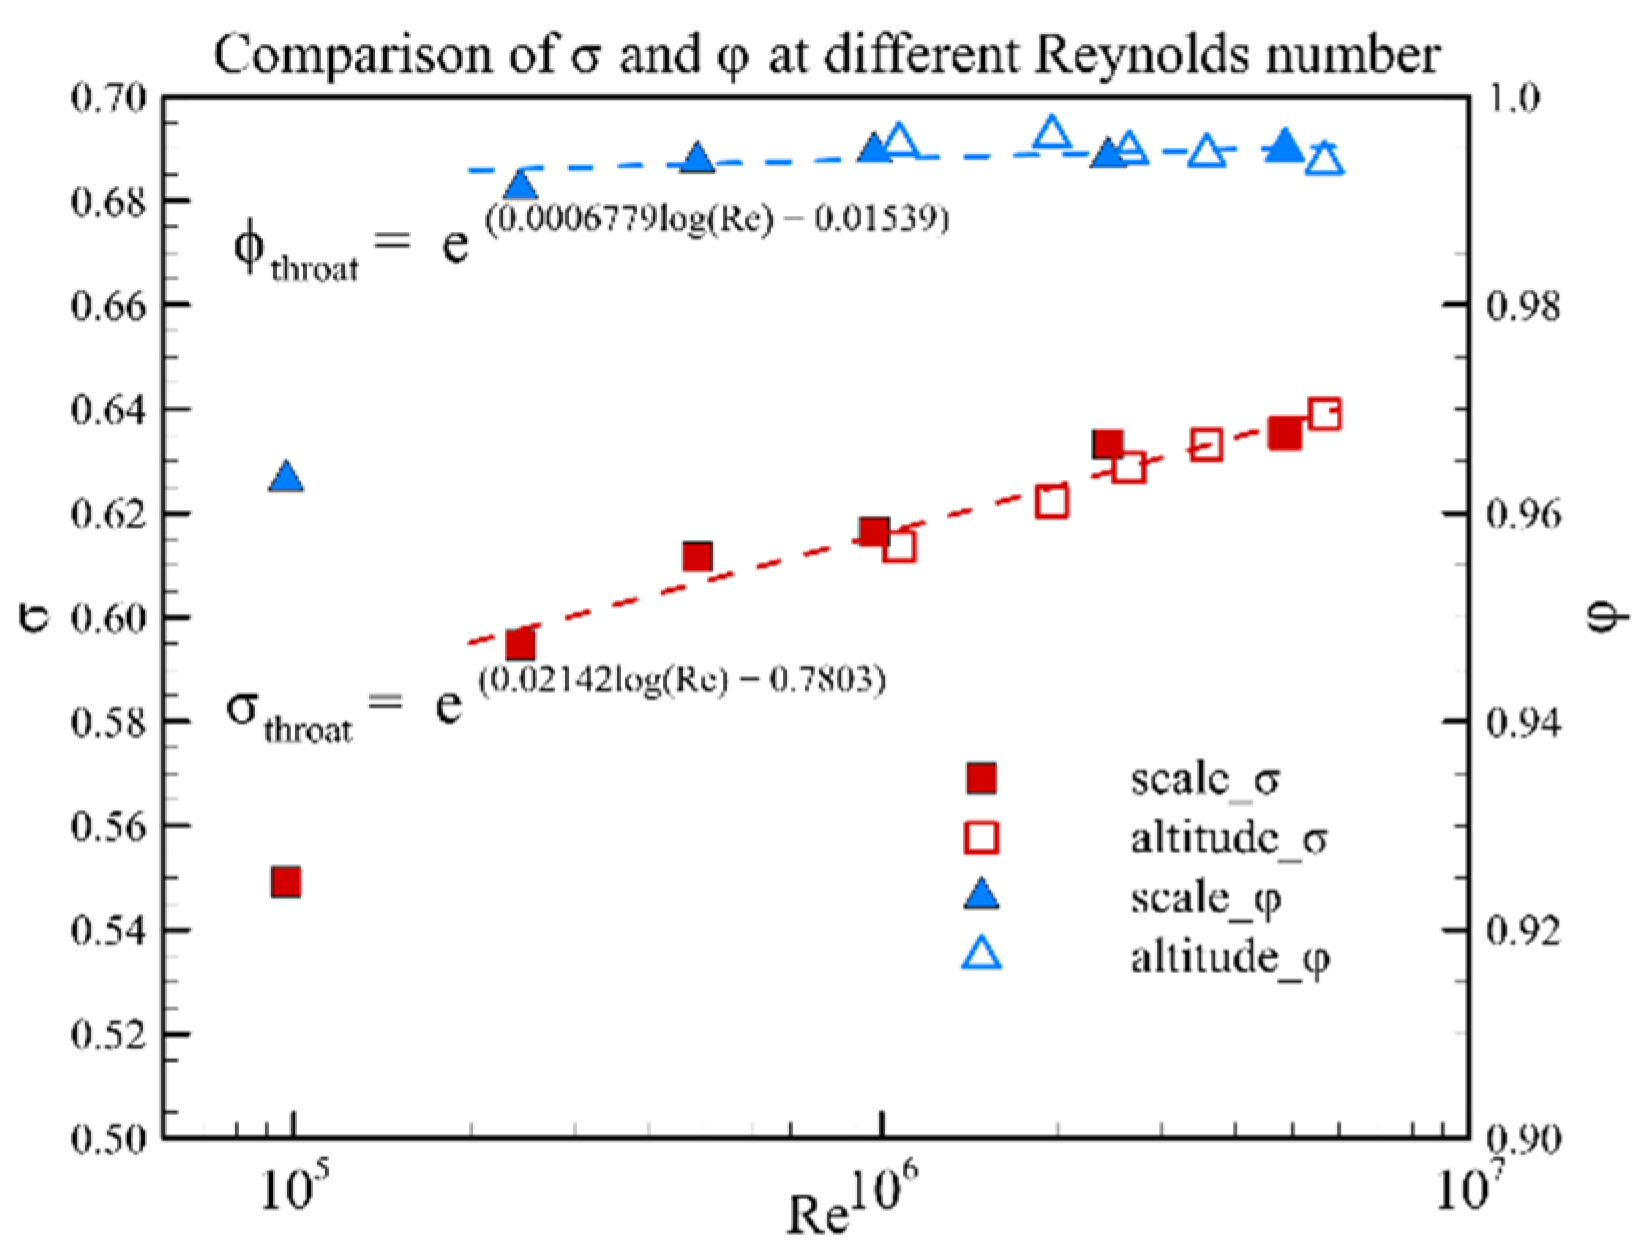
The results of the mass flow ratio and total pressure recovery at different Reynolds numbers are illustrated in Figure 8. The mass flow ratio is not sensitive to the Reynolds number with only 0.5% variation at different Reynolds numbers. However, the total pressure recovery is more sensitive to the Reynolds number. With an increase of the Reynolds number from 2.0 × 10⁵ to 6.0 × 10⁶, the total pressure recovery coefficient of the throat section increases from 0.59 to 0.64, and the variation is approximately 7%. During the curve fitting of the total pressure recovery and mass flow ratio in Figure 8, the results below 1 × 10⁵ are discarded because the flow pattern at this condition (Figure 4b) is different from other states.
As shown previously, the Reynolds number has a significant effect on boundary layer development, and this effect on the aerodynamic characteristics of the hypersonic inlet has been illustrated. Next, this effect on the starting Mach number of the hypersonic inlet will be discussed. As we know, if the inflow Mach number is lower than the inlet starting Mach number, the inlet will unstart; then, it will suffer from an abrupt reduction in captured airflow and total pressure efficiency and an abrupt increase in aerodynamic loads and thermal loads [21]. Therefore, the starting Mach number is another important characteristic of a hypersonic inlet.
The starting Mach number is determined by running multiple CFD simulations at inflow Mach numbers from 3.0 to 5.0 with an interval of 0.05 and finding at which point the inlets start. The starting Mach number of the baseline model is Ma 3.45, and the numerical schlieren at the starting Mach number is shown in Figure 9a. From the enlarged figure on the top left, we find that, as a shock from the cowl lip inclines at the shoulder of the hypersonic inlet, a separation bubble appears. This separation bubble induces a separation shock upstream of the separation bubble and a reattach shock downstream of the separation bubble. As the model is scaled down 1:50, the starting Mach number increases up to Ma 4.5, and the numerical schlieren is shown in Figure 9b. The relative boundary layer upstream of the incident shock is thicker than the baseline model and, under a more intense pressure gradient than baseline, results in a larger separation bubble size. The starting Mach numbers at different model scales are shown in Table 2.

3.2. Inflow Conditions on Two-Dimensional Hypersonic Inlet Aerodynamic Characteristics

In the last section, the effect of the Reynolds number variation induced by model scaling on the hypersonic inlet aerodynamic characteristics are studied. In this section, we investigate flight altitude impact on the aerodynamic characteristics. The inflow Mach number is 6.0, and the flight altitude varies from 25.5 km to 36.5 km with the Reynolds number decreasing from 5.67 × 10⁶ to 1.07 × 10⁶. The Reynolds number variation induced by the flight altitude is smaller than that of model scaling. Therefore, its impact on the hypersonic inlet would be milder. According to the static pressure along the ramp side at different altitudes (Figure 10), the flow acceleration phenomenon at the inlet shoulder exists at different flight altitudes, and there is no flow separation.
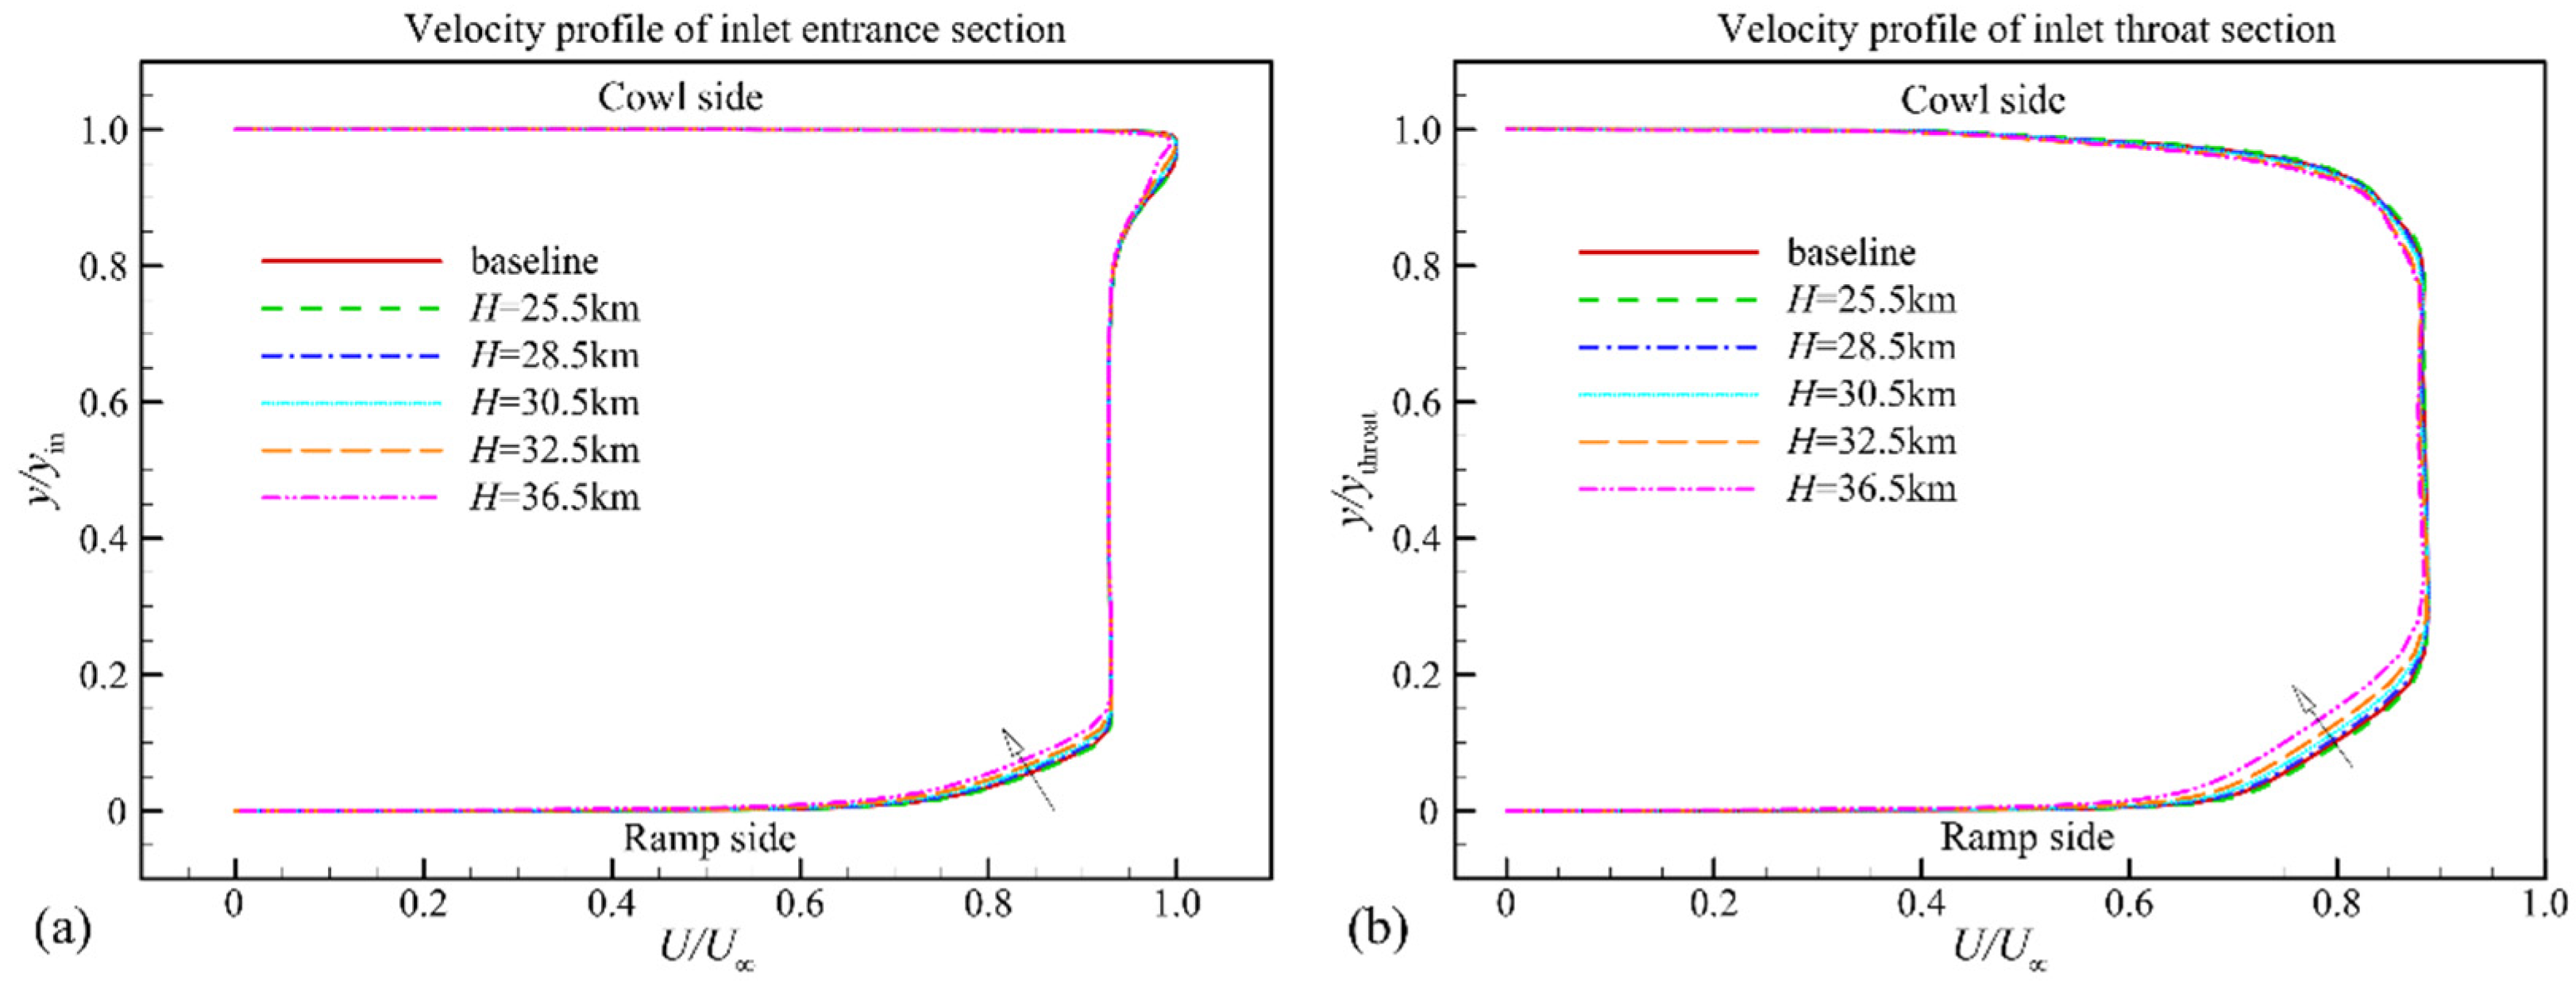
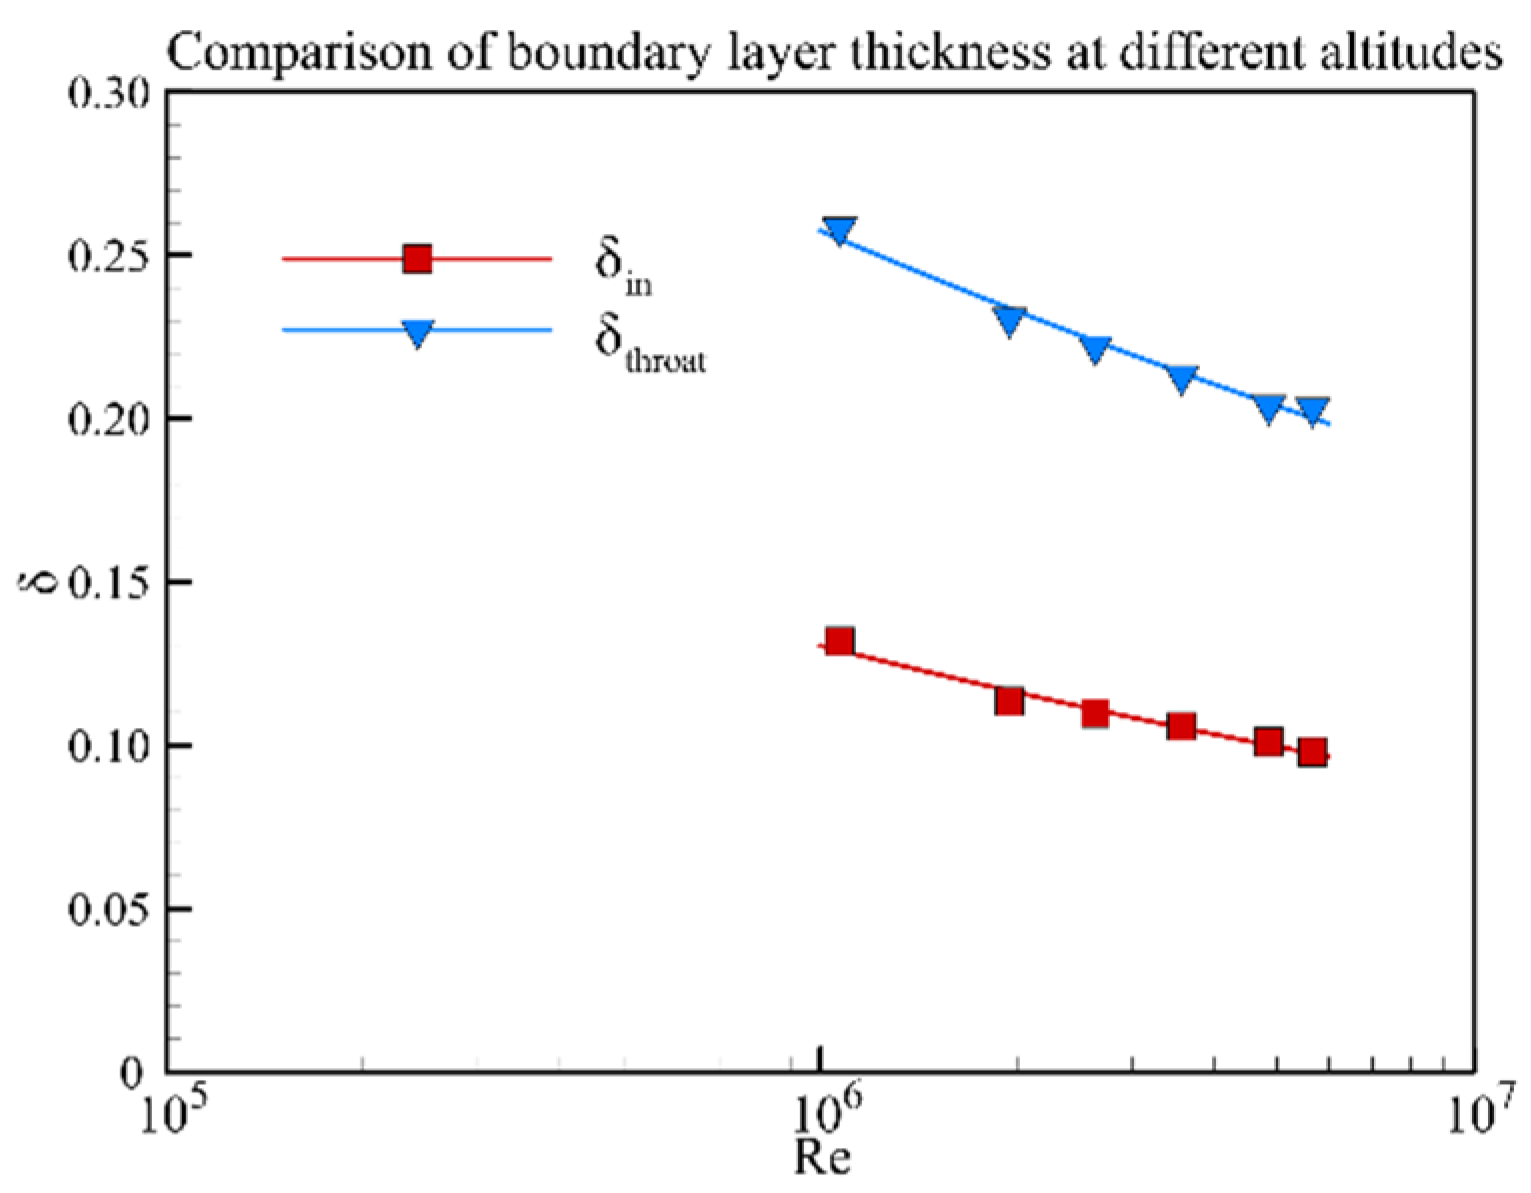
As the flight altitude increases, the Reynolds number decreases and the relative boundary layer thickness into the inlet entrance and throat section increases. These changes will lead to the aerodynamic difference in the hypersonic inlet. First, the flow profiles at the entrance and throat sections of the inlet are shown in Figure 11. The relative boundary layer thickness at the entrance section increases from 10% to 13% with flight altitude and, at the throat section, it is nearly twice that of the entrance section. Then, the boundary layer thickness at different altitudes is calculated based on these velocity profiles. The results are shown in Figure 12. The relative boundary layer thickness of the throat section is approximately twice that of the entrance section from Figure 12. Finally, the impact of the flight altitude on the aerodynamic characteristics, including mass flow ratio and total pressure recovery, are illustrated in Figure 13. The mass flow ratio is not sensitive to the Reynolds number in a certain range, while the total pressure recovery is more sensitive. As the Reynolds number decreases from 6.0 × 10⁶ to 1.0 × 10⁶, the total throat pressure recovery coefficient decreases from 0.64 to 0.61, and the variation is approximately 4%.
As shown previously, the Reynolds number has a significant effect on boundary layer development, and this effect on the aerodynamic characteristics of the hypersonic inlet has been illustrated. Next, this effect on the starting Mach number of the hypersonic inlet will be discussed. The starting Mach number at 25.5 km is Ma 3.4, and the numerical schlieren at the starting Mach number is shown in Figure 14a. From the enlarged figure, we can find that, as a shock from the cowl lip inclines at the shoulder of the hypersonic inlet, a separation bubble appears. This separation bubble induces a separation shock upstream of the separation bubble and a reattach shock downstream of the separation bubble. As the flight altitude increases up to 36.5 km, the starting Mach number increases up to Ma 3.7, and the numerical schlieren is shown in Figure 14b. There is only a slight difference in the flow fields between the two different altitudes. The starting Mach numbers at different flight altitudes are shown in Table 3.

4. Discussion

The effect of the Reynolds number caused by the model scale and flight altitude on the aerodynamic and starting characteristics of a two-dimensional hypersonic inlet are analyzed previously. The detailed aerodynamic characteristics, including the velocity profiles at the entrance and throat sections, relative boundary layer thickness at these two sections, performance parameters and starting Mach number are analyzed. The influence of the Reynolds number caused by the model scaling and flight altitude on the relative boundary layer thickness of the inlet is compared. The results are shown in Figure 15. The solid symbols represent the result from model scaling, and the open symbols represent the result from flight altitude. The solid lines represent the curve fitting of the relative boundary layer thickness at different Reynolds numbers. The results indicate that the Reynolds number effect on the relative boundary layer thickness induced by different factors follows the same trend.
The inlet performance and starting Mach number at different Reynolds numbers are shown in Figure 16 and Figure 17. When the Reynolds number is less than 1.0 × 10⁵, the value of the parameters is quite different from other Reynolds numbers. The main reason is that the flow field is significantly different from other Reynolds numbers. As illustrated in Figure 4b, an obvious separation bubble appears at the inlet shoulder at this Reynolds number. As shown in Figure 18, the unit Reynolds number varies at different flight trajectories. The symbols with solid lines represent the flight trajectory and the unit Reynolds number at dynamic pressures of 30 kPa. The symbols with dash lines represent the flight trajectory and the unit Reynolds number at dynamic pressures of 50 kPa. The unit Reynolds number of the inflow is between 1.0 × 10⁶ and 2.0 × 10⁷ during flight conditions. Therefore, the Reynolds number at flight conditions would be larger than 1.0 × 10⁵. Based on this fact, we discard the value when the Reynolds number is lower than 1.0 × 10⁵.

5. Conclusions

The Reynolds number effect induced by model scaling and flight altitude on the aerodynamic and starting characteristics of a two-dimensional hypersonic inlet is studied by a numerical simulation method. The results indicate that:
  • The inflow Reynolds number decreased from 4.86 × 10⁶ to 9.71 × 10⁴ as the model scaling increased from 1 to 1/50. This resulted in an increase in the relative boundary layer thickness of the inlet entrance section from 10.4% to 21.2%. Thus, the inlet shoulder separation bubble size increased gradually, and the total pressure recovery at the inlet throat section decreased from 0.64 to 0.55. The starting Mach number increased from 3.45 to 4.50 with model scaling.
  • The inflow Reynolds number decreased from 5.67 × 10⁶ to 1.07 × 10⁶ as the flight altitude increased from 25.5 km to 36.5 km. This resulted in an increase in the relative boundary layer thickness of the entrance section from 9.8% to 13.2%. Thus, the inlet shoulder separation bubble size increased gradually, and the total pressure recovery at the inlet throat section decreased from 0.64 to 0.61. The starting Mach number increased from 3.40 to 3.70 with flight altitude.
  • The effect of the Reynolds number effect caused by the model scaling and flight altitude on the aerodynamic characteristics of the hypersonic inlet has been compared. The results show that the relative boundary layer thickness at the entrance section, mass flow ratio, total pressure recovery coefficient at the throat section and starting Mach number are almost the same under the same Reynolds number.

Author Contributions

Conceptualization, J.L. and H.Y.; methodology, J.L.; software, J.L.; validation, J.C.; formal analysis, J.L.; investigation, J.L. and J.C.; resources, J.L. and H.Y.; data curation, J.C.; writing—original draft preparation, J.L. and J.C.; writing—review and editing, J.L. and H.Y.; visualization, J.L. and J.C.; supervision, H.Y.; project administration, H.Y.; funding acquisition, J.L. and H.Y. All authors have read and agreed to the published version of the manuscript.

Funding

This research was funded by the Science Center for Gas Turbine Project (P2022-B-I-004-001), Aeronautical Science Foundation of China (20200012052001), National Natural Science Foundation of China (11772155) and the Fundamental Research Funds for the Central Universities (NS20220024).

Institutional Review Board Statement

Not applicable.

Informed Consent Statement

Not applicable.

Data Availability Statement

Not applicable.

Conflicts of Interest

The authors declare no conflict of interest.

References

  1. Pettersson, K.; Rizzi, A. Aerodynamic scaling to free flight conditions: Past and present. Prog. Aerosp. Sci. 2008, 44, 295–313. [Google Scholar]
  2. Hitzel, S.; Zimper, D. Wind tunnel, simulation, and “real” flight of advanced combat aircraft: Industrial perspective. J. Aircr. 2018, 55, 587–602. [Google Scholar]
  3. Chen, M. How to determine the scale ratio of wind tunnel test models by CFD—A leap in the design standard of wind tunnel test models from the perception to the reason. J. Astronaut. 2007, 28, 594–597. (In Chinese) [Google Scholar]
  4. Bushnell, D.M. Scaling: Wind tunnel to flight. Annu. Rev. Fluid Mech. 2006, 38, 111–128. [Google Scholar] [CrossRef]
  5. Gong, A.L.; Xie, J.; Liu, X.W.; Liu, Z.; Yang, Y.J.; Zhou, W.J. Study on ground-to-flight extrapolation of near space hypersonic aerodynamic data. Eng. Mech. 2017, 34, 229–238. (In Chinese) [Google Scholar]
  6. Yamazaki, W.; Yamagishi, S.; Ueno, M. Investigation of indirect Reynolds number effect via computational fluid dynamics simulations. J. Aircr. 2018, 55, 1805–1816. [Google Scholar]
  7. Jouhaud, J.C.; Sagaut, P.; Labeyrie, B. A kriging approach for CFD/wind-tunnel data comparison. J. Fluids Eng. 2006, 128, 847–855. [Google Scholar] [CrossRef] [Green Version]
  8. Jia, Q.; Yang, Y.; Chen, N. The influence of Reynolds number on dynamic aerodynamics correlation between real flight and wind tunnel. J. Exp. Fluid Mech. 2007, 21, 91–96. (In Chinese) [Google Scholar]
  9. Mani, M.; Rider, B.J.; Sclafani, A.J.; Winkler, C.; Vassberg, J.; Dorgan, A.J.; Cary, A.; Tinoco, E.N. Reynolds-averaged Navier–Stokes technology for transonic drag prediction: A Boeing perspective. J. Aircr. 2014, 51, 1118–1134. [Google Scholar] [CrossRef]
  10. Fukushima, Y.; Tamaki, Y.; Kawai, S. Predictability of wall-modeled LES for Reynolds number effects of airfoil flows at transonic buffet and near-stall conditions. In Proceedings of the AIAA SciTech 2020 Forum, Orlando, FL, USA, 6–10 January 2020. [Google Scholar]
  11. Liu, J.; Yuan, H.; Zhang, J.; Kuang, Z. A multifidelity simulation method for internal and external flow of a hypersonic airbreathing propulsion system. Aerospace 2022, 9, 685. [Google Scholar] [CrossRef]
  12. Bahm, C.; Baumann, E.; Martin, J.; Bose, D.; Strovers, B. The X-43A Hyper-X Mach 7 flight 2 guidance, navigation, and control overview and flight test results. In Proceedings of the AIAA/CIRA 13th International Space Planes and Hypersonics Systems and Technologies Conference, Capua, Italy, 16–20 May 2005. [Google Scholar]
  13. Imfeld, W.F. Development program for the F-15 inlet. J. Aircr. 1976, 13, 286–291. [Google Scholar] [CrossRef]
  14. Lin, G.; Li, Z.; Xiao, F.; Jiang, H.; Liu, K.; Gao, W.; Yang, Z. Scale effects of the starting characteristics of a 2D hypersonic inlet. J. Exp. Fluid Mech. 2014, 28, 26–31. (In Chinese) [Google Scholar]
  15. Wang, Y.; Yuan, H.; Guo, R. Effect of geometry dimensions on aerodynamic performance of hypersonic inlet. Acta Aeronaut. Astronaut. Sin. 2014, 35, 1893–1901. (In Chinese) [Google Scholar]
  16. Liu, J.; Yuan, H.; Yao, M.; Ge, N. Numerical simulation of terminal shock oscillation in over/under turbine-based combined-cycle inlet. Int. J. Turbo Jet Eng. 2021, 38, 73–83. [Google Scholar] [CrossRef]
  17. Liu, J.; Yuan, H.; Chen, W.; Guo, R. Investigation of translation scheme turbine-based combined-cycle inlet mode transition. Aerosp. Sci. Technol. 2021, 116, 106894. [Google Scholar]
  18. Liu, F.; Yuan, H. Experimental Test of a Two-Dimensional Hypersonic Inlet; Technical Report: Nanjing, China, 2021. (In Chinese) [Google Scholar]
  19. Baldwin, A.; Mears, L.J.; Kumar, R.; Farrukh, S.A. Effects of Reynolds number on swept shock-wave/boundary-layer interactions. AIAA J. 2021, 59, 3883–3899. [Google Scholar]
  20. Seddon, J.; Goldsmith, E.L. Intake Aerodynamics, 2nd ed.; AIAA Education Series; Blackwell Science Ltd.: Hoboken, NJ, USA, 1999. [Google Scholar]
  21. Tan, H.J.; Guo, R.W. Experimental study of the unstable-unstarted condition of a hypersonic inlet at Mach 6. J. Propuls. Power 2007, 23, 783–788. [Google Scholar] [CrossRef]
Figure 1. Baseline model of the two-dimensional hypersonic inlet.
Aerospace 09 00811 g001
Figure 2. Mesh and boundary conditions of the two-dimensional hypersonic inlet.
Aerospace 09 00811 g002
Figure 3. Comparison of the static pressure along the ramp and cowl of the hypersonic inlet between the numerical simulation and experimental test [18].
Aerospace 09 00811 g003
Figure 4. Mach number contour at two different model scalings: (a) Baseline model; (b) Scale 1:50 model.
Aerospace 09 00811 g004
Figure 5. Comparison of static pressure along the ramp side at different scales.
Aerospace 09 00811 g005
Figure 6. Velocity profile at different model scales: (a) Inlet entrance section; (b) Throat section.
Aerospace 09 00811 g006
Figure 7. Relative boundary layer thickness of different scales.
Aerospace 09 00811 g007
Figure 8. Performance parameters of the throat section of different scales.
Aerospace 09 00811 g008
Figure 9. Numerical schlieren at starting Mach number of different scales: (a) Baseline model numerical schlieren at Ma 3.45; (b) Scale 1:50 model numerical schlieren at Ma 4.5.
Aerospace 09 00811 g009
Figure 10. Comparison of static pressure along the ramp side at different altitudes.
Aerospace 09 00811 g010
Figure 11. Inlet velocity profile at different shrinkage ratio scales: (a) Inlet entrance section; (b) Throat entrance section.
Aerospace 09 00811 g011
Figure 12. Relative boundary layer thickness at different flight altitudes.
Aerospace 09 00811 g012
Figure 13. Performance parameters of the throat section at different flight altitudes.
Aerospace 09 00811 g013
Figure 14. Numerical schlieren at the starting Mach number of different flight altitudes: (a) H = 25.5 km numerical schlieren at Ma 3.4; (b) H = 36.5 km numerical schlieren at Ma 3.7.
Aerospace 09 00811 g014
Figure 15. Relative boundary layer thickness of the inlet at different Reynolds number.
Aerospace 09 00811 g015
Figure 16. Inlet performance parameters at different Reynolds numbers.
Aerospace 09 00811 g016
Figure 17. Starting Mach number at different Reynolds numbers.
Aerospace 09 00811 g017
Figure 18. Flight trajectory and unit Reynolds number.
Aerospace 09 00811 g018
Table 1. Reynolds number at different scales.
ScaleRe
14.86 × 10⁶
1/22.43 × 106
1/59.71 × 105
1/104.86 × 105
1/20 2.43 × 10⁵
1/509.71 × 104
Table 2. Starting Mach number at different scales.
ScaleStarting Mach Number
13.45
1/23.55
1/53.70
1/103.85
1/20 4.05
1/504.50
Table 3. Starting Mach number at different flight altitudes.
Altitude (km)Starting Mach Number
25.53.40
26.53.45
28.53.50
30.53.55
32.53.60
36.53.70
Publisher’s Note: MDPI stays neutral with regard to jurisdictional claims in published maps and institutional affiliations.