Abstract
The overall performance of a scramjet inlet will decline while entering off-design mode. Active flow control using nanosecond surface dielectric barrier discharge (NS-SDBD) can be a novel solution to such inlet–unstart problems. NS-SDBD actuators are deployed on the surface of the internal compression section, controlling the shock waves and the separation area. Numerical simulations of hypersonic flows are carried out using the compressible Reynolds average Navier–Stokes equation (RANS), along with the plasma phenomenological model which is added in as the energy source term. Flow structures and the evolution of performance parameters are analyzed. Results show that NS-SDBD actuators are able to increase the static pressure behind the cowl shock, boosting the downstream total pressure. The compression effect becomes stronger while raising the frequency or shortening the spacing between the actuators. Under the inlet–unstart conditions, the compression wave generated by the actuator pushes the reattachment point forward, making the separation bubble longer in length and shorter in height, which reduces the strength of the separation shock. The results provide a numerical basis for the state control of a hypersonic inlet.
1. Introduction
The flow quality of a scramjet inlet plays a crucial role in the overall performance and safety of hypersonic vehicles. The mass flow rate and total pressure will gradually decrease once entering off-design mode [1], such as low Mach number or high angle of attack status. In order to change the flow structure without altering flight condition, active flow control technology has received lots of attention in terms of boundary layer control and shock control. Among them, boundary layer suction [2] is a typical method for controlling boundary layer separation but will bring an additional loss of the mass flow rate. In recent years, the study of plasma actuators has become a research hotspot in the field of supersonic flow control. Two types of plasma actuators have been proved efficient in providing perturbations to hypersonic flows, namely the plasma synthetic jet (PSJ) actuator and the nanosecond pulse surface dielectric barrier discharge (NS-SDBD) actuator. The PSJ actuator [3] generates high-speed jet flow induced by spark discharge inside the cavity. An array of PSJ actuators is applied in order to widen the control range of the ramp flow [4]. The NS-SDBD actuator exerts pressure perturbations to the boundary layer or shock waves through fast heating effect [5]. Compared with the PSJ actuator, the NS-SDBD actuator is much simpler in structural design and easier to deploy on the surface of the hypersonic inlet, and it is able to control a wide spanwise range of supersonic flow.
A great number of experimental studies have proved the effectiveness of the SDBD actuator in subsonic, transonic, and supersonic flow control. Claudia [6] compared the effect of separation flow control between the alternating current surface dielectric barrier discharge (AC-SDBD) and nanosecond pulse surface dielectric barrier discharge (NS-SDBD). Results showed that the NS-SDBD actuator was able to generate stronger perturbations with the same energy input. Kimmel [7] and Shang [8] measured the downstream surface pressure in the Mach 5 flat plate flow with the control of the SDBD actuator. They considered that the pressure rise was related to the heating effect of plasma discharge, which increased boundary layer displacement thickness and deflected local flow direction. Leonov [9,10,11] proposed several SDBD control mechanisms through a transonic and supersonic wind tunnel test, including boundary layer heating, surface heating, creating separation zones, and changing shock-wave position. Nicholas [12] and Nishihara [13] studied the control effect of a detached shock wave and oblique shock wave, finding that the compression wave generated by the NS-SDBD actuator increased the standoff distance and shock angle. Chen [14] studied the control effect of the NS-SDBD actuator on Mach 4 corner flow. The experimental and numerical results showed that the nanosecond discharge enhanced the ability of resisting an adverse pressure gradient, which shortened the length of the separation zone. Falempin [15] carried out the experimental study of surface discharge in a supersonic inlet. Oblique shock waves intersected at the cowl while enabling the actuator in off-design state, which raised the mass flow rate and total pressure recovery coefficient of the inlet. Zhang [16] improved the performance of the hypersonic inlet in off-design mode using PSJ actuators. The research found that the plasma synthetic jet raised the local shock angle and increased the total pressure while propagating to the downstream. Present studies have illustrated the control effect of plasma actuators in the high-Mach-number off-design state of the hypersonic inlets. However, the control mechanism of low Mach number or high-attack-angle off-design mode still requires further explanation.
In terms of numerical simulation, the solution method of NS-SDBD actuation response mainly includes the multi-physics coupling method [17,18] and phenomenological method [19,20]. The multi-physics coupling method solves static electric field, flow field, and plasma chemical reactions. With regard to the complex flow of the hypersonic aircraft, the time scale of flow response is much longer than discharge process and the grid cells are much denser near the electrode, which occupies a huge amount of computing resources. The phenomenological method simplifies the plasma layers as space distributions of energy or temperature according to experiment data and only solves the Navier–Stokes equation, which aims at the fast prediction of the compression wave generated by the actuator.
In this research, a phenomenological model of the NS-SDBD actuator is built and verified. Numerical simulations of the hypersonic inlet flow are carried out by solving the Reynolds average Navier–Stokes (RANS) equation. The evolutions of perturbed flow structures are analyzed. Finally, the mechanism of the NS-SDBD control under start and unstart conditions are discussed in detail.
2. Models and Methods
2.1. Physical Models
The configuration of a two-dimensional inlet model [21] is shown in Figure 1. The shoulder position on the lower wall was defined as the origin coordinate. Figure 2 shows the position of the NS-SDBD actuators, two of which were activated in each case. Table 1 shows the position of the actuators, the excitation frequency, the peak voltage as well as the input energy of each actuator. Different peak voltages were applied in order to ensure the same input energy in Cases 1–3. The voltage rising time and pulse duration were identical in all cases, which were tr = 7 ns and td = 50 ns, respectively.
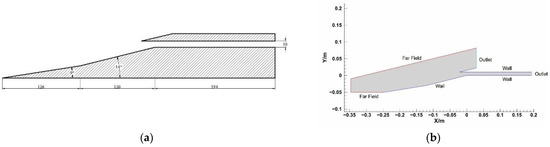
Figure 1.
Inlet model. (a) Model size (unit: mm); (b) Computational domain.
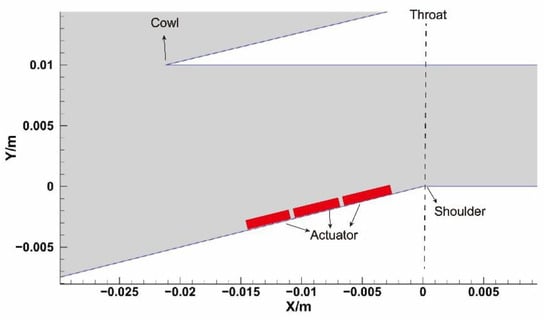
Figure 2.
Positions of NS-SDBD actuators.

Table 1.
Actuating conditions.
2.2. Numerical Methods
A two-dimensional unsteady Navier–Stokes equation was provided in integral form:
where W represents conserved quantities. Fc and Fv represent convective flux and viscous flux, respectively. Q is the source terms. t represents flow time. The flux terms are expressed as follows:
where ρ is the density. u and v represent velocity along the x and y axis, respectively. un is the velocity normal to the surface of the control volume. E and H represent the total energy and total enthalpy, respectively. p is the static pressure. τxx, τxy, τyx, and τyy are shear stresses. Θx and Θy are heat transfer terms. Pth is the energy source term. nx and ny are the components of the unit normal vector in the x and y directions, respectively.
The fast-heating effect of the NS-SDBD actuator was mainly considered, and the plasma chemical reactions were neglected; hence, we applied the ideal gas law. Convective flux was discretized in the second-order Roe-FDS scheme. Viscous flux was calculated in the central difference scheme. The turbulent model was selected as SST k-ω through comparison. The first layer grid height was 1 × 10⁻⁵ m, wall y+ ≈ 1. The second order dual time method was applied. The time-step size was 5 × 10⁻⁹ s, iterating 20 times in each time step.
The energy source term Pth was provided by the phenomenological method:
where EI(x,y) represents the spatial energy distribution function. EIt represents the integral of spatial distribution function in the plasma zone. Ed represents spanwise energy input per unit length. f(x), g(y) represents horizontal and vertical radiation intensity. td is pulse duration. η represents the proportion of injected electrical energy used for gas heating. As is analyzed in reference [22], η ≈ 30%. The length of plasma layer l (unit: cm) is associated with voltage rising time tr (unit: ns) and peak voltage Up (unit: kV), and the thickness of the plasma layer h is 0.1 cm [23].
The spanwise energy input per unit length Ed as well as distribution functions f(x), g(y) were fitted from the experiment data [24,25]:
The unit of Ed is mJ/cm. f represents actuating frequency (unit: Hz), where f0 = 10 Hz. Fitting coefficients ai, bi, ci, di, mi, and ni are provided in Table 2.
Table 2.
Fitting coefficients.
2.3. Verification of Methods
The nanosecond pulse discharge in quiescent air was calculated by the above method and was compared with the result provided by the experiments [26]. The pulse waveform is shown in Figure 3. The electrode was placed at the origin. The far-field boundary was static atmosphere. The static pressure was 101,380 Pa. The static temperature was 288.7 K.
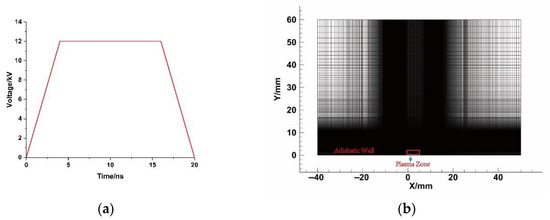
Figure 3.
NS-SDBD verification example. (a) Pulse waveform; (b) Computational domain.
Figure 4 compares the density gradient distribution at 14 μs after the discharge. The flow structures contained a forward hemicylindrical shock wave, an upward planar shock wave, and a backward expansion wave. The gas heating effect of the plasma induced a variation of density in the near-wall zone. The positions of compression waves and expansion wave acquired by the phenomenological method fitted well with the experimental image, which illustrates that the wave propagation speed was accurately simulated. Figure 5 shows the density distribution in the near-wall zone at 0.3 ms. The maximum error of the numerical method was approximately 0.1% due to the neglection of the real gas effect. The nanosecond discharge changed the components of air near the electrode, resulting in the variation of local gas properties. However, this effect was relatively weak through the comparison of the numerical and experimental data, indicating the feasibility of using the ideal gas law in phenomenological simulation.
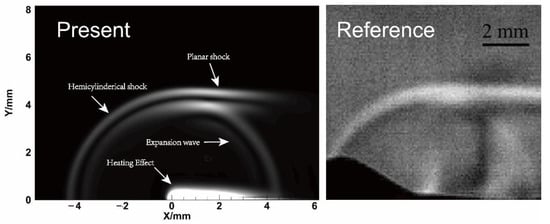
Figure 4.
Schlieren image of NS-SDBD response flow field in quiescent air (Δt = 14 μs).
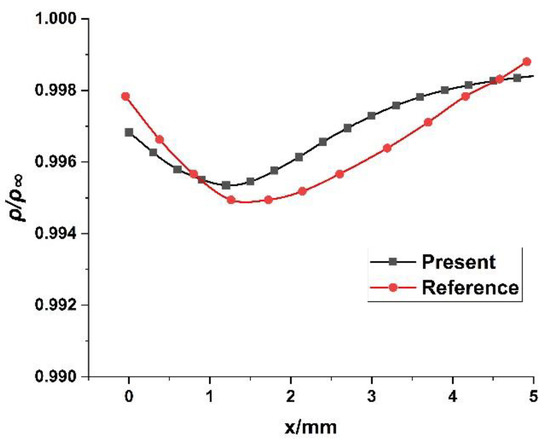
Figure 5.
Density distribution at y = 1 mm (Δt = 0.3 ms).
The hypersonic inlet flow was calculated using three sets of grids. Figure 6 shows the pressure coefficient of the internal compression section and the forepart of the isolator. It is shown that the result provided by the medium grid almost coincided with that of the fine grid. In order to save computing resources, the medium cell number was set in all cases. The total cell number was 249,000.
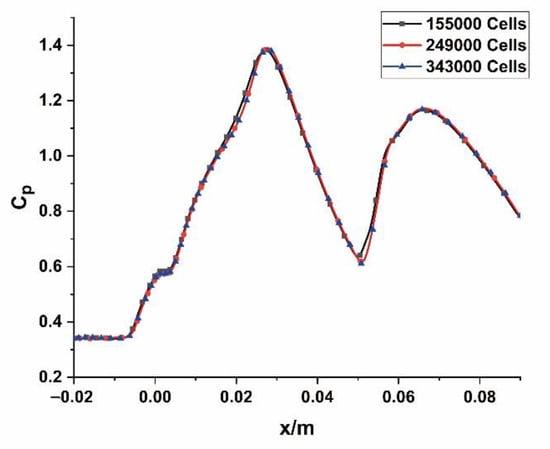
Figure 6.
Pressure coefficient along the lower wall of the inlet.
3. Results and Discussion
3.1. NS-SDBD Control in the Starting State
The baseline flow field in the starting state (inflow condition Ma∞ = 5, AOA = 5°) is shown in Figure 7. The incident cowl shock interacted with the boundary layer, forming a separation bubble and expansion fan. Since the forebody shock was away from the cowl, the inlet was in off-design state. This steady-state baseline flow was adopted as the initial value of the NS-SDBD flow control simulation.
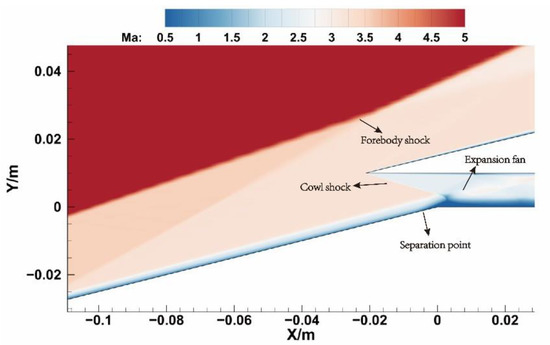
Figure 7.
Mach contours of the baseline flow field. (Ma∞ = 5, AOA = 5°).
Figure 8 shows the variation of the total pressure recovery coefficient of the throat section (x = 0) with time under the frequency condition of 20 kHz. It was found that the total pressure recovery coefficient shows a cyclical trend in the second and third excitation period. Therefore, we focused on the variation of flow field in the third excitation period, and the time at the third discharge was defined as t = 0 moment in this section. As is shown in Figure 9, at the time of 1μs after the discharge, the compression wave structure was generated around the two actuators and propagates to both sides. While t = 6 μs, the upper edges of two compression waves intersected and raised the local pressure. At the same time, the compression wave generated by the downstream actuator intersected with the cowl shock, rapidly increasing the total pressure at the throat section. While t = 19 μs, the compression waves reached the upper wall and lifted the reflected shock, causing the increase in static pressure around the throat section. At the time of 35 μs, the pressure perturbation propagated to the downstream of the isolator, and the flow field around the throat basically recovered to the state before the discharge.
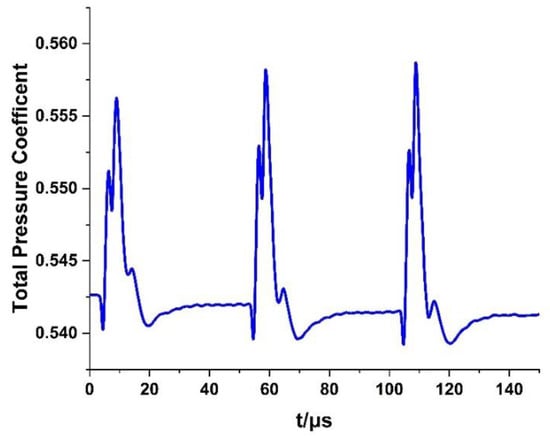
Figure 8.
Total pressure recovery coefficient versus time at the throat section (f = 20 kHz).
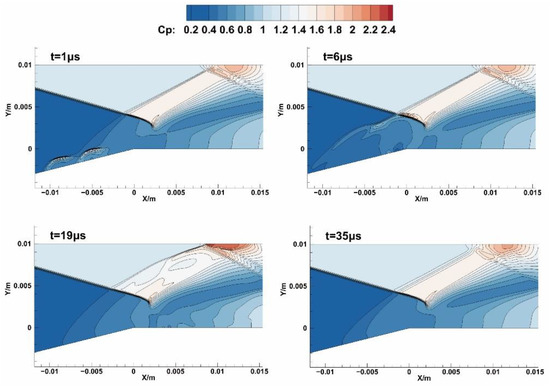
Figure 9.
Contours of pressure coefficient after the discharge (f = 20 kHz).
Figure 10 shows the pressure coefficient gradient distribution on the lower wall of the inlet. Compared with the uncontrolled condition, the forward compression wave caused the rise in the local adverse pressure gradient, whereas the backward compression wave reduced the adverse pressure gradient of the separation zone before the shoulder point. Therefore, the discharge moved the separation point forward and reduced the strength of separation shock.
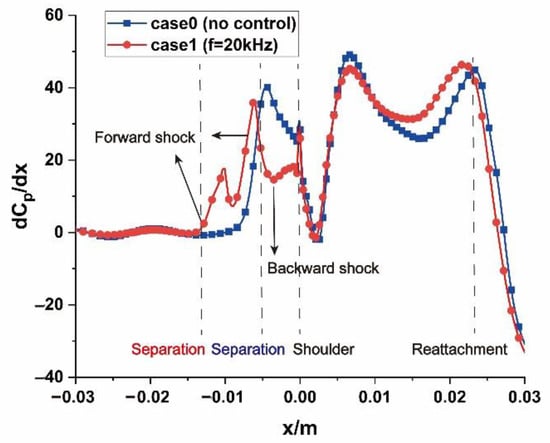
Figure 10.
Time-averaged gradient of pressure coefficient.
The influence of actuator parameters on the total pressure recovery coefficient at the throat section was studied by changing the frequency and actuator position, which is shown in Figure 11. With the rise in the discharge frequency, the ratio of disturbance duration to flow time increased, indicating a more continuous control effect. Under the condition of discharge frequency f = 80 kHz, the time averaged total pressure increased by 0.65%, and the peak total pressure increased by 2.37% compared with baseline flow. Providing there was the same energy input, the initial total pressure changed with the discharge frequency because of the desynchrony between discharge period and flow recovery time, which can be further explained by analyzing the variation of pressure and Mach number in a single excitation period, as illustrated in Figure 12. In Case 1.2, the first compression wave generated by the downstream actuator reached the throat section at t = 0.2 T and interacted with the second compression wave at t = 0.3 T, creating a pressure increase as well as Mach number reduction in the middle part of the section. The plasma region induced a high-pressure zone and a low-pressure zone which moved downstream along the wall, reducing the flow speed at t = 0.2 T while starting to accelerate it at t = 0.3 T. From t = 0.3 T to t = 0.6 T, the static pressure started to recover at the center part, while the low Mach number zone propagated upward. At the moment of the next discharge, the local Mach number had not recovered to the baseline state; therefore, the initial and peak total pressure depended on the relative strength of the Mach number reduction effect and pressure recovery effect. In Case 1.3, the proportion of pressure recovery time was smaller than the other cases, and the low Mach number zone had relatively less time to propagate, resulting in a higher initial total pressure. The peak value of total pressure in Case 1.3 was lower than that in Case 1.1 and Case 1.2 due to the remaining effect of near-wall Mach number reduction at the arrival time of the compression wave. Compared with Case 1.2, the actuators in Case 2 (with the same frequency) were farther apart, and the compression perturbations generated by the two actuators did not intersect at the throat section, resulting in no additional pressure jump; hence, the peak total pressure was relatively low.
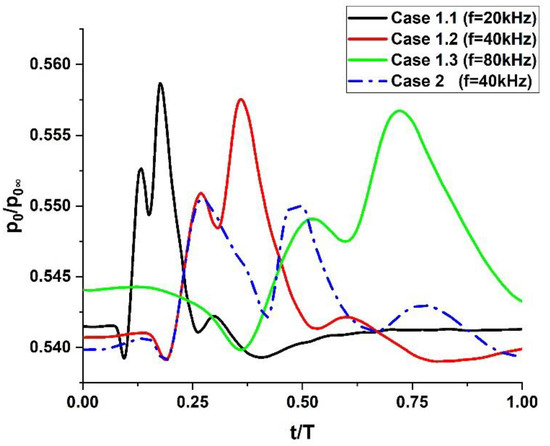
Figure 11.
The variation of total pressure coefficient in the third excitation period.
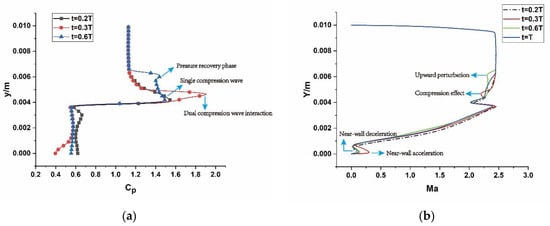
Figure 12.
The flow parameter distribution at the throat section in Case 1.2. (a) Pressure coefficient; (b) Mach number.
In order to assess the efficiency of the NS-SDBD control, here we defined the total input energy intensity N is the number of actuators. Ed is the input energy per unit spanwise length. S is the area of plasma region. In Case 1.2, the ratio of maximum increment of mass-flow weighted total pressure to total input energy intensity was 0.759 at the throat section. The ratio of total input energy intensity to mass-flow weighted total pressure (at the throat section) was 0.031.
Figure 13 compares the time averaged pressure ratio at different cross-section positions. With the rise in discharge frequency, the pressure perturbation time ratio increased. In Case 1.2, the maximum pressure ratio increased by 11.6% compared with that in the baseline flow field. The pressure-boost effect became stronger as the compression wave spread downstream, and the maximum increment happened at x = 2 mm. The dual compression wave interaction makes the pressure ratio in Case 1.2 slightly higher than that in Case 2.
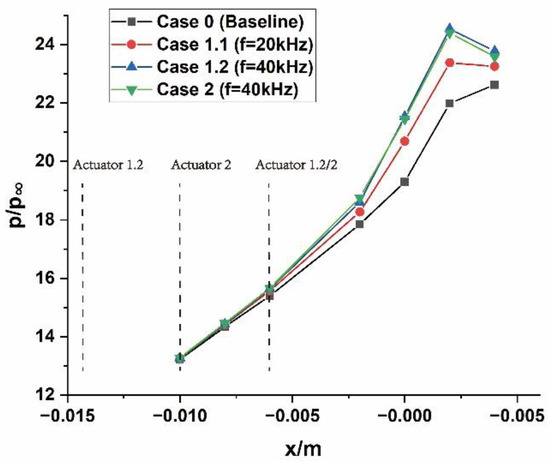
Figure 13.
Time averaged pressure ratio of each section.
3.2. NS-SDBD Control in Unstarting State
The converged steady flow field in starting state (Ma∞ = 5, AOA = 5°) was used as the initial flow field, while the attack angle was increased to 6° in order to simulate the unstart process. As shown in Figure 14, the separation bubble generated by the adverse pressure gradient gradually moved forward from the shoulder point. At 5.15 ms, after the change of attack angle, the highest point of the separation bubble reached the cowl section, forming a normal shock wave, which led to a significant decrease in the mass flow rate coefficient and total pressure recovery coefficient. At this moment, the actuator was turned on for flow control.
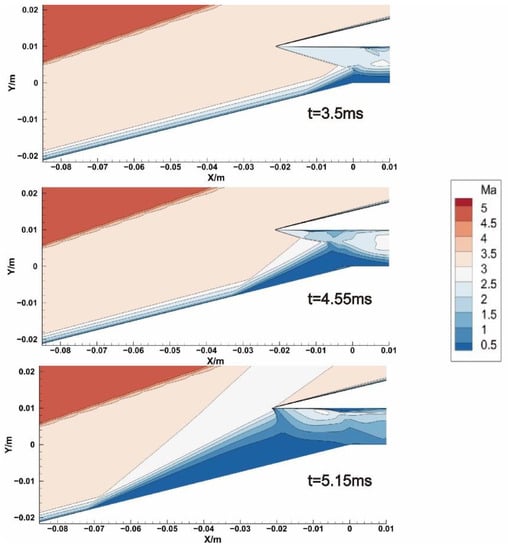
Figure 14.
Mach contours at different moments after the sudden change of attack angle.
Figure 15 compares the inlet flow field at 50 μs (f = 40 kHz) after the discharge with that in the uncontrolled state. The compression wave generated by the actuator raised the pressure in the reattachment zone, pushing the reattachment point forward, meanwhile decreasing the height of the separation bubble and extending its length. The separation shock angle was decreased from 7.9° to 7.1° with the forward movement of separation shock. Furthermore, the strength of the normal cowl shock was reduced, and the mass flow rate of inlet was recovered by 11.67% at the throat section compared with that at the moment of the first excitation. It can be seen from Figure 16 that the separation point was pushed forward slightly while the intensity of the separation shock was reduced under the condition of nanosecond discharge. With the increase in input energy, the compression wave became stronger, leading to a higher pressure rise in front of the reattachment zone. The total pressure coefficient at the cowl section was increased by 0.68% under the condition of 52.5% input energy increment.
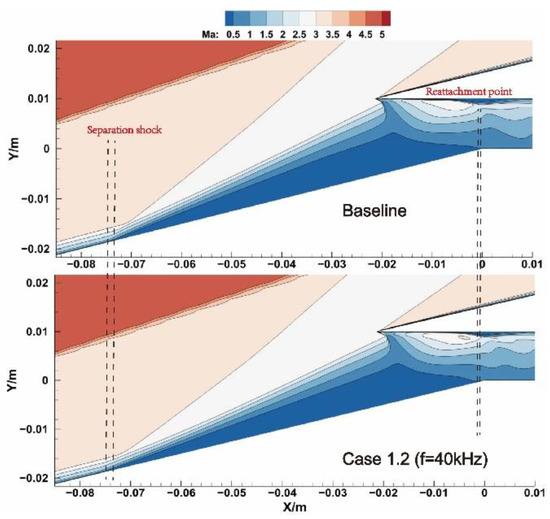
Figure 15.
Comparison of Mach contours at t = 5.2 ms.
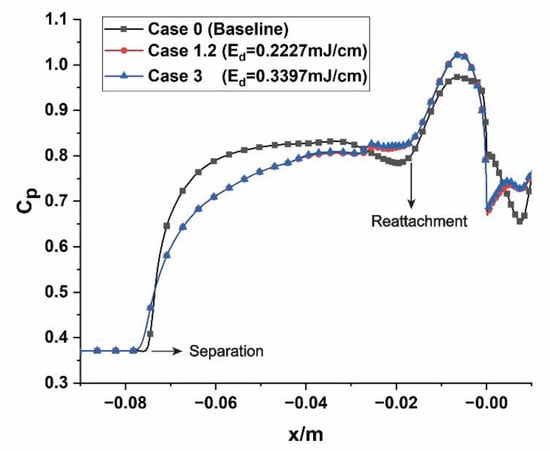
Figure 16.
Pressure distribution of the lower wall at t = 5.2 ms.
4. Conclusions
In this article, numerical simulations are carried out based on the RANS method and plasma phenomenological model. The control effects of the NS-SDBD actuator on the off-design flow field of a scramjet inlet are analyzed. The main findings are as follows:
- In the starting state of the inlet, the intersection of compression wave and cowl shock wave provide an increase in the total pressure recovery coefficient, and boosts the pressure ratio of the internal compression section as well. The maximum increments of total pressure recovery coefficient and pressure ratio are 2.37% and 11.6%, respectively;
- If the two actuators are placed closely (with a horizontal coordinate spacing of 4 mm), the intersection of compression waves generated by the two actuators will provide an additional increase in peak total pressure;
- Under the unstarting condition, the NS-SDBD actuation makes the separation point and reattachment point move forward, meanwhile decreasing the separation shock angle and recovering mass flow rate coefficient.
This study indicates that the control mechanisms of the NS-SDBD actuator between inlet starting and unstarting state are not exactly the same. In the starting state, the backward compression wave generated by the actuator is mainly utilized in order to improve the downstream performance parameters. While in the unstarting state, the forward compression wave is the main factor to control the upstream separation bubble. Therefore, the position of the actuator should be reasonably arranged according to the position of the separation bubble as well as the shock structure around the cowl section.
Author Contributions
Data curation, Y.Y.; writing—original draft preparation, Y.Y.; writing—review and editing, J.W. All authors have read and agreed to the published version of the manuscript.
Funding
This research received no external funding.
Institutional Review Board Statement
Not applicable.
Informed Consent Statement
Not applicable.
Data Availability Statement
Not applicable.
Acknowledgments
This work is supported by the Priority Academic Program Development of Jiangsu Higher Education Institutions (PAPD).
Conflicts of Interest
The authors declare no conflict of interest.
References
- Rodi, P.E.; Emami, S.; Trexler, C.A. Unsteady pressure behavior in a ramjet/scramjet inlet. J. Propuls. Power 1996, 12, 486–493. [Google Scholar] [CrossRef]
- Bauer, C.; Kurth, G. Importance of the bleed system on the overall air intake performance. In Proceedings of the 47th AIAA/ASME/SAE/ASEE Joint Propulsion Conference & Exhibit, San Diego, CA, USA, 31 July–3 August 2011. [Google Scholar]
- Xie, W.; Luo, Z.; Hou, L.; Zhou, Y.; Liu, Q.; Peng, W. Characterization of plasma synthetic jet actuator with Laval-shaped exit and application to drag reduction in supersonic flow. Phys. Fluids 2021, 33, 096104. [Google Scholar] [CrossRef]
- Wang, H.; Li, J.; Jin, D.; Dai, H.; Wu, Y. Effect of a transverse plasma jet on a shock wave induced by a ramp. Chin. J. Aeronaut. 2017, 30, 1854–1865. [Google Scholar] [CrossRef]
- Roupassov, D.V.; Nikipelov, A.A.; Nudnova, M.M.; Starikovskii, A.Y. Flow separation control by plasma actuator with nanosecond pulsed-periodic discharge. AIAA J. 2009, 47, 168–185. [Google Scholar] [CrossRef]
- Durasiewicz, C.; Singh, A.; Little, J.C. A Comparative Flow Physics Study of Ns-DBD vs Ac-DBD Plasma Actuators for Transient Separation Control on a NACA0012 Airfoil. In Proceedings of the AIAA Aerospace Sciences Meeting, Kissimmee, FL, USA, 8–12 January 2018. [Google Scholar]
- Kimmel, R.L.; Hayes, J.R.; Menart, J.A.; Shang, J. Effect of surface plasma discharges on boundary layers at Mach 5. In Proceedings of the 42nd AIAA Aerospace Sciences Meeting and Exhibit, Reno, NV, USA, 5–8 January 2004. [Google Scholar]
- Shang, J.S.; Huang, P.G.; Yan, H.; Surzhikov, S.T.; Gaitonde, D.V. Hypersonic flow control utilizing electromagnetic-aerodynamic interaction. In Proceedings of the 15th AIAA International Space Planes and Hypersonic Systems and Technologies Conference, Dayton, OH, USA, 28 April–1 May 2008. [Google Scholar]
- Leonov, S.; Bityurin, V.; Savischenko, N.; Yuriev, A.; Gromov, V. Influence of surface electrical discharge on friction of plate in subsonic and transonic airflow. In Proceedings of the 39th AIAA Aerospace Sciences Meeting and Exhibit, Reno, NV, USA, 8–11 January 2001. [Google Scholar]
- Leonov, S.; Bityurin, V.; Savelkin, K.; Yarantsev, D. Effect of electrical discharge on separation processes and shocks position in supersonic airflow. In Proceedings of the 40th AIAA Aerospace Sciences Meeting and Exhibit, Reno, NV, USA, 14–17 January 2002. [Google Scholar]
- Leonov, S.; Bityurin, V.; Yarantsev, D.; Isaenkov, Y.; Soloviev, V. High-speed flow control due to interaction with electrical discharges. In Proceedings of the AIAA/CIRA 13th International Space Planes and Hypersonic Systems and Technologies, Capua, CE, USA, 16–20 May 2005. [Google Scholar]
- Bisek, N.J.; Poggie, J.; Nishihara, M.; Adamovich, I. Computational and Experimental Analysis of Mach 5 Air Flow over a Cylinder with a Nanosecond Pulse Discharge. In Proceedings of the 50th AIAA Aerospace Sciences Meeting Including the New Horizons Forum and Aerospace Exposition, Nashville, TN, USA, 9–12 January 2012. [Google Scholar]
- Nishihara, M.; Gaitonde, D.; Adamovich, I.V. Effect of Nanosecond Pulse Discharges on Oblique Shock and Shock Wave—Boundary Layer Interaction. In Proceedings of the 51st AIAA Aerospace Sciences Meeting Including the New Horizons Forum and Aerospace Exposition, Grapevine, TX, USA, 7–10 January 2013. [Google Scholar]
- Chen, Z.; Hao, J.; Wen, C.-Y. Control of supersonic compression corner flow using a plasma actuator. Phys. Fluids 2022, 34, 073605. [Google Scholar] [CrossRef]
- Falempin, F.; Firsov, A.A.; Yarantsev, D.A.; Goldfeld, M.A.; Timofeev, K.; Leonov, S.B. Plasma control of shock wave configuration in off-design mode of M = 2 inlet. Exp. Fluids 2015, 56, 54. [Google Scholar] [CrossRef]
- Zhang, W.; Shi, Z.; Zhang, C.; Geng, X.; Li, K.; Chen, Z. A study on flow control in a hypersonic inlet using a plasma synthetic jet actuator. Phys. Fluids 2022, 34, 106109. [Google Scholar] [CrossRef]
- Poggie, J.; Adamovich, I.; Bisek, N.; Nishihara, M. Numerical simulation of nanosecond-pulse electrical discharges. Plasma Sources Sci. Technol. 2013, 22, 015001. [Google Scholar] [CrossRef]
- Ahn, S.; Chae, J.; Kim, H.-J.; Kim, K.H. Numerical simulation of streamer physics in nanosecond pulsed surface discharges. Int. J. Aeronaut. Space Sci. 2021, 22, 547–559. [Google Scholar] [CrossRef]
- Chen, Z.; Hao, L.; Zhang, B. An Empirical Model of Nanosecond Pulsed SDBD Actuators for Separation Control. In Proceedings of the 43rd Fluid Dynamics Conference, San Diego, CA, USA, 24–27 June 2013. [Google Scholar]
- Gaitonde, D.V.; McCrink, M.H. A Semi-Empirical Model of a Nanosecond Pulsed Plasma Actuator for Flow Control Simulations with LES. In Proceedings of the 50th AIAA Aerospace Sciences Meeting including the New Horizons Forum and Aerospace Exposition, Nashville, TN, USA, 9–12 January 2012. [Google Scholar]
- Li, Z.F.; Gao, W.Z.; Jiang, H.L.; Yang, J.M. Unsteady behaviors of a hypersonic inlet caused by throttling in shock tunnel. AIAA J. 2013, 51, 2485–2492. [Google Scholar] [CrossRef]
- Popov, N.A. Fast gas heating in a nitrogen–oxygen discharge plasma: I. Kinetic mechanism. J. Phys. D Appl. Phys. 2011, 44, 285201. [Google Scholar] [CrossRef]
- Chen, Z.L.; Hao, L.Z.; Zhang, B.Q. A model for Nanosecond Pulsed Dielectric Barrier Discharge (NSDBD) actuator and its investigation on the mechanisms of separation control over an airfoil. Sci. China Technol. Sci. 2013, 56, 1055–1065. [Google Scholar] [CrossRef]
- Takashima, K.; Zuzeek, Y.; Lempert, W.R.; Adamovich, I.V. Characterization of surface dielectric barrier discharge plasma sustained by repetitive nanosecond pulses. In Proceedings of the 41st AIAA Plasmadynamics and Lasers Conference, Chicago, IL, USA, 28 June–1 July 2010. [Google Scholar]
- Nudnova1, M.; Kindusheva, S.; Aleksahdrov, N. Rate of Plasma Thermalization of Pulsed Nanosecond Surface Dielectric Barrier Discharge. In Proceedings of the 48th AIAA Aerospace Sciences Meeting Including the New Horizons Forum and Aerospace Exposition, Orlando, FL, USA, 4–7 January 2010. [Google Scholar]
- Ukai, T.; Russell, A.; Zare-Behtash, H.; Kontis, K. Temporal variation of the spatial density distribution above a nanosecond pulsed dielectric barrier discharge plasma actuator in quiescent air. Phys. Fluids 2018, 30, 116106. [Google Scholar] [CrossRef]
Publisher’s Note: MDPI stays neutral with regard to jurisdictional claims in published maps and institutional affiliations. |
© 2022 by the authors. Licensee MDPI, Basel, Switzerland. This article is an open access article distributed under the terms and conditions of the Creative Commons Attribution (CC BY) license (https://creativecommons.org/licenses/by/4.0/).