Abstract
In order to improve the computational accuracy of the AOA (angle of arrival) location, an AOA location method based on CTLS (constrained total least squares) and incorporating the effect of station errors is investigated. Its approximate closed-form solution is derived by first calculating the least squares solution, then substituting the least squares solution into the approximate closed-form solution and iterating to calculate the final result. Subsequently, since the result of the Fisher information matrix is minimized when the stations are uniformly distributed, the final accuracy of the AOA target location is improved by finding the optimal relative position deployment strategy for the sensor-carrying station in 3D space, under the assumption that the sensor carriers are uniformly distributed. Simulations show that, in the presence of station errors, the accuracy of AOA location is improved by approximately 10% using this paper’s calculation method, compared to the common least squares location method. In the process of target location, the Fisher information matrix is used to calculate the lower bound of the location result for the CRLB (Cramer–Rao lower bound), which is optimal when the azimuth is uniformly distributed and all on the same horizontal plane, if its pitch angle is 35.56°.
1. Introduction
Highly accurate position information is essential for many missions, such as environmental monitoring, smart homes, industrial control, disaster relief, rescue areas, and so on.
In general, the position information of a target can be estimated by exchanging information with a reference node of a known position. The signal characteristics that are usually used are signal strength (RSS), time of arrival (TOA), time difference of arrival (TDOA), and angle of arrival (AOA). The combination of TOA and TDOA can achieve the highest measurement accuracy. However, due to objective constraints, the infrared system can only measure the angular information of its azimuth and pitch angles, and it cannot obtain distance information, so it can only use the AOA positioning. The aim of this paper is to improve the accuracy of target positioning and reduce the mean square error of the observation results.
There are many methods that can be used in the target location problem, such as AOA, TOA, TDOA, and their collaborative positioning [1,2,3]. In order to ensure the real-time nature of the algorithm, most use least squares for the initial processing of the data [4]. The method requires sufficiently accurate initial estimates to achieve global convergence, and the convergence of the iterative process is not always guaranteed. A simple AOA-based least squares (LS) localization algorithm is proposed to give a non-iterative closed solution in the literature [5]. Additionally, the literature [6] proposes a constrained weighted least squares (CWLS) mobile localization algorithm. The literature [7] reduces the CTLS problem to an unconstrained minimization problem over a small set of variables. A new source localization algorithm based on the CTLS technique was proposed by reference [8] and reference [9], using the TDOA of signals received from spatially separated sensors. An AOA-based CTLS algorithm was derived in the literature [9], but its derivation of an approximate closed-form solution needs to be optimized.
After the initial location of the target using the least squares algorithm, in order to obtain more accurate target location results, various filtering methods, including Kalman filtering, are generally used to fuse the collected information, in order to reduce the error in the final location results. However, information fusion methods are a subsequent means of improving target state estimation, and it is the quality of the fused object (the original measurement data) itself that determines the performance of the target state estimation [10,11,12,13,14,15]. The measurement data is closely related to the observation position of the station, relative to the target, and the information provided by the measurement data from different relative observation positions is different.
In order to obtain better raw measurement data, the Cramer–Rao lower bound (CRLB) is generally used as a constraint to design the optimal relative geometric configuration between the sensor and the target, which is also known as the sensor deployment problem [16,17,18,19,20,21,22,23,24,25]. Additionally, the Fisher information matrix (FIM) is a common method for calculating the CRLB. The FIM is related to the location of the sensor deployment, for example, the relative geometric configuration between the sensor and the target. Additionally, it can be viewed as a matrix function with the geometric configuration between the sensor and the target as the independent variable. CRLB is the inverse of the FIM and is used to estimate the lower bound that can be reached by the covariance matrix. It means that, no matter how the state estimation algorithm is designed, the estimation error covariance matrix is unlikely to be smaller than the CRLB. It is worth noting that the main factor affecting the CRLB is the geometric configuration of the sensor and target, independent of the selection of the later filtering algorithm. Many studies have shown that the geometric configuration that minimizes the CRLB is more likely to result in accurate target location.
There are four main performance metrics for measuring the relative geometric configuration between the optimal sensor and the target: the A-class optimal criterion, the D-class optimal criterion, the E-class optimal criterion, and the MV-class optimal criterion [26,27,28,29,30]. The scalar function of the class A optimal criterion is the trace of the FIM, and the physical meaning of the scalar function that maximizes the class A optimal criterion is to minimize the mean estimated variance. The scalar function of the class D optimal criterion is the determinant of the FIM matrix, and the physical significance of maximizing the scalar function of the class D optimal criterion is to minimize the volume of the uncertainty ellipsoid. The scalar function of the E class optimal criterion is the minimum characteristic root of the FIM matrix, and the physical meaning of the scalar function that maximizes the E class optimal criterion is to minimize the maximum axis length of the uncertain ellipsoid. Finally, the scalar function of the optimal criterion for the MV class is the smallest diagonal element of the FIM.
For the optimal sensor deployment problem in AOA localization, the literature [10,11,12] studied the optimal sensor deployment problem in a planar state when all sensors were deployed on the same line. Reference [13] studied the optimal deployment problem of heterogeneous multi-sensors in two-dimensional space, and gave the optimal configurations, based on the class A and class D optimality criteria in the analytic form, respectively. In reference [12], a comprehensive discussion of the optimal configurations for different types of sensors in two-dimensional situations was given. On this basis, the literature [13,14] discussed the optimal configuration of multiple sensors with area constraints in the two-dimensional case and the problem of tracking moving targets with optimal configurations in the two-dimensional case, respectively. In reference [15], the problem of multi-sensor configuration in two-dimensional and three-dimensional space, with only angle, only distance, and received signal strength, was studied. In reference [16], the problem of cooperative positioning in a dual station configuration was investigated. In reference [17], the FIM determinant based on angle and distance information in two-dimensional conditions was given, and the configuration of multi-sensor observation was investigated. In reference [18], the optimal configuration of multi-sensor geometry, relative to the target in purely azimuthal passive positioning in three-dimensional space, was analyzed.
Based on class D and class A optimality criteria, the literature [19,20] gave optimal path planning strategies for stations carrying different types of sensors in the two-dimensional case, respectively. Reference [21] gave sufficient necessary conditions for the reversibility of FIM for TOA target location in the three-dimensional case. Reference [22] gave a method to determine all optimal geometric configurations of heterogeneous multi-goniometric sensors in three-dimensional space, and positioning in three-dimensional space using the class-A optimality criterion. Reference [23] explored the optimal deployment problem in the case of dual station positioning. Reference [24] further establishes conditions for the optimal geometric configuration of multiple received signal strength sensors in 3D space, based on class A optimality criteria.
Reference [25] explored the AOA measurement error when the angle-of-arrival (AOA) and the phase error in digital phase-locked loops and digital phase interferometers in a direction-finding system adopted the von Mises distribution. Reference [26] proposed a simple optimal sensor deployment criterion based on simple optimal sensor deployment criterion, based on minimizing the inverse Fisher information matrix trajectory, which was also calculated using the class A optimality criterion. Reference [12] investigated the distribution of optimal deployment when sensors are deployed in the same straight line during two-dimensional AOA localization. Reference [27] established the velocity localization requirements for dual or multiple mobile sensors based on TDOA and FDOA measurements for fixed transmitter for optimal positioning. Reference [28] used a class A optimality criterion to maximize the trace of the Fisher information matrix to determine the optimal sensor-target geometry under a distance-dependent Gaussian noise model. Reference [29] used a class A optimality criterion for trajectory optimization of the 3D target positioning problem. The problem of determining the optimal geometric configuration of an acoustic sensor network was addressed in the literature [30].
The contributions of this paper:
- A CTLS solution was derived, and simulations showed that this solution improved the accuracy of the calculation and reduced the error in target location by approximately 10%, compared to ordinary least squares algorithms.
- The station error was introduced into the calculation of the FIM, and the A-class optimal criterion was used to obtain the CRLB expression for the next step of calculating the optimal arrangement of the station carrying the sensors, taking into account the different errors in the pitch and azimuth angles of the IR measurements.
- Combining the result that the angle error of the pitch angle in the laser angle measurement principle is half of the angle error of the azimuth angle, the optimal arrangement of the stations carrying sensors in the multi-station location process was recalculated, and under the assumption of uniform distribution, the optimal pitch angle was finally obtained at 35.56°, where the minimum variance of the target position was achieved.
2. Description of the Problem
The goniometric system used in this paper is an infrared camera system mounted on an unmanned aircraft. It works by pointing the optical axis of the infrared camera on the unmanned aerial vehicle (UAV) at the target when it is found and locking the target in the center of the camera’s field of view, thus obtaining the azimuth and pitch angles of the target, relative to the UAV at that moment, while the position of the UAV itself is known. Finally, this information can be used to calculate the position of the target.
As shown in Figure 1, represents the position of the stations, T is the position of the target to be measured, the coordinates of the station position at each point are , and the measured azimuth angles and pitch angles of the target T, with respect to each station, are .
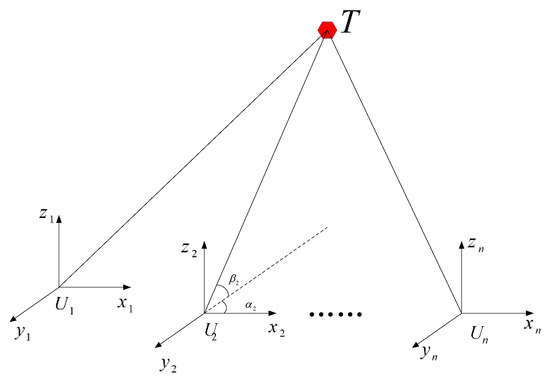
Figure 1.
Multi-station AOA positioning.
Let the coordinates of the target position T to be located be , the number of measurement stations is , then we obtain:
where .
Using the auxiliary angle formula , a transformation of the above equation yields:
where .
Thus, the above system of equations can be expressed in matrix form as follows:
where
3. CTLS Positioning Method
Since there is always an error between the estimate of the actual angle and the true value, it is not possible to obtain the true coefficient matrix. Both and , obtained from the above equation, contain errors, and if only the noise interference of vector is considered, the solution in the least squares sense can be obtained as:
If the noise disturbances from both and are considered and the components of the noise are assumed to be statistically independent, the solution in the overall least squares sense can be obtained as:
where is the right singular vector corresponding to the smallest singular value after the singular value decomposition of matrix , where is the th element of .
However, the matrices A and B are non-linear functions of angle, and the noise terms caused by goniometric errors in both cannot be simply approximated as independent identically distributed Gaussian noise. To obtain a relationship between them, it is useful to make:
where is the true value of the azimuth angle , and is its noise; is the true value of the pitch angle , and is its noise. Then, we have:
Let , and use a Gaussian distribution with zero mean as an approximate assumption for the actual angular error distribution.
Taylor expansion in each element of matrix A and vector B, we can obtain:
The following two equations can be obtained on the basis of neglecting noisy higher-order terms:
where
It can be seen from the above equation that the noise disturbance to both matrices A and B originates from the noise vector . The passive location problem can, therefore, be transformed into a constrained overall least squares problem, as follows:
where
Using the constraints in Equation (10), we can find the expression for as follows:
Then, square the expression for . The problem with constraints can then be transformed into an unconstrained problem, as follows:
Next, we can find the partial derivatives of the objective function, ignoring the higher-order terms of the measurement error, to give an approximate closed solution. Using the Lagrange multiplier method, the objective function can be transformed into a minimization problem for the following equation:
The necessary conditions for finding its minimal value are:
We can obtain , substituting into , we obtain . Then, substituting into , we can obtain:
Collating and substituting Q into , we can obtain:
where
At last, we can obtain:
This approximate closed solution is different from the results obtained in the literature [9]. In this result, V can be considered as a noise estimate of . Therefore, the result obtained in the literature [9] is a special expression for a less noisy version of the results in this paper.
The CTLS-based positioning algorithm in this paper is calculated as follows:
- The initial solution for target location is obtained using the LS algorithm.
- Solve Equation (18) iteratively by Newton’s method to obtain a more exact solution.
The final solution is considered to be obtained when the iterative step size is less than the step size required. However, as the function solved in this paper is non-convex, when the number of iterations is high, the step length of the next step may increase, compared to the step length of the previous step, but when the number of iterations is low (less than or equal to 3), it does not occur, in general, and three iterations are sufficient to obtain a solution that satisfies the requirements. This situation does exist in theory, but in practice, it has a negligible effect on the final position result in arithmetic
4. Optimal UAV Deployment Calculation including Station Errors
While the calculation method is admittedly an important part of the target location calculation, the position of the sensors affects the quality of the initial data and, therefore, the accuracy of the final location results, independent of filtering algorithms, etc. Therefore, in this section, the effect of the sensor arrangement on the final location results will be investigated, and a sensor deployment that minimizes the final location error will be found.
For parameter estimation problems, in order to measure the performance of an unbiased estimator, a Cramerow bound (CRB) is introduced, which establishes a lower bound on the variance of unbiased estimator. The variance of an unbiased estimator can only approach the CRLB without restriction and will not fall below it; hence, this bound can also be referred as the CRLB, which means Cramer–Rao lower bound. The CRLB can be used to calculate the best estimate that can be obtained in unbiased estimation precision. Therefore, it is often used to calculate the best estimation accuracy that can be achieved by theory and to assess the performance of parameter estimation methods. In this paper, the expression for the CRLB-based covariance matrix is as follows:
where is the vector to be estimated. The target location in three-dimensional conditions is explored; therefore, is a three-dimensional vector, and is the estimate of . Additionally, is the covariance matrix of the estimation error. is the CRLB, which means the lower bound of the covariance matrix in a positive definite quadratic sense. is the Fisher information matrix (FIM), which is a measure of the unknown parameters of any random variable, with respect to its own random distribution function. The larger the Fisher information, the larger the variance of the score function, the more information it represents, and the more accurate the estimation of the parameters.
The calculation of the lower bound for CRLB is generally solved by finding the minimum of the inverse matrix of the Fisher information matrix, so here, the Fisher information matrix for AOA positioning with station errors is first established.
Let the motion function of the target be:
where represents the non-linear process of the target motion state, represents the target measurement model, and the noise variables and are uncorrelated.
Then, the recursive form of its corresponding Fisher information matrix at moment k is as follows:
where denotes the Jacobi matrix of the state transfer function, and denotes the Jacobi matrix of the estimated states.
By adding the part of the station address to the observation function, we have:
where .
Denote:
Derivation of the above equation yields a Jacobi matrix representation of the observation function as:
where
We can see that:
So, we can obtain:
The error matrix for the i th station is:
where is the measurement variance of the azimuth angle, is the measurement variance of the pitch angle, and is the positioning error of the station. In general, the calculations for and are set to obey the same Gaussian distribution, but in practice, this is not the case.
Infrared goniometric errors include: base levelling errors, frame azimuth errors, frame pitch axis errors, frame zero calibration errors, internal and external frame pitch axes with different axes of rotation errors, view axis errors, charge-coupled device measurement errors measurement errors, etc. Due to the sight error, which arises from the illumination of the instrument on the target, it has a large effect on azimuth angle and almost no effect on pitch angle. So, the azimuth angle’s measurement error of an infrared goniometric system is twice as large as the pitch angle measurement error, they are not equal.
For every station on UAV, GPS only has positioning information and the error in the station’s own attitude is only determined by INS, and the yaw angle error is also twice as high as the pitch angle error.
Combining the attitude error of the station with the infrared angle measurement error, we can make:
For the self-positioning error of the station, the final positioning error of the GPS combined with the INS is generally no more than 10 m, and its components are approximately equal in the three directions of north, east, and height, so the error matrix of the station observations can be expressed as:
Denote:
Then, there are:
Substituting the above equation into Equation (23), we can obtain:
where:
In the optimal observation configuration, only the current position of the target is considered. Assuming that the current position of the target is fixed, the FIM is obtained when n stations observe a single target, which can be expressed as:
where
and
So, we can obtain:
when the number of stations is , due to , assuming that each station is evenly distributed, relative to the target in the same plane, we can know that the distance between each station and the target and the pitch angle between each station and the target are equal, which means . Because the trigonometric function is a periodic function, so when , if the value of is taken to satisfy , we can obtain:
Then, the above equation can be reduced to:
Taking out the fixed parameters, the above equation can be expressed as:
where
Denote:
The above equation can be expressed as:
Then, the inverse of the FIM is given by:
In order to find the condition for optimal sensor deployment, it is necessary to find the parameters that maximize the FIM. Maximizing the FIM involves maximizing a matrix, for which there is more than one maximization criterion; therefore, a real-valued scalar function needs to be found as the objective function in the optimization problem. There are four main types of FIM-based optimization metrics, namely: the A-class optimal criterion, the D-class optimal criterion, the E-class optimal criterion, and the MV-class optimal criterion.
The scalar function of the D-class optimal criterion is the determinant of the FIM matrix. The physical significance of maximizing the scalar function of the D-class optimal criterion is to minimize the volume of the uncertain ellipsoid. Because the D-class optimal criterion has better continuity, and hence, its better optimization, in general, the D-class optimal criterion is the most popular criterion in both the two-dimensional calculation of AOA and the three-dimensional calculation of TOA. An important advantage of the D-class optimal criterion is that it is invariant under scale changes of the parameters and linear transformations of the output. However, the D-class optimal criterion can also produce some errors, as the D-class optimal criterion multiplies all parameters, so it is quite sensitive to one-dimensional information. Then, one-dimensional information can be improved quickly under the D-class optimal criterion, which has a greater impact on the determinant of the FIM. Therefore, it is also easy to ignore information in other dimensions, resulting in the consequence that the global optimal solution cannot be obtained, so the class D optimality criterion is not applicable in the positioning process of 3D AOA.
The A-class optimal criterion is the most commonly used criterion in the process of the optimal deployment of AOA sensors and has the physical meaning of minimizing the variance of the average estimate. It is defined as minimizing the trace of the CRLB, according to the A-class optimal criterion, so there are:
where and 6 are both fixed values, so that the part that has an effect on the value taken by the CRLB lies at ; then, we have:
Because of the fundamental inequality and because and are both positive, we can obtain:
So, there are:
Taking the derivative of Equation (44), with respect to c, we obtain:
Equation (44) is a first decreasing and then increasing function in the domain of definition (i.e., the azimuth takes values from 0 to 180°), and we can find its minimum by making its derivative 0. So, let Equation (45) be equal to 0, we can find the value of c when CRLB takes the minimum. It is a numerical solution, not a closed form solution. At this time, the value of c is 0.3856. It means , and we can calculate the angle of pitch at this time as 35.5577°.
Figure 2 is a schematic representation of the optimal geometric configuration of a single target with azimuths kept uniformly distributed, with equal pitch angles and equal to 35.5577°.
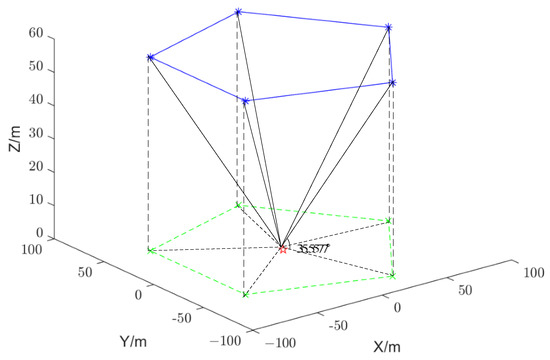
Figure 2.
Multi-station AOA positioning optimal deployment schematic. Red star—Target.
5. Simulation
5.1. CTLS Algorithm Simulation
At first, the simulation of the CTLS positioning method was carried out. The target was located at coordinates (100, 100, 100), and four stations are moving at a constant speed and in a straight line at the altitude of 1000 m. The positioning error of the stations was 1 m, the azimuth error was 0.2°, and the pitch angle error was 0.1°. Their station-target trajectories are represented in Figure 3.
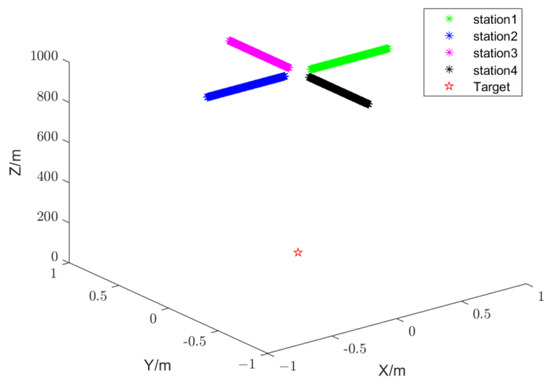
Figure 3.
Simulated positioning trajectory.
In Figure 4, the red plus line shows the resultant error of the CTLS algorithm, the purple star shows the final location error of the CWLS algorithm, and the blue dotted line represents the error calculated by the LS algorithm. A comparison of the three shows that the CTLS algorithm derived in this paper is effective in reducing the location error by approximately 10%, compared to the ordinary least squares algorithm, and by approximately 5%, compared to the CWLS algorithm.
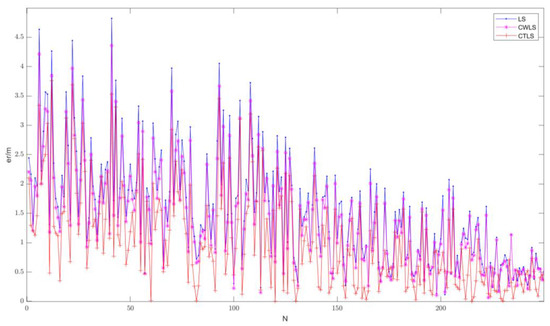
Figure 4.
Figure Comparison of target positioning errors.
5.2. CRLB Simulation
CRLB is the lower limit of the variance of the unbiased estimation quantity generally needed to process a large amount of data to obtain its results. In this simulation, total 100 stations locate the same target, then the Kalman filter algorithm obtains the positioning results of the data processing. When the station to the target pitch angle is different, use the Kalman filter to calculate the station calculation results for processing. The values of pitch angle are 15, 30, 35, 45, 60, 75, and the 35.5577 obtained in this paper, which can be compared in follows. Additionally, to make it easier to observe, the error values are magnified by a factor of 100 for comparison.
Figure 5 represents a schematic representation of the relative positions of the 100 UAVs to the target when the only difference is the pitch angle.
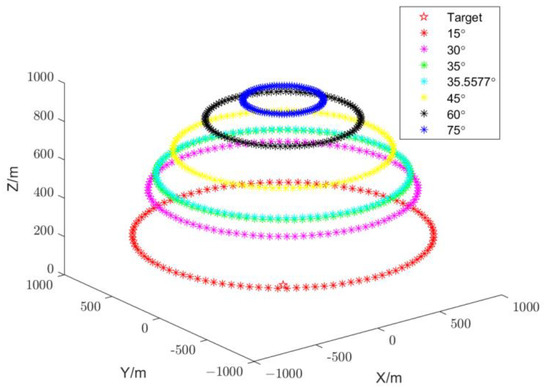
Figure 5.
Schematic diagram of multi-stations positioning deployment.
The mean error values at different pitch angles are tabulated in Table 1 below.

Table 1.
Comparison of mean values of positioning errors at different pitch angles.
The different colors and large shaped lines in the Figure 6 represent a comparison of the positioning error at different pitch angles when the azimuth is the same. As we can see from the Figure 6 and Table 1, the smallest error can be achieved when the pitch angle is 35°. A separate comparison of the images found above for the particular angle of 35.5577°, with the angle of 35°, will be made in Figure 7.
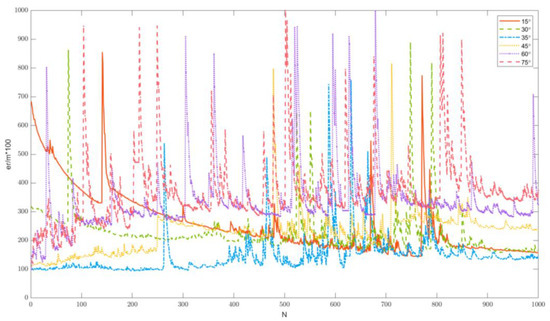
Figure 6.
Comparison of errors for different values of pitch angle.
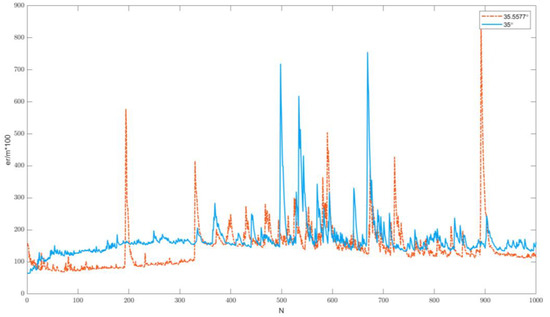
Figure 7.
Comparison of errors for two particular pitch angle values.
It can be seen that, under the prerequisites set in this paper, considering the station errors, uniform sensor distribution, and the pitch angle measurement error is only half of the azimuth measurement error, the CRLB for target positioning is minimized when the pitch angle is taken to 35.5577 degrees, which is the optimal arrangement of sensor carriers for target positioning.
6. Conclusions
This paper derives a CTLS algorithm that takes into account station errors and the presence of error correlation and discusses the optimal sensor deployment strategy for 3D AOA when all sensors are uniformly distributed, but the azimuth angle measurement error is twice the pitch angle measurement error. The simulation results show that the CTLS algorithm proposed in this paper is able to reduce the error in target location by about 10%, compared to the LS algorithm, when station errors are considered. Under the constraint of the class A optimality criterion, when the pitch angle measurement error of the infrared angle measurement accuracy is only half of the azimuth angle measurement error, and the stations is set to be uniformly distributed from the target, the error of the AOA positioning result is minimized when the pitch angle is 35.56 degrees. So, the conclusion of this paper is correct.
In this literature, only the optimal deployment problem is considered for the case where the number of UAVs is more than two and in the same plane. When only two UAVs are present for AOA positioning, the calculation method adopted in this paper is not applicable, as the FIM is not a diagonal matrix; therefore, the calculation needs to be performed later for the case where only two UAVs are present. Secondly, when the UAVs are not in the same plane, relative to the target, that means the pitch angles are not equal. So, the optimal deployment arrangement is different from the case studied in this paper. Finally, the distance of the target, relative to all UAVs, may not be exactly equal, and the optimal deployment in this case, again, cannot use the conclusions of this paper. The authors hope to find the optimal deployment of AOA positioning for any situation that unifies the above scenarios into a single model, in order to obtain a more generalized result.
Follow-up plans for this paper.
- Explore the optimal arrangement of stations, relative to the target, when they do not exist in the same plane.
- To explore the optimal alignment for the case of dual station positioning.
- To explore the optimal placement of stations, relative to the target, when the assumption of uniform distribution cannot be satisfied, which means the stations is not equally distant from the target.
Author Contributions
Conceptualization, T.Z.; methodology, C.W.; validation, W.F.; formal analysis, M.Z.; investigation, H.C.; writing—original draft preparation, C.W. All authors have read and agreed to the published version of the manuscript.
Funding
This research was funded by National Natural Science Foundation of China (NSFC), grant number 61603297, and Natural Science Foundation of Shaanxi Province, grant number 2020JQ-219.
Data Availability Statement
Not applicable.
Conflicts of Interest
The authors declare no conflict of interest.
References
- Noroozi, A.; Sebt, M.A. Target Localization in Multistatic Passive Radar Using SVD Approach for Eliminating the Nuisance Parameters. IEEE Trans. Aerosp. Electron. Syst. 2017, 53, 1660–1671. [Google Scholar] [CrossRef]
- Zhao, Y.; Zhao, Y.; Zhao, C. Single-observer Passive DOA-TDOA Location Based on Regularized Constrained Total Least Squares. J. Electron. Inf. Technol. 2016, 38, 2336–2343. [Google Scholar]
- Ding, W.; Shuai, W. The constrained-total-least-squares localization algorithm and performance analysis based on an external illuminator. Sci. Sin. Inf. 2015, 45, 1466–1489. [Google Scholar]
- Torrieri, D.J. Statistical theory of passive location systems. IEEE Trans. Aerosp. Electron. Syst. 1984, 2, 183–197. [Google Scholar] [CrossRef]
- Pages-Zamora, A.; Vidal, J.; Brooks, D.H. Closed-Form Solution For Positioning Based on Angle of Arrival Measurements. In Proceedings of the 13th IEEE International Symposium on Personal, Indoor and Mobile Radio Communications, Lisbon, Portugal, 18 September 2002; pp. 1522–1526. [Google Scholar]
- Cheung, K.W.; So, H.C.; Ma, W.K.; Chan, Y.T. A Constrained Least Squares Approach to Mobile Positioning: Algorithms and Optimality. Eurasip J. Adv. Signal Process. 2006, 2006, 20858. [Google Scholar] [CrossRef]
- Abatzoglou, T.J.; Mendel, J.M.; Harada, G.A. The constrained total least squares technique and its applications to harmonic superresolution. IEEE Trans. Signal Process. 1991, 39, 1070–1087. [Google Scholar] [CrossRef]
- Yang, K.; An, J.; Bu, X.; Sun, G. Constrained Total Least-Squares Location Algorithm Using Time-Difference-of-Arrival Measurements. IEEE Trans. Veh. Technol. 2010, 59, 1558–1562. [Google Scholar] [CrossRef]
- Sun, G.; Xu, X.; Kai, Y. Angle-of-Arrival based Constrained Total Least-Squares Location Algorithm. In Proceedings of the 2012 National Conference on Information Technology and Computer Science, Lanzhou, China, 16–18 November 2012; pp. 513–515. [Google Scholar]
- Meng, W.; Xie, L.H.; Xiao, W.D. Optimality analysis of sensor-source geometries in heterogeneous sensor networks. IEEE Trans. Wirel. Commun. 2013, 12, 1958–1967. [Google Scholar] [CrossRef]
- Bishop, A.N.; Fidan, B.; Anderson, B.D.; Doğançay, K.; Pathirana, P.N. Optimality analysis of sensor-target localization geometries. Automatica 2010, 46, 479–492. [Google Scholar] [CrossRef]
- Herath, S.; Pathirana, P. Optimal Sensor Arrangements in Angle of Arrival (AoA) and Range Based Localization with Linear Sensor Arrays. Sensors 2013, 13, 12277–12294. [Google Scholar] [CrossRef]
- Sadeghi, M.; Behnia, F.; Amiri, R. Optimal sensor placement for 2-D range-only target localization in constrained sensor geometry. IEEE Trans. Signal Process. 2020, 68, 2316–2327. [Google Scholar] [CrossRef]
- Yoo, K.; Chun, J. Analysis of optimal range sensor placement for tracking a moving target. IEEE Commun. Lett. 2020, 24, 1700–1704. [Google Scholar] [CrossRef]
- Zhao, S.Y.; Chen, B.M.; Lee, T.H. Optimal sensor placement for target localization and tracking in 2D and 3D. Int. J. Control 2013, 86, 1687–1704. [Google Scholar] [CrossRef]
- Lee, W.; Bang, H.; Leeghim, H. Cooperative localization between small UAVs using a combination of heterogeneous sensors. Aerosp. Sci. Technol. 2013, 27, 105–111. [Google Scholar] [CrossRef]
- Wang, L. Modeling and Optimization for Multi-Uavs Cooperative Target Tracking. Ph.D. Thesis, National University of Defense Technology, Changsha, China, 2011; pp. 76–83. [Google Scholar]
- Zhong, Y.; Wu, X.; Huang, S.; Li, C.; Wu, J. Optimality analysis of sensor-target geometries for bearing-only passive localization in three-dimensional space. Chin. J. Electron. 2016, 25, 391–396. [Google Scholar] [CrossRef]
- Zuo, Y.; Liu, X.J.; Peng, D.L. UAV path planning for AOA-based source localization with distance-dependent noises. J. Electron. Inf. Technol. 2021, 43, 1192–1198. [Google Scholar]
- Liu, Z.; Gao, X.G.; Fu, X.W. Co-optimization of communication and observation for multiple UAVs in cooperative target tracking. Control Decis. 2018, 33, 1747–1756. [Google Scholar]
- Li, Y.Y.; Wang, C.C.; Qi, G.Q.; Sheng, A.D. Closed-form formula of Cramer-Rao lower bound for 3D TOA target localisation. Electron. Lett. 2020, 56, 43–45. [Google Scholar] [CrossRef]
- Xu, S.; Dogancay, K. Optimal sensor placement for 3-D Angle-of-Arrival Target Localization. IEEE Trans. Aerosp. Electron. Syst. 2017, 53, 1196–1211. [Google Scholar] [CrossRef]
- Valicka, C.G.; Stipanovic, D.M.; Bieniawski, S.R.; Vian, J. Cooperative avoidance control for UAVs. In Proceedings of the 10th International Conference on Control, Automation, Robotics and Vision, Hanoi, Vietnam, 17–20 December 2008. [Google Scholar]
- Xu, S.; Ou, Y.S.; Zheng, W.M. Optimal sensor-target geometries for 3-D static target localization using received-signal-strength measurements. IEEE Signal Process. Lett. 2019, 26, 966–970. [Google Scholar] [CrossRef]
- Wang, S.; Jackson, B.R.; Inkol, R. Performance Characterization of AOA Geolocation Systems Using the Von Mises Distribution. In Proceedings of the 2012 IEEE Vehicular Technology Conference (VTC Fall), Quebec City, QC, Canada, 3–6 September 2012. [Google Scholar]
- Sheng, X.; Dogancay, K. Optimal Sensor Deployment for 3D AOA Target Localization. In Proceedings of the 2015 IEEE International Conference on Acoustics, Speech and Signal Processing (ICASSP), South Brisbane, Australia, 19–24 April 2015. [Google Scholar]
- Hmam, H. Optimal Sensor Velocity Configuration for TDOA-FDOA Geolocation. IEEE Trans. Signal Process. 2016, 65, 628–637. [Google Scholar] [CrossRef]
- Hamdollahzadeh, M.; Amiri, R.; Behnia, F. Optimal sensor placement for multi-source AOA localisation with distance-dependent noise model. IET Radar Sonar Navig. 2019, 13, 881–891. [Google Scholar] [CrossRef]
- Ponda, S.; Kolacinski, R.M.; Frazzoli, E. Trajectory Optimization for Target Localization Using Small Unmanned Aerial Vehicles. In Proceedings of the AIAA Guidance, Navigation, and Control Conference, Chicago, IL, USA, 10–13 August 2009. [Google Scholar]
- Moreno-Salinas, D.; Pascoal, A.; Aranda, J. Sensor Networks for Optimal Target Localization with Bearings-Only Measurements in Constrained Three-Dimensional Scenarios. Sensors 2013, 13, 10386–10417. [Google Scholar] [CrossRef] [PubMed]
Publisher’s Note: MDPI stays neutral with regard to jurisdictional claims in published maps and institutional affiliations. |
© 2022 by the authors. Licensee MDPI, Basel, Switzerland. This article is an open access article distributed under the terms and conditions of the Creative Commons Attribution (CC BY) license (https://creativecommons.org/licenses/by/4.0/).