Abstract
At present, decision-making in ATM is fragmented between different stakeholders who have different objectives. This fragmentation, in unison with competing KPAs, leads to complex interdependencies between performance indicators, which results in an imbalance, with some of these indicators being penalized to the apparent benefit of others. Therefore, it is necessary to support ATM stakeholders in systematically uncovering hidden trade-offs between KPAs. Existing literature confirms this claim, but how to solve it has not been fully addressed. In this paper, we envision air traffic complexity to be the framework through which a common understanding among stakeholders is enhanced. We introduce the concept of single aircraft complexity to determine the contribution of each aircraft to the overall complexity of air traffic. Furthermore, we describe a methodology extending this concept to define complex communities, which are groups of interdependent aircraft that contribute the majority of the complexity in a certain airspace. Through use-cases based on synthetic and real historical traffic, we first show that the algorithm can serve to formalize and improve decision-making. Further, we illustrates how the provided information can be used to increase transparency of the decision makers towards different airspace users. In order to showcase the methodology, we develop a tool that visualizes different outputs of the algorithm. Lastly, we conduct sensitivity analysis in order to systematically analyse how each input affects the methodology.
1. Introduction
Air Traffic Management (ATM) is a complex socio–technical system comprising three main layers—air space management (ASM), air traffic flow management (ATFM) and air traffic control (ATC) [1]—whose performance is measured through various Key Performance Areas (KPAs), of which some of the most important are safety, capacity, cost-efficiency and environment [2]. Although part of ATM structure, each of these layers has different objectives, which in practice compete to maximize their own goals. Several authors point out that complex interdependencies among the decision layers can cause unnecessary penalization of some KPAs to improve others. In [3], the authors claim as a result of early SESAR projects such as STREAM [4], that the exact relationship among these KPAs is still not well-understood and should be further studied in future research. Moreover, recent finalized projects such as APACHE [5] targeting the analysis of the interdependencies between the different KPAs by capturing the Pareto-front of ATM still claim that further research is needed to uncover the inter-dependencies between the different KPAs [6]. An important challenge that must be overcome to reach such a Pareto-front of ATM KPAs is the lack of an effective coordination mechanism (i.e., system behaviour) among ATM subsystems and corresponding Decision Support Systems (DSSs).
Figure 1 illustrates a conceptual framework for ATM-related quality of services based on [7,8]. The idea is to visualize all the components (i.e., subsystem, KPA and DSS) and mark the inter-relations between them. Distinguishing components is done by colour-coding based on their functions and definitions. Each component is connected to one or more components. The component that is attached to the arrowhead indicates that it is affected by the other. Note that connectors have different colours based on the origin of the subsystems (e.g., ATC). According to [9], the represented interactions can be considered complex adaptive systems (CAS), which typically include multiple loops and multiple feedback paths between many interacting entities, as well as inhibitory connections and preferential reactions.
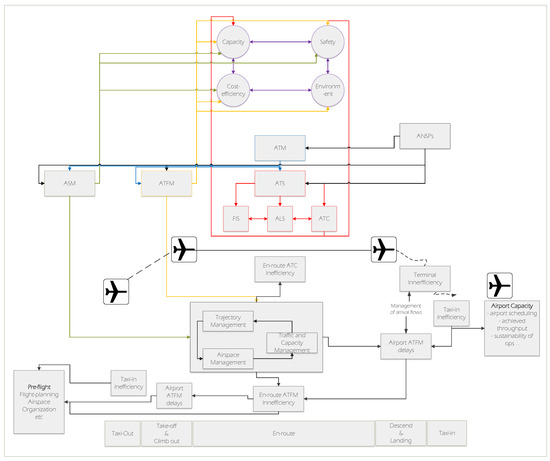
Figure 1.
Conceptual Framework for ATM-related quality of services.
Furthermore, an illustrative example highlights the interactions among the DSSs that target airspace management (AM), trajectory management (TM) and capacity management. This is a common example to highlight how these decisions can cause a chain of reactions resulting in en-route ATC inefficiency, delays at airports (taking-off and landing) and en-route ATFM inefficiency [10]. To date, the lack of a formal analysis between these control mechanisms leads to a lack of transparency and coordination between different DSSs that could improve ATM performance.
Complex interdependencies among the mentioned KPAs have been key for the aeronautic community to accept the confusing term emergent dynamics, which, in fact, is justified by the un-modelled behavioural dynamics among these objectives (i.e., capacity, safety and efficiency). For instance, the consequences of a small reduction in sector capacity (considering ground weather conditions) usually are tackled by over-conservative ATM actions to avoid safety issues at the cost of penalizing flight efficiency. On the other hand, other solutions with better information (weather information on the flight deck) could improve flight efficiency. In [11], a difference between weak emergent dynamics and strong emergent dynamics is introduced to differentiate between micro-level interactions among subsystems (weak) and emergence caused by irreducible macro causal mechanisms (strong). The authors of this paper accept that unpredictable decision-making processes carried out by a human actor (i.e., aircraft pilot or air traffic controller) justify the term strong emergent dynamics in ATM, which can be observed in several ATM socio–technical subsystems [12].
To avoid an ATM system being ruled by strong emergent dynamics due to abrupt human behaviour, in this paper, we propose a new methodological framework to enhance common understanding among the different stakeholders. It is worthwhile highlighting that as a result of the implemented methodology, the framework allows ANSP to work closely with the rest of stakeholders, avoiding over-constraining solutions. Moreover, the proposed framework paves the way for shared situational awareness in which the effects of unpredictable decision-making processes carried out by human actors is mitigated by the consensus reached among the different actors, transforming the strong emergent dynamics into weak emergent dynamics of ATM.
The core idea behind the proposed methodology lies in understanding complexity evolution of overall air traffic. In this paper, we extend the complexity notion and indicators proposed in [13] by introducing the concept of single aircraft complexity. We define single aircraft complexity as the contribution that individual aircraft have to overall sector complexity. Furthermore, we identify groups of interdependent aircraft that form highly complex spatiotemporal areas. This method identifies the individual and community (i.e., groups of aircraft) contributions in an on-line fashion and gives information about the creation, evolution and disappearance of communities. This information could enhance equity and fairness at the aircraft or airline granularity level together with NM and ANSP service performance. The proposed method could make an immediate impact on the smooth transition between ATM layers and DSS tools. In other words, each subsystem should comply with its operational performance specifications (e.g., ATC must prevent loss of separations) while decreasing mutual penalization.
The rest of this work is structured as follows: In Section 2, we describe in detail the methodology. Section 3 provides an overview of the experimental setup. In Section 4, we present and discuss several use-cases based on synthetic and real traffic, as well as an extensive sensitivity analysis. We draw conclusions and discuss future steps in Section 5.
2. Methodology
2.1. Spatiotemporal Graph-Based Complexity Indicators
While there have been many different definitions of airspace complexity, in this work, we extend the one introduced in [13]. There, the authors focus on defining complexity for a certain volume of space (e.g., a sector) during a time window of interest and model air traffic as a dynamic graph . The set of vertices for time t is comprised of the aircraft present in the sector at the time, while the set of edges is the interdependencies between each pair aircraft at time t. Interdependencies are defined based on the distance between aircraft—more specifically, if two aircraft are closer than a certain threshold, then there will be a weight between these two aircraft. The closer the aircraft, the bigger the weight of the edge between these two aircraft, which means that the graph is weighted and undirected. Weights are normalized to be between 0 and 1.
In their work, they are interested in en-route traffic at the tactical level; therefore, they define the weight of the edge to be maximal (i.e., 1) when there is loss of separation between a pair of aircraft (5 NM horizontally and 1000 feet vertically). Horizontal and vertical interdependencies are calculated separately, and the overall interdependency between two aircraft is the average of the two. Formally, this is defined as:
where and are the horizontal and vertical weights at time t, respectively. Furthermore, and are the distances, H and V are the safety distances, and and are the thresholds.
Airspace complexity is treated as a multifaceted notion, and the authors propose four indicators that quantify topological information and combine it with the severity of the interdependencies. We briefly describe these indicators; however, we refer the reader to [13] for a detailed overview.
Edge Density (ED) measures how many edges the graph has compared to the number of edges in a fully connected graph of the same size with maximal edges. Formally:
where is the number of vertices in the graph at time t, and is the maximal number of edges.
Strength measures the severity of pairwise interdependencies. It is obtained by extending the definition of vertex degree to account for edge weights:
Clustering Coefficient (CC) measures the local cohesiveness and gives information regarding the local neighbourhood of each vertex (i.e., aircraft). Formally, it is calculated as follows:
Nearest Neighbour Degree (NND) calculates a local weighted average degree of the nearest neighbour for each aircraft:
The first indicator is inherently a global measure, while the remaining three indicators are turned into global measures by taking the average across vertices in the graph.
The overall complexity of a sector is chosen to be given as the evolution in time of each indicator, and the authors argue that this results in a more nuanced overview of complexity.
2.2. Single Aircraft Complexity
While the previously described methodology gives a more nuanced view of complexity than simpler metrics (e.g., dynamic density [14]), it still suffers from a common drawback of the majority of existing complexity metrics: a lack of interpretability of the complexity scores. More specifically, given a certain traffic configuration, existing methods cannot provide information as to which areas of the sector are causing most of the complexity and how much of it they are causing. Furthermore, [13] does not discuss ways to combine the information provided by each indicator.
In this work, we exploit an inherent characteristic of complexity defined based on graph theory to overcome this major drawback. As previously mentioned, three of the four indicators described, which will be the focus of our work, can be defined in terms of single aircraft, with the overall result being the average across aircraft. This means we can generate a complexity score for every single aircraft present in the sector at time t and for every indicator without loss of information. However, this is not sufficient, as single scores would simply induce an order between aircraft for every indicator without providing any information regarding the overall situation of complexity in the sector. Another issue with this method is that it contains redundant information, as interdependencies are undirected, e.g., and . Finally, it is not clear how to interpret the scale and value of the complexity scores. Furthermore, since the indicators have a different range of possible values that they can take, it is not trivial how to combine the individual absolute scores of every aircraft.
In this paper, we propose to slightly change the perspective and calculate the contribution of each aircraft to the overall sector complexity. This results not in an absolute score, but in a percentage that is relative to what is currently happening in the sector at the time. Without loss of generality, we show how the contribution is calculated for the strength indicator. Let us consider an arbitrary sector that at time t is occupied by the aircraft shown in Figure 2. Following Equation (5), we can determine the individual strengths of the aircraft, as shown in Table 1.
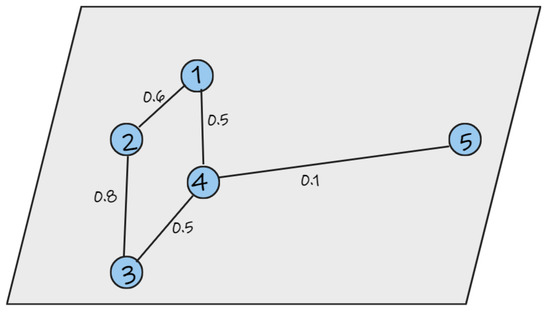
Figure 2.
Example of an arbitrary sector. Nodes represent the aircraft in the sector.

Table 1.
Individual contributions to the strength indicator.
The individual contributions are calculated as what part of the whole strength each aircraft is responsible for. Different from the original definition of overall strength (the average), in this work, we slightly modify this definition and take the whole as the sum of all aircraft. In this case, the overall strength is:
The contribution of aircraft i to the overall strength is then:
Using this formula, we can now determine the contribution of each aircraft to the overall strength, as shown in Table 1. Following a similar method, we can generalize how to calculate the contribution of an aircraft for every complexity indicator relevant to our work (strength, CC and NND):
This method allows us to meaningfully combine the contributions of all three complexity indicators. As we are considering the contributions relative to the current situation in the sector, we can observe what percentage of the overall sector complexity each aircraft is responsible for. While there are different ways this can be achieved depending on the use case, in this work, we choose the average of non-zero valued indicators in the sector. Only the indicators that have a non-zero value are used, as we are interested in showing the contribution to the existing complexity in the sector as quantified by the indicators. For instance, if , then this indicator is not a source of complexity for the sector at time t; therefore, aircraft should not be attributed with contributing to this indicator. This is formalised as:
where the denominator is the cardinality of the set of non-zero valued indicators at time t.
This methodology is illustrated with the example in Figure 3, and the results are in Table 2. As can be seen, Aircraft 2 contributes the most to the overall complexity with 20.45%. This example shows that the methodology successfully combines the information of all complexity indicators, as Aircraft 2 is part of a cluster with 1 and 4 and also has a strong interdependency with Aircraft 4 that increases its strength and NND scores. The topology of the subgraph comprised of Aircraft 1–4 is mirrored in the subgraph formed by Aircraft 5–8. However, we note that the interdependencies in the latter are weaker, which is correctly reflected in the contributions of these aircraft.
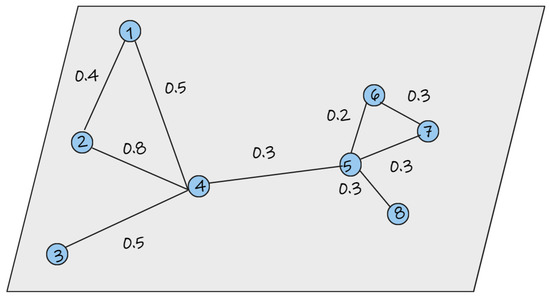
Figure 3.
A more complex example. Nodes represent aircraft.

Table 2.
Contribution to complexity from each aircraft in Figure 3.
Nevertheless, we again note that the method of combining the contributions from each complexity indicator can depend on the use-case, and we use a weighted average instead. For instance, let us assume that this methodology will be used by the ATC. In this case, it could be reasonable that the most important indicator is strength, as it directly informs about the distances of aircraft and how close they are to a loss of separation. Such information could be provided by giving more weight to the contributions from the strength indicator while maintaining some of the information provided by the other two indicators.
It is important to note as well the computational complexity of calculating single aircraft complexity over a certain time window. In this work, there are three complexity indicators on which single aircraft complexity is based: strength, NND and CC. The computational complexity of strength and NND is , where N is the number of aircraft at time t, and T is the time window. On the other hand, the computational complexity of CC is at worst , where N and T retain the same meaning. Nevertheless, it is important to note that this is the worst-case complexity, where the graph is fully connected. We expect that a carefully tuned threshold for interdependencies will rarely result in such scenarios and only for short fractions of the duration of the time window. As a result, the worst-case computational complexity for calculating single aircraft complexity is .
2.3. Detection of Complex Spatiotemporal Communities
Using the concept of single aircraft complexity introduced in the previous section, it is possible to find groups of interdependent aircraft that contribute the majority of the complexity in the sector. Finding tightly interdependent groups of nodes in a graph (i.e., communities) is a well-known problem in graph theory, with many existing algorithms providing high-quality communities efficiently, such as the Louvain and Leiden algorithms [15,16]. However, these algorithms optimize for modularity, which is a quantity that measures the density of connections within a community. Graphs with a high modularity score have many connections within a community but few pointing outwards to other communities. Briefly, the algorithms explore for every node if its modularity score might increase if it changes its community to that of one of its neighbouring nodes.
Given the definition of modularity, it could be reasonable to expect that the communities that these algorithms find could coincide with highly complex communities, but verification of this assumption will simply increase the runtime of the algorithm. Nevertheless, the more important issue of the aforementioned algorithms is that communities tend to share at least some edges. For the application in this paper, it is unclear how this situation ought to be treated.
To illustrate this point, let us take the graph in Figure 3. In this case, the Louvain and Leiden algorithms output two communities: one comprised of Aircraft 1–4 and the other comprised of Aircraft 5–8. However, these communities are connected, as there is an edge between 4 and 5. It is non-trivial to determine what weight is big enough to consider both communities together. Therefore, in this work, we choose to be more conservative, always considering such communities together. In fact, this is also a known problem in graph theory, known as connected component detection [17]. In graph theory, a connected component of a graph is a connected subgraph that is not part of any larger connected subgraph. Such components separate the vertices into disjointed sets. In the case of Figure 3, there is one connected component, i.e., the whole graph. An advantage of this choice is that connected components can be determined in linear time [17], where N is the number of vertices; while the Louvain algorithm runs in , where M is the number of edges, which is typically considered slower as the number of edges is higher than the number of vertices [18]. In this work, we filter out communities with one aircraft.
Following Equation (11), we can determine the contribution of the community to the overall sector complexity, which we define as the sum of contributions for the individual aircraft in the community. Determining when a community is, in fact, a complex community is not trivial. Complexity has often been linked to the workload of controllers [19], which can be subjective [20,21,22]. In this work, we do not attempt to make any claims to relate the complexity indicators with the workload of controllers; we merely present a methodology that provides granular information of complexity given the definition of the aforementioned complexity indicators (which are objective). Therefore, in this work, we propose setting a contribution threshold above which a community is deemed to be a complex community. In such a way, we maintain some flexibility in defining complex communities to better fit decision-makers in the present structure of ATM, allowing each user to set a particular threshold. Formally, for a community in time step t, we have:
where is the user/problem-specific threshold.
So far, we have defined complex communities only for one time step t. However, as we are looking at a time window (here, we assume that the time window is a series of discrete time steps), the continuous evolution of traffic complexity should be analysed. We have determined three generic events that could happen: appearance, disappearance and evolution.
Appearance and disappearance in a complex community are defined as the time steps in which the community started and stopped being a complex community, respectively. These two events can be trivially determined by applying Equation (12) for the length of the time window. On the other hand, the evolution of complex communities requires more consideration. During the period of time when a complex community exists, new aircraft might join it, i.e., at least one existing aircraft of the community forms an interdependency with an aircraft outside of it; or aircraft might leave it, i.e., an existing aircraft stops having any interdependencies with the other aircraft of the community. In such cases, the community should be considered the same, which in this work, we will refer to as having the same label. Therefore, the problem of community evolution can be seen as determining how community labels are maintained over time.
In order to formalize the evolution of complex communities, we propose an algorithm based on the Jaccard similarity. This method, formally defined below for two arbitrary sets A and B,
measures the similarity of sets as the size of the intersection between the size of the union of these sets. The range of is between 0 and 1, with 0 meaning that the intersection is empty, i.e., the sets have no common elements. In this work, we utilize Jaccard similarity to determine the evolution of complex communities through time. For an arbitrary community in time t, we determine if there are communities in that are similar to it. If, in fact, there are multiple communities that have a non-zero similarity to , then the one with the biggest similarity score is determined to have the same label as community . In more concise terms, if communities share some members in consecutive time steps, they are defined to share the same label feature of this algorithm; it is only necessary to look at the previous time step, as labels can be propagated through time. Furthermore, it is trivial to determine at what time step aircraft joined or left an existing community.
If there are no similar communities in , then community is a new label in the set of complex communities for the time window we are studying. Consequently, we can define all three generic events for complex communities in terms of labels: appearance is the first time when a label is present, and disappearance is the last time when the label is present. The whole algorithm is described in Algorithm 1.
| Algorithm 1 Detection of Complex Communities |
|
Let us illustrate this algorithm through the example in Figure 4. There, an arbitrary sector in two time steps is shown. In , there are three communities, namely the community labelled with Aircraft 1–4, then community with 5–7, and the last one is community with a single aircraft, 8, which is filtered out. Let us assume that in , community is complex, while the others are not. As we are at the initial time step, there are no previous time steps; thus, the set of complex communities would have with members 1–4 all added at .

Figure 4.
Illustration of complex-community detection algorithm.
In , the communities have changed in terms of membership. Community with members 1–5 is a complex community. As per the algorithm, the previous time step is queried to find any other existing complex communities where is found. Then, the Jaccard similarity is calculated with . Therefore, there exists one complex community in the previous time step that has a non-zero similarity score with . This means that received as the label, and the original community is updated to contain the new information. Thus, now contains Aircraft 1–5, with the four former aircraft being added in and Aircraft 5 being added in . For the sake of completeness, let us investigate what happens to community in . As can be observed, the remaining aircraft that comprise have no interdependencies with any other aircraft. Therefore, there are no communities with non-zero similarity to . In this case, if is indeed a complex community, we would be able to say that it appeared in with members 5–7 and disappeared in .
Similar to single aircraft complexity, the computational complexity of the community-detection algorithm can also be analysed. As previously mentioned, this algorithm runs in linear time with respect to the number of aircraft (nodes in the graph). This implies that the computational complexity of Algorithm 1 is, in fact, , where N is the number of aircraft, and T is the time window. However, this is the worst-case analysis, in which complex communities are to be found in every time step of the window. Given carefully tuned parameters of this algorithm, this is not expected to happen often. Nevertheless, we note that Algorithm 1 and the calculation of single aircraft complexity for 7 h of traffic (see Section 4.2) were completed in less than 5 s.
3. Experimental Setup
In order to effectively showcase the algorithm, we built a tool to visualize the results. We developed this tool as a web application in Python using Dash (https://plotly.com/dash/ accessed on 12 October 2022) as a frontend. There are four main plots that are the outputs of the tool:
- Complexity animation—For every time step in the window of interest, the positions, interdependencies and complexity contributions for each aircraft are shown. This information is shown as an animation through the time window. The goal of this output is to clearly convey the evolution of complexity during a particular time window. In order to visually indicate when a community is complex, the interdependencies between aircraft of this community are coloured red.
- Strength indicator animation—This plot provides similar information as the previous one. However, in this, only the strength indicator is shown. More specifically, for each aircraft, we provide the value of the maximal weight of the pairwise interdependencies that it is part of. As the strength indicator is defined through pairwise distances, it is directly linked to conflicts and losses of separation. Thus, the goal of this plot is to show specific safety-related information.
- Heatmap of complex communities—This output shows as a heatmap the contribution of every complex community that has existed through the duration of the time window. As the x-axis is time, the coexistence or any other time relation between complex communities can also be inferred. We also keep track of the aircraft in the sector that do not belong to a complex community, which we refer to as the “Pool”. All aircraft that are responsible for some of the complexity in the sector are shown there. These aircraft are also part of communities that are responsible for less than the complexity threshold. When no complex communities exist, the Pool is responsible for 100% of the complexity.
- Summary table—This table shows a detailed summary of every complex community that has existed in the time window. We show relevant information such as start and end time, all members that have been part of the community, and when each member was added and removed.
Lastly, there is also the possibility of generating and downloading a summary file for the current log file. This summary file contains the values of the input parameters and statistical information regarding the number, size, duration and percentage of communities. The statistical information comprises the mean, standard deviation and minimum and maximum values. However, such a functionality could be easily adapted or extended with respect to the needs of the practitioners.
The workflow to use the tool is shown in Figure 5. In this work, we use BlueSky [23] as the simulation platform for the trajectories. From BlueSky, the tool requires as input a file that for every time step logs the positions of every aircraft. We note that it is not a requirement to use BlueSky, and the tool is not dependent on it. A file with the logged information is, however, a requirement. Furthermore, there are three more inputs to the tool; namely, the minimal and maximal thresholds in order to form the interdependencies, and the complexity threshold for a community to be considered complex. As this tool has been written in Python, it will be straightforward to extend the functionalities of the tool and also to integrate it with other existing tools, services and infrastructure. The tool has been open sourced (https://github.com/risufaj/Single-Aircraft-Complexity accessed on 12 October 2022).
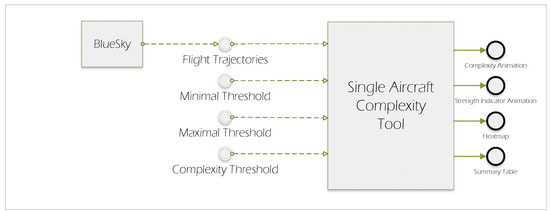
Figure 5.
Workflow for visualization tool.
4. Results
4.1. Synthetic Traffic
In this section, we describe several scenarios based on synthetic traffic to showcase how the information provided by the methodology and the tool can be utilized. First of all, we show a scenario in which we analyse ATC decisions. In another scenario, we illustrate how ATFM decisions can affect KPAs.
4.1.1. Pairwise Conflicts
In this scenario, shown in Figure 6, we start with an arbitrary sector with five aircraft present, and the simulation lasts for 15 min. The complexity information is illustrated in Figure 7. The trajectories have been generated in such a way that there will be a conflict between AC2–AC3 and AC4–AC5 at some time t. Furthermore, the conflict between AC4–AC5 starts slightly earlier, but both conflicts will coexist in time.
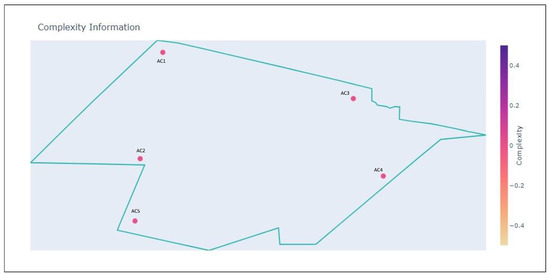
Figure 6.
Initial state of scenario.
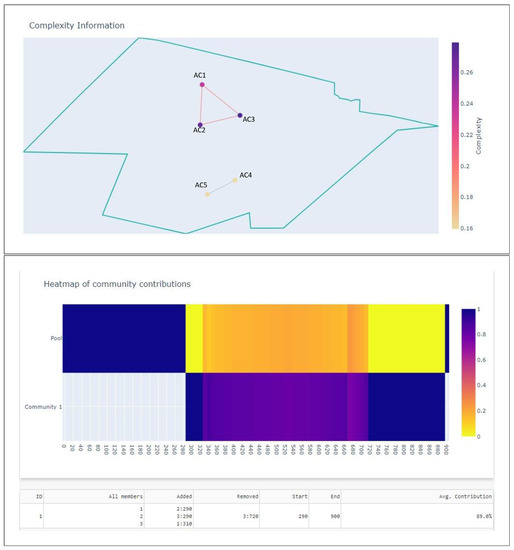
Figure 7.
Complexity of aircraft.
In such a situation, ATCo will have to solve two conflicts that are happening around the same time, and we assume it will be unable to solve them simultaneously. We also assume that there is enough time for ATCos to prevent loss of separation in pairwise conflicts.
In Figure 8, the state of the aircraft when the ATCo should have been alerted by the current conflict detection method is illustrated. This is shown in the tool through the Strength indicator, which directly correlates to the relative state between aircraft. The Strength of AC2–AC3 is 0.55, and AC4–AC5 is around 0.6 (1 is a loss of separation). Typically, ATCos would solve the earlier conflict first, i.e, AC4–AC5. However, the presence of AC1 complicates this decision. Following the evolution of trajectories, AC1 will eventually create a compound conflict [24] with AC2 and AC3. This is not shown yet by using only the Strength indicator; however, when measuring single aircraft complexity as previously described, we can observe the following complexity situation shown in Figure 7. There, it can be seen that the community created by AC1, AC2 and AC3 is a complex community.
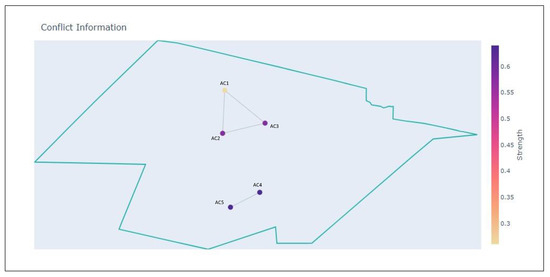
Figure 8.
Conflict state.
The provided information should affect the decision of the ATC by considering three different KPAs.
- Safety—First of all, if the conflict between AC4 and AC5 is solved first, it is not guaranteed that it will be done before AC1 is in conflict with AC2 and AC3. This means that the ATCos would have to solve a compound conflict. The algorithm quantifies this information, and the tool presents it in such a way that clearly illustrates which aircraft form the compound conflicts and complex communities. Therefore, using the information provided by the tool, the ATCo should make the decision to solve the pairwise conflict between AC2 and AC3 first. Furthermore, the conflicts could be resolved in such a way that, at best, reduces the overall complexity and, at worst, just avoids secondary conflicts. This information could be acquired by running the algorithm again after a resolution is proposed.
- Efficiency—However, the controllers might still be able to solve the compound conflict. One way to solve it could be to force one of the aircraft to have a large deviation from its original trajectory. This solution would effectively reduce the compound conflict to a pairwise conflict. However, such a resolution would not be preferred, as the aircraft that is deviated will incur delays, which results in inefficient use of time and fuel.
- Capacity—Nevertheless, delays to one of the aircraft might be unavoidable. Another option could for the controller to determine that they are not able to solve these conflicts in time. Let us assume that in this case, ATC would make a request for one of these aircraft to be delayed. The ATCos will have the information about which aircraft are in conflict and which aircraft form a complex community. Consequently, delaying one of the aircraft could be done by maintaining some fairness, and therefore, one of the aircraft of the complex community should be delayed. Determining which of them to delay would depend on the capabilities of the ATCos to solve two pairwise conflicts around the same time.
4.1.2. Deconstructing Complex Communities
In this scenario, we study the same sector as in the previous section. There will be 7 aircraft present in total through the simulation, which lasts 20 min. AC1 is present throughout the simulation and forms various interdependencies with the other aircraft. The other aircraft were generated in such a way that they intersect with the trajectory of AC1 at different time steps. There were no restrictions on whether the other aircraft can form interdependencies amongst themselves. This is illustrated in Figure 9, Figure 10 and Figure 11, in which the sector is shown in three different time steps; in the initial , AC1 has interdependencies with AC2 and AC3 but not with AC4 and AC5.
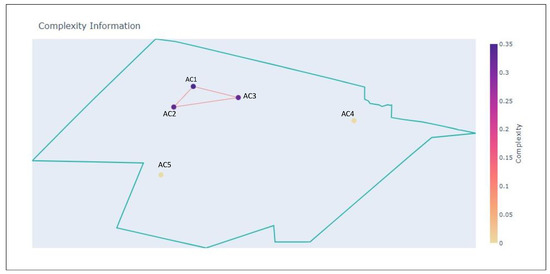
Figure 9.
Initial state of the sector at .
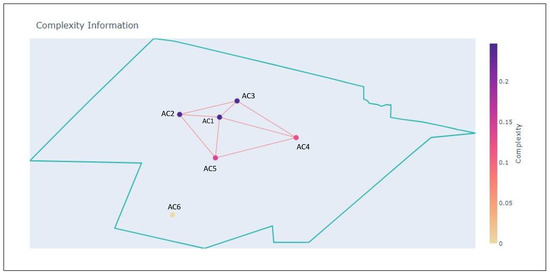
Figure 10.
Sector at .
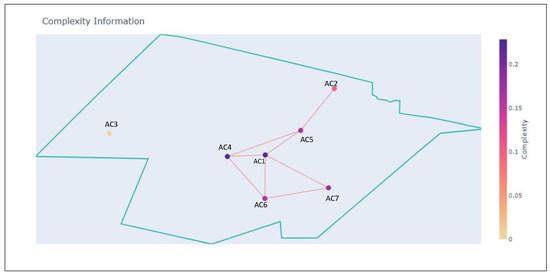
Figure 11.
Sector at .
At , AC1 has created interdependencies with AC4 and AC5, while the remaining aircraft have also created interdendencies amongst themselves. At , AC1 has travelled through the sector enough to create interdependencies with AC6 and AC7.
The complexity evolution is shown in Figure 12. As can be seen, one complex community is detected; it lasts from s to s and comprises all the members that have passed through the sector during the simulation time. The community starts with AC1, AC2 and AC3, and during the simulation, AC1 forms interdependencies with AC4–AC7, which causes the initial community to evolve. According to Algorithm 1, communities in consequent time steps will be considered the same if they are similar enough. In this case, from Figure 10, we observe that the community is comprised of AC1–AC5, while in Figure 11, the community is comprised of AC1–AC7, with the exception of AC3. Thus, AC1 is a permanent member of the complex community, which is why the community lasts so long.
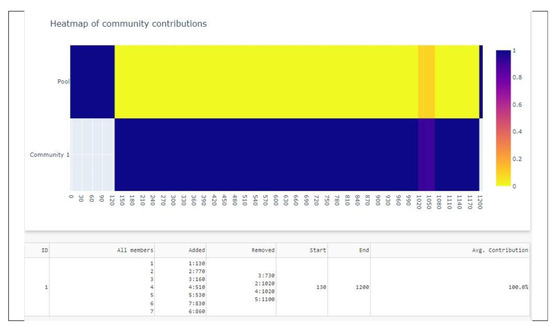
Figure 12.
Complexity evolution.
The situation illustrated above could be problematic for the ATC as it demands its continuous attention throughout the time window as a result of the nature of the interdependencies. Therefore, it is reasonable to expect that the ATM system should intervene to make this situation more manageable. The information that the algorithm provides through the tool could be used to better formalize and understand the consequences of decisions. For instance, let us assume the absence of AC1 in the sector during the window of the simulation (e.g., due to delay or flight-plan change). This is illustrated in Figure 13, Figure 14 and Figure 15. Furthermore, the complexity evolution in this case is shown in Figure 16.
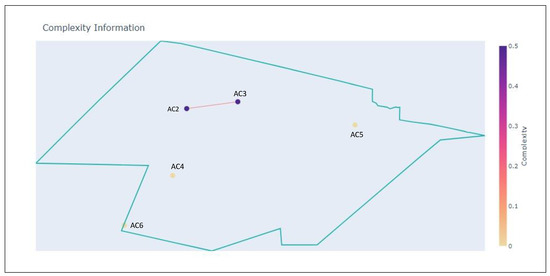
Figure 13.
Initial state of the sector at without AC1.
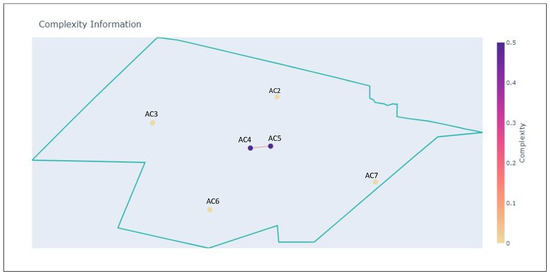
Figure 14.
Sector at without AC1.
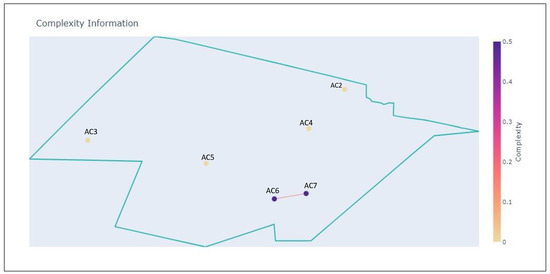
Figure 15.
Sector at without AC1.
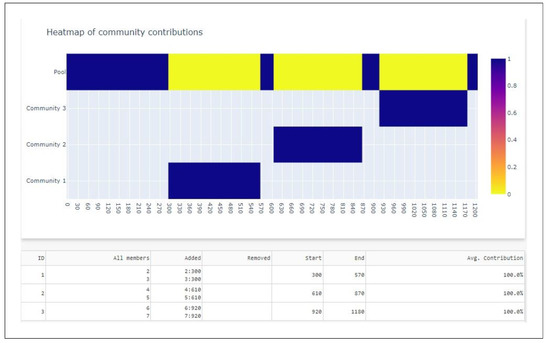
Figure 16.
Complexity evolution without AC1.
In this situation, the absence of AC1 results in the previously complex community to be split into three smaller but still complex communities. It can also be noted that these communities do not overlap in time. The communities have only two members, which causes only Strength to be a non-zero complexity indicator. This situation is less complex than the previous one in which several different topologies were present in the sector.
The lack of understanding of how and why the complex situation arises may lead the different ATM subsystems to make arbitrary decisions that can clearly affect efficiency and fairness. Let us assume that both ATFM and ATC agree that some sort of regulation needs to be made. However, each of them could propose regulations that affect one or more aircraft. Using the information provided from the tool, the aircraft that needs to be affected by the regulations becomes evident. As previously stated, the absence of AC1 results in a more manageable situation. This is evidence that the use of the methodology proposed in this work leads to better equity and fairness at the aircraft or airline level. The objectiveness of the provided information results in a neutral tool that increases transparency and explainability of decisions made by ATM subsystems with regards to AUs.
4.2. Flown Trajectories
4.2.1. Data
We evaluate the algorithm using real historical traffic from 17 August 2019 provided by CRIDA. The available data contain flown trajectories in several sectors over Spain starting from noon and lasting for about 7 h. In total, there are 485 flights in the dataset. Furthermore, the dataset contains a list of flights that were regulated for the Pamplona Upper ATC Sector (LECMPAU), shown in Figure 17. The type of regulations were time delays issued from ATC due to airspace capacity. Preliminary analysis of the data showed that of the 485 flights, 329 crossed the LECMPAU sector, and 82 out of those were regulated (24.9%). The mean delay was 14.8 min, with a standard deviation of 11.2 min. The minimum delay was 1 min, while the maximum was 59 min.
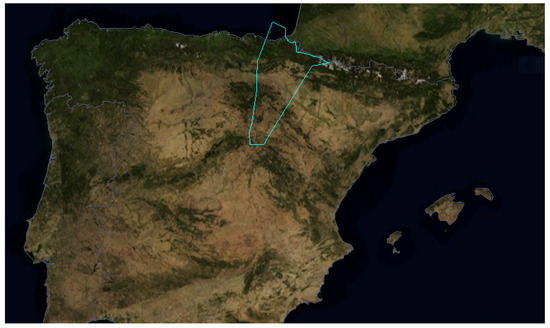
Figure 17.
Pamplona Upper ATC Sector.
Using the information available, we simulated two scenarios in Bluesky: one with the applied regulations, and the other without the applied regulations.
4.2.2. The Effect of Regulations on Complex Communities
In this section we inspect how complex communities are affected by the regulations present in the dataset. In order to do so, we simulate the two scenarios for the total duration of 7 h. The trajectories with the regulations applied are the actual flown trajectories. However, we are not aware of how and when the delays were applied exactly. Thus, in order to create the trajectories without the regulations applied, we always removed the delay from the initial point of the trajectory.
In order to visualize the effects, we identified three windows lasting 30 min each. The input parameters for the minimal and maximal distance thresholds and the complexity thresholds were set to 5 NM, 33 NM and 60% respectively. The complex communities for the first time window are shown in Figure 18 and Figure 19. As can be observed, in the scenario in which the regulations were not applied, there exists only one community throughout the time window. Compared to the scenario where the regulations were applied, we observe five total complex communities. As a result of the complexity threshold being set to 60%, these communities do not coexist in time. This result provides evidence that the delayed aircraft were key in keeping the community in Figure 19 together, similar to the synthetic scenario elaborated in Section 4.1.2. The presence of only one complex community indicates that all relevant aircraft in the sector have interdependencies, which is also suggested by the colour of the heatmap, with the community being responsible for 100% of the complexity for the majority of the time window. This topology is evidence of a very complex situation. Through the regulations, we can observe that the complexity is divided in time between several communities. Communities 1, 2 and 3 have a relatively short duration; however, they are responsible for all of the complexity in the sector. This suggests that the controller is provided elaborated information about which areas of the sector are causing the complexity present in the sector. Such information is further supported by the other outputs of the tool, e.g., the animation of single aircraft complexity contributions. This scenario serves to further illustrate two advantages of the proposed methodology: it increases the transparency of decisions made by different subsystems of ATM, and it provides a framework through which to formalize the need for regulations (in this case from the point of view of ATC).
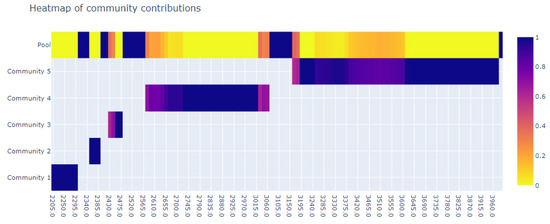
Figure 18.
Complex communities for the first time window with regulations.
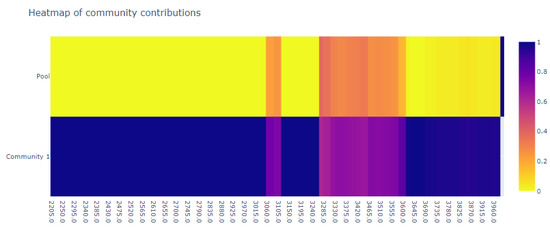
Figure 19.
Complex communities for the first time window without regulations.
However, as can be seen in the second (Figure 20 and Figure 21) and third (Figure 22 and Figure 23) time windows, this is not the full story. There, we can observe that the regulations change the composition of complex communities only slightly. These results suggest that complexity largely remains the same in both scenarios (i.e., with and without regulations applied). Furthermore, it is interesting to note that during these time windows, the difference in occupancy between the two scenarios was the highest. In the scenario without the applied regulations, there were consistently 5–7 more aircraft than in the one with the regulation applied. Such a result echoes claims made in other works [13,25] that the occupancy of sectors does not provide elaborated information about the complexity of the traffic.
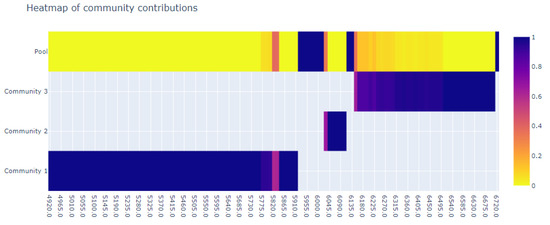
Figure 20.
Complex communities for the second time window with regulations.
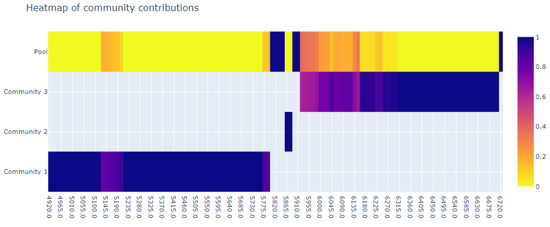
Figure 21.
Complex communities for the second time window without regulations.
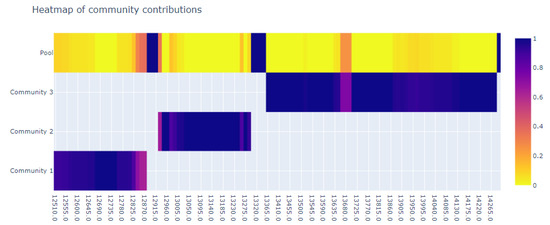
Figure 22.
Complex communities for the third time window with regulations.
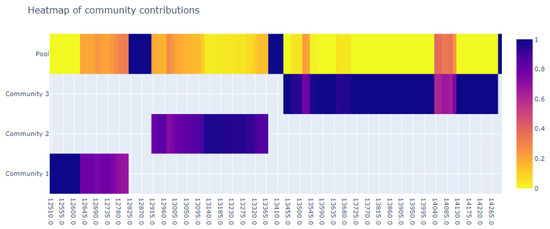
Figure 23.
Complex communities for the third time window without regulations.
Moreover, it is worth noticing that in the scenarios without the regulations applied, the Pool tends to be responsible for more complexity. This means that the delayed aircraft were largely not present in the complex communities but were in the surrounding traffic. Such a distribution of complexity is evidence of the granularity of the information provided by the proposed algorithm, as it is able to capture subtle differences in sector complexity, which could explain in a nuanced way why the particular regulations were applied, something that sector occupancy cannot provide.
4.3. Sensitivity Analysis
The algorithm proposed in this work has three main parameters: minimal and maximal interdependency thresholds and the threshold for a community to be considered complex. These parameters should depend on the problem setting and the individual user; however, it is important to understand how they affect the output of the algorithm. We conduct a sensitivity analysis that investigates how the output of a system can be attributed to its inputs. More specifically, we use the Sobol method [26,27], which is a variance-based global sensitivity analysis. The variance of the output is decomposed into fractions that are attributed to the inputs. The main advantage of using this method lies in the fact that it deals with nonlinear responses and can measure the interactions between input parameters.
In order to perform a Sobol analysis, a parameter sequence is generated, which, in this work, returns a Sobol sequence using Saltelli’s sampling scheme [27]. A Sobol sequence is a quasi-randomized, low-discrepancy sequence that samples the space more uniformly than a completely random sequence. The Saltelli scheme extends this sequence in a way that reduces the error rates in the calculations. To understand how the variance of the output can be attributed to the input parameters and their interactions, the total and first- and second-order sensitivity indices are calculated. The first-order sensitivity indices are used to measure the fractional contribution of a single parameter to the output. Second-order sensitivity analysis is used to measure the contribution of parameter interactions to the output variance. The total sensitivity indices take into account all the previous indices.
In this work, the sensitivity analysis is conducted using the regulated data described in Section 4.2.1. In order to reduce the computational burden of the analysis, motivated furthermore by the fact that these data have been of particular importance for the ATC, we keep a fixed minimal distance threshold of 5 NM. The ranges for the maximal distance threshold and the complexity threshold are NM and , respectively. To perform the analysis, 6200 different combinations are generated. Lastly, we measure the response of three different outputs of the algorithm: number of communities, median size of communities (number of total members) and median duration of the communities.
The results of the sensitivity analysis are shown in Figure 24. As can be observed, for all outputs, the total-sensitivity Sobol indices indicate that the the maximal distance threshold for the interdependencies is the input that affects the output the most. In this work, the graph and, in turn, the communities, are generated by considering the distance threshold in order to build the edges. Thus, it is evident that this should affect the number of communities and the size of communities the most. For instance, when the distance is large enough, then at time t, it is reasonable to expect that the traffic graph is fully connected. In such a scenario, the complexity threshold is irrelevant, as the community induced by the fully connected graph is always responsible for 100% of the complexity at time t. A similar example could also be used to illustrate why this happens for the size of the communities. A large (or small) enough distance threshold will largely dictate which aircraft form interdependencies. With either extreme value, it is clear to see that the relevant aircraft form the complex communities, thus also determining the size of the communities. Figure 25 and Figure 26 are further evidence of this. As can be seen, the number and size of communities is strongly dependent on the distance threshold. The number of communities is inversely proportional to the threshold, while the size of the communities is proportional. We also observe a correlation between the size of communities with the complexity threshold, as shown in Figure 27. Nevertheless, as the sensitivity analysis suggests, this is as a result of the correlation between the two input parameters. In order for a community to be responsible for 100% of the complexity, it should contain all aircraft that have at least one interdependency, which can be the case for bigger distance thresholds.
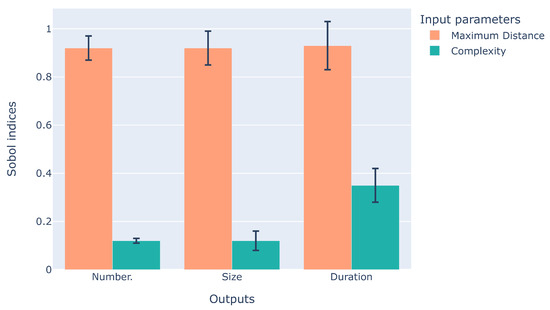
Figure 24.
Total sensitivity analysis using the Sobol method.
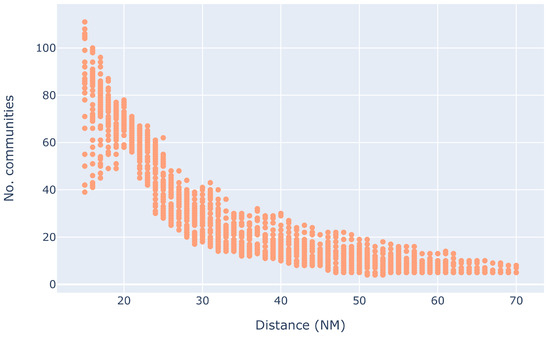
Figure 25.
Number of communities for different distance thresholds.
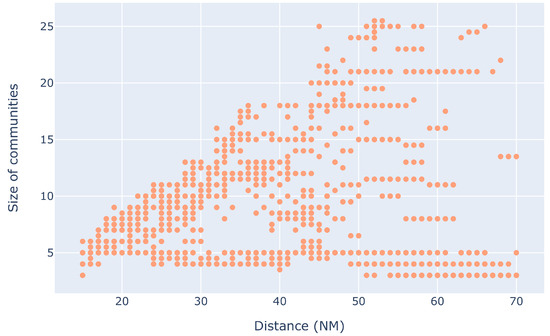
Figure 26.
Size of communities for different distance thresholds.
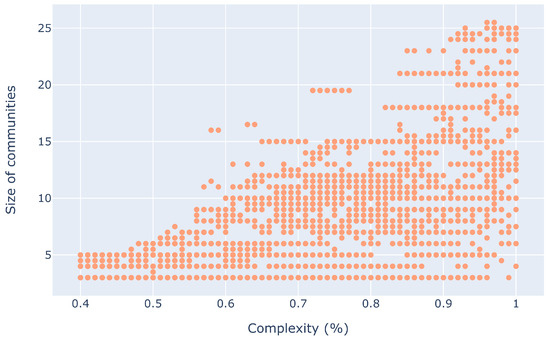
Figure 27.
Size of communities for different complexity thresholds.
From Figure 24, it can be observed that the median duration is also affected most by the distance threshold, which is further evidenced in Figure 28. There, we can see that when the distance threshold is low, communities tend to last a shorter time. This happens because smaller distance thresholds are very sensitive to changes in aircraft positions, as also evidenced from Figure 25, where smaller distance thresholds lead to many communities present.
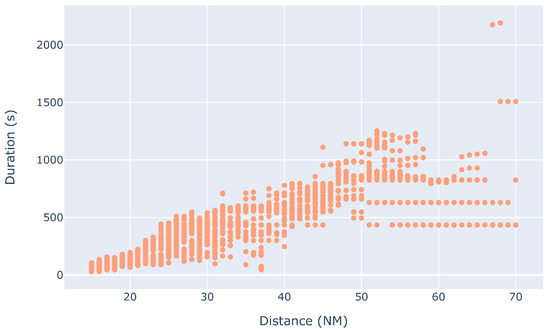
Figure 28.
Duration of communities for different distance thresholds.
To give some insight into how the median duration is affected by the complexity threshold, we show Figure 29 and Figure 30. When the distance threshold is less than 25 NM, we observe that the duration decreases with an increased complexity threshold. Such a result can be explained by the fact that a small distance threshold makes it more likely to have communities that are comprised of a subset of the aircraft coexisting in time in the sector. Consequently, aircraft can join communities, allowing communities to exist longer. Nevertheless, this interpretation does not tell the whole story, as it can be observed that in such a setting, the longest-existing community existed for around 400 s. On the other hand, when the distance threshold is bigger than 25 NM, the duration of communities is affected less by the complexity threshold. In this setting, we can observe that most communities last less than 17 min (less than 1000 s). The different responses for different distance thresholds explains the Sobol index for the complexity threshold in Figure 24.
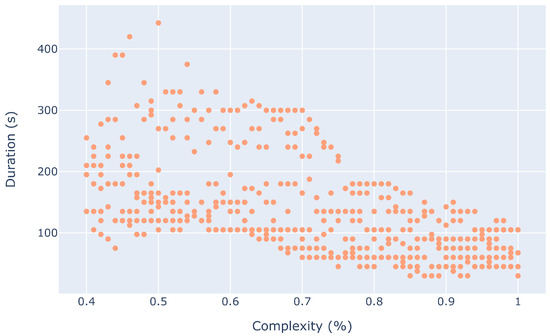
Figure 29.
Duration of communities for different complexity thresholds (distance threshold < 25 NM).
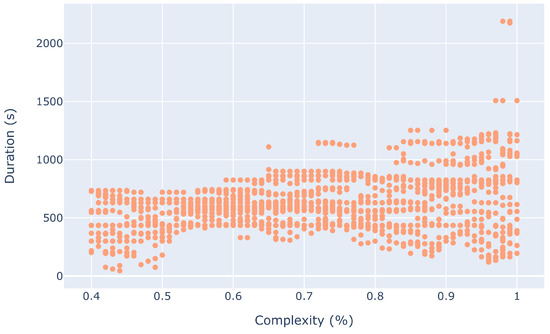
Figure 30.
Duration of communities for different complexity thresholds (distance threshold > 25 NM).
While we show that the algorithm is mostly affected by the distance threshold, this does not indicate what input values different ATM subsystems should use. In fact, the analysis that we conducted in this section should serve practitioners (e.g., NM, ATC, etc.) to determine what values are more suitable for their use-case. For instance, a similar analysis could be used as a baseline to quantify controller preferences, whether that be in the topology of the graph the traffic induces or any of the other outputs provided by the proposed algorithm in this paper. Finally, while we do not expect the behaviour of the algorithm to fundamentally change with other datasets, the analysis conducted in this section also heavily depends on the sector (or any other division of airspace) that is being investigated.
5. Conclusions
In this work, we propose a methodology that extends existing air traffic complexity indicators based on dynamic graphs to provide highly granular and nuanced information. As such, the concept of single aircraft complexity is proposed, which measures the individual contribution of each aircraft to the overall sector complexity. Furthermore, the algorithm provides complex communities, which are connected components of the air traffic graph, in order to determine complex spatiotemporal areas in the sector.
To effectively illustrate the algorithm, a web application was developed to visualize several outputs of the algorithm, namely: a complexity animation, a strength indicator animation, a heatmap of complex communities and a summary table of complex communities. Furthermore, the tool also provides the user with the possibility of downloading a summary file for the scenario being investigated. The tool (and the underlying algorithm) are envisioned as neutral aids that can ease the smooth functional transition between ATM layers and DSS tools that should be used in union with existing tools. Furthermore, the information provided could enhance equity and fairness at the aircraft of airline granularity level.
In order to support our claims, we provide detailed use-cases based on synthetic traffic and real historical traffic. We first show that the algorithm can serve to formalize controller decisions and guide controllers to better decisions in situations where multiple pairwise conflicts coexist in time. Further, we investigate how the provided information can be used to increase the transparency of decision-makers towards different AUs, which also serves to increase fairness and equity. Moreover, the algorithm was evaluated using historical traffic that had been regulated through delays to several aircraft as a result of ATC capacity. We constructed two scenarios—one with the regulations applied and the other without the regulations applied—and showed how the complex communities were affected in three 30 min time windows. Finally, an extensive sensitivity analysis for two of the inputs to the algorithm (maximum distance threshold to form interdependencies and the complexity threshold for a community to be considered complex) was conducted. The sensitivity analysis was conducted for three outputs of the system: number of communities, median size of communities and median duration of communities. We found that the maximum distance threshold affects these outputs the most. To fully understand this result, the response of each output to the different input values was studied. We argued how a similar analysis could be used to quantify controller preferences for graph topologies in the sector.
Nevertheless, the proposed algorithm should be extended and further refined. Most importantly, as one of the inputs to the tool is trajectories in time, a way to consider uncertainties should be investigated. As previously mentioned, the tool is envisioned to be used alongside existing tools; therefore, one way to consider uncertainty would be for the inputs to the tool to have modelled uncertainty beforehand. However, it could be interesting to extend the definition of the graph to contain not a weight for any interdependency, but a distribution of weights.
Moreover, the input parameters of the algorithm are envisioned to be tuned according to the problem and preferences of the practitioners. Nevertheless, the tool could have several “modes” when given a certain value for the distance and complexity thresholds. For instance, a more conservative mode could consider larger inputs that would lead to bigger communities that last longer but would visually provide more information about aircraft that are further in the community. Through the animation output, the practitioner could still visualize the core of the community. A less conservative mode would instead only consider the core of the communities in order to provide only crucial members of the communities.
The information provided should be evaluated by practitioners in a user study in order to optimize how and what information is shown. Moreover, the tool should be further developed into a mature DSS in order to be used alongside existing tools and methodologies.
Finally, this work represents a possibility to further investigate ATM from the perspective of role-based collaboration (RBC) [28], which is a computational methodology that uses roles as the primary underlying mechanism to facilitate collaboration activities. The most prominent model in this paradigm is the Environments–Classes, Agents, Roles, Groups and Objects (E-CARGO) model [29], which divides a system into the aforementioned components. Different relationships can be formalized between these components, which allows complicated systems such as ATM to be formalized. E-CARGO could be used to formalize the interdependencies between the different subsystems of ATM and their KPAs. On top of that, the concept of air traffic complexity as used in this paper could be utilized to evaluate the performance of agents that play certain roles in ATM (the usage of the terms agents and roles is guided by the context of RBC).
Author Contributions
Conceptualization, R.I. and M.A.P.; methodology, R.I., M.O. and M.A.P.; software, R.I. and J.S.V.; data curation, R.I., M.O. and J.S.V.; writing—original draft preparation R.I., M.O. and M.A.P.; writing—review and editing, R.I., M.O., M.A.P. and C.E.V.G.; visualization, R.I. and J.S.V.; supervision, M.A.P. and C.E.V.G. All authors have read and agreed to the published version of the manuscript.
Funding
This work was supported in part by the H2020 EngageKTN, grant agreement no. 783287, and CRIDA scholarship for research, development and innovation in ATM.
Institutional Review Board Statement
Not applicable
Informed Consent Statement
Not applicable
Data Availability Statement
The synthetic traffic data (log files and scenarios that can be simulated with BlueSky) described in Section 4.1 can be accessed through this link (https://uab-my.sharepoint.com/:f:/g/personal/1558645_uab_cat/EtfXW9yJv5ZFmnm7fdvPI70BsJQrRfU8387z6SVWvzB1aw?e=H3P0c accessed 12 October 2022). The tool is open-source and can be accessed through this link (https://github.com/risufaj/Single-Aircraft-Complexity accessed 12 October 2022).
Acknowledgments
We thank Xin Wang from CRIDA for the insights on the traffic data.
Conflicts of Interest
The authors declare no conflict of interest.
Abbreviations
| ATM | Air Traffic Management |
| ATFM | Air Traffic Flow Management |
| ASM | Air Space Management |
| KPA | Key Performance Area |
| ATC | Air Traffic Control |
| DSS | Decision Support System |
| CAS | Complex Adaptive System |
| TM | Trajectory Management |
| AC | Aircraft |
| ATCo | Air Traffic Controller |
References
- Nieto, F.J.S. Collision Risk Model for High-Density Airspaces. In Risk Assessment in Air Traffic Management; IntechOpen: London, UK, 2020; p. 3. [Google Scholar]
- Days, S.I. Modelling interactions in complex systems—An air navigation service provider focussed approach. In Proceedings of the SESAR Innovation Days, Madrid, Spain, 25–27 November 2014. [Google Scholar]
- Ruiz, S.; Lopez Leones, J.; Ranieri, A. A novel performance framework and methodology to analyze the impact of 4D trajectory based operations in the future air traffic management system. J. Adv. Transp. 2018, 2018, 1601295. [Google Scholar] [CrossRef]
- Ranieri, A.; Martinez, R.; Piera, M.A.; Lopez, J.; Vilaplana, M. STREAM—Strategic Trajectory de-confliction to Enable seamless Aircraft conflict Management. In Proceedings of the 1st SESAR Innovation Days (SIDs), Brussels, Belgium, 29 November–1 December 2011. [Google Scholar]
- Netjasov, F.; Crnogorac, D. Assessment of safety performance indicators of future air traffic management system. In Proceedings of the XLIV Symposium on Operational Research (SYM-OP-IS), Zlatibor, Serbia, 25–28 September 2017. [Google Scholar]
- Netjasov, F.; Crnogorac, D.; Pavlovic, G. Assessment of the Future Air Traffic Management System Safety Performance using Network-based Simulation Model. In Proceeding of the SESAR Innovation Days (SID 2018), Salzburg, Austria, 3–7 December 2018. [Google Scholar]
- Recommended Key Performance Indicators for Measuring ANSP Operational Performance. 2015. Available online: https://canso.fra1.digitaloceanspaces.com/uploads/2020/08/RecommendedKPIforMeasuringANSOOperationalPerformance.pdf (accessed on 12 October 2022).
- FAA.; Eurocontrol. Comparison of Air Traffic Management-Related Operational Performance U.S./EUROPE. 2017. Available online: https://www.eurocontrol.int/sites/default/files/2019-05/us-europe-comparison-operational-performance-2017.pdf (accessed on 12 October 2022).
- Battistella, C.; Colucci, K.; De Toni, A.F.; Nonino, F. Methodology of business ecosystems network analysis: A case study in Telecom Italia Future Centre. Technol. Forecast. Soc. Chang. 2013, 80, 1194–1210. [Google Scholar] [CrossRef]
- Gulding, J.; Knorr, D.; Rose, M.; Chen, X.; Enaud, P.; Hegendoerfer, H. US/Europe comparison of ATM-related operational performance. Air Traffic Control. Q. 2010, 18, 5–27. [Google Scholar] [CrossRef]
- Bedau, M. Downward causation and the autonomy of weak emergence. Principia Int. J. Epistemol. 2002, 6, 5–50, reprinted as Downward causation and the autonomy of weak emergence. Principia Int. J. Epistemol. 2002, 6, 155–188. [Google Scholar]
- Piera, M.A.; Muñoz, J.L.; Gil, D.; Martin, G.; Manzano, J. A Socio-Technical Simulation Model for the Design of the Future Single Pilot Cockpit: An Opportunity to Improve Pilot Performance. IEEE Access 2022, 10, 22330–22343. [Google Scholar] [CrossRef]
- Isufaj, R.; Koca, T.; Piera, M.A. Spatiotemporal graph indicators for air traffic complexity analysis. Aerospace 2021, 8, 364. [Google Scholar] [CrossRef]
- Laudeman, I.V.; Shelden, S.G.; Branstrom, R.; Brasil, C. Dynamic Density: An Air Traffic Management Metric. 1998. Available online: https://ntrs.nasa.gov/api/citations/19980210764/downloads/19980210764.pdf (accessed on 12 October 2022).
- Blondel, V.D.; Guillaume, J.L.; Lambiotte, R.; Lefebvre, E. Fast unfolding of communities in large networks. J. Stat. Mech. Theory Exp. 2008, 2008, P10008. [Google Scholar] [CrossRef]
- Traag, V.A.; Waltman, L.; Van Eck, N.J. From Louvain to Leiden: Guaranteeing well-connected communities. Sci. Rep. 2019, 9, 1–12. [Google Scholar] [CrossRef] [PubMed]
- John, C.; Allan, H.D. A First Look at Graph Theory; Allied Publishers: Mumbai, India, 1995. [Google Scholar]
- Traag, V.A. Faster unfolding of communities: Speeding up the Louvain algorithm. Phys. Rev. E 2015, 92, 032801. [Google Scholar] [CrossRef]
- Chatterji, G.; Sridhar, B. Measures for air traffic controller workload prediction. In Proceedings of the 1st AIAA, Aircraft, Technology Integration, and Operations Forum, Los Angeles, CA, USA, 16–18 October 2001; p. 5242. [Google Scholar]
- Marchitto, M.; Benedetto, S.; Baccino, T.; Cañas, J.J. Air traffic control: Ocular metrics reflect cognitive complexity. Int. J. Ind. Ergon. 2016, 54, 120–130. [Google Scholar] [CrossRef]
- Ayaz, H.; Willems, B.; Bunce, B.; Shewokis, P.A.; Izzetoglu, K.; Hah, S.; Deshmukh, A.; Onaral, B. Cognitive workload assessment of air traffic controllers using optical brain imaging sensors. In Advances in Understanding Human Performance: Neuroergonomics, Human Factors Design, and Special Populations; CRC Press: Boca Raton, FL, USA, 2010; pp. 21–31. [Google Scholar]
- Weiland, M.Z.; Roberts, D.M.; Fine, M.S.; Caywood, M.S. Real time research methods: Monitoring air traffic controller workload during simulation studies using electroencephalography (EEG). In Proceedings of the Human Factors and Ergonomics Society Annual Meeting; SAGE Publications: Los Angeles, CA, USA, 2013; Volume 57, pp. 1615–1619. [Google Scholar]
- Hoekstra, J.M.; Ellerbroek, J. Bluesky ATC simulator project: An open data and open source approach. In Proceedings of the 7th International Conference on Research in Air Transportation, FAA/Eurocontrol USA/Europe, Philadelphia, PA, USA, 20–24 June 2016; Volume 131, p. 132. [Google Scholar]
- Isufaj, R.; Omeri, M.; Piera, M.A. Multi-UAV Conflict Resolution with Graph Convolutional Reinforcement Learning. Appl. Sci. 2022, 12, 610. [Google Scholar] [CrossRef]
- Delahaye, D.; Puechmorel, S. Air traffic complexity: Towards intrinsic metrics. In Proceedings of the Third USA/Europe Air Traffic Management R & D Seminar, Napoli, Italy, 13–16 June 2000. [Google Scholar]
- Sobol, I.M. Global sensitivity indices for nonlinear mathematical models and their Monte Carlo estimates. Math. Comput. Simul. 2001, 55, 271–280. [Google Scholar] [CrossRef]
- Saltelli, A.; Ratto, M.; Andres, T.; Campolongo, F.; Cariboni, J.; Gatelli, D.; Saisana, M.; Tarantola, S. Global Sensitivity Analysis: The Primer; John Wiley & Sons: Hoboken, NJ, USA, 2008. [Google Scholar]
- Zhu, H. Role-based collaboration and E-CARGO: Revisiting the developments of the last decade role-based collaboration (RBC) is an emerging computational methodology that uses roles as the prim. IEEE Syst. Man Cybern. Mag. 2015, 1, 27–36. [Google Scholar] [CrossRef]
- Zhu, H.; Zhou, M. Role-based collaboration and its kernel mechanisms. IEEE Trans. Syst. Man Cybern. Part C Appl. Rev. 2006, 36, 578–589. [Google Scholar]
Publisher’s Note: MDPI stays neutral with regard to jurisdictional claims in published maps and institutional affiliations. |
© 2022 by the authors. Licensee MDPI, Basel, Switzerland. This article is an open access article distributed under the terms and conditions of the Creative Commons Attribution (CC BY) license (https://creativecommons.org/licenses/by/4.0/).