
An Available-to-Implement Thermal Facility for Dynamic Bleed Air Test of Aircraft Environmental Control System


Abstract
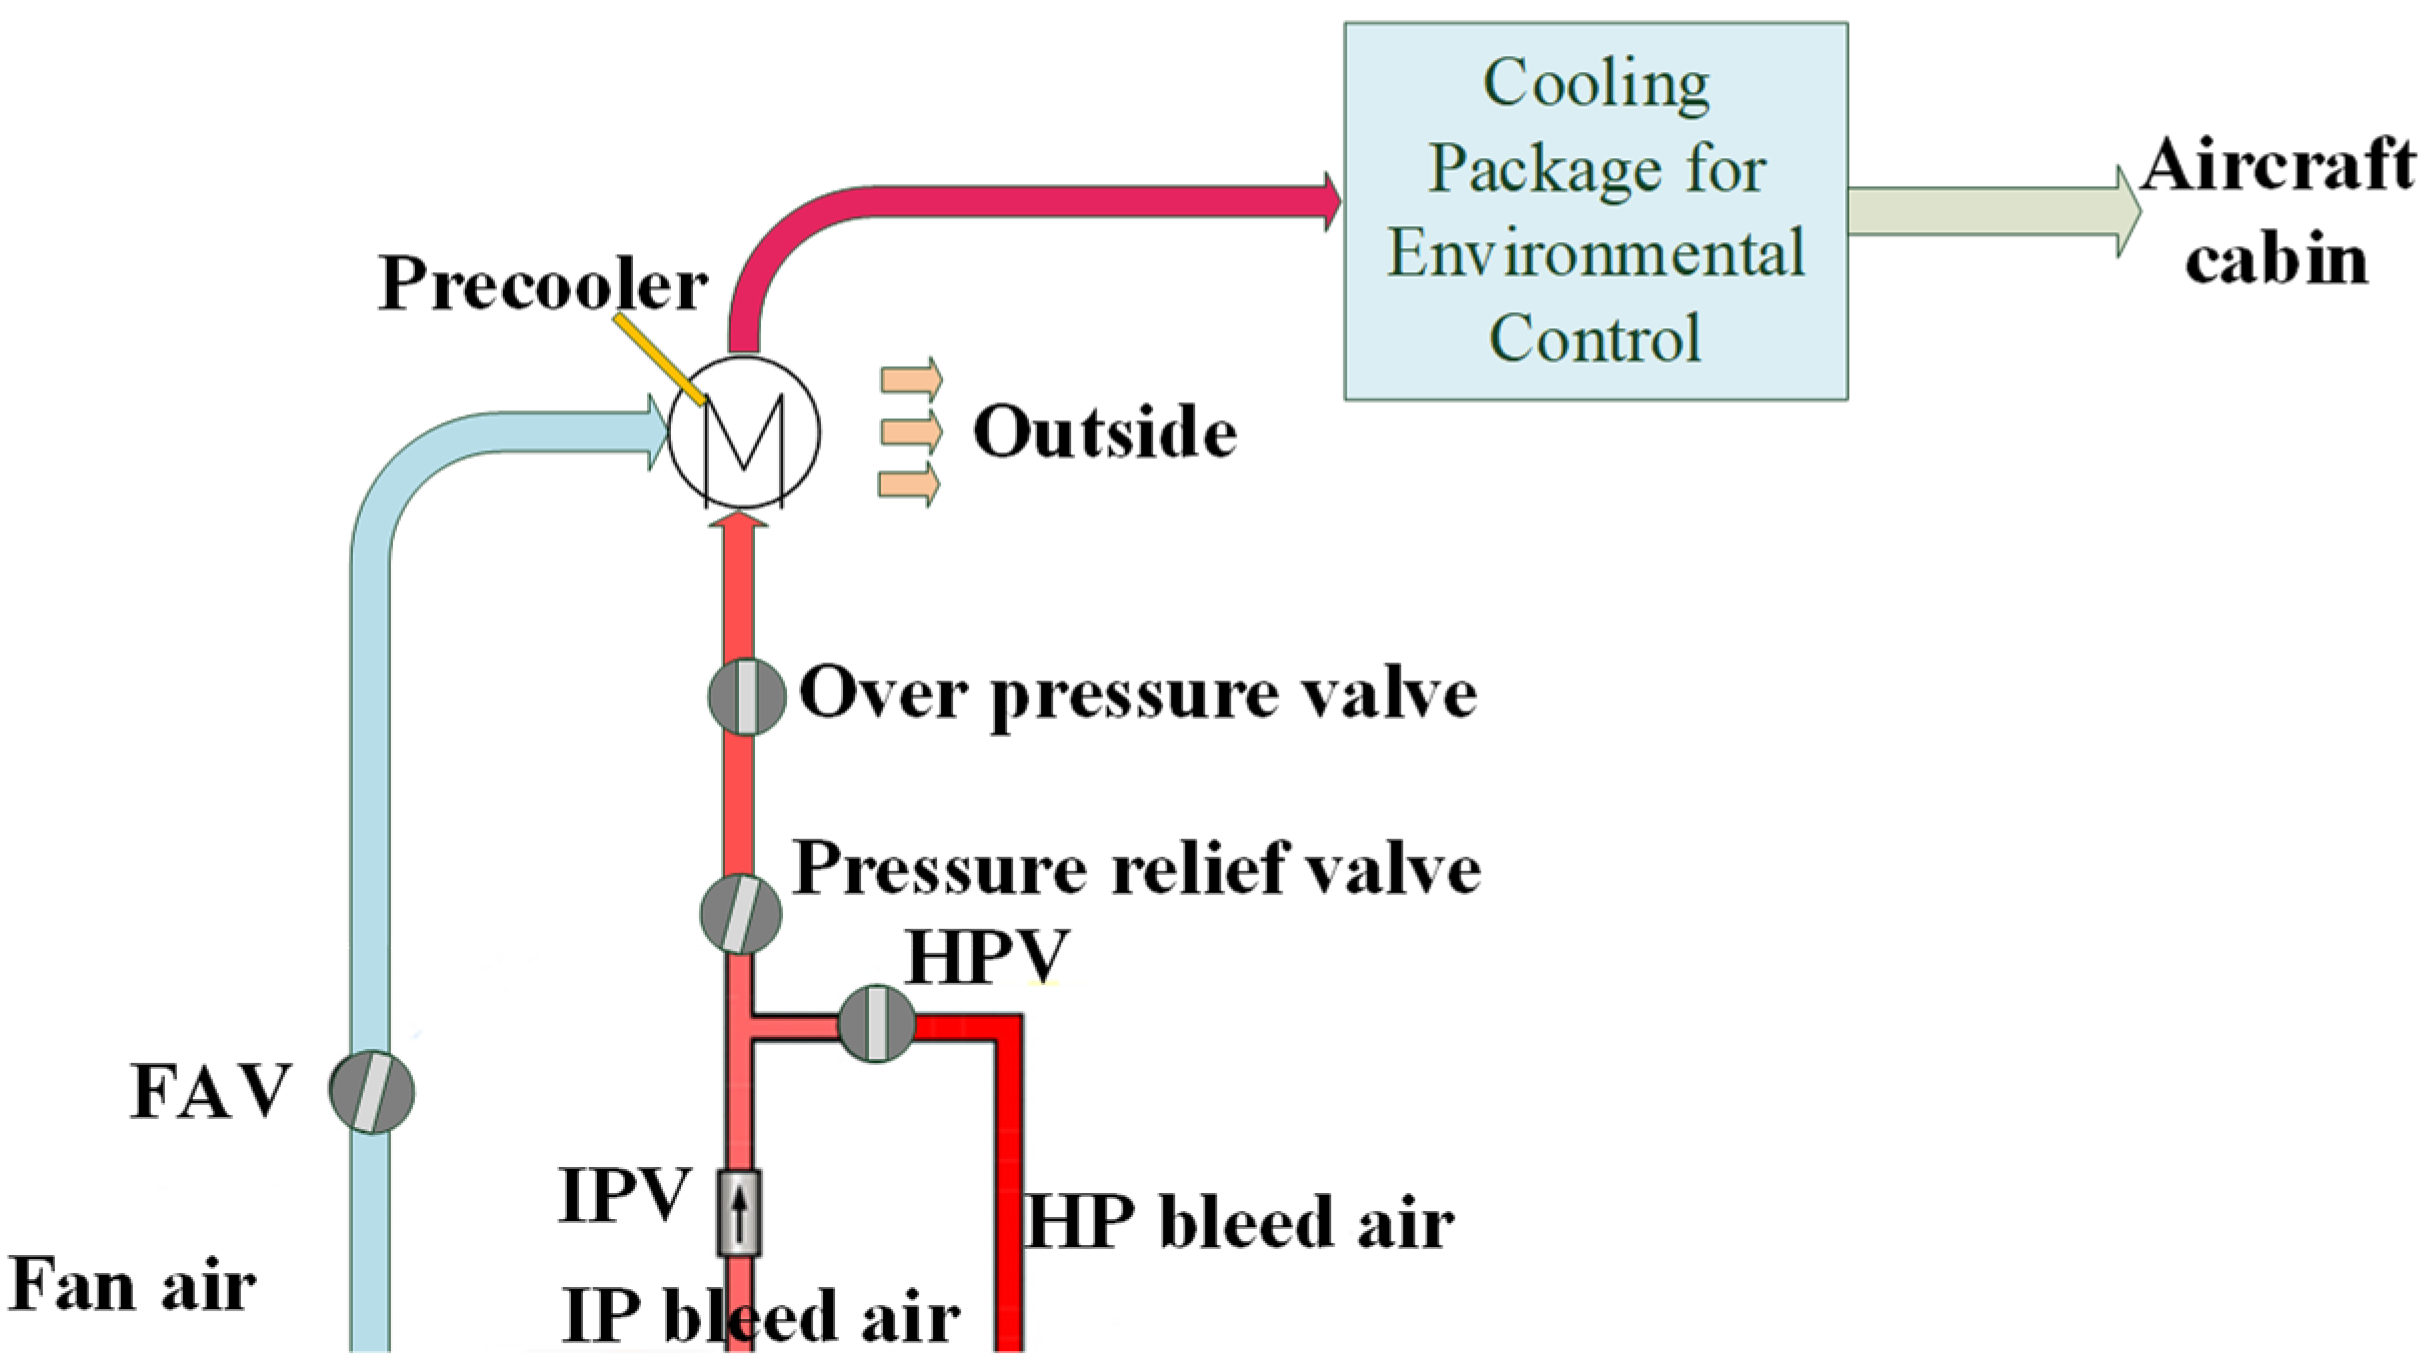
:1. Introduction
2. Methodology
2.1. Fast Air Heating and Boost
2.2. Decoupling
2.3. The LPID Controller
2.3.1. The LPID Control
2.3.2. Simulation Example
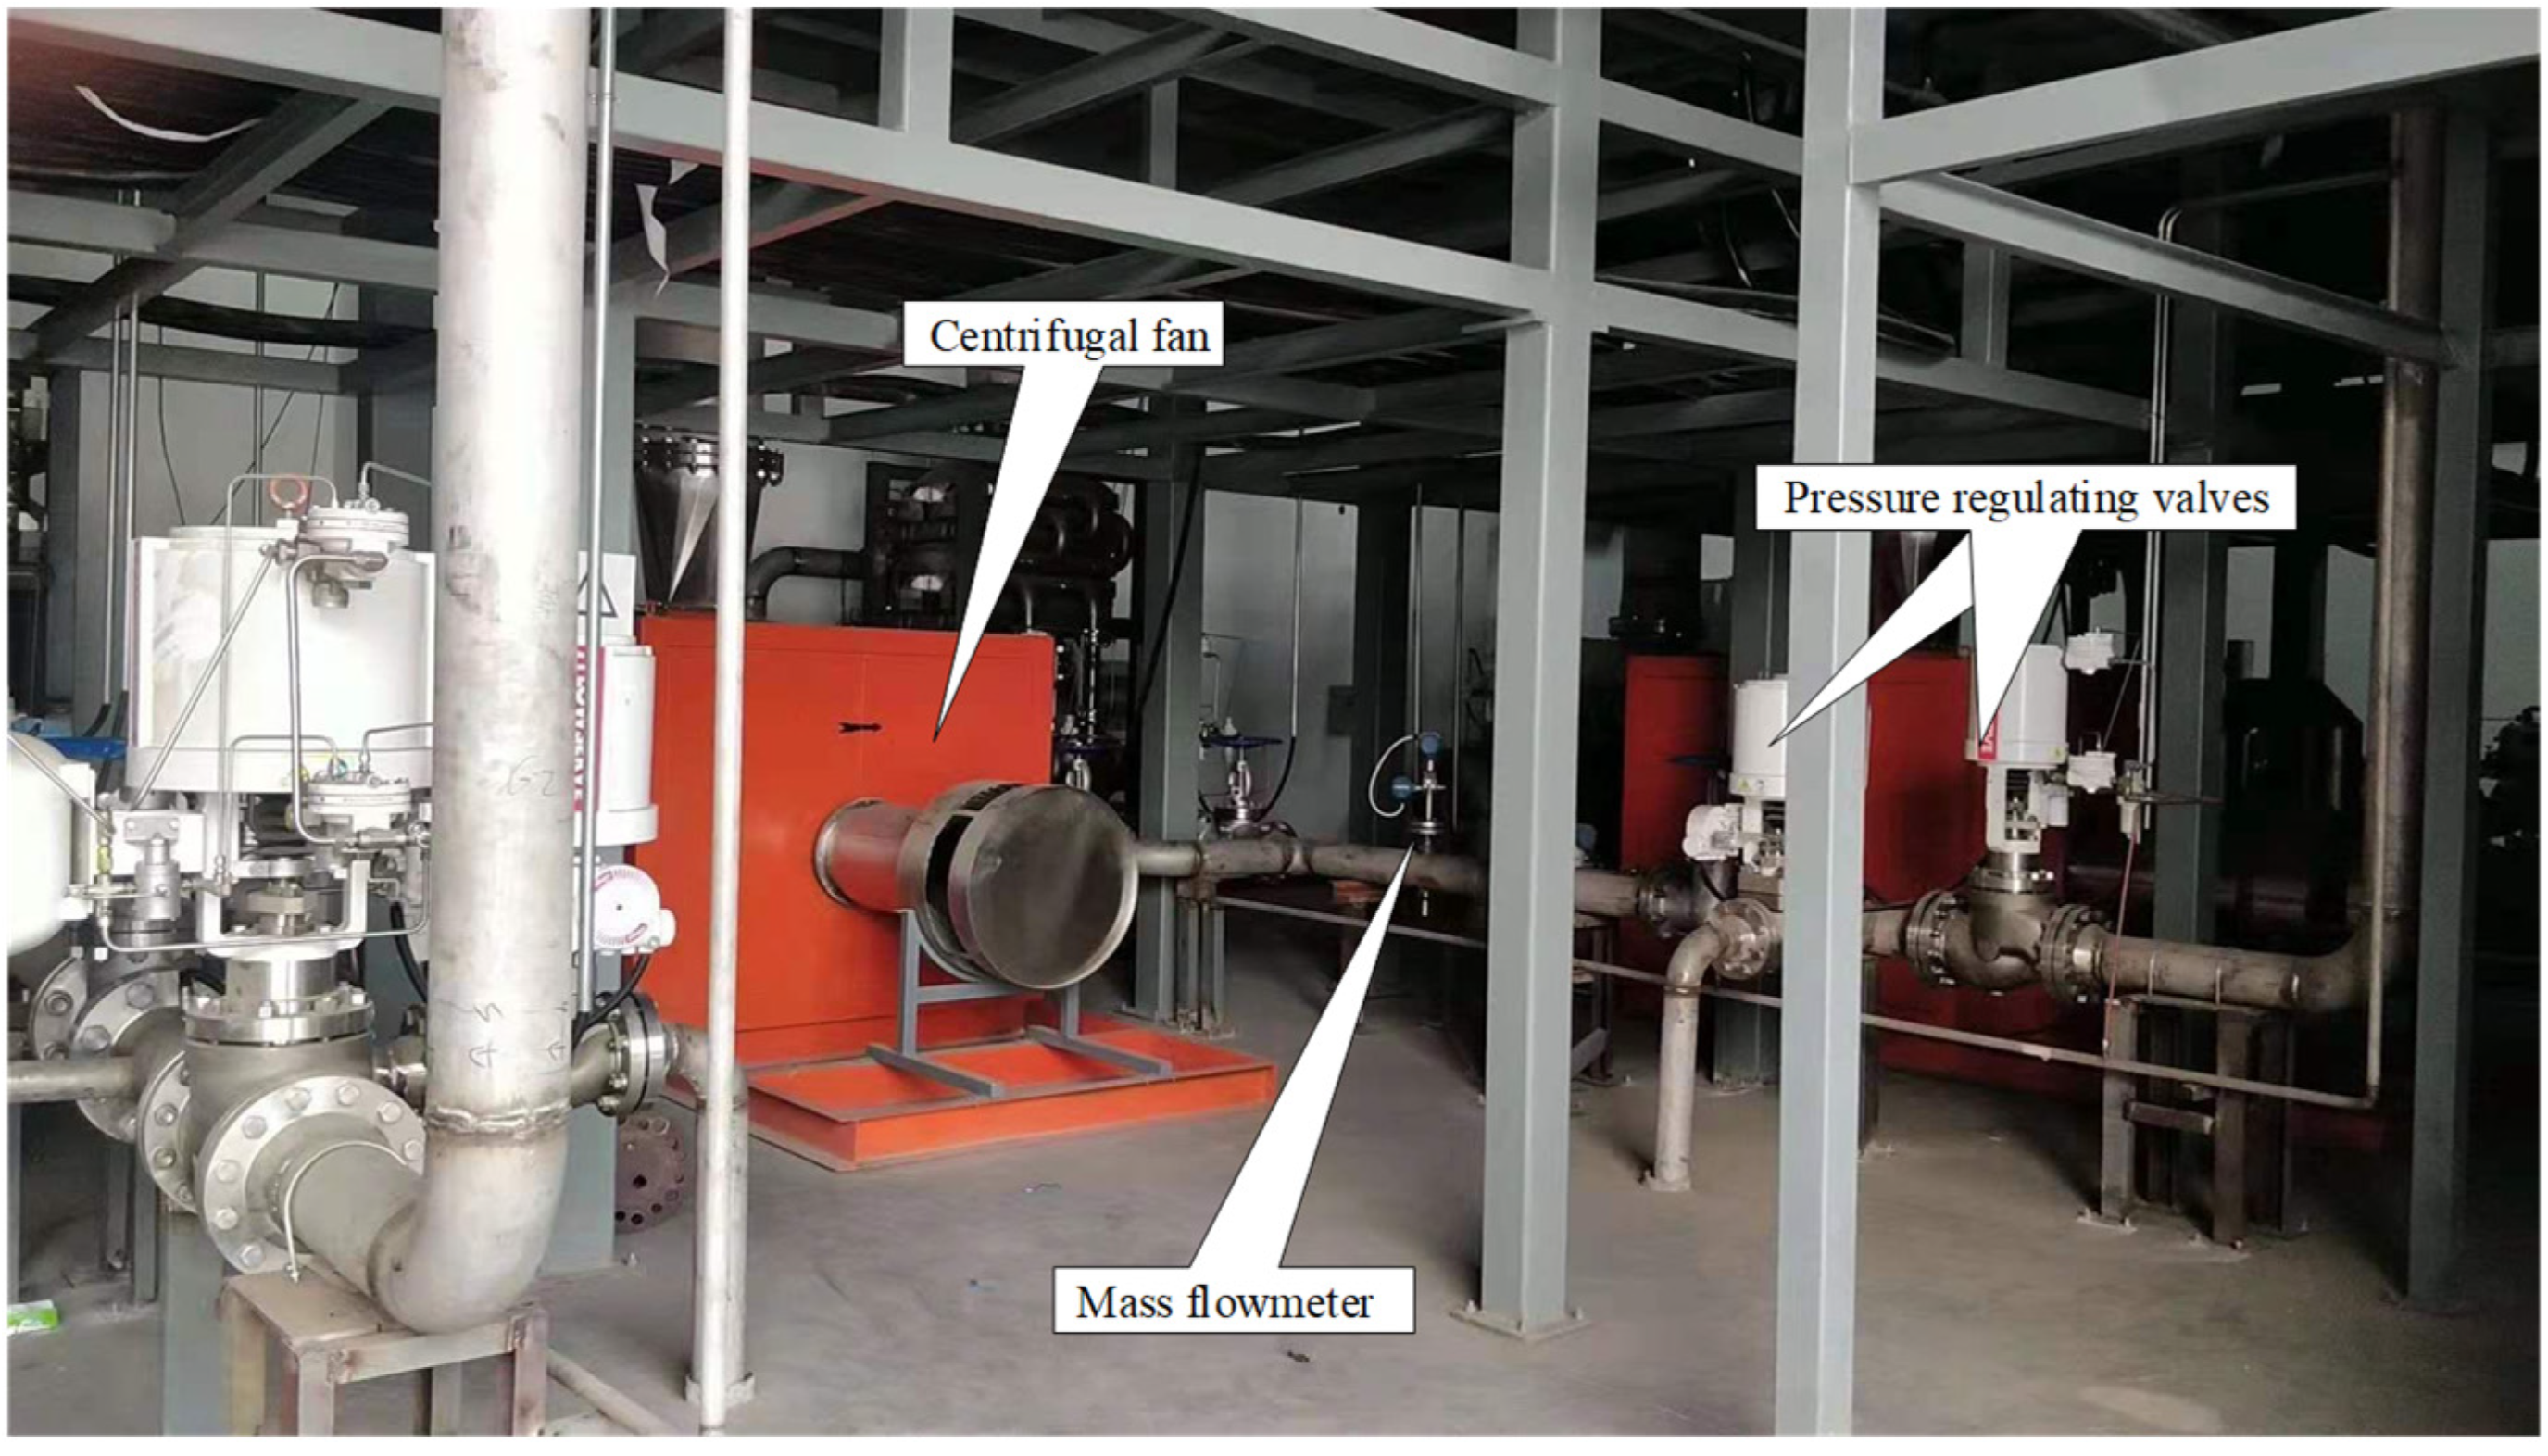
3. Facility Description
3.1. Pressure Control Components
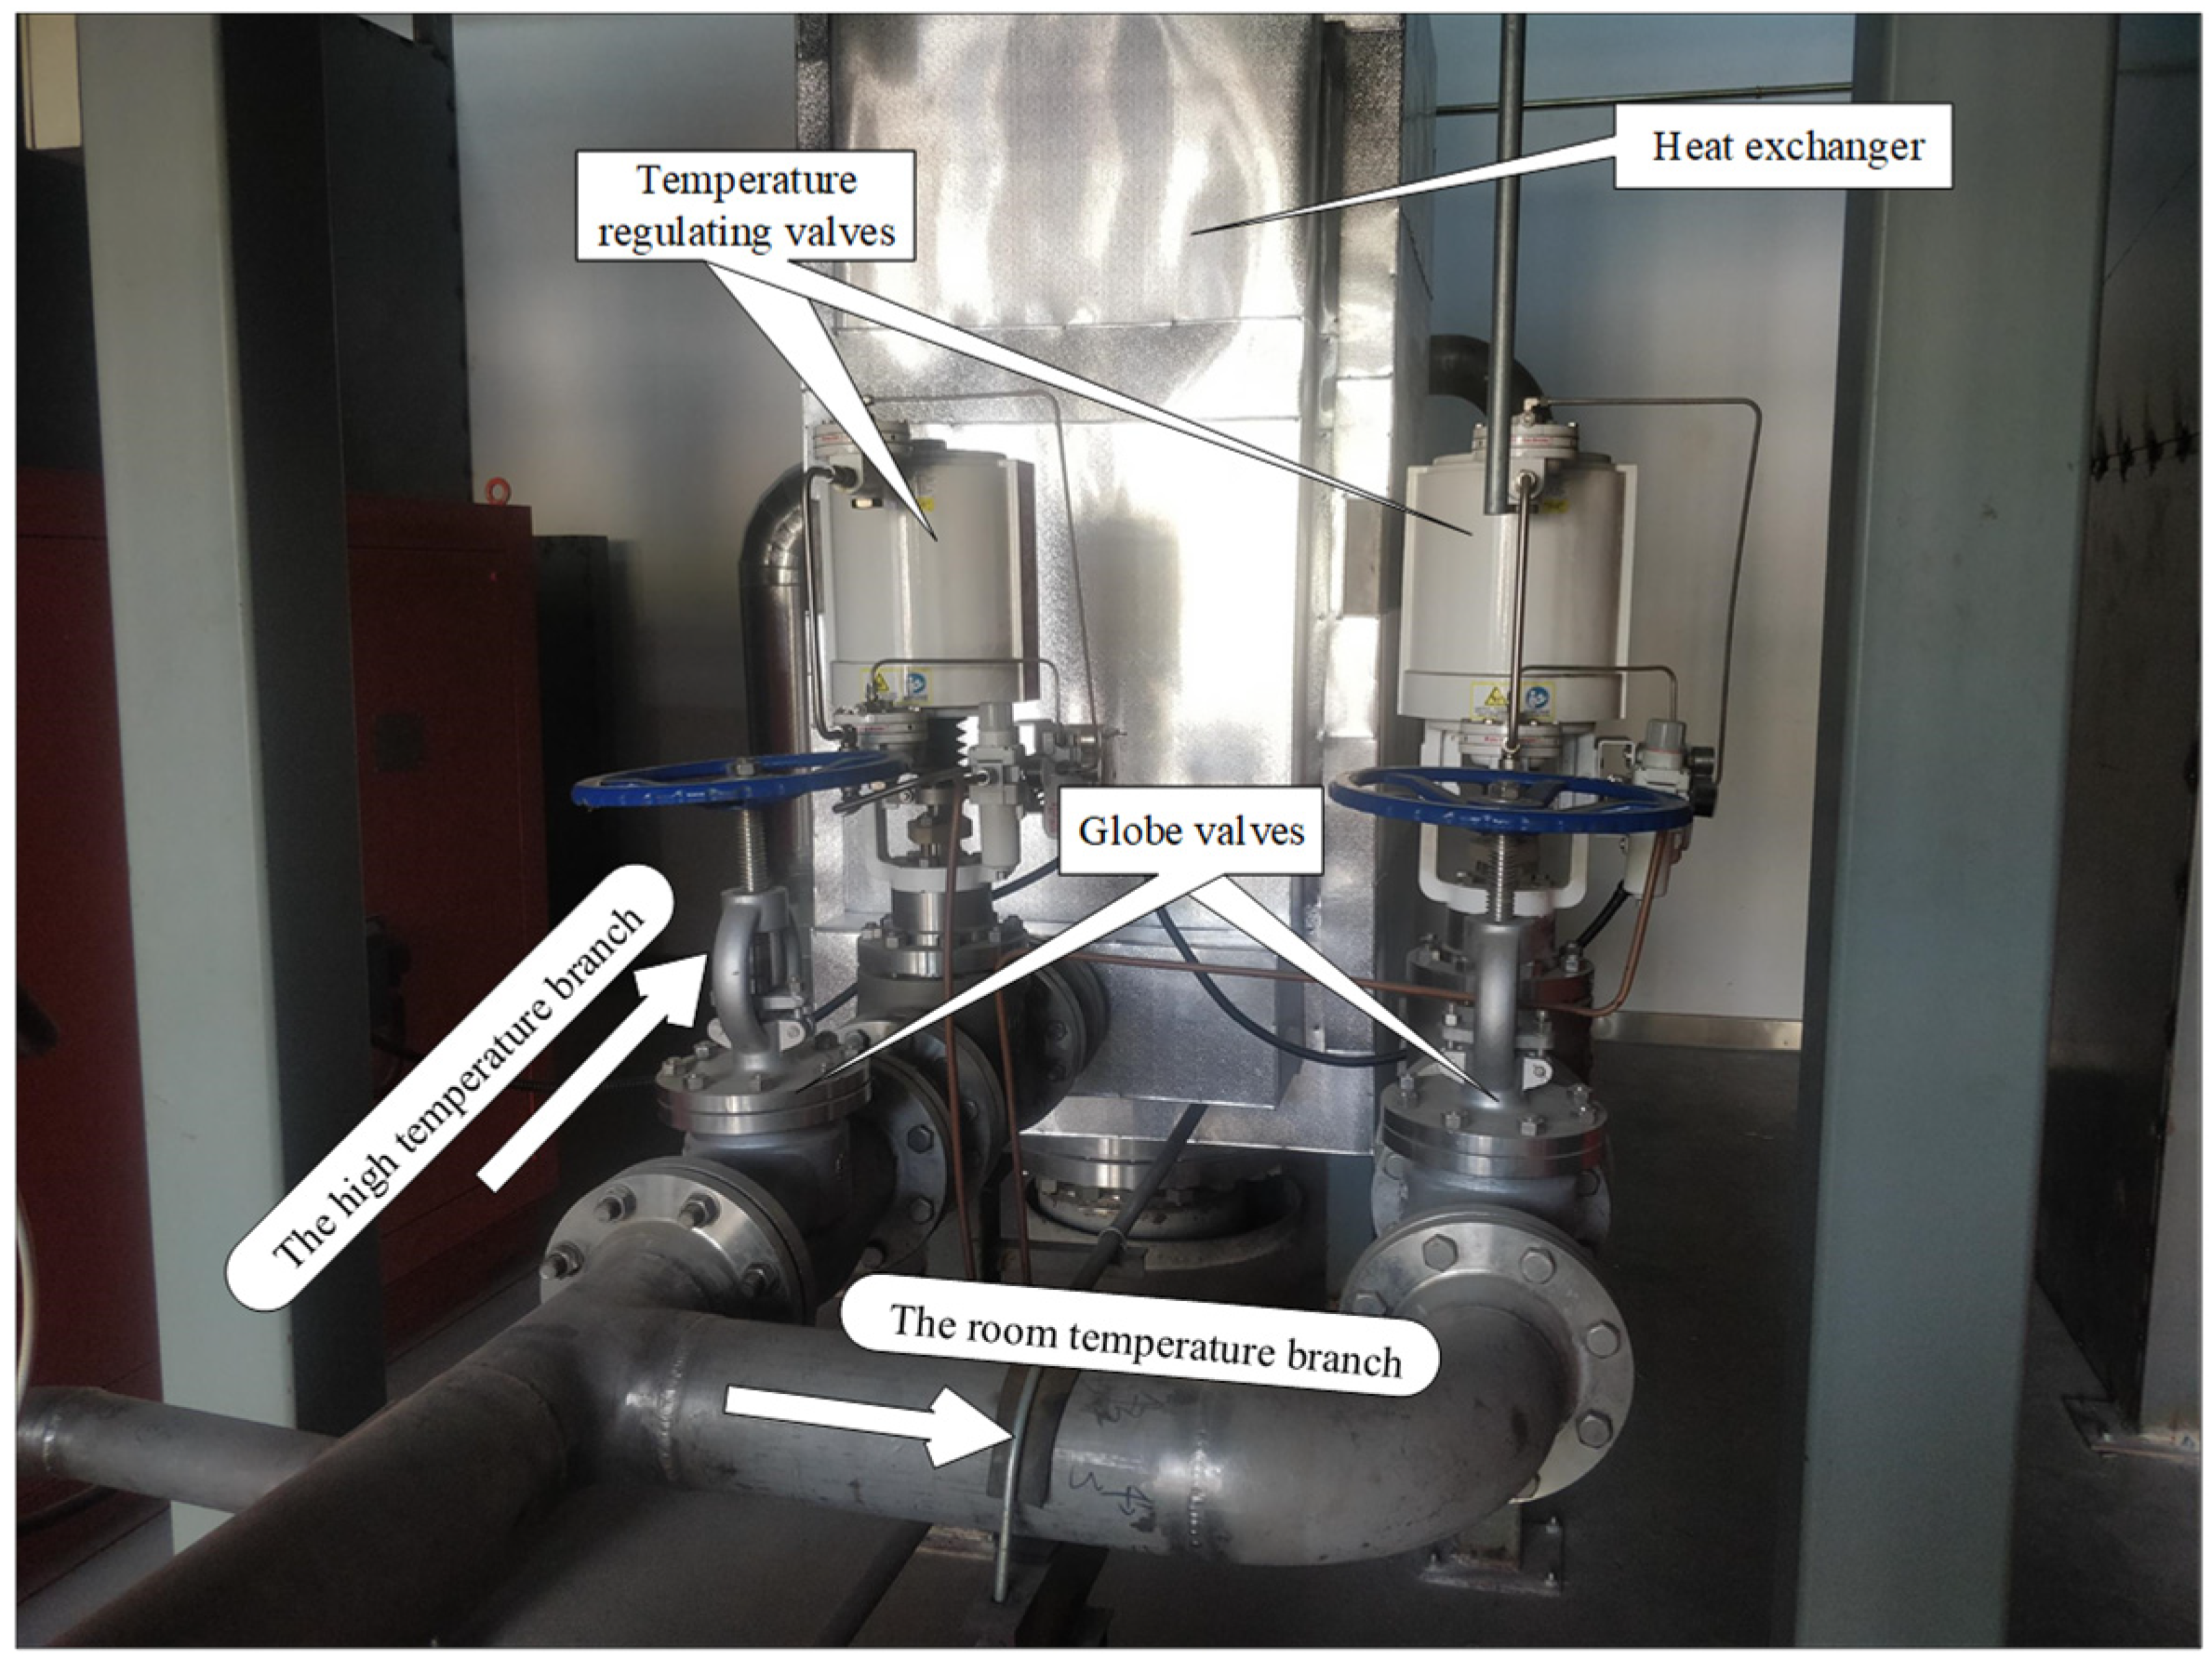
3.2. Temperature Control Components
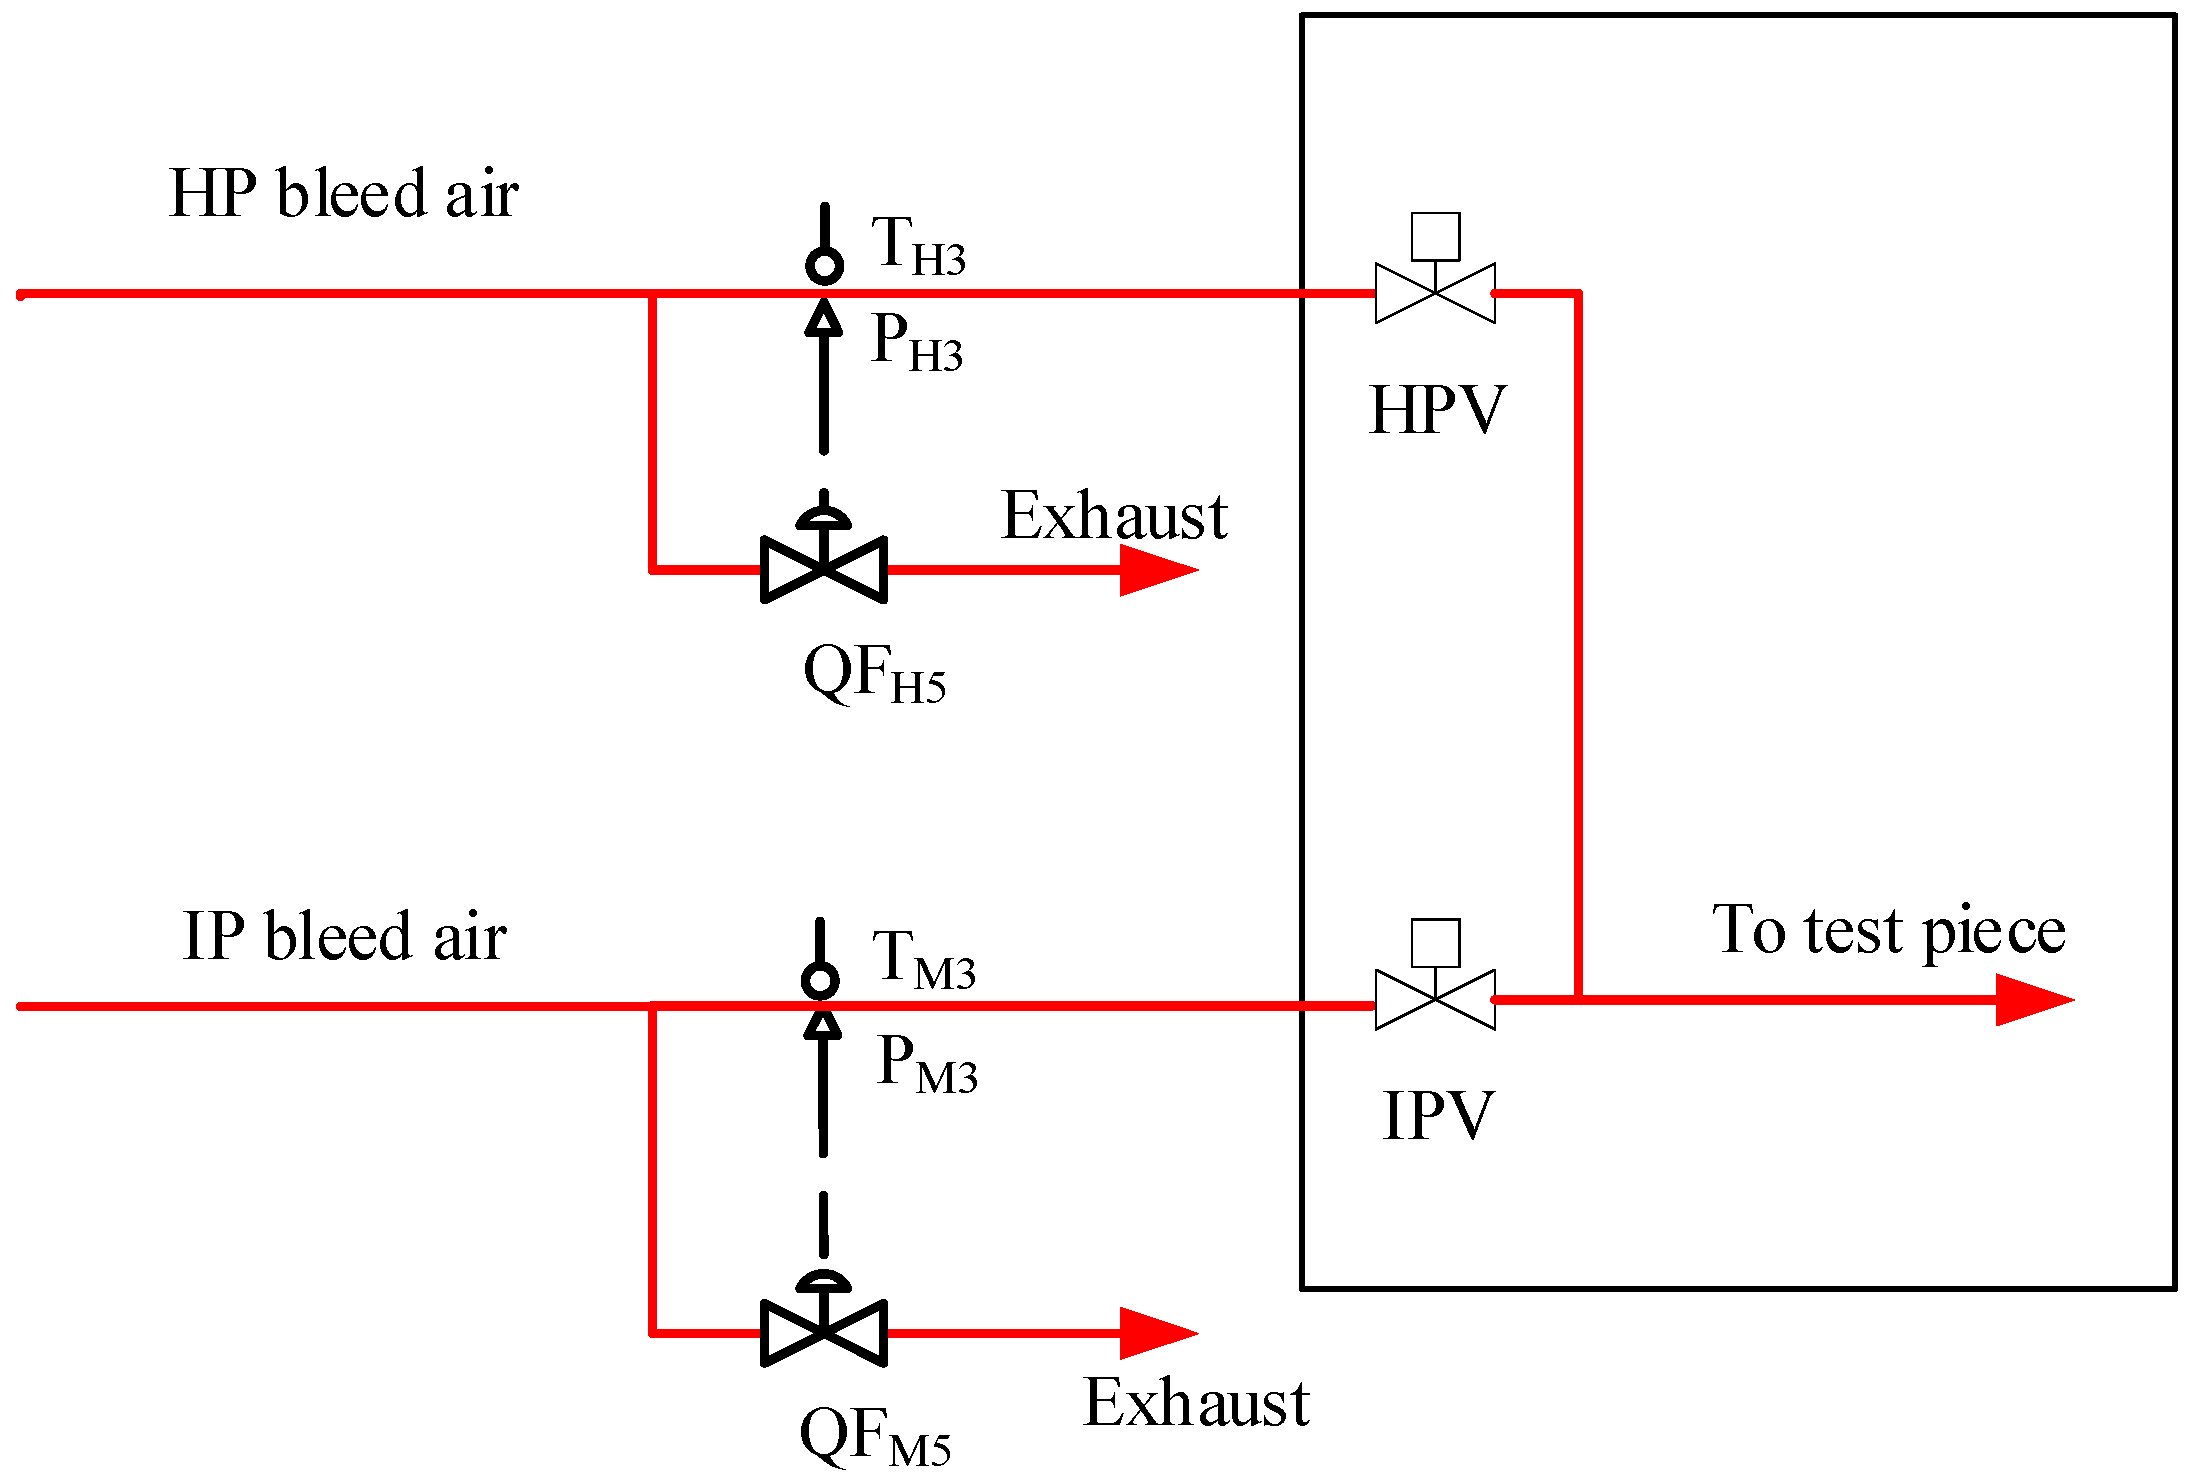
3.3. Bleed Air Switching Control Valve
4. Experimental Method
5. Testing Results
6. Conclusions
Author Contributions
Funding
Data Availability Statement
Conflicts of Interest
References
- Merzvinskas, M.; Bringhenti, C.; Tomita, J.T.; Andrade, C.R. Air conditioning systems for aeronautical applications: A review. Aeronaut. J. 2020, 124, 499–532. [Google Scholar]
- Tfaily, A.; Kokkolaras, M. Integrating Air Systems in Aircraft Multidisciplinary Design Optimization. In Proceedings of the 2018 Multidisciplinary Analysis and Optimization Conference, Atlanta, GA, USA, 24 June 2018; p. 3742. [Google Scholar]
- Sanchez, F.; Liscouet-Hanke, S. Thermal risk prediction methodology for conceptual design of aircraft equipment bays. Aerosp. Sci. Technol. 2020, 104, 105946. [Google Scholar]
- Hunt, E.H.; Reid, D.H.; Space, D.R.; Tilton, F. Commercial Airliner Environmental Control System. In Proceedings of the Engineering Aspects of Cabin Air Quality Aerospace Medical Association Annual Meeting, Anaheim, CA, USA, 7 May 1995. [Google Scholar]
- Dieckmann, R.R. Improved Reliability and Maintainability for Fighter Aircraft Environmental Control Systems (No. 880999); SAE Technical Paper; SAE: Warrendale, PA, USA, 1988. [Google Scholar]
- SKYbrary Aviation Safety. A333, En-Route, South of Moscow Russia. 2010. Available online: https://skybrary.aero/accidents-and-incidents/a333-en-route-south-moscow-russia-2010 (accessed on 28 March 2022).
- Cao, Y.; Tan, W.; Wu, Z. Aircraft icing: An ongoing threat to aviation safety. Aerosp. Sci. Technol. 2018, 75, 353–385. [Google Scholar]
- Transportation Safety Board of Canada. Air Transportation Safety Investigation Report A17C0146; Transportation Safety Board of Canada: Gatineau, QC, Canada, 2021. [Google Scholar]
- Moir, I.; Seabridge, A. Aircraft Systems: Mechanical, Electrical, and Avionics Subsystems Integration; John Wiley & Sons: New York, NY, USA, 2011; Volume 52. [Google Scholar]
- Buckingham, R.D. Helicopter Cooling, Air Cycle/Vapor Cycle Trade-Offs; SAE Transactions: Warrendale, PA, USA, 1984; pp. 571–581. [Google Scholar]
- Rosenbush, F.M. ECS Schemes for All Electric Airliners (No. 820870); SAE Technical Paper; SAE: Warrendale, PA, USA, 1982. [Google Scholar]
- Eichler, J. Simulation Study of an Aircraft’s Environmental Control System Dynamic Response. J. Aircr. 1975, 12, 757–758. [Google Scholar]
- Ashford, R. Verification and Validation of the F/A-22 Raptor Environmental Control System/Thermal Management System Software (No. 2004-01-2573); SAE Technical Paper; SAE: Warrendale, PA, USA, 2004. [Google Scholar]
- Jennions, I.; Ali, F.; Miguez, M.E.; Escobar, I.C. Simulation of an aircraft environmental control system. Appl. Ther. Eng. 2020, 172, 114925. [Google Scholar]
- Ryan, S.K. F-15 Environment Control System Improvements; SAE Transactions: Warrendale, PA, USA, 1990; pp. 537–544. [Google Scholar]
- Zhao, H.; Hou, Y.; Zhu, Y.; Chen, L.; Chen, S. Experimental study on the performance of an aircraft environmental control system. Appl. Ther. Eng. 2009, 29, 3284–3288. [Google Scholar]
- Childs, T.; Jones, A.B.; Chen, R. Development of a Full Scale Experimental and Simulation Tool for Environmental Control System Optimisation and Fault Detection. In Proceedings of the 53rd AIAA Aerospace Sciences Meeting, Kissimmee, FL, USA, 3 January 2015; p. 1196. [Google Scholar]
- Committee, AC-Aircraft Environmental Systems. Testing of Airplane Installed Environmental Control Systems (ECS); SAE International: Warrendale, PA, USA, 2021. [Google Scholar]
- Ranter, H. Report: A330 Emergency Descent Due to Bleed Air System Interruption (Taiwan). Aviation Safety Network. 2010. Available online: https://news.aviation-safety.net/2010/08/30/report-a330-emergency-descent-due-to-bleed-air-system-interruption-taiwan/ (accessed on 28 March 2022).
- Dai, Z.; Cui, Y. Study on the Fast Air Heating Method for the Rig of the Environmental Control System of the Aircraft. J. Phys. Conf. Ser. 2018, 1060, 012072. [Google Scholar]
- Cui, Y. Study on the Simulink Model for the Rig of the Environmental Control System of the Aircraft. J. Phys. Conf. Ser. 2018, 1060, 012073. [Google Scholar]
- Wang, J.; Xue, L.-X. Design of Engine Bleed Air Simulation Test Bench Temperature Control System Based on Humanoid Intelligence. In Proceedings of the CSAA/IET International Conference on Aircraft Utility Systems (AUS 2018), Guiyang, China, 19 June 2018; pp. 694–698. [Google Scholar]
- Hodal, P.; Liu, G. Bleed air temperature regulation system: Modeling, control, and simulation. In Proceedings of the 2005 IEEE Conference on Control Applications, Toronto, ON, Canada, 28–31 August 2005; pp. 1003–1008. [Google Scholar]
- Lei, Y.; Chen, X.; Jiang, K.; Li, H.; Zou, Z. A Novel Methodology for Electric-Thermal Mixed Power Flow Simulation and Transmission Loss Analysis in Multi-Energy Micro-Grids. Front. Energy Res. 2021, 8, 386. [Google Scholar]
- Zheng, Y.; Liu, M.; Wu, H.; Wang, J. Temperature and Pressure Dynamic Control for the Aircraft Engine Bleed Air Simulation Test Using the LPID Controller. Aerospace 2021, 8, 367. [Google Scholar]


Publisher’s Note: MDPI stays neutral with regard to jurisdictional claims in published maps and institutional affiliations. |
© 2022 by the authors. Licensee MDPI, Basel, Switzerland. This article is an open access article distributed under the terms and conditions of the Creative Commons Attribution (CC BY) license (https://creativecommons.org/licenses/by/4.0/).
Share and Cite
Zheng, Y.; Liu, M.; Wu, H.; Wang, J.; Xu, P.; Jin, S. An Available-to-Implement Thermal Facility for Dynamic Bleed Air Test of Aircraft Environmental Control System. Aerospace 2022, 9, 584. https://doi.org/10.3390/aerospace9100584
Zheng Y, Liu M, Wu H, Wang J, Xu P, Jin S. An Available-to-Implement Thermal Facility for Dynamic Bleed Air Test of Aircraft Environmental Control System. Aerospace. 2022; 9(10):584. https://doi.org/10.3390/aerospace9100584
Chicago/Turabian StyleZheng, Yonggui, Meng Liu, Hao Wu, Jun Wang, Peng Xu, and Side Jin. 2022. "An Available-to-Implement Thermal Facility for Dynamic Bleed Air Test of Aircraft Environmental Control System" Aerospace 9, no. 10: 584. https://doi.org/10.3390/aerospace9100584
APA StyleZheng, Y., Liu, M., Wu, H., Wang, J., Xu, P., & Jin, S. (2022). An Available-to-Implement Thermal Facility for Dynamic Bleed Air Test of Aircraft Environmental Control System. Aerospace, 9(10), 584. https://doi.org/10.3390/aerospace9100584