Abstract
The development of secondary flow along a curved channel is a fundamental flow phenomenon occurring in a wide range of engineering applications, including turbomachinery, aerospace, heating, ventilation, air conditioning, etc. The underlying flow physics about end-wall secondary flows has been well-documented in the open literature, while the interaction between a secondary flow and a side-wall boundary layer, which is critical to the aerothermal performance of a side-wall surface, has not been comprehensively studied. In this study, the entropy generation of secondary flow and the interaction between an end-wall passage vortex and a side-wall boundary layer were numerically investigated by Reynolds-averaged Navier–Stokes (RANS) CFD for a 90° curved channel. The transportation effect of secondary flow and the generation mechanism of an induced vortex pair on the side wall is reported. It was also found that the growth of the secondary flow can be suppressed due to the displacement effect of the side-wall boundary layer. Furthermore, it was found that the interaction between a secondary flow and a side-wall boundary layer provides a suppression effect on side-wall boundary layer separation.
1. Introduction
Secondary flows occur whenever viscous fluids go through a curved passage. The low-momentum fluids within the end-wall boundary layer are swept by the centrifugal pressure gradient, depart from the primary flow direction, and further develop into large-scale passage vortices, as schematically illustrated in Figure 1. The secondary flow behavior differs in detail in different industrial applications, such as open channel flows [1,2], the ducts of ventilating systems [3], turbomachinery passages [4,5], aerospace vehicles [6], etc.
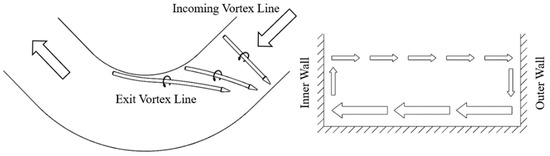
Figure 1.
The secondary flow generation mechanism in a curved passage, with arrows representing the vortex tubes (left) and secondary velocities (right), adapted from Glazer et al. [7].
Secondary flows are often undesirable. In curved piping systems, it requires more pumping power to compensate for the extra pressure loss caused by the secondary flow. In the field of turbomachinery, the aerodynamic loss attributed to the secondary flow can be as high as 30–50% of the total loss in a blade row, as reported by Sharma and Butler [8]. The secondary flow can also introduce substantial heat load and further deteriorate the flow quality and performance for the following stages. Extensive research efforts have been devoted to seeking optimal designs to reduce the secondary flow and, more importantly, to understand the underlying flow physics.
It was generally assumed [9] that the viscous stress and the isotropic part of the Reynolds stress in a secondary flow only help to initiate the shear layer with vorticity perpendicular to the direction of the flow and to diffuse the secondary vorticity. This inviscid essence of the generation of the secondary flow led to some early analytical studies about the development of the secondary flow. Hawthorne [10,11,12] pioneered the theoretical study of the secondary flow in an inviscid, incompressible flow and developed a general expression for the generation of secondary vorticity. Smith [13], Marris [14], Horlock and Lakshminarayana [15,16], etc., furthered and generalized the theory about the generation of secondary vorticity. These early works have contributed to a widely accepted wisdom that secondary vorticity is generated from the deflection of a shear layer. Such deflection can also be triggered without a curved geometry, as reported by Compton and Johnson [17]. The induced vortex pair on the side wall discussed in this study may serve as another example. In addition to the skew-induced secondary vorticity, it was also revealed [9,18] that the anisotropy in Reynolds stress may also introduce secondary flows.
In order to capture the nature of the secondary flow and to provide a design guideline for secondary flow control, considerable research efforts were devoted to track secondary flow loss and its loss mechanisms. In the numerical investigation by Denton and Pullan [19], the entropy generation in a turbine cascade was broken down to highlight its sources. The loss in the secondary flow region on the blade suction surface and the mixing loss between cascades were found to be significant. It was also found that the secondary flow in the turbine rotor is completely different from that in a stator due to the distortion in the incoming flow. Yi and Ji [20] studied the entropy generation in a compressor cascade by RANS CFD and found a high-loss zone in the suction-hub corner near the trailing edge.
The end-wall secondary flow is well-documented in the open literature. However, to the best of the authors knowledge, there are few studies about the interaction between the generated passage vortex and the side-wall boundary layer. The three-dimensional effect introduced by the end-wall secondary flow may interfere with the side-wall flow structures and therefore change the aerothermal performance near the side-wall surface. Cui et al. [21] studied the secondary flows in a high-lift low-pressure turbine by large-eddy simulation (LES). A vortex with a different sense of rotation from the passage vortex was found on the suction surface, which eventually merges with the passage vortex. Pichler et al. [22] compared the solution by RANS and LES, and it was found that the a high-loss area is related to the counter-rotating vortex. Kanani et al. [23] studied turbine passage secondary flow using LES and captured the augmented heat transfer brought by the secondary flow.
It should also be noted that, although the generation of secondary vorticity is essentially an inviscid process, high-fidelity simulation captures more details of the secondary flow. It could be expected that the numerical prediction could be improved by capturing more detailed turbulent content in the incoming end-wall boundary layer [24,25,26], the transition of the newly formed laminar boundary layer [27], and the breakdown of large eddies in the secondary flow [28,29]. However, in this study, the authors believe that the RANS results, validated against previous experimental studies, are sufficient to capture the qualitative trends in the entropy generation of secondary flow and the side-wall boundary layer behavior.
In this study, the secondary flow behavior in a simplified curved channel was investigated by RANS CFD, with specific focus on the interaction between the end-wall passage vortex and the side-wall boundary layer. The paper is organized as follows: Section 2 gives a detailed description of the numerical setup. In Section 3, a separated numerical case is compared with the experimental results by Camci and Rizzo [30] to validate the simulation strategy. Section 4 presents the main results of the work and extended discussions, followed by the main conclusions.
2. Numerical Setup and Grid Sensitivity Study
The commercial computational fluid dynamics (CFD) software package ANSYS Fluent was employed in the numerical study. The present study adopted the two-equation model [31] for turbulence modeling. The computational domain of the 90° curved channel is shown in Figure 2. The outer wall and upper wall were set to be symmetric. The channel height was set to be in order to provide enough room for the evolution of secondary flow.
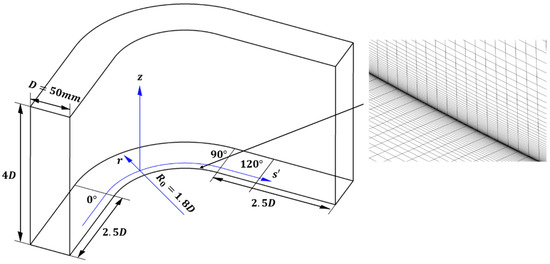
Figure 2.
The computational domain and mesh.
The inlet flow conditions are summarized in Table 1. A typical turbulent boundary layer profile obeying the was applied to both the end-wall and side-wall boundary layer. The end-wall boundary layer thickness () and side-wall boundary layer thickness were set to be and , respectively.

Table 1.
The inlet flow conditions.
Structured mesh, as shown in Figure 2, was generated in Pointwise V18.4 R3 [32]. The streamwise grid spacing within and downstream of the turning passage was set to be about (the wall unit was evaluated at the end wall of the 0° cut plane). The grid was stretched in streamwise direction near the inlet, where the two-dimensional turbulent boundary layer was unaffected by the pressure gradient across the passage. In the wall-normal direction, the 1st layer grid spacing was set to be about . The mesh was stretched in the wall-normal direction by a constant expansion ratio of 1.1 up to twice the end-wall boundary layer thickness at the 0° cut plane. In the free stream area, the grid spacing in wall-normal direction was set to be about .
To examine the grid sensitivity, three mesh configurations were employed for the baseline case. The characteristic parameters of the grids are listed in Table 2. In all mesh configurations, the spacing in the wall-normal direction of the 1st layer grid was set the same. The one-equation () [33] model was also adopted to evaluate the sensitivity to turbulence modeling. Figure 3 presents the spanwise distributions of the mass-averaged pressure loss coefficient, , and the wall friction coefficient, , at three critical cut planes. The difference between the computational results with mesh 2 and mesh 3 was negligible. Thus, in the present study, mesh 2 was adopted for the calculation. A slight difference can be observed between the results predicted by the model and the model. In addition, the computational results obtained from the two turbulence models are consistent with the secondary flow effects discussed in the following sections, though they are not presented in this paper.
Table 2.
Mesh configurations.
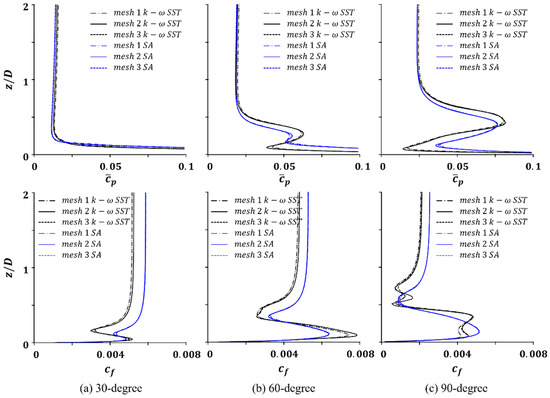
Figure 3.
Spanwise distributions of mass-averaged pressure loss coefficient, , and wall friction coefficient, , at (a–c) cut planes.
Figure 4 shows the overall distribution of the value of the 1st layer mesh within the turning passage. Figure 5 presents the circumferential and spanwise distributions at three cut planes within the turning passage. It can be observed that, for areas affected by the secondary flow, the value of the 1st layer mesh is about 1, which meets the requirement of the turbulence model used in this study.
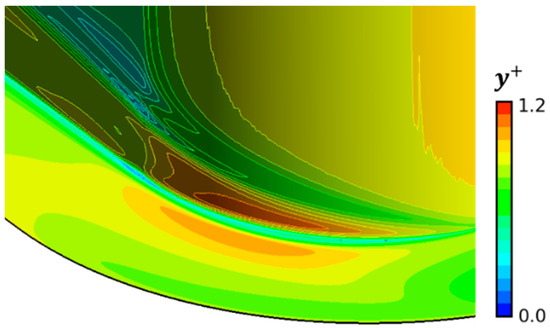
Figure 4.
Distribution of the value for the 1st layer mesh in the turning passage.
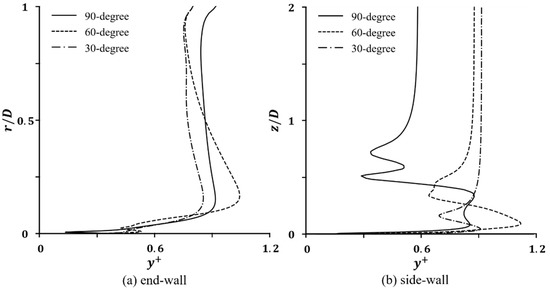
Figure 5.
Distributions of the value for the 1st layer mesh at 30°, 60°, and 90° cut planes at the (a,b).
In addition to a separated validation case, four cases were investigated, including (1) the baseline case, (2) the case with a thin end-wall boundary layer, (3) the case with a thick side-wall boundary layer, and (4) the case with an artificially triggered side-wall separation.
3. Code Validation
The numerical solution in this study is validated against the experimental data by Camci and Rizzo [30]. It should be noted that their curved channel has a different aspect ratio of . Thus, a separate validation case, with the same simulation strategy and mesh configuration, was conducted to match the experimental setup.
The distributions of the total pressure loss coefficient, , at the 90° cut plane in both the simulation and experiment are presented in Figure 6. An acceptable agreement between the experimental and numerical results can be observed. The overall loss pattern, as described by Camci and Rizzo [30], features a “mushroom” shape. The loss cores on the upper and lower sides are introduced by the passage vortex. The low-kinetic-energy fluids are squeezed by the passage vortex and form a high-loss region near the middle of the side wall. Figure 7 presents the spanwise distribution of the averaged pressure loss for both the experimental and computational results. Overall agreement can be observed.
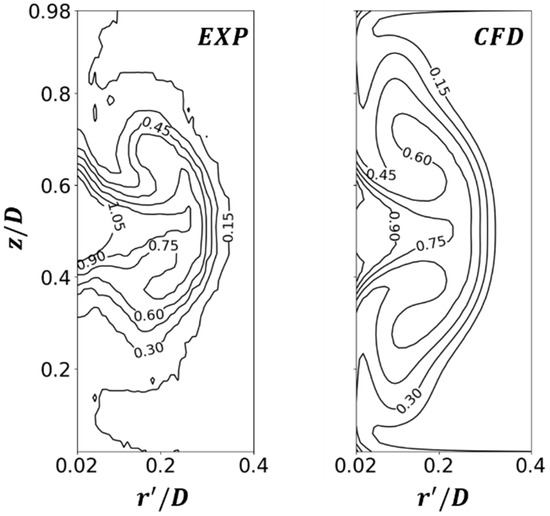
Figure 6.
The distributions of total pressure loss coefficient, , at the 90° cut plane for the experimental data by Camci and Rizzo [30] and the simulation result.
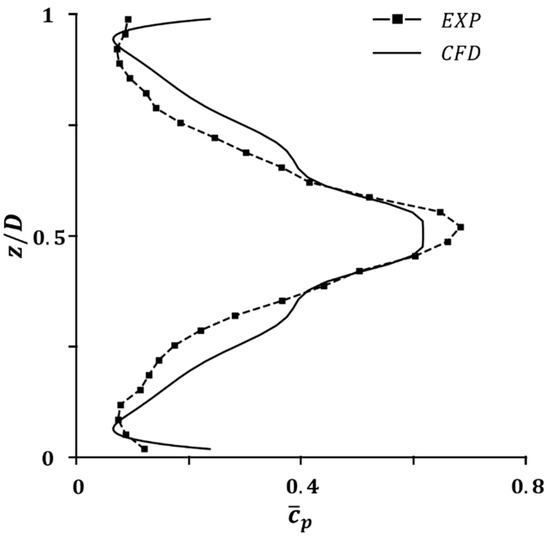
Figure 7.
Spanwise distributions of the averaged total pressure loss coefficient, , at the 90° cut plane for the experimental data by Camci and Rizzo [30] and the simulation result.
4. Secondary Flow Loss Pattern and Transportation Effect
Figure 8 presents the total pressure loss (or the accumulative entropy generation) at the 30°, 60°, and 90° cut planes, with the passage vortex cores identified by secondary velocity. The association between the passage vortex and the loss is clear, while another high-loss region can be observed on the side-wall surface above the passage vortex. Such loss is the result of the transportation of the passage vortex. As the passage vortex approaches the side wall, the low-kinetic-energy fluids within the boundary layer are transported by the passage vortex to this region. Meanwhile, the fluids within the side-wall boundary layer are also squeezed into this region.
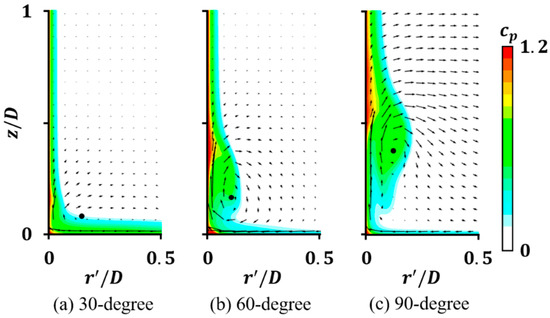
Figure 8.
The distributions of total pressure loss at (a–c) cut planes. The passage vortex cores, identified by secondary velocity, are marked with black circles.
The redistribution of the side-wall boundary layer may introduce extra vortical structures. Figure 9 presents the skew-induced generation rate of streamwise vorticity to investigate the relation between the high-loss region and the induced vortex pair. The variation in streamwise vorticity is affected by both the skewness of the shear layer and the viscous effect, as described by Marris [14]:
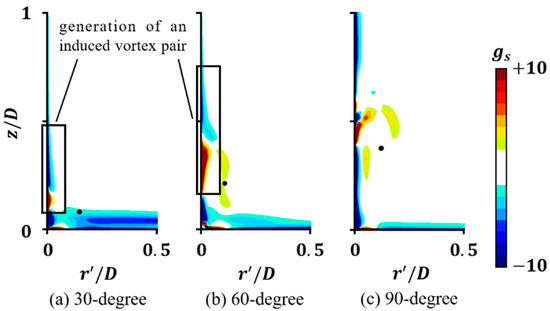
Figure 9.
The distributions of the skew-induced generation rate of streamwise vorticity at (a–c) cut planes. The passage vortex cores, identified through secondary velocity, are marked with black circles.
Therefore, the skew-induced generation rate of streamwise vorticity is defined by [14]:
to eliminate the viscous effect. The negative skew-induced generation rate of the streamwise vorticity (blue in color) signifies the growth of vorticity with the same rotation direction as the passage vortex, and the positive skew-induced generation rate of streamwise vorticity (red in color) signifies the growth of vorticity with the opposite rotation direction as the passage vortex.
At the early stage of the evolution of secondary flow, namely at the 30° cut plane. Most of the streamwise vorticity contributing to the passage vortex is generated near the end wall, as the end-wall boundary layer is deflected by the pressure gradient across the turning passage. A great portion of the streamwise vorticity in the passage vortex is generated at this early stage since the original end-wall boundary layer is mostly transported to the side wall before the 60° cut plane (which is presented in Figure 8).
As this passage vortex approaches and climbs along the side wall, it is no longer reinforced by the end-wall boundary layer. A weaker streamwise vorticity generation rate can be observed near the end wall due to the attachment of fluids from the freestream. Meanwhile, the side-wall boundary layer is squeezed by the passage vortex. The squeezing, along with the transportation of the end-wall low-kinetic-energy fluids, forms a high-loss region near the side wall, as shown in Figure 8. The material line (or the vortex line), which is originally parallel to the side-wall surface, is dragged back as the low-momentum fluids accumulate in this high-loss region, resulting in the generation of a counter-rotating vortex pair, as is evident in Figure 9a,b. The generation rate of the 2nd induced vortex with the same rotation direction as the passage vortex is much weaker since the local total pressure gradient (indicating both the strength of the shear layer and the drag of the material line) is weaker. It could be concluded that a great portion of the loss near the induced vortex pair is contributed by the transportation effect of secondary flow but not the secondary flow itself.
Figure 10 shows the distributions of streamwise vorticity, , at 0°, 30°, 60°, and 90° cut planes in the curved channel, with the end-wall and side-wall surface streamlines, to present an overall secondary flow structure. The data plotting method is similar to the one used in Figure 9. The negative streamwise vorticity (blue in color) signifies the vorticity opposite to flow direction (the passage vortex), and the positive one (red in color) signifies the vorticity consistent with the flow direction. At the 0° and 30° cut planes, most of the streamwise vorticity is generated near the end wall due to the deflection of the end-wall boundary layer. As the secondary flow evolves, the streamwise vorticity is continuously generated through the same mechanism, and a strong passage vortex approaches the side wall and gradually climbs along it. Meanwhile, a counter-rotating vortex pair, with weaker strength than the passage vortex, is induced upon the passage vortex. Near the 90° cut plane, the strength of the passage vortex is reduced due to viscous dissipation. As the side-wall static pressure recovers at the curved channel exit, the counter-rotating vortex pair is intensified, which squeezes slightly away from the side-wall boundary layer and the passage vortex, as can be observed from the side-wall surface streamlines near the turning passage exit.
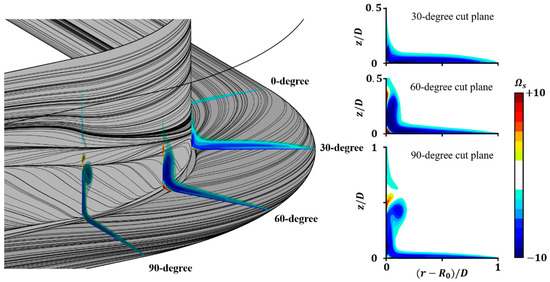
Figure 10.
The distributions of streamwise vorticity, , at the 0°, 30°, 60°, and 90° cut planes, with surface streamlines colored by local static pressure.
The entropy generation rate per unit volume, as proposed by Denton [34], was applied to further investigate the sources of loss in the curved channel. Figure 11 presents the distributions of the entropy generation rate at the 30°, 60°, and 90° cut planes. The entropy generation rate was broken down to the contributions from the boundary layer and the secondary flow [35] as follows:
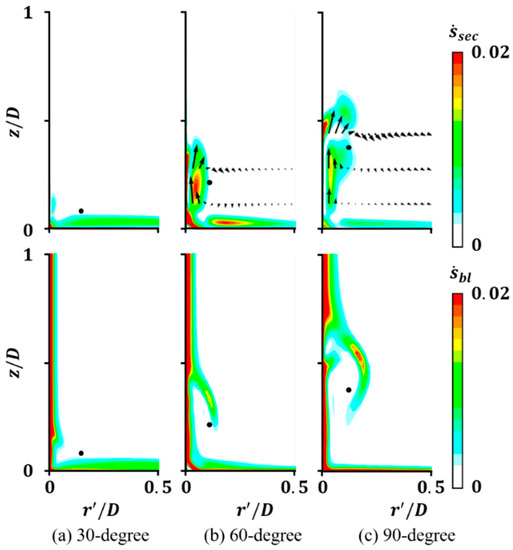
Figure 11.
The distributions of the entropy generation rate by secondary flow (top) and the boundary layer (bottom) for the (a–c) cut planes, with secondary velocities labeled by arrows. The passage vortex cores, identified through secondary velocity, are marked with black circles.
The contributions from secondary velocity gradient and streamwise velocity gradient were decomposed to ensure that most of the entropy generation in the secondary flow and boundary layer was captured. It should be noted that the velocity components , , and were defined with respect to local geometry, as shown in Figure 2, and were different from the one defined in the intrinsic coordinate in Equation (1).
At the 30° cut plane, the secondary flow and the entropy it generates are mostly located near the end wall. At the 60° cut plane, as the passage vortex approaches and climbs along the side wall, a high entropy generation rate core can be observed near the passage vortex core and beside the side wall. Another high-loss region is located upon the end wall due to the passage vortex formed by the attached end-wall fluids. At the 90° cut plane, the loss pattern is similar to the one shown in the 60° cut plane. It can also be observed in Figure 11b,c that part of the secondary flow loss can be attributed to the 1st induced vortex.
From the distribution of the entropy generation rate by the boundary layer, it can be observed that the entropy generated in the high-loss region shown in Figure 8 is, on the contrary, weaker than that in the unaffected regions, such that it can be further affirmed that the high-loss region shown in Figure 8 is essentially the result of the transportation of secondary flow. In addition, as the low-momentum boundary layer fluids are transported by the passage vortex into the main stream, another high-entropy generation rate region emerges in the freestream, as in Figure 11b,c.
Figure 12 presents the streamwise distributions of the entropy generation rate by the secondary flow. In order to achieve a more comprehensive understanding of the secondary flow loss pattern, cases with different end-wall and side-wall boundary layer configurations, as introduced in Section 2, were studied. In the case with a thin end-wall boundary layer, the displacement thickness and momentum thickness of the end-wall boundary layer at the curved channel entrance are reduced by 59% and 58%. In the case with a thick side-wall boundary layer, the displacement thickness and momentum thickness of the side-wall boundary layer at the curved channel entrance are increased by 188% and 212%. The entropy generation rate associated with each flow structure are identified by the streamwise vorticity and location.
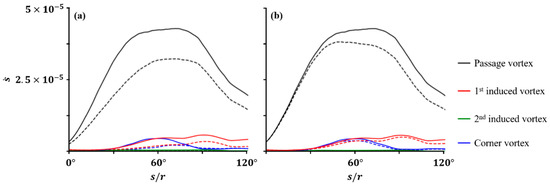
Figure 12.
The streamwise distributions of the entropy generation rate by secondary flow for (a) the baseline case (solid line) and the case with a thin end-wall boundary layer (dashed line), and (b) the baseline case (solid line) and the case with a thick side-wall boundary layer (dashed line).
The entropy generation rate introduced by the passage vortex increases as the flow enters the curved channel and peaks at the rear part of the curved channel, where it detaches from the wall and breaks down. The entropy generation rate introduced by the induced vortex pair increases as the secondary flow evolves since the low-kinetic-energy fluids are continuously transported by the passage vortex and entrained by the induced vortex pair. Its loss peaks at the curved channel exit, where it is intensified by the recovered side-wall static pressure. As can be expected, the secondary flow loss in the case with a thin end-wall boundary layer is reduced due to a weak end-wall shear layer, while the overall secondary flow loss pattern is similar to the baseline case, as shown in Figure 12a.
The secondary flow loss patterns under different side-wall boundary layer configuration are almost the same, as can be observed in Figure 12b. A thicker side-wall boundary layer brings a slight reduction in secondary flow loss, which is probably due to the displacement effect of the side-wall boundary layer. The pressure gradient within the curved channel is reduced by 6.9%, as the “real” geometry of the side wall is displaced by the thick side-wall boundary layer. Figure 13 presents the difference in streamwise vorticity at the 60° cut plane between the baseline case and cases with different boundary layer configurations.
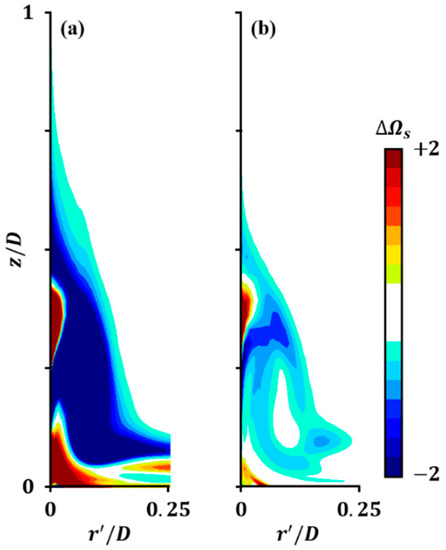
Figure 13.
The difference in streamwise vorticity at the 60° cut plane between (a) the baseline case and the case with a thin end-wall boundary layer, and (b) the baseline case and the case with a thick side-wall boundary layer.
The entropy generation rate by secondary flow was broken down with respect to its source and integrated within and downstream of the turning passage, as shown in Table 3. The vortices were identified through location and the sense of rotation. The loss was normalized by inlet flow conditions and the side-wall radius. It can be observed in Figure 12 and Table 3 that the secondary flow loss patterns are similar under the surveyed end-wall and side-wall boundary layer characteristics. The total secondary flow loss varies as the boundary layer characteristics change, while the ratio between the loss contribution from each component in the secondary flow is not sensitive to the boundary layer characteristics. Furthermore, the kinetic energy contained in the secondary flow is continuously dissipated along the curved channel, indicating that the residual kinetic energy at the passage exit might be unsuitable for the criterion, though it was used in some relevant studies to evaluate the secondary flow loss and the secondary flow control effect.
Table 3.
Breakdown of entropy generated by secondary flow.
In order to investigate the interaction between secondary flow and the side-wall boundary layer separation in the same flow condition, air injection, with a blowing ratio of 0.1, was added at the 45° cut plane of the side wall to artificially trigger a side-wall boundary layer separation. Figure 14 presents the distributions of streamwise vorticity and side-wall surface streamlines near the separation bubble. Due to the distortion effect of the secondary flow, the fluids in the separation bubble above the passage vortex show a spanwise motion, as can be observed from the side-wall surface streamlines shown in Figure 14b. In addition, the induced vortex pair is intensified by entraining the separated fluids, as can be observed in Figure 14c. Therefore, a control effect on side-wall separation by the secondary flow could be expected, as discussed below. The side-wall separation shows a displacement and redistribution effect on the passage vortex, which decays rapidly downstream.
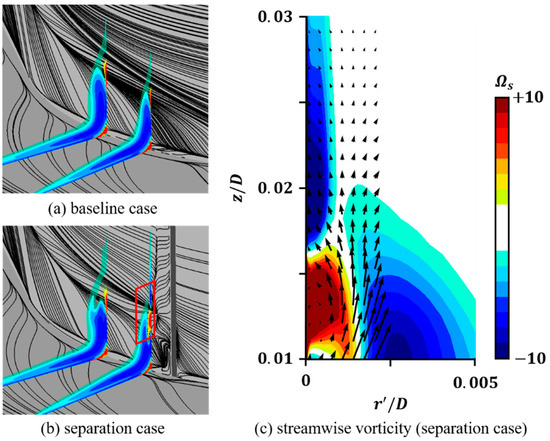
Figure 14.
The distribution of streamwise vorticity at the 50° and 60° cut planes and surface streamlines near the separation bubble for (a) the baseline case and (b) the case with side-wall separation and (c) the distribution of streamwise vorticity and secondary velocities (labeled by arrows) near the intensified induced vortex pair. Subfigure (c) magnifies the region marked with red box in subfigure (b).
Figure 15 presents the spanwise distribution of entropy generated by boundary layer separation between the 45° and 60° cut planes. The loss reduction due to the secondary flow is about 4.4% of the secondary flow loss. In addition, as the low-momentum fluids are entrained by the induced vortex pair, the secondary flow loss is increased by 0.4%. Thus, the secondary flow shows an overall positive effect in suppressing the boundary layer separation, which might deserve further exploration.
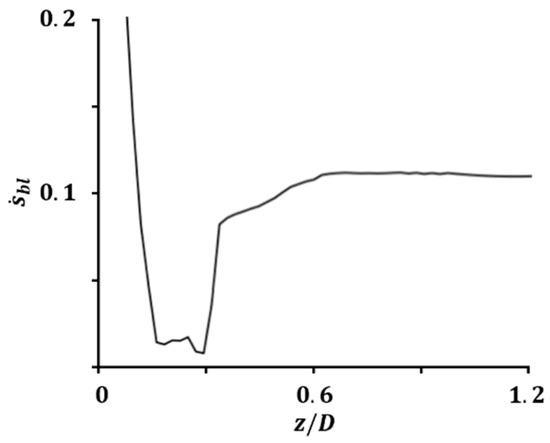
Figure 15.
The spanwise distribution of entropy generated by boundary layer separation. The area in shadow represents the suppression of boundary layer separation loss due to the secondary flow.
5. Conclusions
In this study, the entropy generation of secondary flow and the interaction between secondary flow and side-wall boundary layer were numerically investigated by RANS CFD for a 90° curved channel. A separated case was presented to validate the simulation strategy. Detailed analyses of flow structure, secondary vorticity and its generation mechanisms along the curved channel, and secondary flow loss patterns under different boundary layer characteristics are presented. The main contributions and new findings of this paper are summarized as follows:
- (1)
- The side-wall boundary layer presents a slight reduction effect on the generation of secondary flow by displacing the main stream. The entropy generated by the secondary flow varies as the boundary layer characters change, while the ratio between each secondary flow component is not sensitive to the boundary layer characteristics. The passage vortex, dominating the secondary flow loss, shows a transportation effect on the low-kinetic-energy fluids within the end-wall and side-wall boundary layers. Consequently, a weak induced vortex pair is generated on the side-wall surface.
- (2)
- The secondary flow shows a suppression effect on the side-wall boundary layer separation by entraining the low-momentum fluids that would separate without a secondary flow effect. The fluids flow into the less “harmful” secondary flow structures, and thus an overall positive effect of controlling the side-wall boundary layer separation is presented.
It should be noted that accurately predicting the dissipation is still a challenge for RANS CFD. While the secondary flow loss pattern presented in this study is consistent with the revealed flow physics, the authors consider that this study contributes some basic understandings from which advanced secondary flow control techniques can be developed.
Author Contributions
Conceptualization, H.X., Z.S. and Q.Z.; formal analysis, Y.X., X.P., H.X. and Q.Z.; methodology and investigation, Y.X., X.P., H.X. and Q.Z.; Supervision, H.X., Z.S. and Q.Z.; Writing—original draft preparation Y.X., X.P., H.X. and Q.Z.; Writing—review and editing Y.X., and Q.Z. All authors have read and agreed to the published version of the manuscript.
Funding
This research received no external funding.
Data Availability Statement
Not applicable.
Conflicts of Interest
The authors declare no conflict of interest.
References
- Thomson, J. On the Origin of Windings of Rivers in Alluvial Plains—With Remarks on the Flow of Water Round Bends in Pipes; Proceedings of the Royal Society of London: London, UK, 1877; pp. 5–8. [Google Scholar]
- Blanckaert, K.; De Vriend, H.J. Secondary flow in sharp open-channel bends. J. Fluid Mech. 2004, 498, 353–380. [Google Scholar] [CrossRef]
- Humphrey, J.A.C.; Whitelaw, J.H.; Yee, G. Turbulent flow in a square duct with strong curvature. J. Fluid Mech. 2006, 103, 443–463. [Google Scholar] [CrossRef]
- Sieverding, C.H. Recent progress in the understanding of basic aspects of secondary flows in turbine blade passages. J. Eng. Gas Turbines Power 1985, 107, 248–257. [Google Scholar] [CrossRef]
- Langston, L.S. Secondary flows in axial turbines—A review. Ann. N. Y. Acad. Sci. 2001, 934, 11–26. [Google Scholar] [CrossRef]
- Aref, P.; Ghoreyshi, M.; Jirasek, A.; Satchell, M. CFD Validation and Flow Control of RAE-M2129 S-Duct Diffuser Using CREATETM-AV Kestrel Simulation Tools. Aerospace 2018, 5, 31. [Google Scholar] [CrossRef]
- Greitzer, E.M.; Tan, C.S.; Graf, M.B. Internal Flow—Concepts and Applications; Cambridge University Press: Cambridge, UK, 2004. [Google Scholar]
- Sharma, O.P.; Butler, T.L. Predictions of endwall losses and secondary flows in axial flow turbine cascades. J. Turbomach. 1987, 109, 229–236. [Google Scholar] [CrossRef]
- Bradshaw, P. Turbulent Secondary Flows. Annu. Rev. Fluid Mech. 1987, 19, 53–74. [Google Scholar] [CrossRef]
- Hawthorne, W.R. Secondary Circulation in Fluid Flow. Proc. R. Soc. Lond. A 1951, 206, 374–387. [Google Scholar] [CrossRef]
- Hawthorne, W.R. Rotational Flow through Cascades Part I. The Components of Vorticity. Q. J. Mech. Appl. Math. 1955, 8, 266–279. [Google Scholar] [CrossRef]
- Hawthorne, W.R.; Armstrong, W.D. Rotational Flow through Cascades Part II. The Circulation About the Cascade. Q. J. Mech. Appl. Math. 1955, 8, 280–292. [Google Scholar] [CrossRef]
- Smith, A.G. On the Generation of the Streamwise Component of Vorticity for Flows in Rotating Passages. Aeronaut. Q. 1957, 8, 369–383. [Google Scholar] [CrossRef]
- Marris, A.W. The Generation of Secondary Vorticity in an Incompressible Fluid. J. Appl. Mech. 1963, 30, 525–531. [Google Scholar] [CrossRef]
- Horlock, J.H.; Lakshminarayana, B. Secondary Flows: Theory, Experiment, and Application in Turbomachinery Aerodynamics. Annu. Rev. Fluid Mech. 1973, 5, 247–280. [Google Scholar] [CrossRef]
- Lakshminarayana, B.; Horlock, J.H. Generalized expressions for secondary vorticity using intrinsic co-ordinates. J. Fluid Mech. 1973, 59, 97–115. [Google Scholar] [CrossRef]
- Compton, D.A.; Johnston, J.P. Streamwise vortex production by pitched and skewed jets in a turbulent boundary layer. AIAA J. 1992, 30, 640–647. [Google Scholar] [CrossRef]
- Schwarz, W.R.; Bradshaw, P. Turbulence structural changes for a three-dimensional turbulent boundary layer in a 30° bend. J. Fluid Mech. 1994, 272, 183–210. [Google Scholar] [CrossRef]
- Denton, J.; Pullan, G. A numerical investigation into the sources of end-wall loss in axial flow turbines. In Proceedings of the ASME Turbo Expo 2012: Turbine Technical Conference and Exposition, Copenhagen, Denmark, 11–15 June 2012; pp. 1417–1430. [Google Scholar]
- Yi, W.; Ji, L. Control and Entropy Analysis of Corner Flow Separation in a Compressor Cascade Using Streamwise Grooves. Entropy 2019, 21, 928. [Google Scholar] [CrossRef]
- Cui, J.; Nagabhushana Rao, V.; Tucker, P.G. Numerical investigation of secondary flows in a high-lift low pressure turbine. Int. J. Heat Fluid Flow 2017, 63, 149–157. [Google Scholar] [CrossRef]
- Pichler, R.; Zhao, Y.; Sandberg, R.; Michelassi, V.; Pacciani, R.; Marconcini, M.; Arnone, A. Large-Eddy Simulation and RANS Analysis of the End-Wall Flow in a Linear Low-Pressure Turbine Cascade, Part I: Flow and Secondary Vorticity Fields under Varying Inlet Condition. J. Turbomach. 2019, 141, 121005. [Google Scholar] [CrossRef]
- Kanani, Y.; Acharya, S.; Ames, F. Numerical Predictions of Turbine Cascade Secondary Flows and Heat Transfer with Inflow Turbulence. J. Turbomach. 2021, 143, 121008. [Google Scholar] [CrossRef]
- Shur, M.L.; Spalart, P.R.; Strelets, M.K.; Travin, A.K. A hybrid RANS-LES approach with delayed-DES and wall-modelled LES capabilities. Int. J. Heat Fluid Flow 2008, 29, 1638–1649. [Google Scholar] [CrossRef]
- Piomelli, U. Wall-layer models for large-eddy simulations. Prog. Aerosp. Sci. 2008, 44, 437–446. [Google Scholar] [CrossRef]
- Pirozzoli, S.; Bernardini, M.; Grasso, F. Characterization of coherent vortical structures in a supersonic turbulent boundary layer. J. Fluid Mech. 2008, 613, 205–231. [Google Scholar] [CrossRef]
- Bernardini, M.; Pirozzoli, S.; Orlandi, P. Compressibility effects on roughness-induced boundary layer transition. Int. J. Heat Fluid Flow 2012, 35, 45–51. [Google Scholar] [CrossRef]
- Spalart, P.R.; Deck, S.; Shur, M.L.; Squires, K.D.; Strelets, M.K.; Travin, A. A New Version of Detached-eddy Simulation, Resistant to Ambiguous Grid Densities. Theor. Comput. Fluid Dyn. 2006, 20, 181–195. [Google Scholar] [CrossRef]
- De Vanna, F.; Cogo, M.; Bernardini, M.; Picano, F.; Benini, E. Unified wall-resolved and wall-modeled method for large-eddy simulations of compressible wall-bounded flows. Phys. Rev. Fluids 2021, 6, 034614. [Google Scholar] [CrossRef]
- Camci, C.; Rizzo, D.H. Secondary flow and forced convection heat transfer near end-wall boundary layer fences in a 90 deg turning duct. Int. J. Heat Mass Transf. 2002, 45, 831–843. [Google Scholar] [CrossRef]
- Menter, F.R. Two-equation eddy-viscosity turbulence models for engineering applications. AIAA J. 1994, 32, 1598–1605. [Google Scholar] [CrossRef]
- Pointwise, V18.4 R3; Cadence: Fort Worth, TX, USA, February 2021.
- Spalart, P.; Allmaras, S. A one-equation turbulence model for aerodynamic flows. In Proceedings of 30th Aerospace Sciences Meeting and Exhibit, Reno, NV, USA, 6–9 January 1992. [Google Scholar]
- Denton, J.D. Loss mechanisms in turbomachines. J. Turbomach. 1993, 115, 621–656. [Google Scholar] [CrossRef]
- Zlatinov, M.B.; Sooi Tan, C.; Montgomery, M.; Islam, T.; Harris, M. Turbine Hub and Shroud Sealing Flow Loss Mechanisms. J. Turbomach. 2012, 134, 061027. [Google Scholar] [CrossRef]
Publisher’s Note: MDPI stays neutral with regard to jurisdictional claims in published maps and institutional affiliations. |
© 2022 by the authors. Licensee MDPI, Basel, Switzerland. This article is an open access article distributed under the terms and conditions of the Creative Commons Attribution (CC BY) license (https://creativecommons.org/licenses/by/4.0/).