1. Introduction
With the characteristics of lighter weight in addition to higher stiffness and strength, fiber-reinforced composites have been widely used in the aerospace industry. In order to reduce production costs and simplify the machining processes plain-woven fabric composites are becoming increasingly important in the design and manufacturing of lightweight aerospace structures.
With the aim of improving the level of structural design and analysis, it is necessary to understand the loading response and failure mechanism of plain-woven composites. Research has been widely carried out and various experimental techniques as well as methods have been utilized in the study of plain-woven composites. X-ray tomography and microscale measurement systems are important in measuring the 3D coordinates of plain-woven composites’ mesoscale structures and establishing mesoscale geometric models. Experimental observations based on the above methods [
1,
2] have contributed to a direct understanding of the composites’ woven morphology and offered enlightenment in the accurate modeling of the interlaced yarns. Wang et al. [
3] used micro-CT equipment with a high-resolution lens-coupled detector to reconstruct 3D images of C/epoxy plain-woven composites. Based on the obtained clear 3D image of the T300/epoxy material, the statistical properties of the yarn feature parameters that were then analyzed. Scanning electron microscopes (SEMs) and digital imaging systems are also frequently used in the microscopic observations of composites. With the assistance of microscopic observations, Carvalho et al. [
4] investigated the compressive failure of orthogonal 2D woven composites. The regional failure of the load-aligned tows was studied and the damage propagation process was analyzed in detail. Specialized fixtures have also been designed for different test targets. With a picture-frame apparatus Nguyen et al. [
5] studied the shearing properties of plain-woven fabrics and prepregs. Experimental investigations on the shear properties of the fabric composites were conducted and the relationships between the shearing angle and the applied load for different weave architectures were analyzed.
Experimental results provide the basis on which plain-woven composites could be modeled. With the numerical models, the finite-element (FE) method has been widely applied in the analysis of plain-woven fabrics due to its advantages in calculation efficiency and low cost. In the FE modeling of plain-woven fabrics the industrial application of advanced meshing methods has attracted a growing interest due to its operational convenience [
6]. The applicability of voxel meshes in the numerical modeling of plain-woven composites was studied by Doitrand et al. [
7], and the calculation accuracy of the voxel method was evaluated. Grail et al. [
8] developed an automated method to generate consistent FE meshes for plain-woven composites. Based on the proposed method, a representative unit cell (RUC) of a compacted and nested multilayer woven composite was generated.
Obtaining the mechanical properties of the plain-woven composites and evaluating the properties’ effects are necessary preconditions for the following structural analysis. With the assistance of RUC models and FE analyses, Goyal et al. [
9] investigated the effects of geometric parameters and basic material properties on the effective engineering properties of plain-woven braids. Matveev et al. [
10] numerically studied the effects of fiber strength on the macroscale strength of textile composites and found that a wide fiber strength distribution led to a narrow distribution of composite strength. In evaluating the mechanical properties’ effects and predicting the mechanical response of braided composites, Richter et al. [
11] proposed a simulation framework with a meshing methodology that considered yarn-to-yarn delamination. The validation of the framework underlined the great potential for further damage modeling of the fabric composites.
The simulation of failure is also an important concern in the FE analysis of fabrics. In order to understand the elementary damage mechanisms and investigate the development of damage in detail, advanced techniques such as improved two-dimensional generalized plane strain FE models [
12], the cracking kinetics simulation [
13] and shear nonlinearity incorporated failure process modeling [
14] have been utilized in investigations. Important damage details have been captured and the relationships between ply damage behaviors and elementary damage mechanisms have been linked.
Macro fabric composite structures could be further studied at the mesoscale of the fiber tows and the microscale of the constituents. In the multiscale failure analyses of the fabric composites micromechanics-based failure theories [
15,
16,
17,
18] are becoming increasingly appealing for researchers due to their advantage in explaining the failure of composites at the constituent level [
19]. By combining macroscale FE models with RUCs of meso- and microscales the multiscale analysis method takes the advantages of both the efficiency of the macro analysis and the accuracy of the micromechanics-based failure criteria [
20]. The effectiveness of the multiscale analysis in predicting the fabric composites’ damage initiation and failure process [
21,
22,
23] indicated the huge potential of the micromechanics-based methods’ further engineering applications.
The mesoscale RUC is an important stress transformation medium of the plain-woven fabric composites’ multiscale analysis, and its accurate establishment is necessary for further failure analysis. Microscopic observations and basic tests could be conducted, making it convenient to obtain the geometric and mechanical parameters of the fabric composites. However, the feasibility of the experimentally obtained parameters in modeling the RUC needs further validation considering the dispersibility and errors in the experiments. In predicting the properties of textile composites, analytical solutions suitable for engineering applications have been proposed [
24,
25,
26,
27,
28]. Although the theoretical foundations are solid the geometric parameters and internal force analyses have been oversimplified and idealized in previous research [
24,
28], and the prediction accuracy could be further raised with the improvement of the previous models. Using the fiber tows’ geometric and mechanical parameters as inputs and having an advantage in calculation efficiency, reliable analytical models have broad prospects in engineering applications in validating the effectiveness of the experimentally obtained modeling parameters and guaranteeing the accuracy of the established RUC.
In this article attempts have been made to develop a new reliable analytical model with experimental inputs in calculating the uniaxial tensile modulus of plain-woven fabric composites.
In the
Section 2 the cross-section and undulation path of the fiber tows are reasonably simplified and geometrically expressed with parameters and formulations. Within the mesoscale RUC the studied yarn segments are assigned.
In the
Section 3 the interactions between the warp and weft yarns are simplified and the internal forces of the studied yarn segments are analyzed in detail.
In the
Section 4 the analytical model is developed. The analytical solution for the uniaxial tensile modulus is derived from the elastic deformation energy analysis with the fiber tows’ internal forces more comprehensively considered. The necessary parameters of inputs are referred and the matched experiments to obtain the parameters are designed.
Finally, in the
Section 5 the proposed analytical model is applied to predict the uniaxial tensile modulus of T300/Cycom970, and the application process is introduced in detail. Tensile experiments on the T300/Cycom970 laminates are conducted and the effectiveness of the analytical model is validated.
2. Simplification of the Cross-Section and Undulation Path of the Fiber Tows
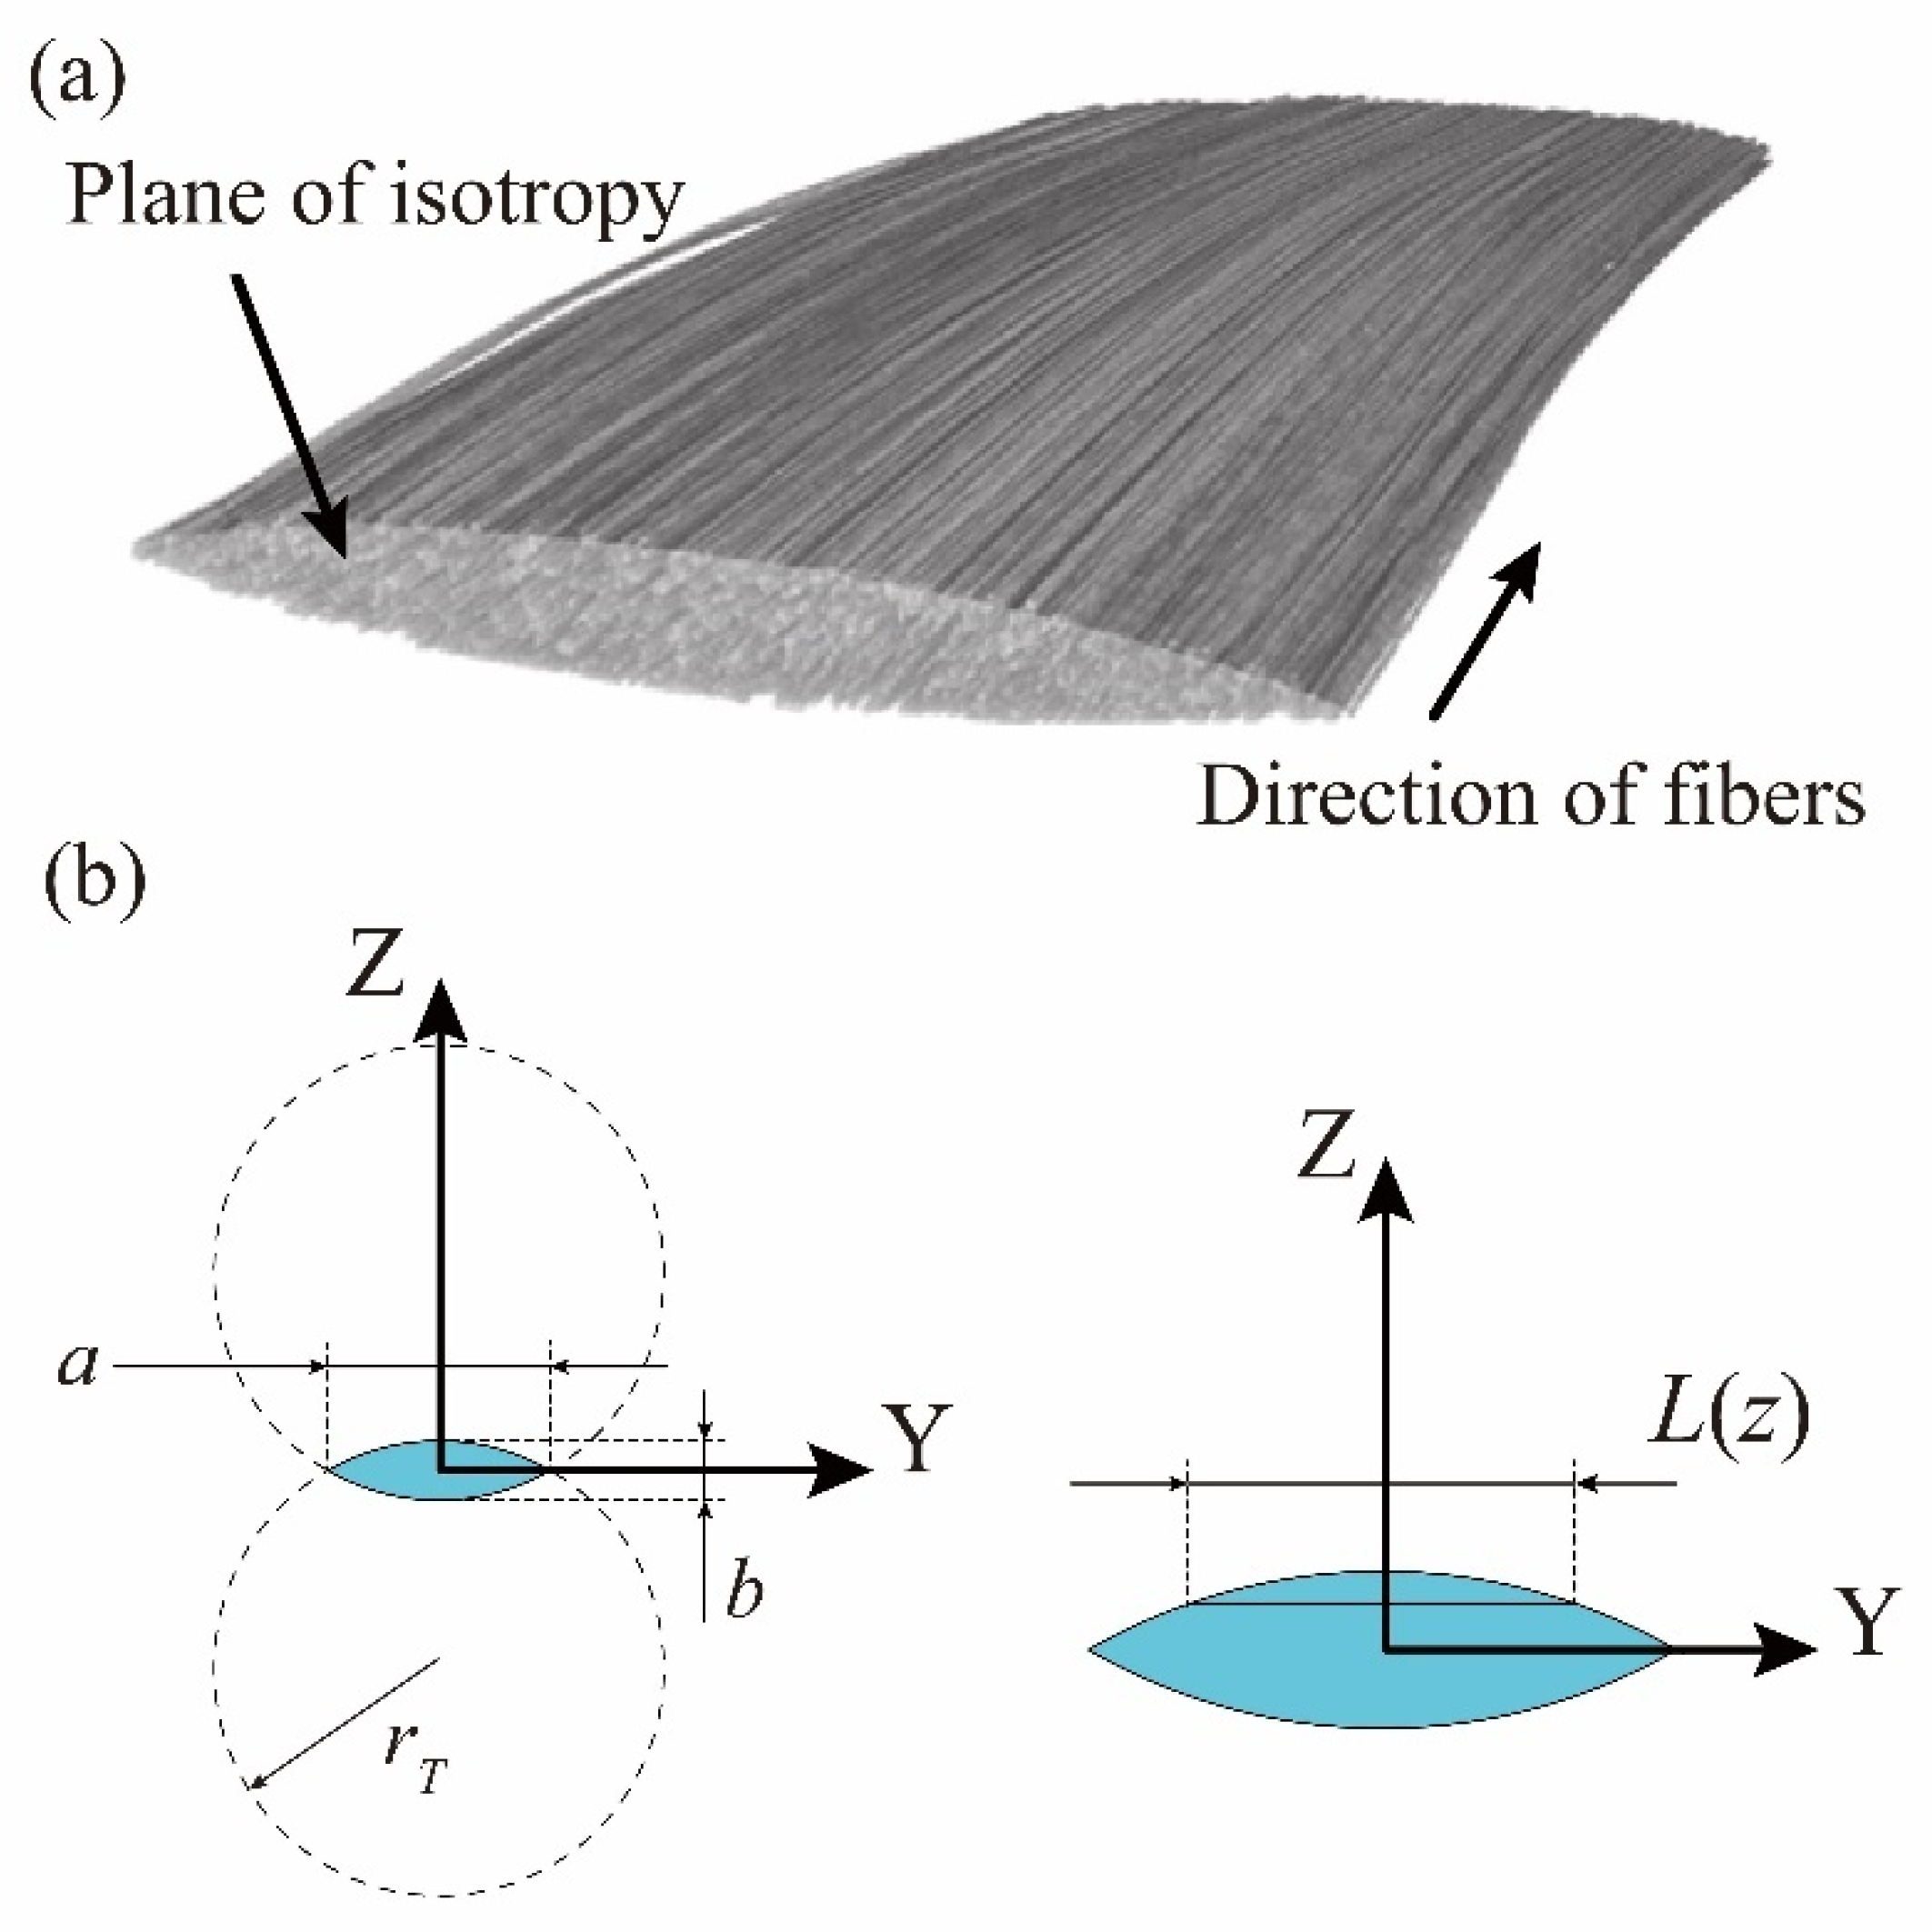
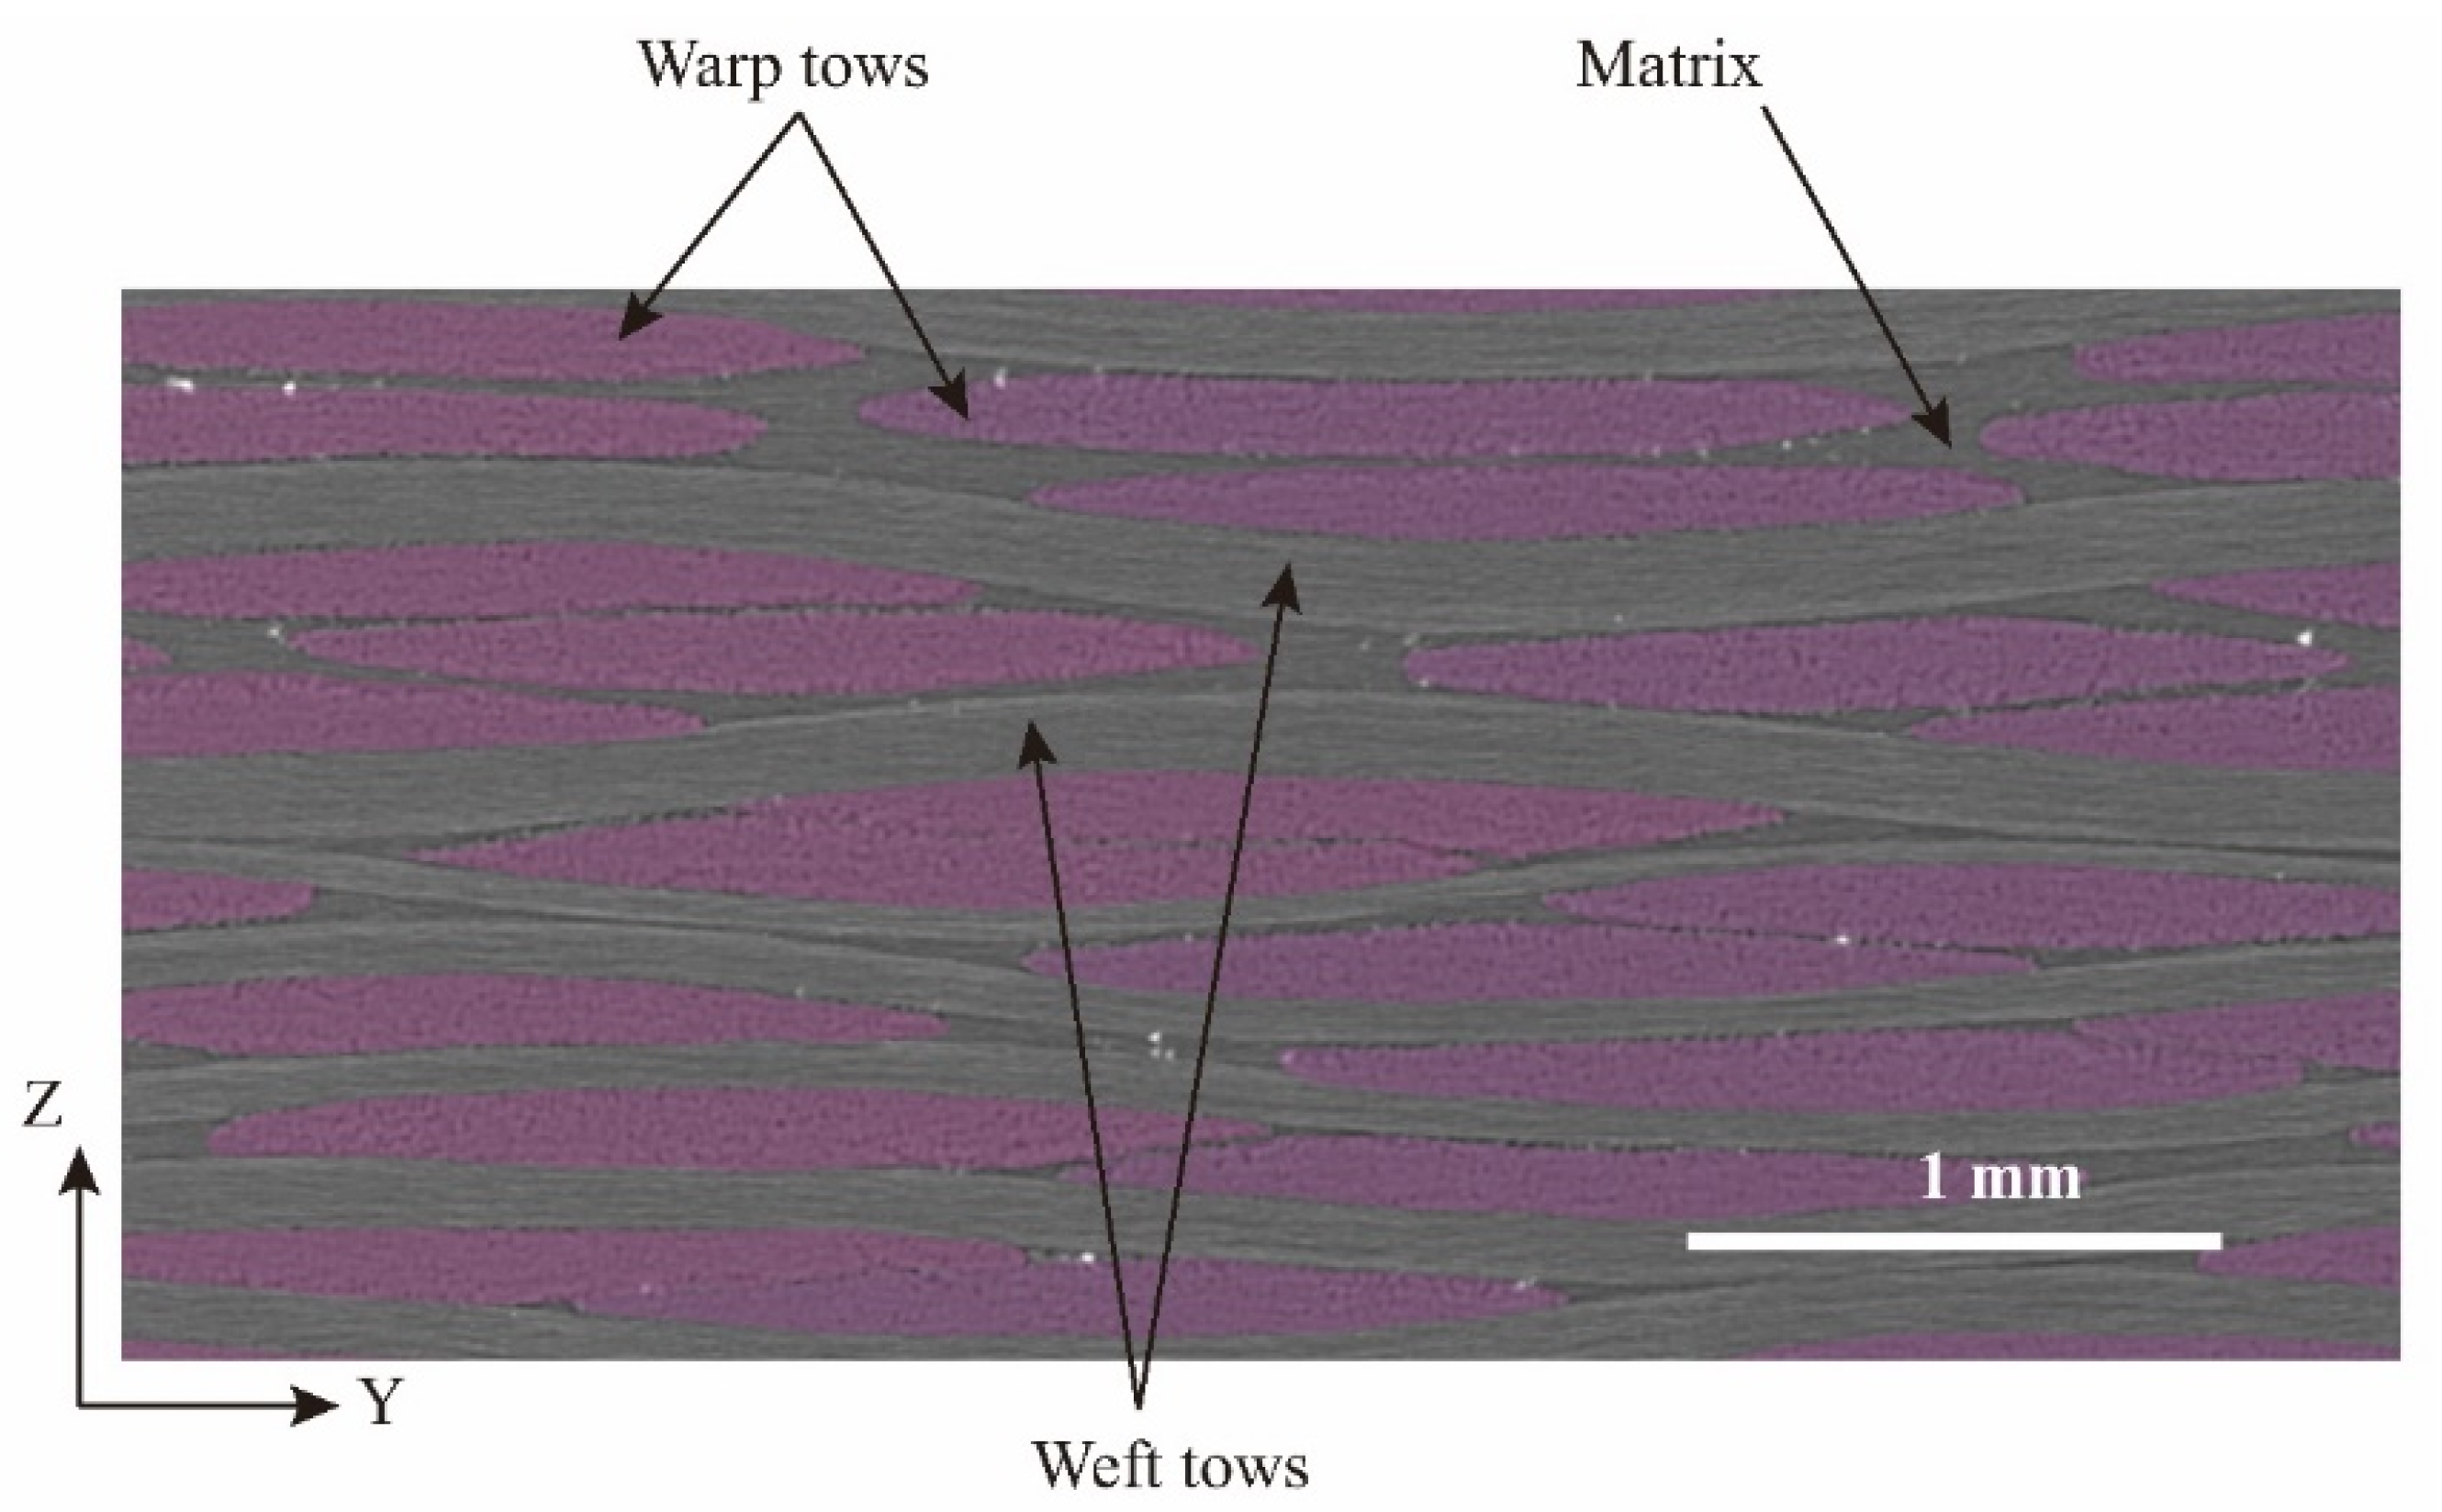
Due to the randomness of the woven prepregs and the influence of the hot-pressing manufacturing process there are difficulties in accurately describing the irregular-shaped cross-section of the fiber tows with certain parameters. Therefore, the simplification of the cross-section is needed as an important basis for the analytical solution of the fabric composites. Compared to the observations from computed tomography (CT), as illustrated in
Figure 1a, previous research results [
29,
30] indicate that the lenticular shape best approaches the cross-section of the plain-woven composites’ fiber tows. Besides, the lenticular-shaped cross-section exceeds the other frequently used sections in ensuring the fiber tows of the warp and weft directions realistically contact without interpenetration. Considering the above advantages, the lenticular shape is chosen to simplify the cross-section of the fiber tows in this article.
The warp yarn is taken as the example and the cross-section is projected onto the Y–Z plane, as presented in
Figure 1b. The controlling parameters in defining the lenticular-shaped cross-section are
a,
b and
rT, which represent the width, thickness and controlling radius of the cross-section, respectively:
In
Figure 1b,
z stands for the ordinate value of the Y–Z plane and
L(
z) stands for the
z-corresponded horizontal intercept of the cross-section. The area,
A, and the inertia moment of the cross-section,
I, for the fiber tows in the warp and the weft directions are then expressed as follows:
Referring to Equation (1), the area and the inertia moment are further expressed as:
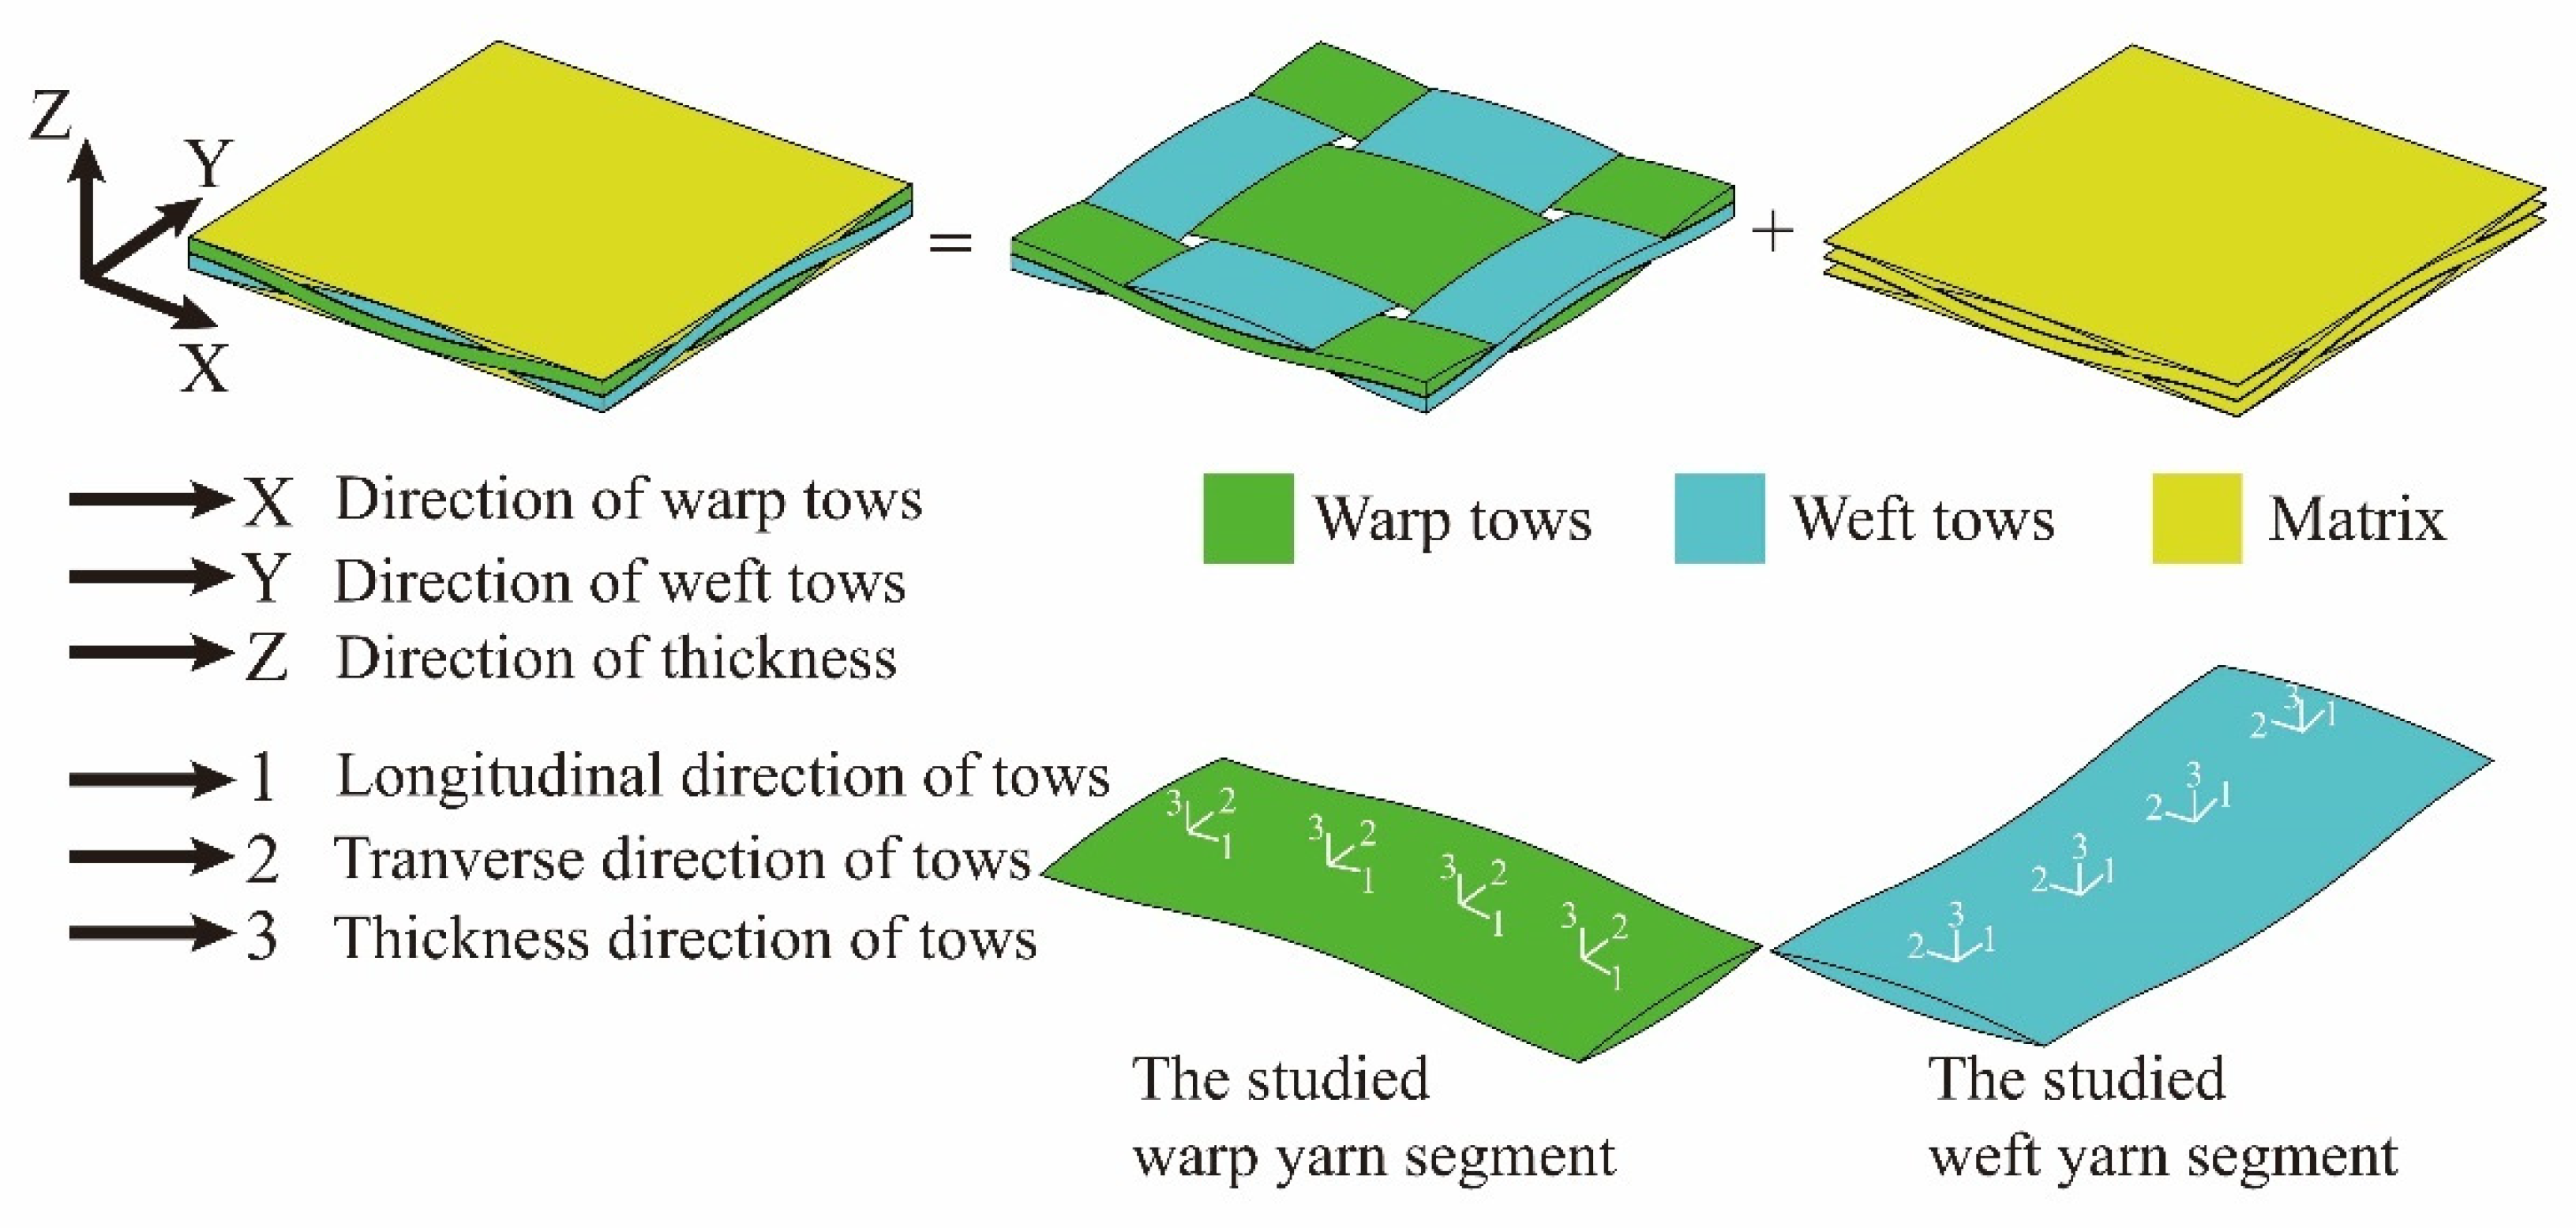
Corresponding to the lenticular-shaped cross-section, the undulation path composed of arcs with the same radius is used in this article. With the periodic characteristics of the plain-woven fabric composites, the analysis is performed on the mesoscale RUC, inside of which the segments of the warp and weft yarns are taken as the study objects, as illustrated in
Figure 2.
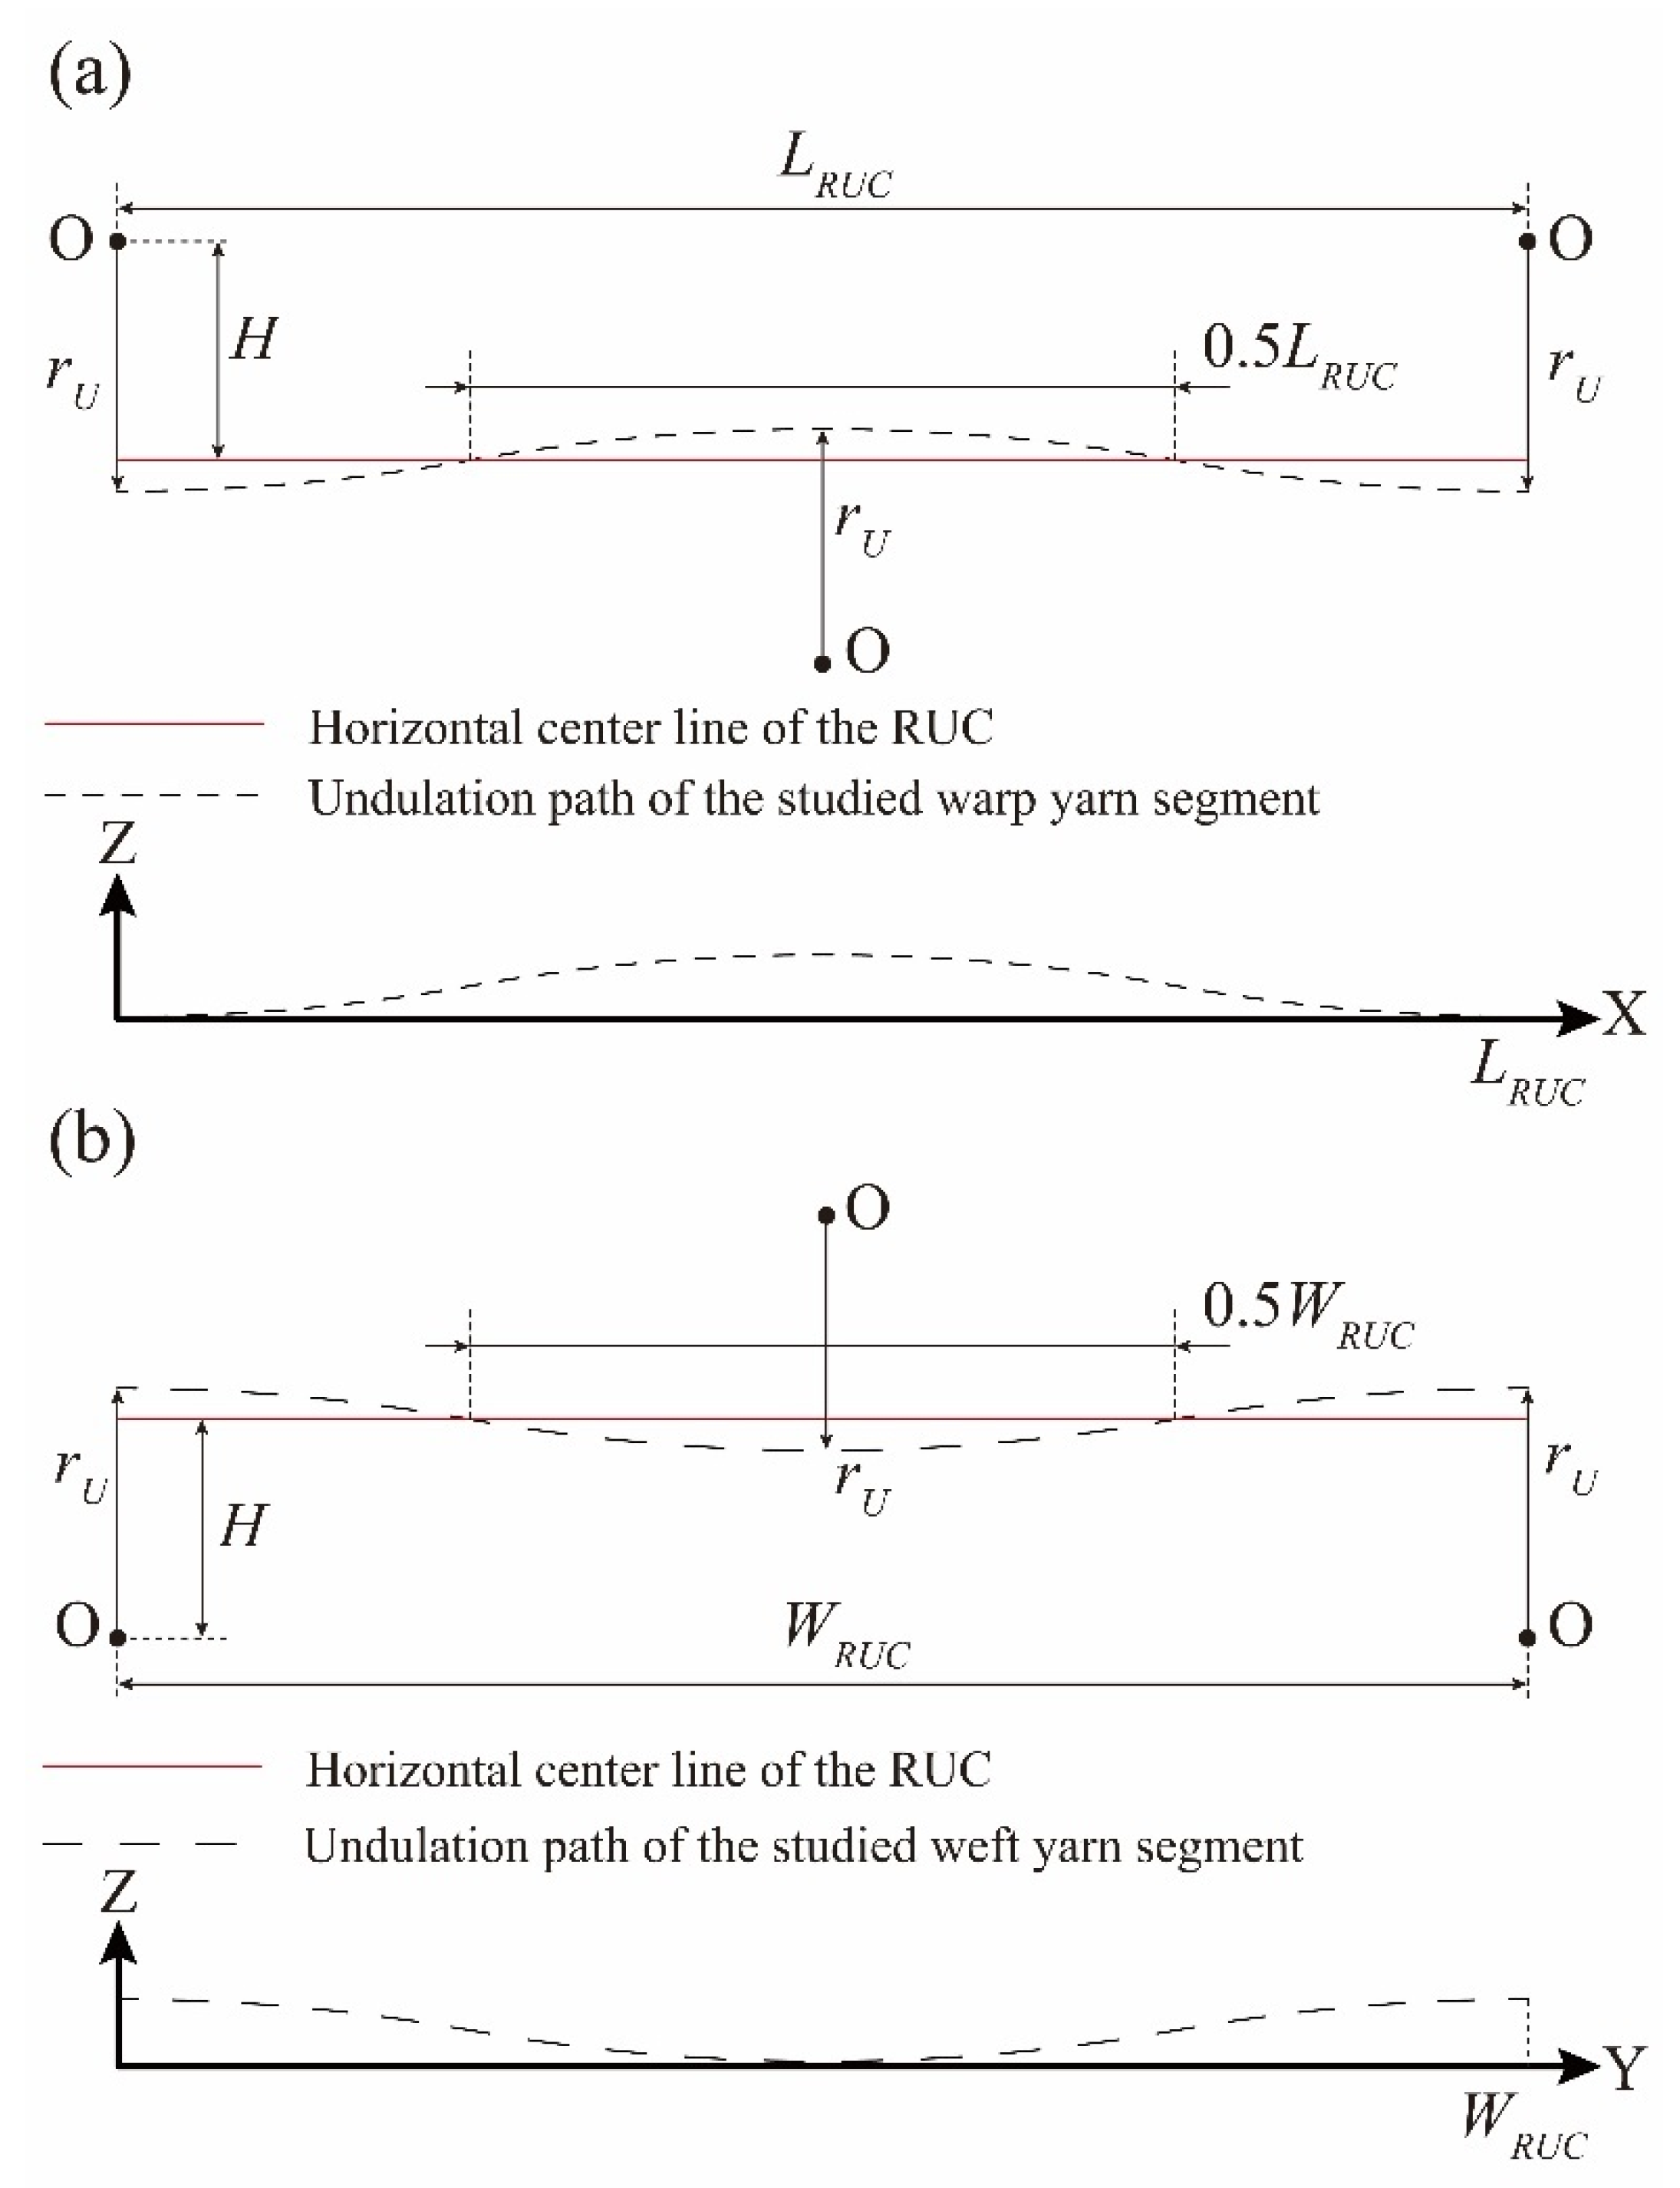
The undulation path of the studied warp yarn segment is presented in
Figure 3a.
rU represents the radius of the arcs and
LRUC represents the length of the mesoscale RUC.
H stands for the distance between the horizontal center line of the RUC and the center of the arcs in the undulation path:
For the studied weft yarn segment in
Figure 2 the geometric parameters of the undulation path in
Figure 3b remain the same, and the width of the mesoscale RUC (
WRUC) is equal to
LRUC, considering the plain-woven structure of the fabric composites.
In the
x range of
the undulation path function
z1(
x) of the warp yarn segment corresponding to
Figure 3a is expressed as:
Similarly, for the weft yarn segment in
Figure 3b the undulation path function
z2(
y) is expressed as:
3. Force Analysis of the Fiber Tows under Uniaxial Tension Load
The monolayer of the plain-woven fabric composites under the uniaxial tension load along the warp direction is presented in
Figure 4a. As the warp yarns are straightened the distributed interaction force of
q between the weft and warp yarns exists in hindering the straightening of the warp yarns and causing the crimping of the weft yarns. For the convenience of the following analyses the distributed interaction force of
q is simplified as the concentrate force of
Q, as illustrated in
Figure 4b.
For the studied mesoscale RUC of the plain-woven fabric composites in
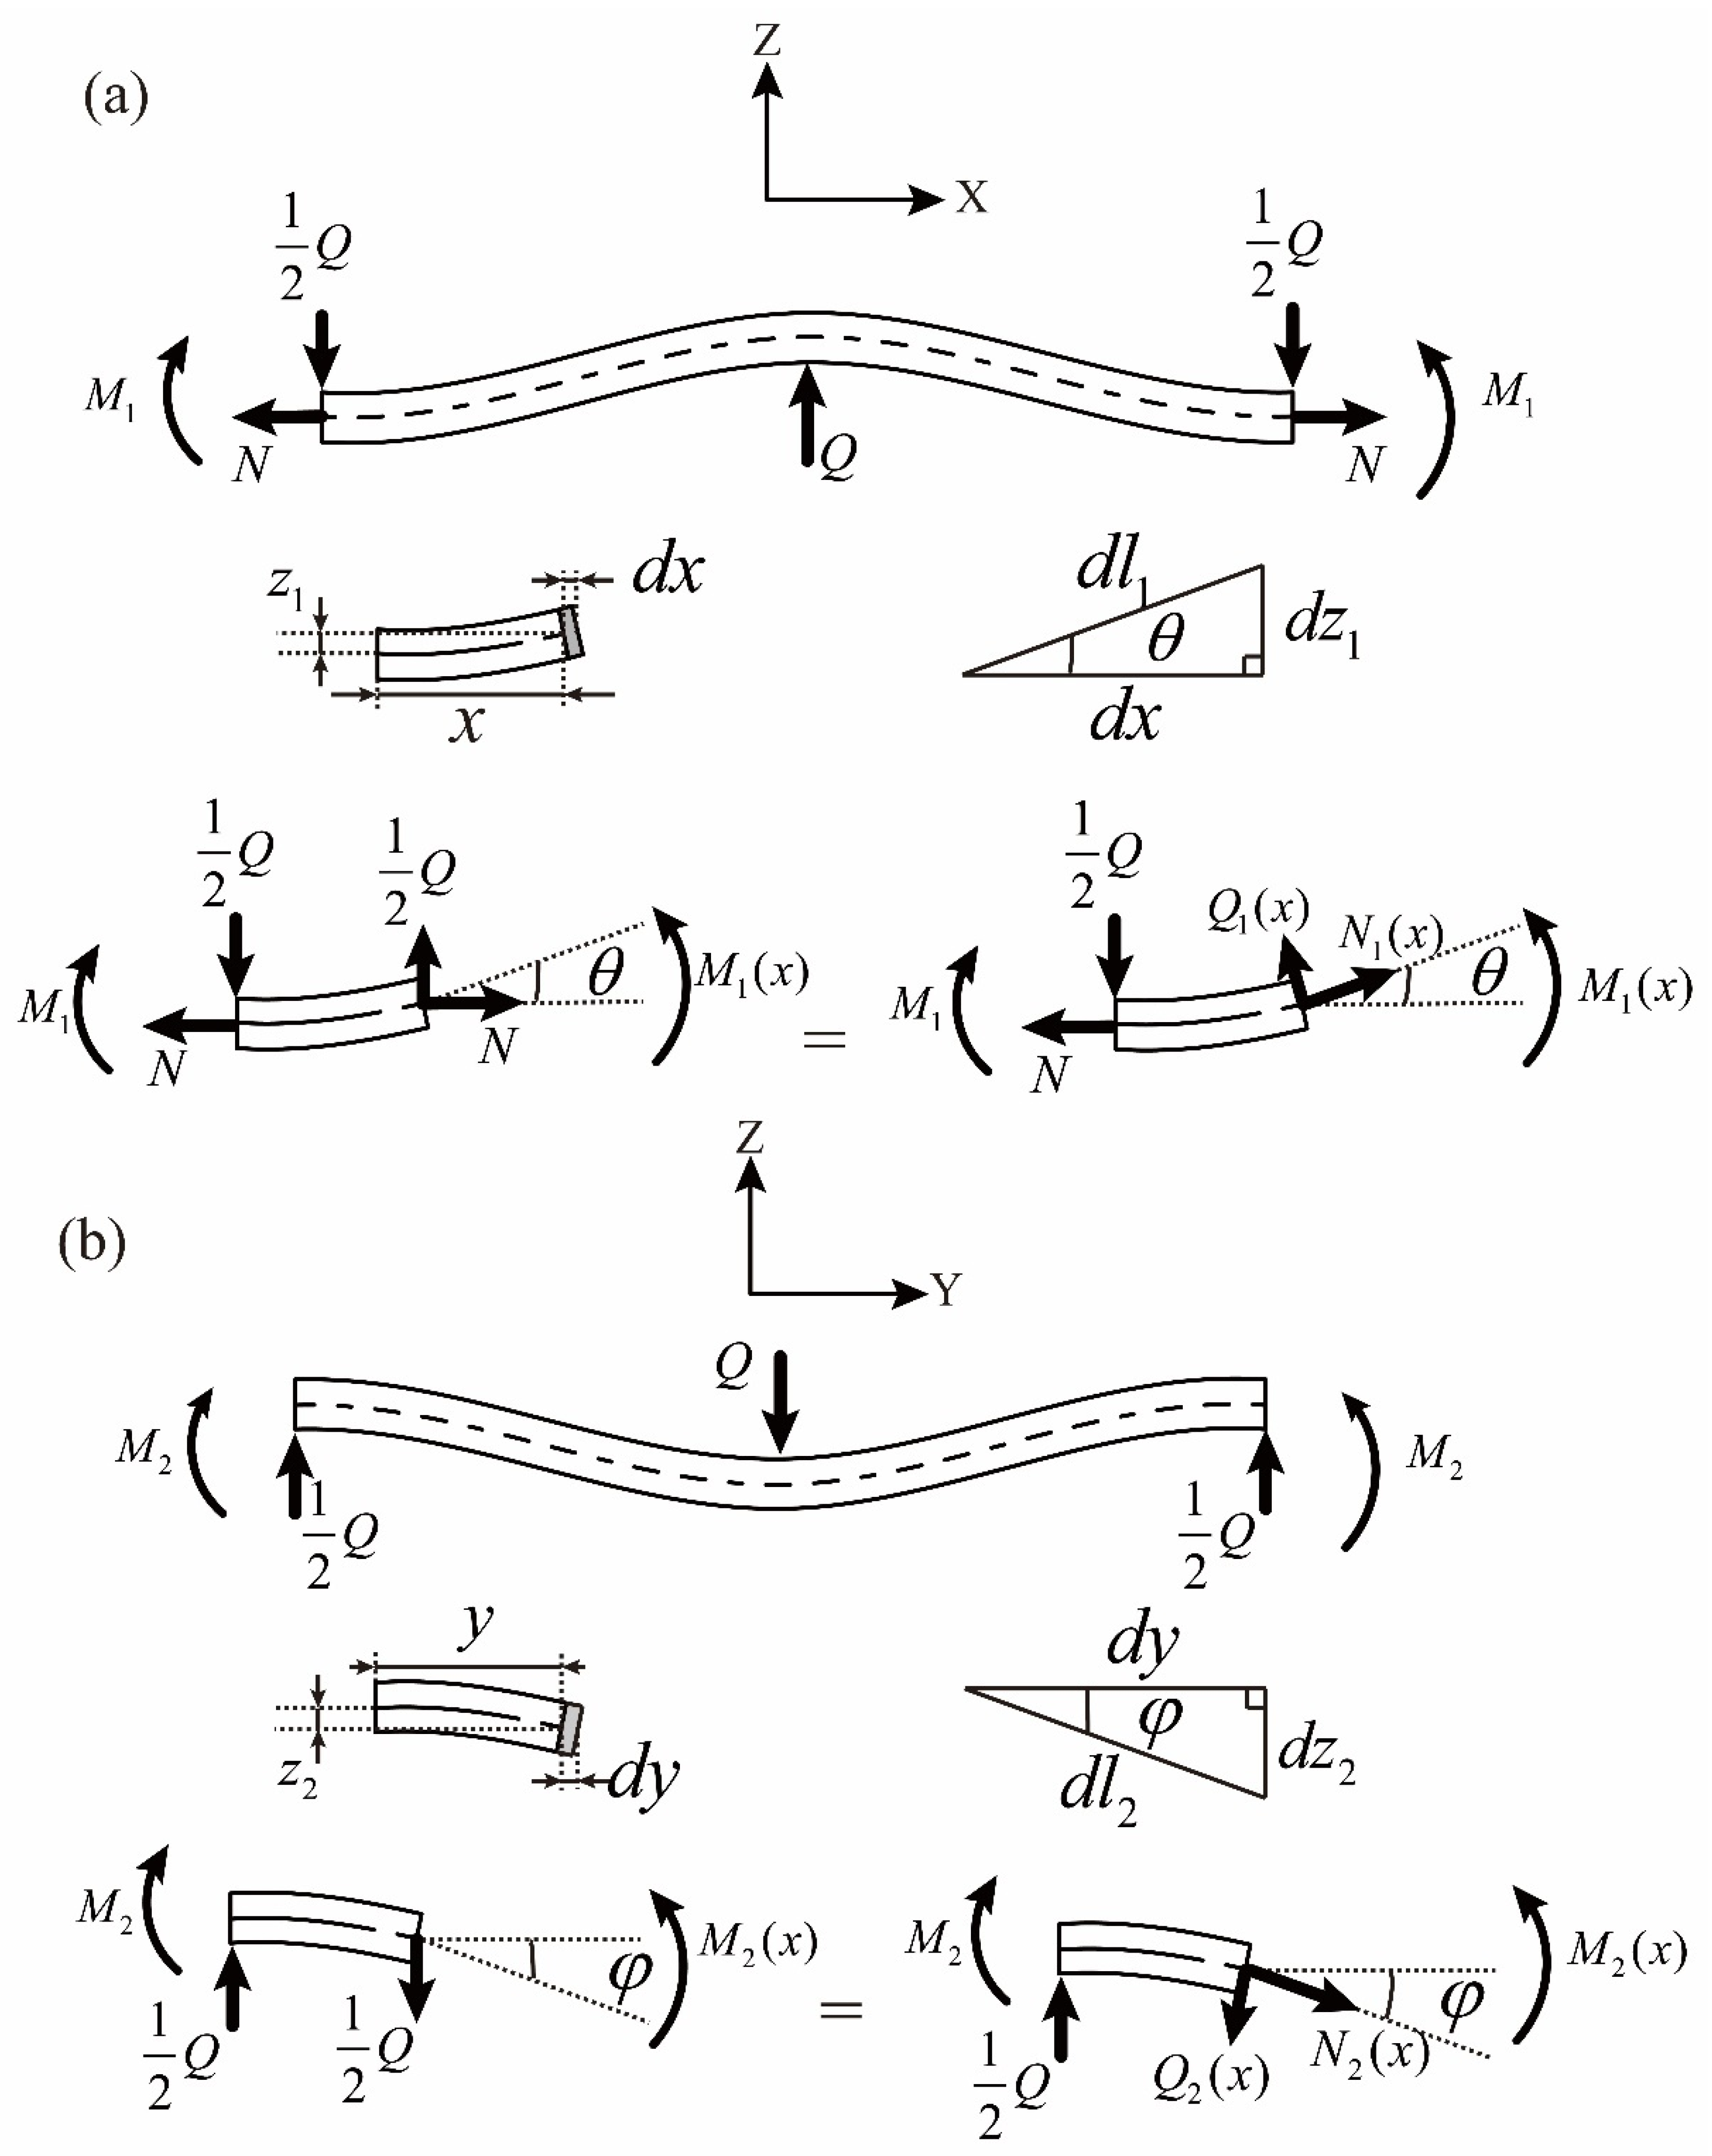
Figure 2, the force analyses of the warp and weft yarn segments are illustrated in
Figure 5.
In
Figure 5a the axial load of
N and the constraint moment of
M1 are loaded at the boundary cross-sections of the warp yarn segment. The interaction loads of
Q and
½Q from the weft yarns concentrate at the middle location and the left and right endpoints, respectively.
dl1 stands for the differential length of the warp yarn segment and
θ stands for the angle between
dl1 and the X-axis. At the
x-corresponded cross-section in the warp yarn segment the horizontal internal load of
N and the vertical internal load of
½Q, which satisfy the force balance condition, are further converted into the internal tensile load
N1(
x) and the internal shearing load
Q1(
x), which are perpendicular and parallel to the cross-section, respectively.
For the cross-sections of the studied warp yarn segment, within the range of (0,
½LRUC) along the X-axis, the internal bending moment
M1(
x) is expressed as:
The internal tensile load
is expressed as:
Additionally, the internal shearing load
is expressed as:
For the weft yarn segment in
Figure 5b the constraint moments of
M2 are loaded at the boundary cross-sections and the interaction loads of
Q and
½Q from the warp yarns concentrate at the middle location and the left and right endpoints, respectively. The angle between the differential length of the weft yarn segment
dl2 and the Y-axis is presented as
φ. Similar to the warp yarn segment, the vertical internal load of
at the
y-corresponded cross-section in the weft yarn segment is converted into the internal tensile load
N2(
y) and the internal shearing load
Q2(
y).
For the cross-sections of the studied weft yarn segment, within the range of (0,
½WRUC) along the Y-axis, the internal bending moment
M2(
y) is expressed as:
The internal tensile load
N2(
y) is expressed as:
Additionally, the internal shearing load
Q2(
y) is expressed as:
Considering the arc-shaped undulation paths of the warp and weft yarns, the tangents of
θ and
φ are, respectively, expressed as:
4. Analytical Solution in Predicting the Uniaxial Tensile Modulus of the Plain-Woven Fabric Composites
The parameters of
E11(tow),
G12(tow) and
G13(tow) stand for the longitudinal modulus, the in-plane shear modulus and the out-of-plane shear modulus of the plain-woven fabric composites’ fiber tows, respectively. Under the hypothesis of transverse isotropy
G12(tow) is equal to
G13(tow).
L1 and
L2 stand for the lengths of the warp and weft yarn segments illustrated in
Figure 2, respectively. Under the hypothesis that the shearing stress is uniformly distributed on the fiber tow’s cross-section the strain energy of the studied warp yarn segment is presented as
U1:
For the studied weft yarn segment the strain energy
U2 is expressed as:
In the above equations the cosines of
θ and
φ are, respectively, expressed as:
The simplification functions of
C1(
x),
C2(
y),
S1(
x) and
S2(
y) are defined as:
Putting the internal loads of Equations (9)–(11) into the strain energy formulation in Equation (17),
U1 could be further expressed with the simplified intermediate coefficients of
X1,
X2,
X31,
X5,
X6 and
X7 as follows, considering the symmetrical characteristics of the studied warp yarn segment:
Similarly, for the studied weft yarn segment
U2 could be further expressed with the simplified intermediate coefficients of
X32,
X4 and
X8 as:
The simplified intermediate coefficients in the above equations of (23) and (24) are expressed as follows:
By defining the intermediate coefficient of
X3 as:
the total strain energy,
U, for the part of the fiber tows in the mesoscale RUC of
Figure 2 could then be obtained as:
Constraint at the left end, the right end’s displacement of the deformed warp yarn segment along the X-axis corresponding to the axial tensile load of
N is presented as
u1 in
Figure 6.
For the studied warp yarn segment in
Figure 2 U1* stands for its complementary energy. According to Castigliano’s second theorem:
Within the framework of the ideal linear elasticity
U1* is equal to the strain energy
U1, and
u1 in
Figure 6 could be expressed as:
The constraint moments of
M1 and
M2 and the interaction load of
are all introduced by
, which is the only external load applied to warp yarn in the monolayer of the plain-woven fabric composites. Under the linear hypothesis within the small deformation extents the constraint moments and the interaction load are supposed linearly correlated with the external load,
N, through the coefficients of
k1,
k2 and
k3:
Putting Equations (38)–(40) into Equation (35), the total strain energy of
U then turns into:
For the part of fiber tows in the mesoscale RUC of
Figure 2, the total potential energy is defined as
Π and the external work is defined as
W. Considering the total strain energy of
U,
Π could be expressed as:
According to the principle of minimum potential energy, among all the displacement solutions which satisfy the geometric boundary conditions the real displacement solution minimizes the structural total potential energy. Corresponding to the minimum total potential energy,
Πmin, under real structural displacement the reasonable choice of the coefficients
k1,
k2 and
k3 minimizes the total strain energy,
U, which leads to:
The coefficients of
k1,
k2 and
k3 are then determined as:
The relationships in Equations (38)–(40) with
k1,
k2 and
k3 in Equations (44)–(46) could also be deduced from the principle of the minimum complementary energy as presented in Equations (47)–(49), indicating the rationality of the linear hypothesis:
Considering Equations (44)–(46) and putting Equations (38)–(40) into Equation (37), the relationship between
u1 and
N in
Figure 6 could be further determined with the intermediate coefficient of
X9:
where:
The part composed of fiber tows in the mesoscale RUC is isolated and studied in
Figure 7. With the left-end constraint the displacement of the loading end reaches
u1 under the total axial tension of 2
N loaded at the cross-sections of the warp yarns with the area of 2
A, corresponding to the result of the single warp yarn segment in
Figure 6.
For the studied part in
Figure 7, define the equivalent modulus along the X-axis as
Ett and
u1 could be expressed as:
Put Equation (50) into Equation (52) and the modulus of
Ett is determined as:
Em stands for the elastic modulus of the matrix and
Vt stands for the volume fraction of the tows in the plain-woven fabric composites. Based on the rule of mixtures, the uniaxial tensile modulus,
E11, of the plain-woven fabric composites could be expressed as:
With the above deductions, the proposed analytical model for the uniaxial tensile modulus of the plain-woven fabric composites is illustrated in
Figure 8. Based on the experimental observations, the necessary geometric parameters of the fiber tows and the RUC, including
a,
b,
rU and
LRUC, are first obtained as inputs. The corresponding cross-section area of
A and the inertia moment of
I are subsequently calculated. Series of experiments including the thermal ablation of the laminates and microscopic observations are needed in order to achieve the fiber volume fraction in tows,
Vf, and the volume fraction of tows,
Vt. Besides, parameters of the elastic modulus of the matrix,
Em, the shear modulus of the matrix,
Gm, the in-plane shear modulus of the fiber,
Gf12, and the longitudinal modulus of the fiber,
Ef11, need to be obtained, with which the longitudinal modulus of
E11(tow) and the out-of-plane shear modulus of
G13(tow) for the fiber tows could be calculated through the Chamis equations:
Subsequently, the intermediate coefficients of – could be achieved and the uniaxial tensile modulus of is analytically solved. Using the platform of an Intel Core i7-9750H CPU, the single run time of the analytical model in calculating is 2 s with the necessary inputs prepared.
5. Application of the Analytical Model and the Experimental Validation
The plain-woven fabric composite of T300/Cycom970 is chosen as the study object in this article and the uniaxial tensile modulus of
E11 is predicted with the method proposed above. The mechanical properties of the T300 carbon fiber and the Cycom970 epoxy matrix [
31] are presented in
Table 1.
Specimens of T300/Cycom970 laminates with a stacking sequence of [0]
16 and dimensions of 25 mm × 25 mm × 3.456 mm are manufactured and scanned first with micro-CT equipment to achieve the necessary geometric parameters. As a carbon fiber/epoxy composite, the similar atomic numbers of the fiber and the matrix in the T300/Cycom970 laminates lead to a small difference in the components’ X-ray absorption rates. In order to solve the blurry imaging problem micro-CT equipment with a high-resolution lens-coupled detector is utilized in the current scanning. A typical Y–Z slice image of the fabric laminate is illustrated in
Figure 9 and the statistical average values of
a,
b,
rU and
LRUC from different samples of sections are presented in
Table 2, together with the corresponding
A and
I.
Thermal ablation experiments have been conducted on the specimens under the ASTM Standard D3171 [
32]-based procedure in order to separate the component of the fiber from the matrix and obtain the total fiber volume fraction of
VfT. The specimens are first weighed with an electronic balance and the initial weight of
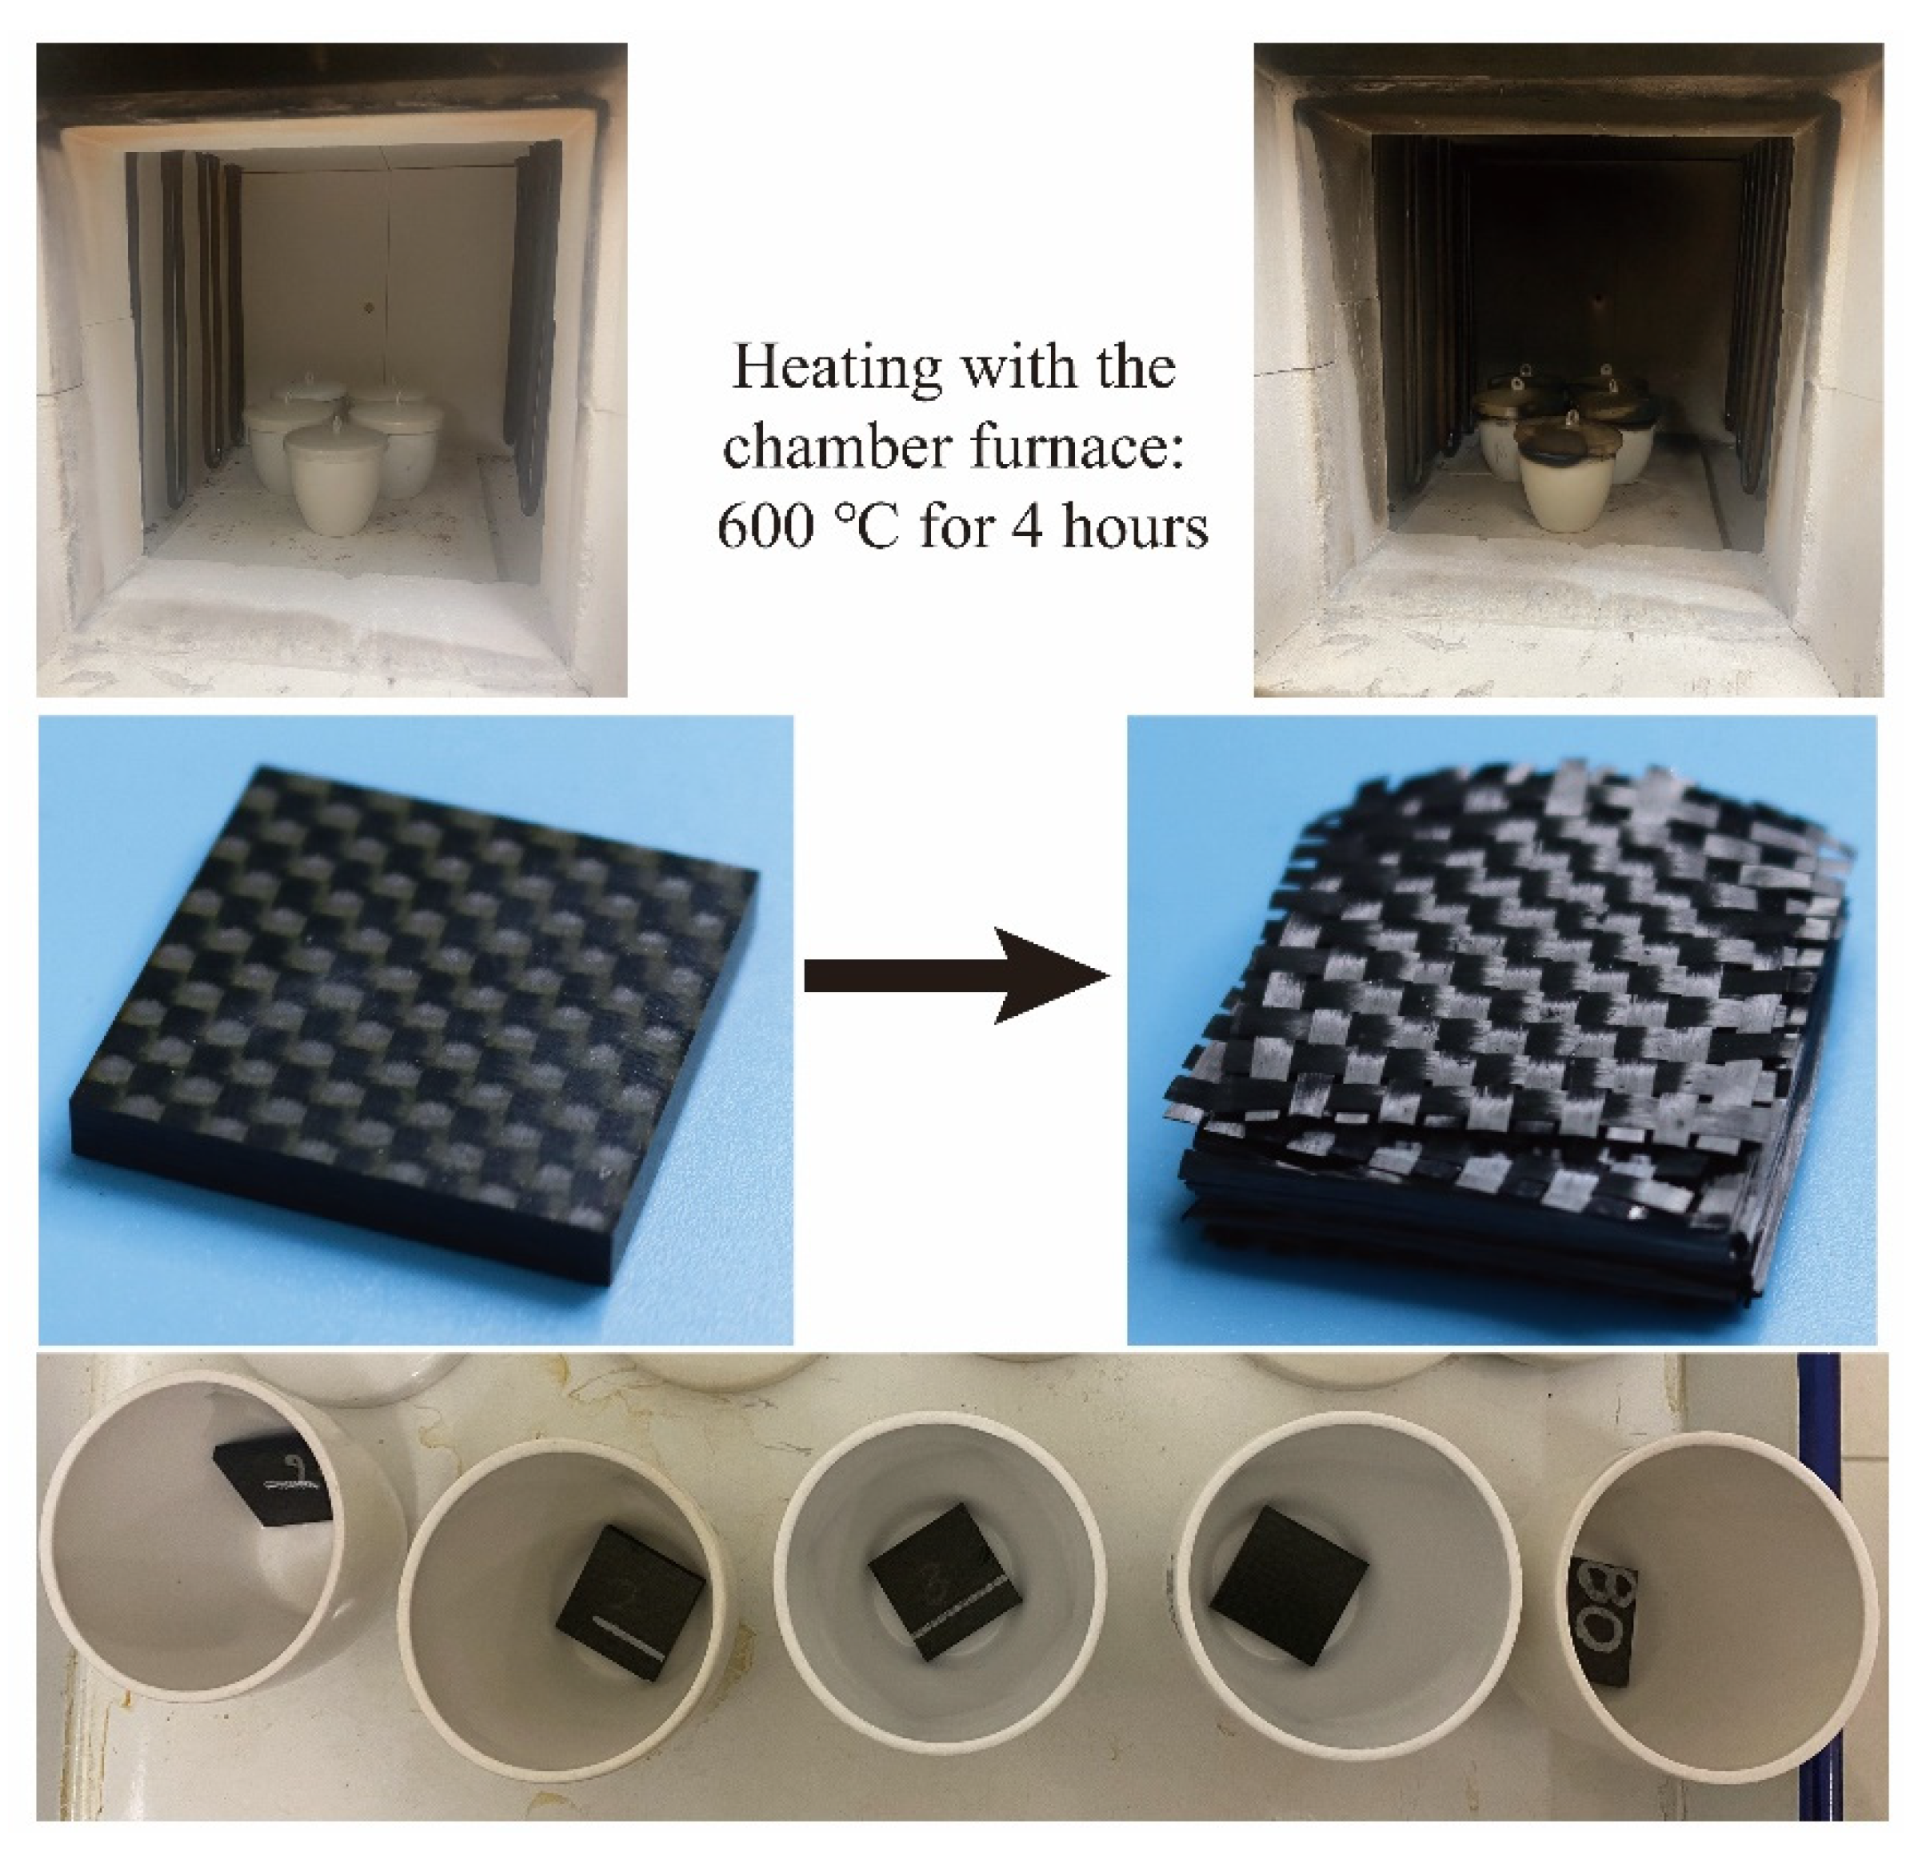
m0 for each specimen is achieved. After heating with a chamber furnace under a temperature of 600 °C for four hours, as shown in
Figure 10, the epoxy matrix component in the specimens is totally ablated and the residual weight of fibers,
mf, for each specimen is recorded. For each of the specimens, with the densities of the matrix (
ρm) and the carbon fiber (
ρf) presented in
Table 1, the total fiber volume fraction,
VfT, of the plain-woven fabric composite could be obtained as:
The results of the thermal ablation experiments on the specimens, numbered one–five, are presented in
Table 3. For the studied composite of T300/Cycom970,
VfT is determined as the statistical average value of the experimental results.
In obtaining the fiber volume fraction in tows of
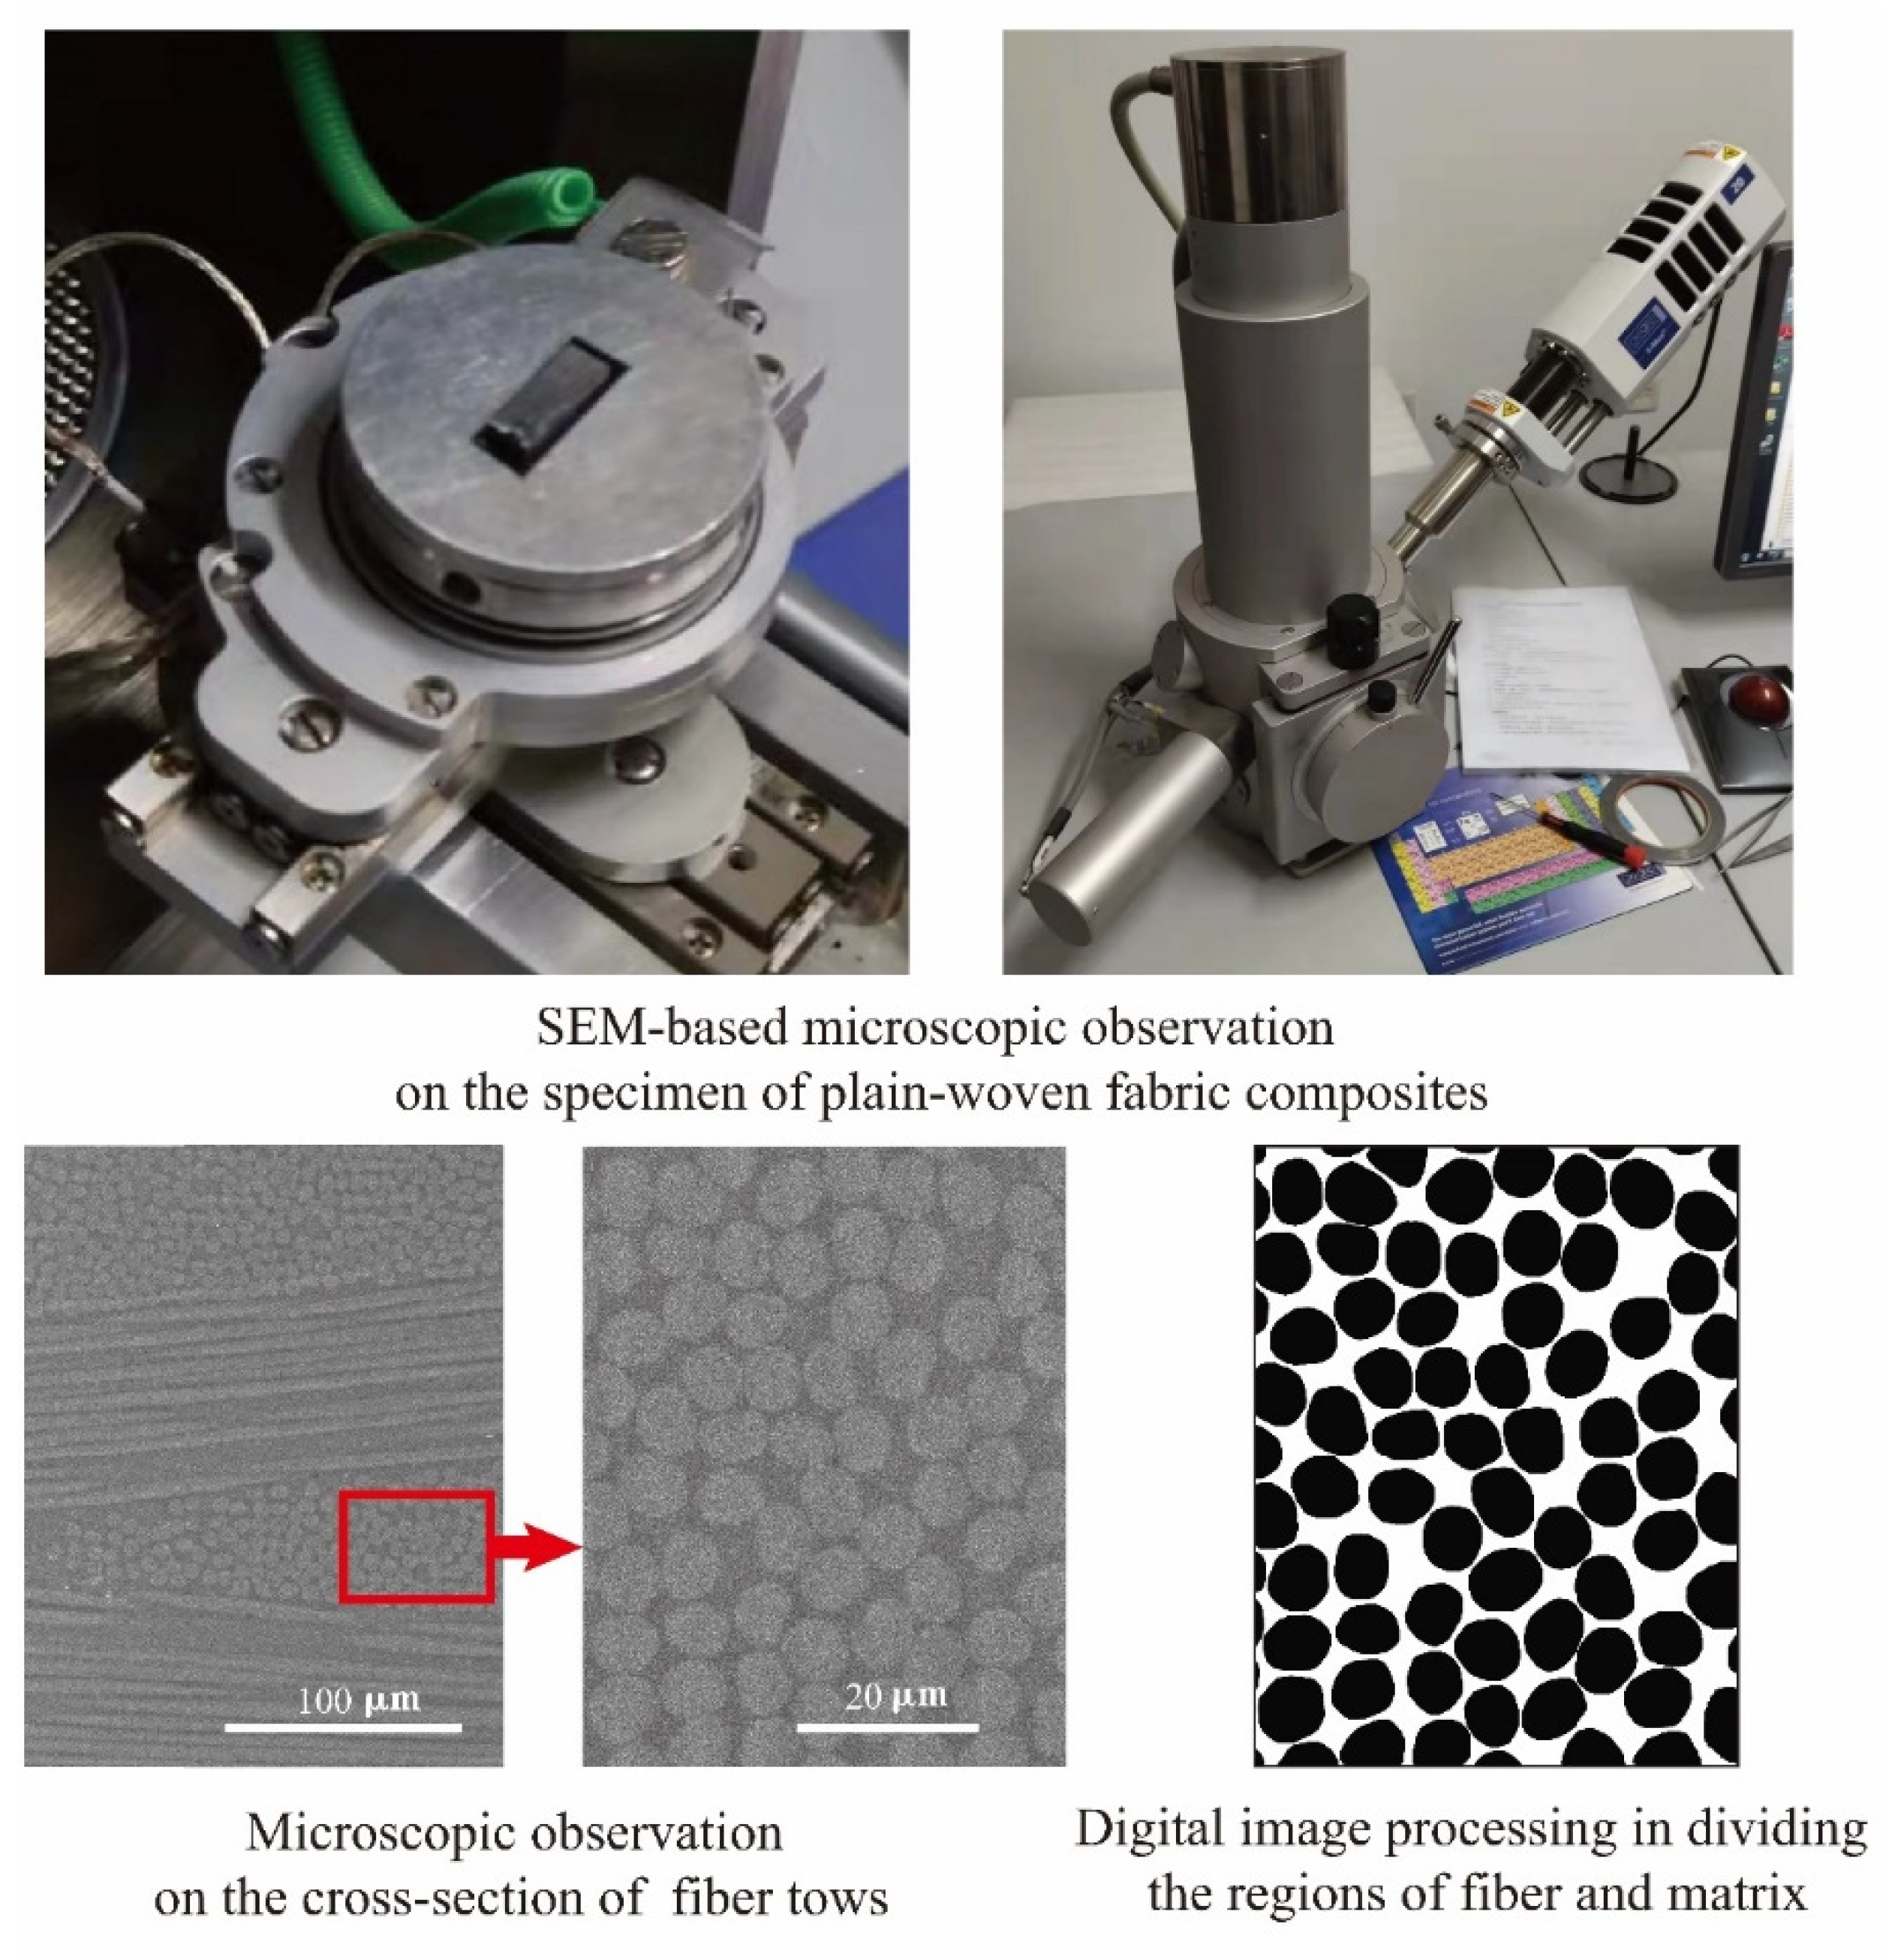
Vf, microscopic observations have been conducted on the plain-woven fabric composites. In order to achieve ideal observation results focused ion beam (FIB) polishing has been conducted on the specimen, and the regions of the fiber tows’ cross-sections are then observed with a scanning electron microscope (SEM), as shown in
Figure 11. Within a fixed observation area the regions of the fiber sections are distinguished from the adjacent matrix regions through further digital image processing of the observation result.
and
, which represent the area of the fibers and the area of the matrix, respectively, are achieved, and the regional fiber volume fraction, which is equal to the area ratio of
, is then calculated. A typical microscopic observation on the cross-section of the fiber tows and the corresponding digital image processing result are presented in
Figure 11, and the value of
for the plain-woven fabric composite is determined as the statistical average value of the obtained different regional fiber volume fractions.
According to the Equation (58) the volume fraction of tows,
Vt, of the T300/Cycom970 fabric composite could be obtained with
VfT and
Vf:
The finally determined values of
,
and
are listed in
Table 4. Based on the fiber volume fraction in tows of
and the constituents’ properties in
Table 1, the calculations of the fiber tows’ mechanical properties based on the Chamis equations are presented in
Table 5.
With the above inputs the intermediate coefficients of
X1–
X9 are calculated according to the flowchart illustrated in
Figure 8, and the result of
E11 for the T300/Cycom970 plain-woven fabric composite is predicted as 54.39 MPa.
Tensile experiments have been performed on the laminates made of T300/Cycom970 plain-woven fabrics. The experimental result is compared with the above prediction of E11 in order to validate the proposed analytical model.
Considering the purpose of validation, the manufacturing process of the composite laminates has been intentionally controlled to enhance the specimens’ consistency and reduce the effects of uncertainty. The specimens with a stacking sequence of [0]
16 and dimensions of 250 mm × 25 mm × 3.456 mm are shown in
Figure 12, which are tested by an electronic universal testing machine with a maximum loading capacity of 100 kN. Six specimens numbered CL-1-01 to CL-1-06 have been tested under the ASTM Standard D3039M-17 [
33]-based procedure. Subjected to tensile loading, the stress–strain curves of the specimens have been achieved, with longitudinal strain results obtained from the strain gages. For two different points on the stress–strain curve, the difference in the applied tensile stress is defined as Δ
σ and the difference between the strains is defined as Δ
ε. Stress–strain data within the lower half of the stress–strain curves are utilized ito calculate the uniaxial tensile modulus of
E11:
In
Table 6 the experimental
E11 of the specimens is listed, along with the average value, the standard deviation and the coefficient of dispersion. The small values of the standard deviation and the coefficient of dispersion indicate the good repeatability of the experimental results. With neglectable effects of uncertainty, the specimens behave well in the aspect of validation. Compared to the average value of the experimental
E11 the calculation result from the analytical model of 54.39 MPa has a deviation of −4.33%. The small deviation validates the effectiveness of the analytical model in predicting the unidirectional tensile modulus of the plain-woven fabric composites and further indicates the rationality of the inputs of the experimentally obtained geometric and mechanical parameters, which could be utilized in the establishment of the composites’ mesoscale RUC.
6. Conclusions
(1) With a solid theoretical foundation and validated by tensile experiments on the laminates, the analytical model based on the energy principles has a small margin of error and a high calculation efficiency. The model provides a new and effective method to predict the uniaxial tensile modulus of plain-woven fabric composites.
(2) The matched experiments were designed to obtain inputs for the analytical model and were conducted to predict the uniaxial tensile modulus of the T300/Cycom970 composite. The experimental procedure provides a reference for the further study of PWF composites’ geometric and mechanical properties.
(3) The proposed analytical model relies heavily on the inputs obtained from experimental methods; the costly experiments limit the wide application of the analytical model to some extent. Besides, the cross-section of fiber tows and the interaction between the warp and weft yarns are simplified in the analytical model for the convenience of the analyses. Although the current margin of error is experimentally validated a more comprehensive and detailed consideration of the fiber tows’ geometric characteristics and internal interactions is still needed in further research.
(4) With the advantages in efficiently validating the choosing of the fiber tows’ geometric and mechanical parameters, the analytical model has good application prospects in guiding the mesoscale modeling of plain-woven fabric composites. In future work the mesoscale RUC will be built on the current basis and multiscale failure analyses could be further carried out on the T300/Cycom970 PWF composite laminates and structures.
