Article

The Impact of Automation on Air Traffic Controller’s Behaviors

1
College of Civil Aviation, Nanjing University of Aeronautics and Astronautics, Nanjing 210016, China
2
System Integration Department, AVIC ATM System and Equipment Co., Ltd., Shanghai 200241, China
3
Institute of Logistics and Aviation, Technische Universität Dresden, 01069 Dresden, Germany
4
OPTIM Lab, Ecole Nationale de l’Aviation Civile, F-31400 Toulouse, France
*
Author to whom correspondence should be addressed.
These authors contributed equally to this work.
Aerospace 2021, 8(9), 260; https://doi.org/10.3390/aerospace8090260
Submission received: 21 June 2021 / Revised: 30 August 2021 / Accepted: 3 September 2021 / Published: 13 September 2021
(This article belongs to the Collection Air Transportation—Operations and Management)

Abstract

:
Air traffic controllers have to make quick decisions to keep air traffic safe. Their behaviors have a significant impact on the operation of the air traffic management (ATM) system. Automation tools have enhanced the ATM system’s capability by reducing the controller’s task-load. Much attention has been devoted to developing advanced automation in the last decade. However, less is known about the impact of automation on the behaviors of air traffic controllers. Here, we empirically tested the effects of three levels of automation—including manual, attention-guided, and automated—as well as varying traffic levels on eye movements, situation awareness and mental workload. The results showed that there are significant differences in the gaze and saccade behaviors between the attention-guided group and automated group. Traffic affected eye movements under the manual mode or under the attention-guided mode, but had no effect on eye movements under the automated mode. The results also supported the use of automation for enhancing situation awareness while reducing mental workload. Our work has potential implications for the design of automation and operation procedures.

1. Introduction

1.1. Background

To ensure the safety of air traffic, air traffic controllers (ATCOs) make traffic control decisions promptly by integrating and analyzing the information acquired from radar screens and other decision support tools (DSTs). Automation generally refers to machines, equipment, or systems under few human interventions that can achieve predetermined goals, such as detecting potential conflicts between aircraft, through data processing, analysis, and manipulation under preset procedures [1]. With the advancement of information technology and data science, various types of automation tools have been applied in the air traffic management (ATM) field. For example, AMAN (arrival manager) and DMAN (departure manager) are two commonly used DSTs that provide optimized flight sequences to approach controllers [2]. As a human-center complex system, ATCOs still play a vital role, even though automation could change their role from managing air traffic to monitoring and supervising system operations. The consequences of relying on automation tools in ATM are twofold. On one hand, automation can alleviate ATCOs’ taskload by taking over their routine tasks, and thus enhance the performance of the system. On the other hand, potential conflicts could happen when automation fails to function as planned. For example, the workload of ATCOs will suddenly increase when the radar control system is shut down. They have to manage air traffic, using procedure control, under which the position of the aircraft is estimated through ATCO’s mental calculation. Mid-air collisions may happen. Another consequence could be complacency by air traffic control professionals [3]. For example, a complacency effect was reported in [4] that the detection of a particular conflict by the air traffic controllers under manual conditions was 15.56% higher than under automation conditions when automation tools failed to detect the conflict. Questions that emerge from academia and the engineering field on the cost–benefit trade-off between ATCOs and automation attracted much attention from psychologists and other researchers. Understanding the effects of automation on ATCOs’ behavior is critical for both engineering and academic fields, and most importantly, for aviation safety [5].
Although repetitive and non-critical tasks can be transferred to automation, ATCOs have to maintain their current assessment of rapidly changed air traffic [6]. Their decisions rely upon (i) the information acquired from various sources, and (ii) their mental model of situation. In fact, situation awareness (SA) has been at the center of human factors research in aviation for decades [7,8,9]. Despite studies being carried out to understand how automation could affect ATCOs’ behavior, sound evidence for this subject is still lacking. This study aimed to empirically test the effects of three levels of automation on eye movements, workload, and situation awareness. In addition, we wished to explore how traffic may affect ATCOs’ behavior under different levels of automation.

1.2. Related Work

1.2.1. Eye Movements

An enormous effort by cognitive psychologists and neuroscientists has been made toward understanding ATCOs’ eye movements. These studies implicitly or explicitly assume that eye movements, as an information-seeking behavior, is closely related to workload, conflict detection, and performance. Eye movements data were recorded and analyzed to identify their relationships with workload. For example, Ahlstrom et al. studied the correlation between eye movements and the ATCO workload. They investigated the relationship between ATCO saccades, blink frequency, pupil diameter, and air traffic flow [10]. The results showed that the use of DSTs in supervision work can reduce the ATCO workload. Tokuda studied the relationship between saccadic intrusion and workload [11]. It is found that saccadic intrusion was closely connected to the workload. The correlation coefficient between the workload and saccadic intrusion was up to 0.84. In another study, Stasi set up three tasks with different levels of difficulty in a simplified control simulation experiment to study the relationship between workload and saccade [12]. The results showed that the increase in workload led to an increase in response time and decrease in peak saccade speed. Muller et al. found that the value of pupil restlessness gradually increased when the workload increased. However, the value of pupil restlessness cannot be used as a workload indicator when workload reaches a certain threshold [13]. Imants et al. studied the relationship between eye movement indicators and task performance [14]. They found that the saccade path, saccade time, and gaze duration of different ATCOs were significantly different when performing surveillance, planning, and control tasks.
There are few studies on the investigation of ATCOs’ eye movements in conflict detection tasks [15,16]. Kang et al. investigated visual search strategies and conflict detection strategies used by air traffic control experts [15]. Based on the collected data, the saccade strategies were classified into five categories, while the strategies for managing air traffic were classified into four groups. Marchitto et al. studied the impact of scene complexity on the ATCO’s workload in conflict detection tasks [17]. Results suggested that ATCOs tended to use more gaze and more saccades in the conflict scenes than in the conflict-free scene.
In another line of research, research effort was devoted to the understanding of relationships between eye movements and human performance. For instance, Mertens et al. collected ATCOs’ eye movements data, including gaze, saccade, and blink, to investigate how effectively display cues can reduce human errors [18]. It was found that the ATCOs’ attention was mainly concentrated in areas with dense traffic, especially those aircraft which have just entered the sector. To improve ATCO’s performance, they suggested that the latest aircraft entering the sector can be marked with color, flashing, or other prompts, to attract ATCOs’ visual attention. Meeuwen et al. studied the visual search strategy and task performance of ATCOs of three levels of expertise: novice, intermediate, and expert [19]. Performance results showed that experts used more efficient scan paths and less mental effort to retrieve relevant information. Wang et al. studied the effect of working experience on the ATCOs’ eye movement behaviors. The results showed that working experience had a notable effect on eye-movement patterns. Both fixation and saccades were found to be different between qualified ATCOs and novice [20].
The extensive discussions on the eye movements in air traffic management domain demonstrated that ATCOs’ visual searching behaviors are closely related to their mental workload, conflict detection strategies, and task performance. Notable differences on the eye movements indicators can be found among ATCOs with levels of expertise, or working experience. However, few works can be found in the literature that focus on the levels of automation on ATCOs’ eye movements.

1.2.2. Classification of the Levels of Automation

Levels of automation (LOA) generally refers to the degree to which a task is automated. The definition of LOA specifies the roles and responsibilities of human and machine in a complex system. Sheridan et al. in [21] proposed the standards for classifying the levels of system automation. They divided system automation into ten levels ranging from 1 to 10, and described the main functions of the automation at each level accordingly. A higher level indicates higher automation with less manual intervention. Fitts et al. proposed the concept of the automation phase. They divided the automation phases into four sub-phases: information filtering, information integration, decision making, and implementation [22]. Parasuraman et al. developed a model for selecting appropriate types and LOA for a system [23]. Four types of functions in a system are proposed, namely information acquisition, information analysis, decision and action selection, and action implementation. Automation can be applied within each type from low level to high level. It is suggested that the selection or design of automation level can be mainly based on human performance consequences, automation reliability, and the costs of decision/action consequences.
In the field of autonomous driving, the National Highway Traffic Safety Administration (NHTSA) proposed a set of classification standards for self-driving cars with four LOA in 2013. Later, the Society of Automotive Engineers (SAE) proposed a set of self-driving car classification standards building up on the NHTSA’s standards. The SAE divides autonomous driving into five levels: driving support, partial automation, conditional automation, high degree of automation, and full automation [5].

1.2.3. Situation Awareness

Situation awareness (SA) is recognized as a critical foundation for humans making correct decisions in a complex and dynamic environment. According to Endsley [24], situation awareness is defined as “the perception of the elements in the environment within a volume of time and space, the comprehension of their meaning, and the projection of their status in the near future”. Wickens et al. [9] described situation awareness as follows: the operator obtains relevant situational information from the system and environment, assesses the overall situation based on his/her understanding and knowledge, and then adjusts the methods of information acquisition and prejudges the future situation. Similarly, situation awareness is referred to as a cognitive process in which operators observe, understand, predict, and control the status and future trends of systems and environments [25]. Situation awareness is also considered to be a comprehensive analysis and understanding of various information in the task, as well as a cognitive process of predicting its trend [26]. Here, we define situation awareness as a complete progress that the operator observes and obtains relevant information from the system and environment, integrating this progress into a complete representation, and then make future information acquisition plan in order to predict the system’s state.
Several pioneering studies on situation awareness in air traffic management can be found in [27,28]. Reports suggested that ATCO relied on situation awareness to detect and resolve conflicts. Meanwhile, the levels of situation awareness were positively correlated with the ATCO performance. ATCOs tended to make more mistakes when they had lower situation awareness [28].
There are four commonly used methods to assess situation awareness: subjective measuring, physiological measurement, performance assessment, and memory probing [29]. Subjective measuring will take place once the subject completes the tasks. The subject assesses his/her SA by self-assessment. The Situation Awareness Rating Technique (SART), originally developed for the assessment of pilot SA, is widely used in various fields. The participant is required to rate each of the ten dimensions of SA based on performance and task. It is a simplistic post-trial subjective rating technique. Physiological indicators have been widely proposed to measure human workload. They are rarely used to assess situation awareness. Vidulich [30] set up a flight experiment and collected the electroencephalography (EEG) data of the subjects. They found that the activity of α -wave decreased, and θ -wave increased when the subject was experiencing lower SA. Few studies have shown that situation awareness can be inferred through EEG, event-related potential (ERP), heart rate variability (HRB), and skin conduction level (SCL) [31,32]. A recent review on the physiological measures of SA reports the general findings on the studies that investigated the correlations between physiological measures and situation awareness [33]. It was found that eye movements measures and EEG are commonly reported to have correlations with SA. The other measures, for example cardiovascular indicators, generate mix results.
The performance assessment method is to assess the situation awareness based on the performance of the subject during the experiment. The advantages of this method are low cost, objective, less influenced by the exogenous factors, and no requirement for additional space, while the disadvantage is that it may be influenced by the stress, workload, and arouses of the subjects [32]. In a memory-probing method, the subject is asked to report the memorized content of the experiment as well as its correctness and completeness, which is used to assess the situation awareness.
1.3. Research Gap and Contributions

Taken together, findings in human factors studies in air traffic management reveal the differences in eye movements, situation awareness, and mental workload among ATCOs with different levels of expertise. Eye movements, mental workload, and situation awareness are all related to the fundamentals of air traffic control, i.e., detecting and resolving potential traffic conflict to provide a safe and orderly flow of aircraft traffic. Both the Joint Planning and Development Office in the U.S. and EUROCONTROL in Europe have initiated research projects to investigate how automation impacts human roles in future air traffic management systems [34,35]. However, less work has been found on the understanding of air traffic controller’s behaviors in detail under different levels of automation.
In our contribution, we seized the ideas of data-driven science and set up a demonstration case to investigate the impact of automation on the controller’s eye movements, situation awareness, and mental workload. Therefore, we introduce our experimental setup in Section 2. A simplified air traffic control simulation tool is developed to be able to simulate three levels of automation. Furthermore, we provide information about the participants, the equipment, and the experimental design. In Section 3, we analyze the results of the test performed with respect to eye movements, gaze duration, number of fixations points, gaze and conditional entropy, saccade, situation awareness, and mental workload. Discussions are provided in Section 4. Finally, the paper closes with conclusions and suggestions for further research.

2. Methods

2.1. Experiments

2.1.1. Simplified Air Traffic Control Simulation Tool

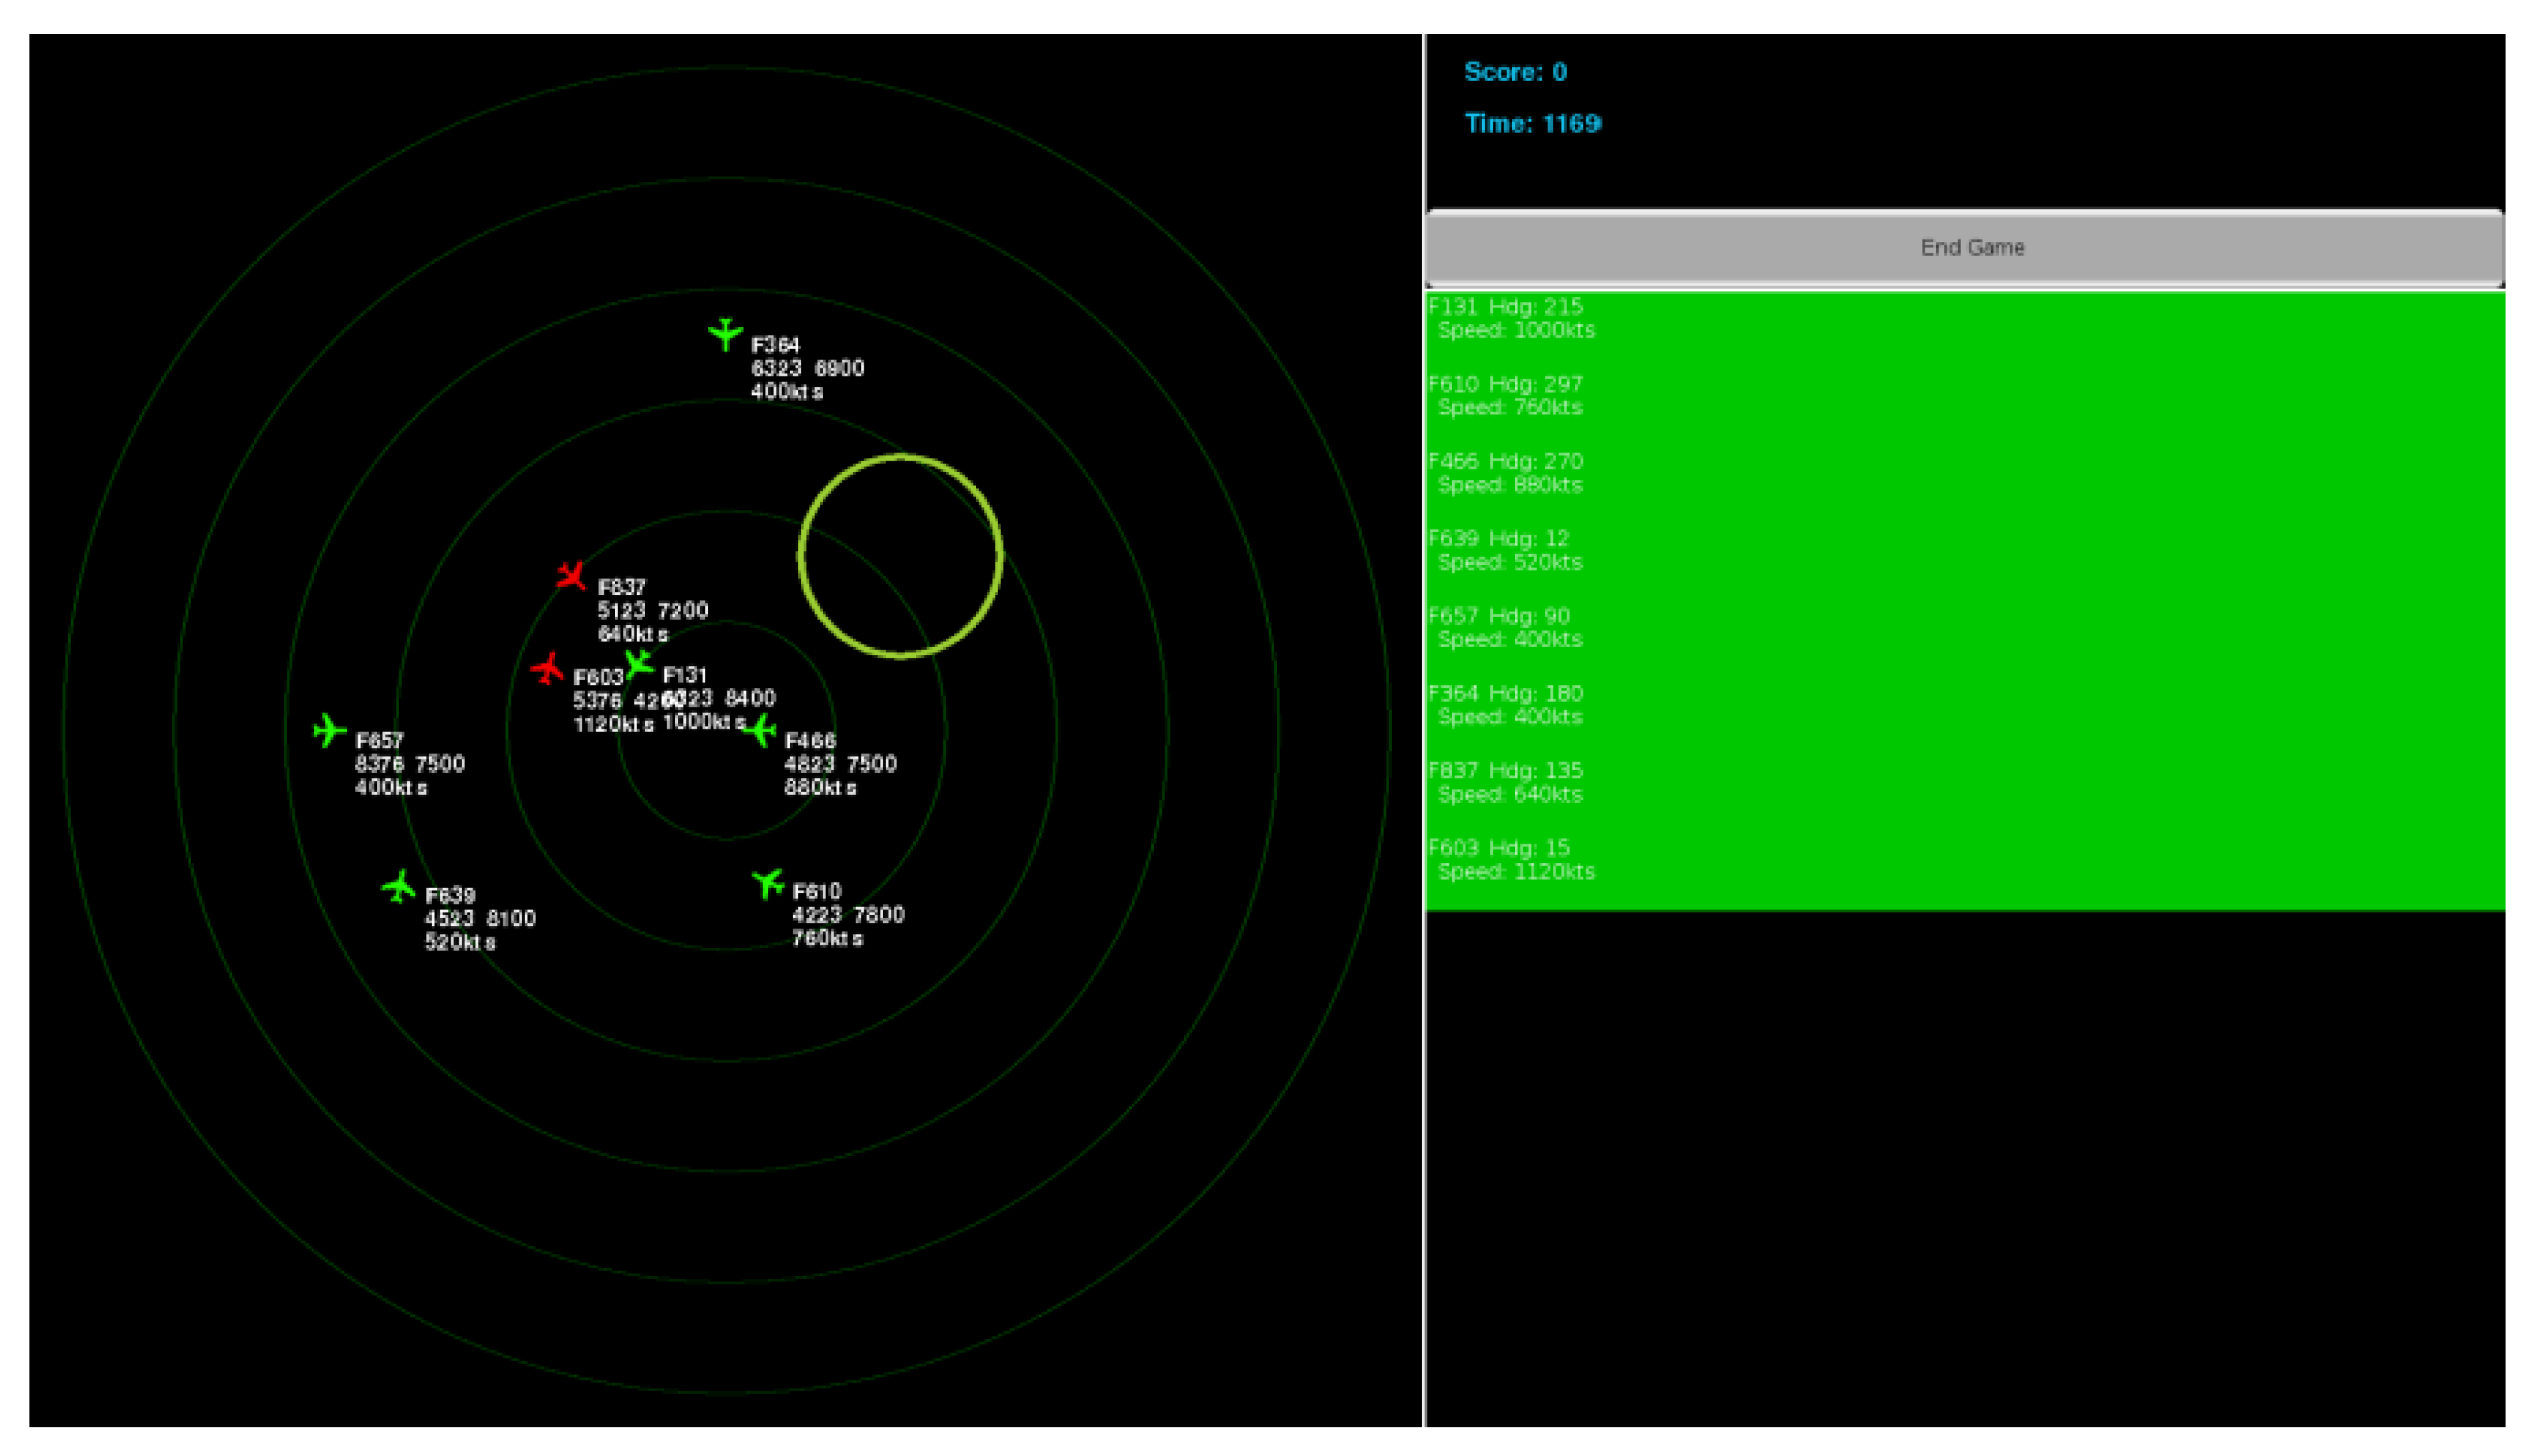
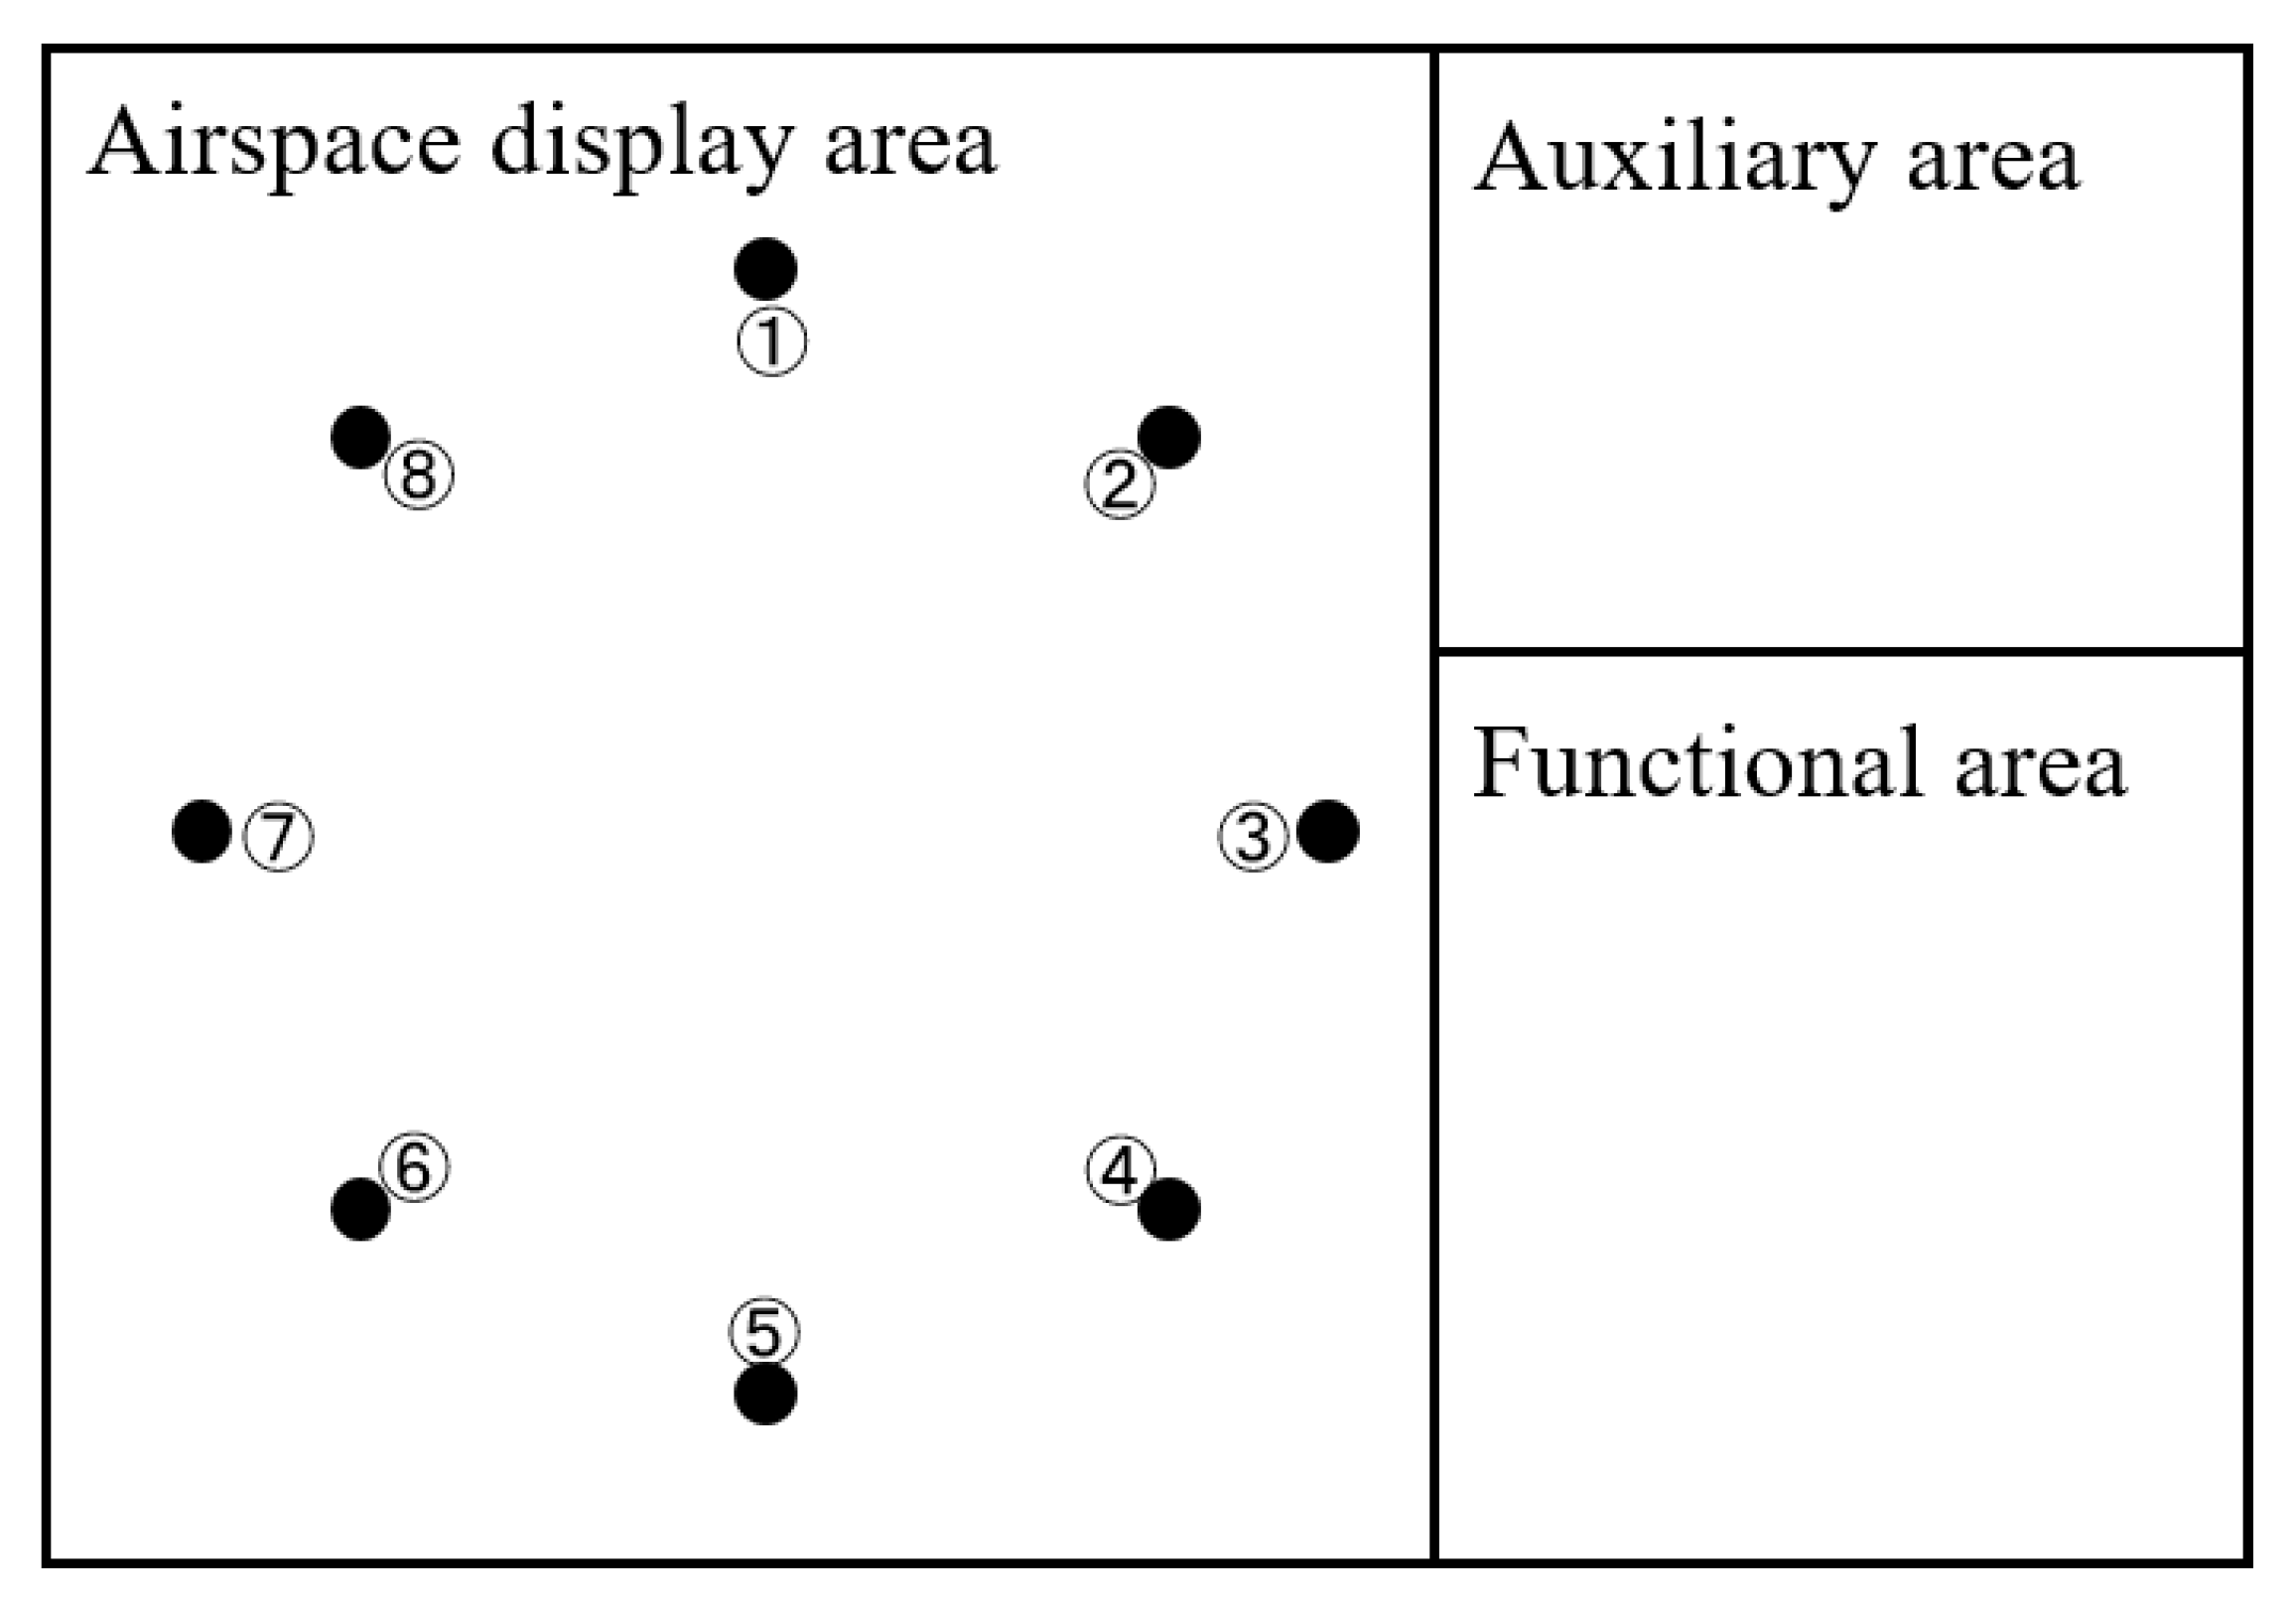
A simplified air traffic control simulation platform was developed using Python. Three levels of automation can be simulated in this platform-manual, attention-guided, and fully automated. Figure 1 shows the layout of the interface. The whole space is divided into three parts. The left part is the main area showing the airspace structure and air traffic. The information of each aircraft is displayed in the radar tag, including the call-sign, speed, target flight altitude, and current flight altitude. Points 1 to 8 are the locations where the aircraft appears and enters the airspace. The upper right serves as displaying the time and score. A subject is able to see how long the simulation has been running. Based on the purposes of the simulation, the subject may be scored automatically in real time. For example, the score is based on how many aircraft have landed or taken off. The score function was not used in this study. The lower right is the functional area showing a list of aircraft with the speed and heading. During the simulation, the heading and the speed of an aircraft can be adjusted either in the airspace display area or in the functional area.
The functional area was designed for other purposes that were not investigated in this study. For example, it served as a list of “strips” that air traffic controllers have used during procedure control. We can simulate the situation in which the radar system is out. There is no aircraft showing in the airspace display area. However, aircraft information is still available in the functional area.
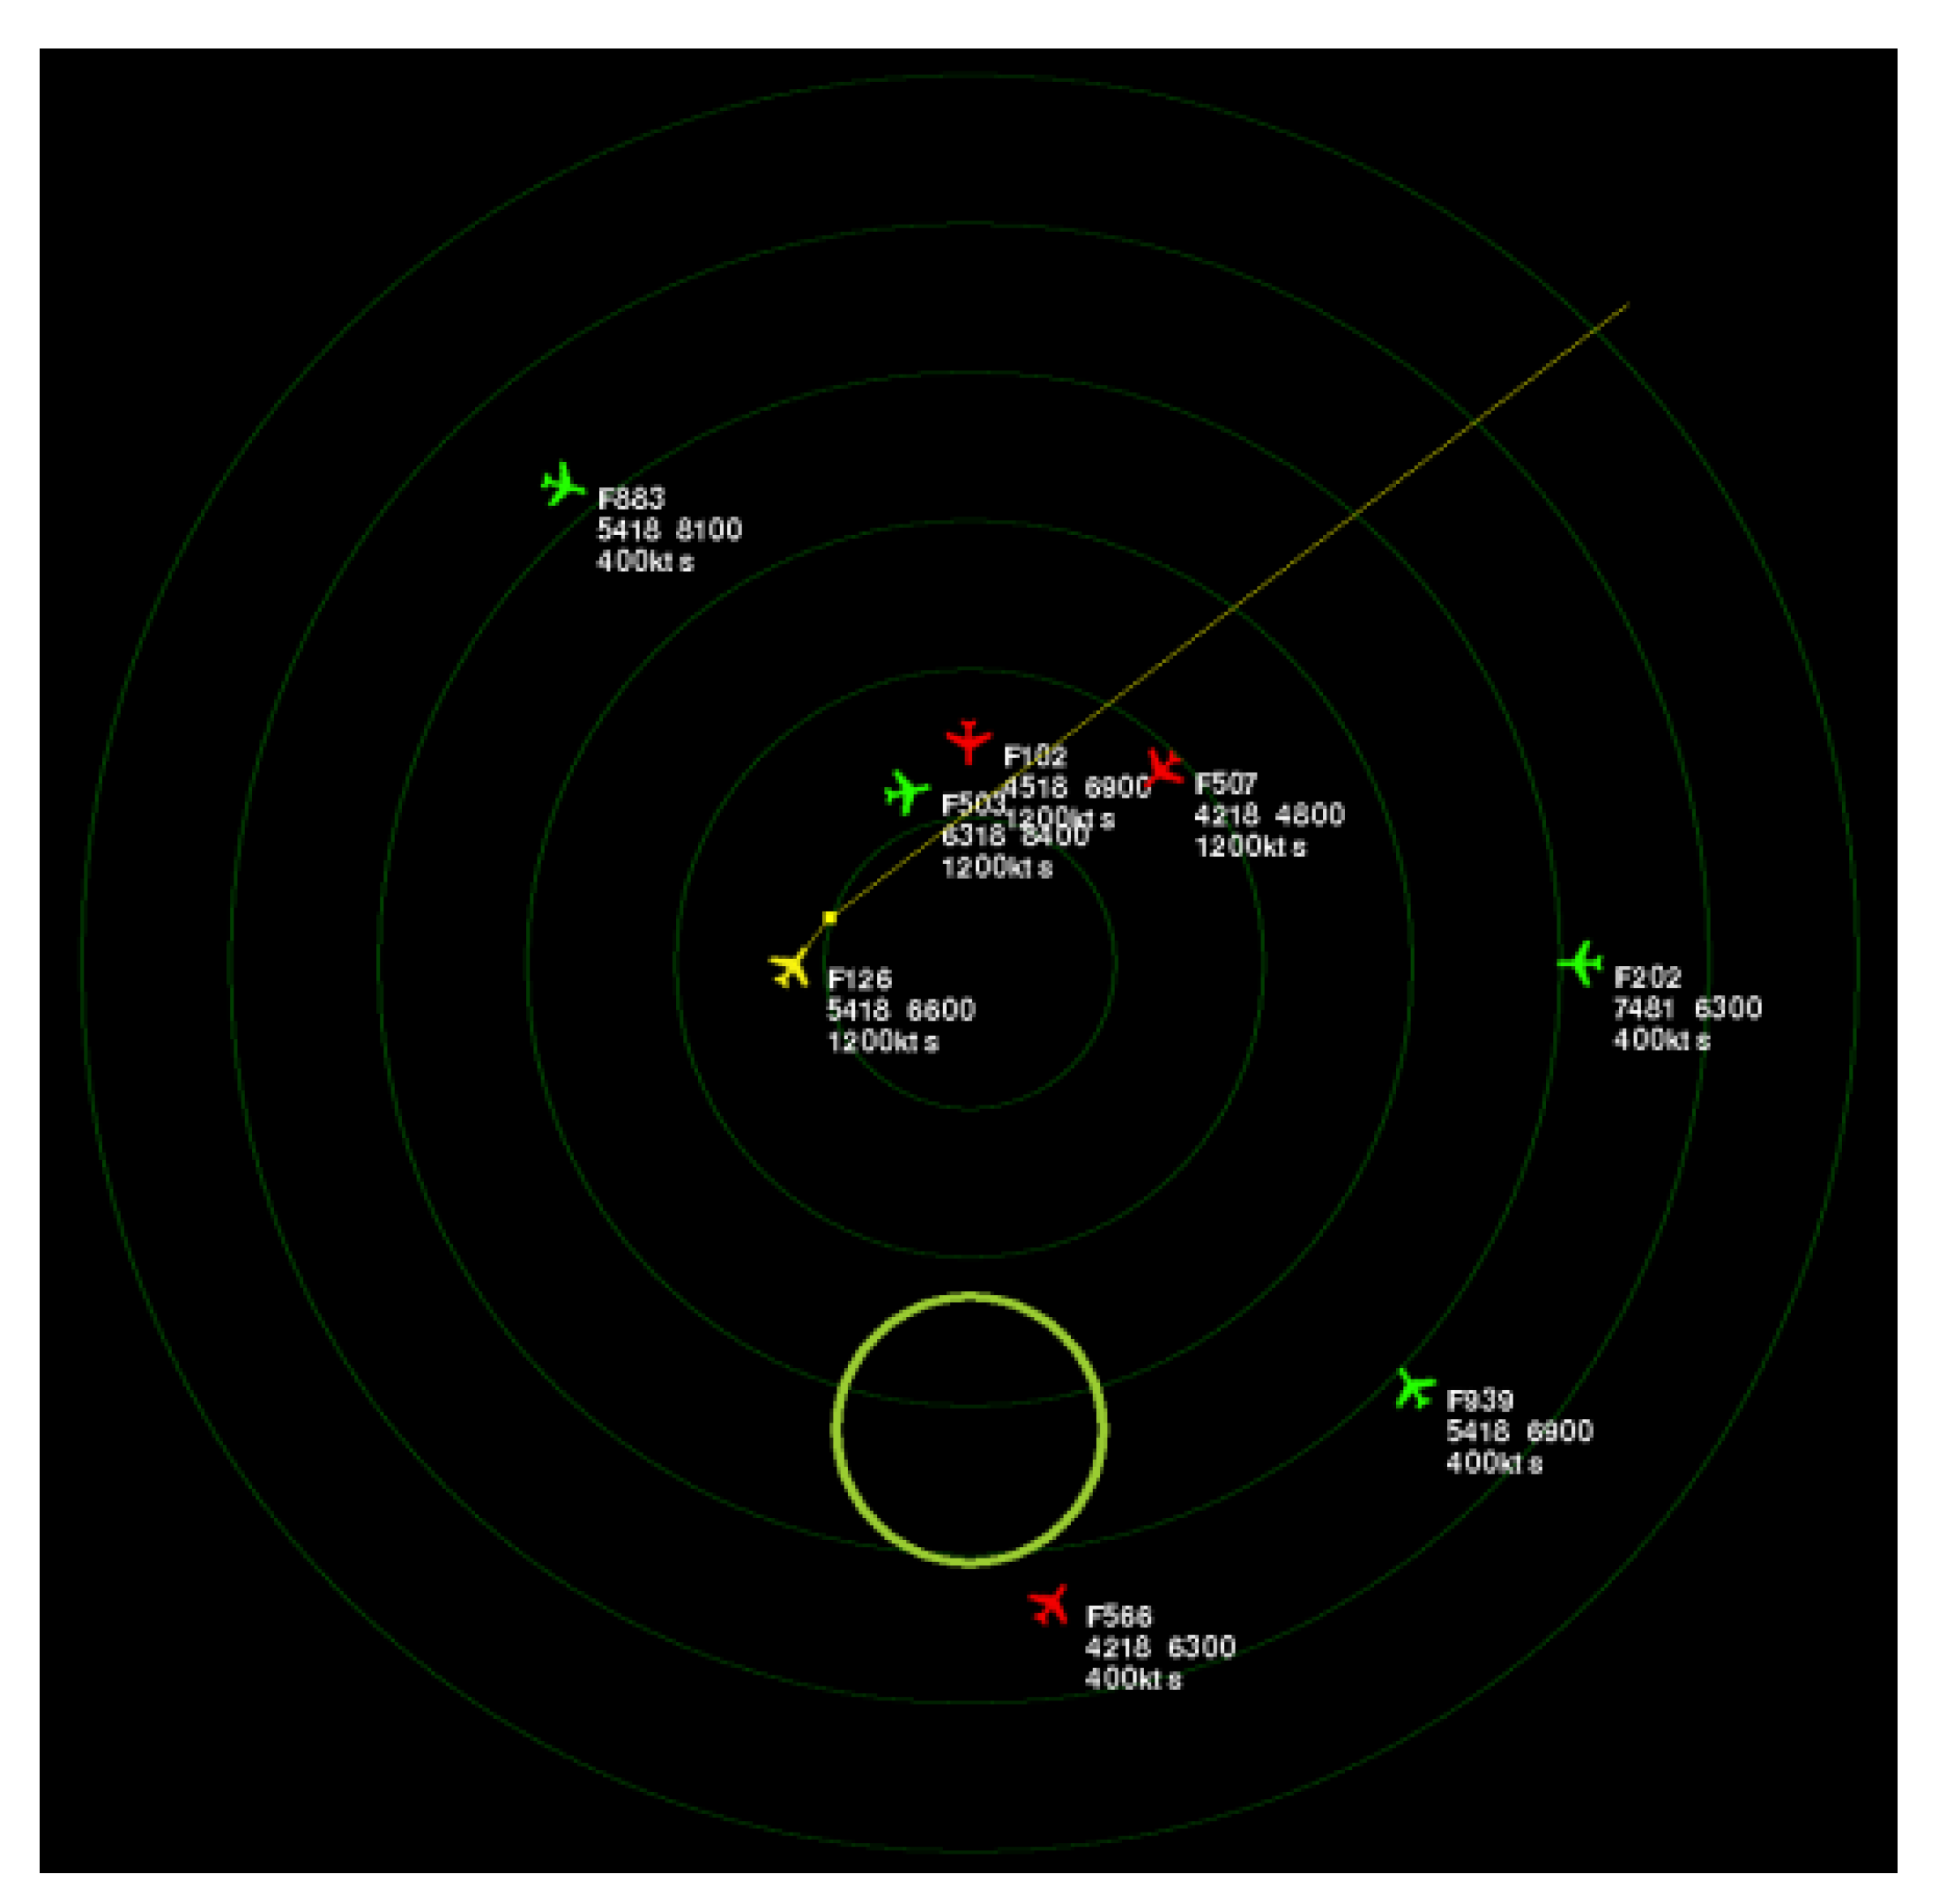
The experiments were set up to capture the core skills required for a qualified ATCO. Similar to real air traffic control, the participants had to monitor traffic and made control decisions promptly in order to avoid conflict (see Figure 2). If the horizontal distance between two aircraft is less than 10 km and the vertical distance is less than 300 m, then there is a conflict. One can change the heading or the speed of the aircraft to avoid a potential conflict. Additionally, a green circle represented as the danger zone was designed in order to increase the complexity of the task. If an aircraft enters this zone, there is a conflict.

2.1.2. Levels of Automation

In this work, we set up three levels of automation-manual, attention-guided, automated. A snapshot of the interface is shown in Figure 3. The differences between the three modes are presented in Table 1. There was no decision support information provided in the manual mode. The manual mode corresponds to the days of air traffic control when the radar screen only provided traffic information. In the attention-guided mode, conflict detection was automatically performed. If a potential conflict is detected, the relevant aircraft will turn red. The computer makes continuous beeps to alert the participant. The conflict has to be resolved manually through changing the aircraft’s heading or speed. Most of air traffic control systems have the function of conflict detection. Visual and auditory aids are provided to the controllers as well. While in the automated mode, the control task was transferred to the system. Participants had to monitor the traffic and system. Conflict detection was available, but the system resolved the conflict automatically. However, the participants had to maintain situation awareness in the case that the conflict resolution function did not work. We set a very small probability (≤0.01%) that the system downgraded to attention-guided mode. Participants had to resolve conflicts manually when necessary.

2.1.3. Levels of Traffic

According to Durand [36], it is difficult to solve the problem of a cluster of conflicting aircraft. Even if we can model the trajectory minimization by a convex function, the search space in the horizontal space is divided into so many components that would require a local search for a solution. For a conflict involving n aircraft, there may be 2 n ( n 1 ) 2 different components in the free trajectory space. It is suggested that any method requiring exploring every connected component is NP-difficult [37]. Moreover, the number of potential solutions in the solution space grows exponentially. For n = 3 aircraft, there are 8 potential options; for n = 6 , the number of potential solutions goes up to 32,768. Therefore, we set up three levels of traffic under each automation mode, which consists of 3, 6, and 8 aircraft, respectively.

2.1.4. Participants

A critical step in the design of research that involves human subjects is the determination of the sample size. An undersized sample would introduce fewer non-sampling errors and could not produce useful results, thus resulting in a waste of resources. On the other hand, an oversized sample may lead to unnecessary costs and may expose subjects to harmful intervention [38]. The number of subjects in the studies of air traffic controller’s behaviors varies depending on the research purposes. For example, the numbers of participants involved in the eye movements research are typically around 10 or 20 (e.g., 6 subjects in [10], 11 in [16], 17 in [39], 19 in [40], 25 in [15,20]). Based on these previous studies, we chose our simple size within the range of [ 10 , 20 ] . We recruited 8 college students through announcements in a mandatory course for senior students majoring in air traffic control. Additionally, six air traffic controllers from the East China Air Traffic Management Bureau were also invited to participate in this study. Participants were paid based on their performance. Every time the participant failed to resolve a conflict, he or she would lose one point (for example, 1 pt ≈ USD 1). In this way, we hoped participants could take this simulation seriously. The information of all the subjects is shown in Table 2.

2.1.5. Equipment

The faceLAB5.0 by Seeing Machines was used to collect eye movements data. The Biofeedback Xpert biofeedback instrument BFB2000 was used to collect heart rate, skin electricity, skin temperature, and myoelectricity data. After each experiment, the participant was required to fill two forms, the 3D-SART situation awareness scale form, and the NASA-TLX workload scale form(see Section 2.4 for further details).

2.1.6. Design

Two factors served as independent variables in this work: levels of automation and levels of traffic. Nine scenarios were prepared, using a 3 × 3 fully crossed, within the subjects design. Each participant started with the first set of scenarios under manual mode, followed by the second set of scenarios under attention-guided mode, then the third set of scenarios under automated mode. In each set of scenarios, traffic was prepared in the order of 3 aircraft, 6 aircraft, 8 aircraft. There was a five minute break between the scenarios, providing enough time for the participant to finish the 3D-SART and NASA-TLX forms. The design of our experiments aimed to take participants progressively further “in-of-the-loop”.
Specifically, the experiments were carried out as follows:
Step 1: The participant was asked about his/her physiological conditions before simulation started. The content, operation, and purpose of the simulation was introduced;
Step 2: The participant sat in front of the screen, and adjusted the seat to his/her own comfort;
Step 3: Eye tracking and BFB2000 devices were calibrated before starting the experiment;
Step 4: The subject was required to be familiar with the simulation tool.
Step 5: The simulation began. Eye movements data, heart rate variability (HRB), and skin conduction level (SCL), and EEG data were recorded;
Step 6: The simulation was stopped. The participant completed the NASA-TLX form and 3D-SART form.
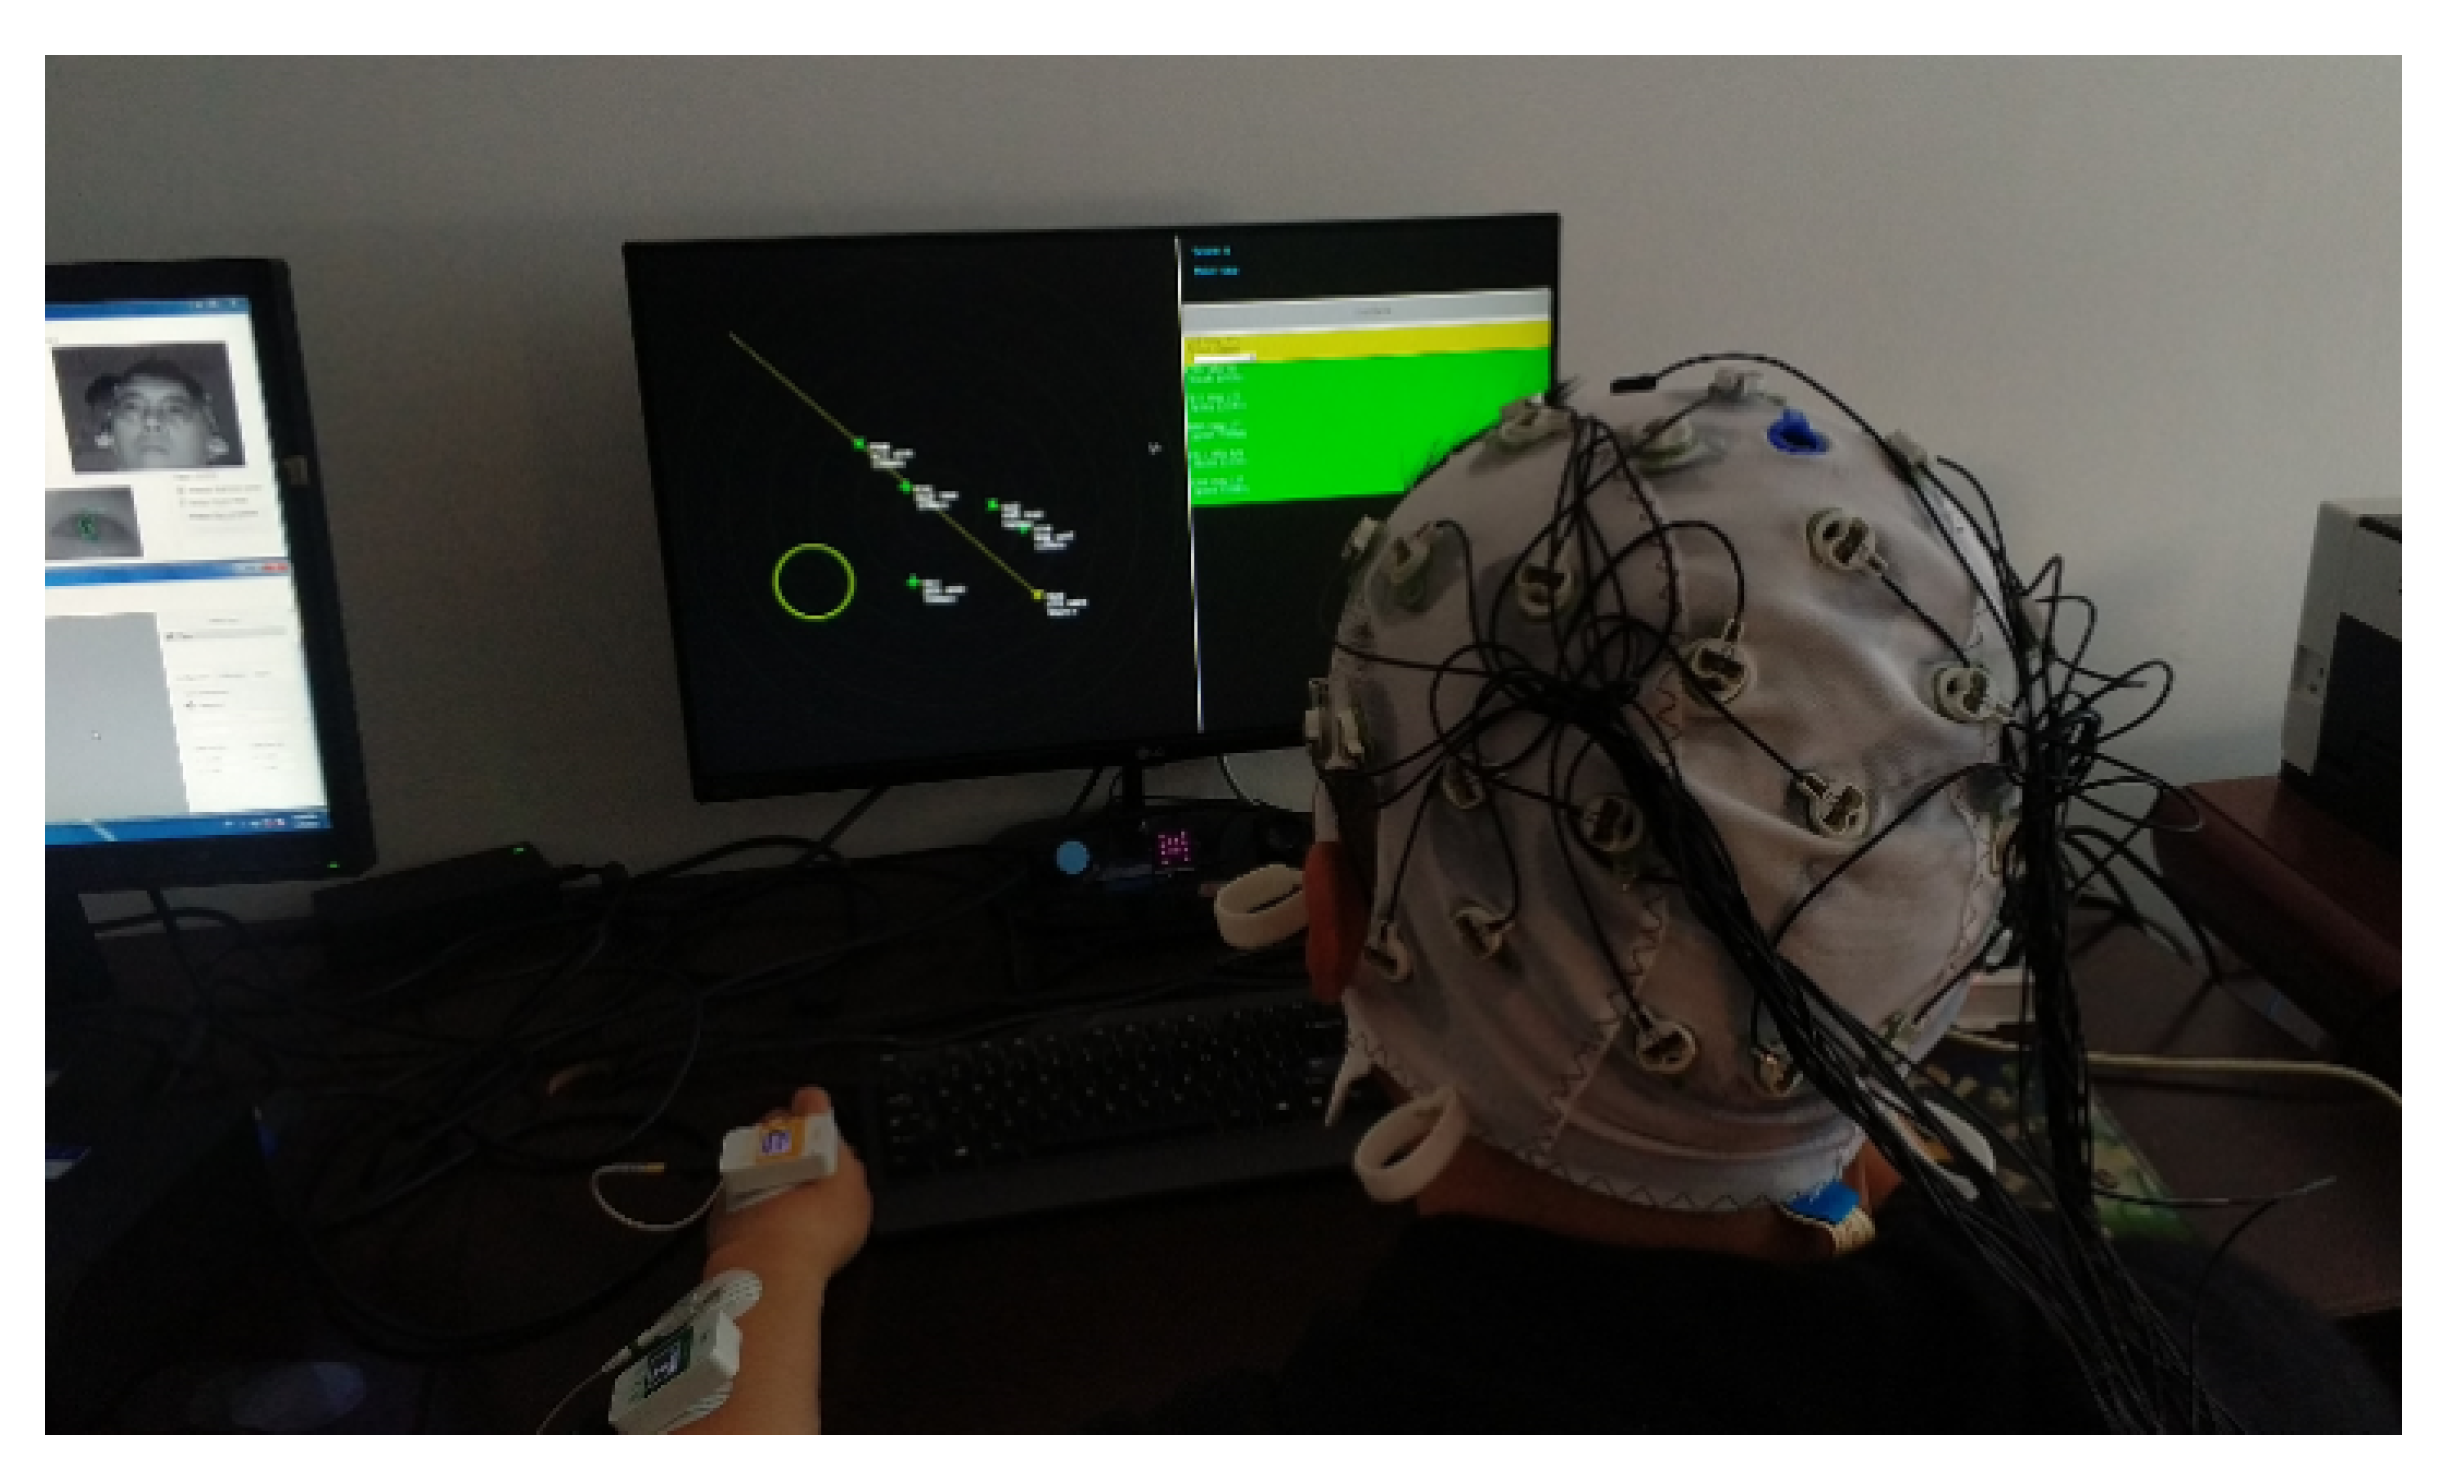
Figure 4 shows a participant during a simulation exercise. The presented study only focuses on the eye movements and subjective measurements, while the EEG and cardiovascular data are reported in a separated study.

2.2. Eye Movement Metrics

Following the work in [41], here, we focused on two types of eye movements: gaze and saccade. The gaze duration, fixation points, gaze entropy, and conditional entropy were computed and analyzed to study the gaze behavior. The saccade duration and the average saccade were studied to understand the saccade behavior. Detailed definitions were given in Table 3.

2.3. Gaze Entropy and Conditional Entropy

2.3.1. Gaze Entropy

The concept of entropy originally originated from thermodynamics and was later introduced into the field of information by Shannon to describe the degree of information confusion [42]. A general formula to calculate entropy for discrete spaces is given as follows:
H ( x ) = i = 1 n ( p i ) · log 2 ( p i )
where p i is the probability that the collected gaze data falls on position i. Given its definition, H ( x ) is greater than 0. Gaze entropy (GE) measures the distribution of a subject’s gaze points and gaze duration. A larger value of H ( x ) indicates that (i) the gaze range is wider, and (ii) the gaze distribution is more chaotic. It suggests that the subject’s attention is distributed into a larger space. Studies on gaze entropy can be found in health care, psychology, transportation, and the human–computer interaction. For example, some scholars found that doctor’s gaze entropy was higher in emergency situation; in contrast, Diaz-Piedra et al. [43] found that pilots’ gaze entropy was lower in emergency missions. The contradictory behavior of gaze entropy between the doctors and the pilots could be explained by the fact that fighter pilots have specified procedures in emergency situations, while medical conditions are unpredictable and complicated, and thus, the doctor’s gaze entropy is higher in emergency situations.

2.3.2. Conditional Entropy

Although entropy indicates the uncertainty of a given random variable, most processes in nature are not completely random or fully predictable. The previous output of a given system may affect the selection of the next input, meaning that the next input depends on the previous output. The statistical characteristics of these processes can be approximated by the Markov matrix of order 1 to n [42]. The zero-order or stationary distribution represents the overall probability that each state is occupied, and the transition distribution represents the rate of changing from one state to another. The conditional gaze entropy (CGE) is given by the following:
H C G E ( x ) = i = 1 n p i j = 1 n p ( i , j ) log 2 p ( i , j )
in which H C G E is the uncertainty of the prior state of the known x. p i represents the steady-state distribution, and p ( i , j ) represents the probability of shifting from the fixation point i to the fixation point j. Higher conditional entropy indicates a more disordered gaze behavior. The difference between gaze entropy and conditional entropy is that the gaze entropy calculates the distribution of the overall fixation in an experiment, while the conditional entropy examines the relationship between the previous fixation and the next fixation.

2.4. 3D-SART and NASA-TLX

2.4.1. 3D-SART

The 3D-SART scale is widely applied to measure situation awareness. The original ten dimensions of SART measures are grouped into three dimensions: attention resource demand, attention resource supply, and understanding of the current situation [44]. Table 4 provides the descriptions of the three dimensions.
The following equation is then used to evaluate SA:
S A S = U d ( D e S u )
where S A S is the score of situation awareness; U d is the understanding of the current situation; D e is the score of the attentional demand; and S u is the score of the attention resource supply. A higher score indicates higher SA.
In our study, we used 3D-SART rather than the 10D-SART on the basis of the following considerations. First, the 3D-SART was easier to implement, and it can capture the same information that 10D-SART captures [45]. Second, subjects can quickly fill the 3D-SART forms after simulation. Thus, using 3D-SART minimized the interruptions on the subjects, especially when they had to finish multiple rounds of simulations in our study.

2.4.2. NASA-TLX

The NASA-TLX scale was proposed by Hart et al. of the National Aeronautics and Space Administration (NASA) to assess the ATCO workload [46]. It provides an overall score of workload based on weighting the assessments of six sub-dimensions. See Table 5 for detailed descriptions of each dimension.

2.5. Statistical Analysis

To test whether there existed significant differences among different groups, we used the analysis of variance (ANOVA). The Levene test was first performed to determine whether the original data variance meets the homogeneity of variance requirements [47]. Then, the homogeneity of variance test (F-test) was carried out to determine whether there existed statistical significant differences in eye movements, situation awareness, and workload. To examine the relationships between eye movements indicators and levels of traffic, linear regression models were developed with traffic as the independent variable. The R 2 , also known as the coefficient of determination, was calculated for each regression model. R 2 is the percentage of the dependent variable variation that a linear model explains. Usually, the larger the R 2 , the better the regression model fits our observations.

3. Results

We found that the Levene test values of all experimental data were greater than 0.05, which means that all the data met the homogeneity test condition. Significance levels were further divided into three groups, p < 0.1 ( ) , p < 0.05 ( ) , and p < 0.01 ( ) . Overall, we found that there was no significant differences in eye movements, situation awareness and workload between manual mode group and attention-guided group. In contrast, there were significant differences between the attention-guided group and automated group. Table 6 presents test results on eye movements of the two groups.

3.1. Impact of Automation on Eye Movements

3.1.1. Gaze Behavior

It can be seen from Table 6 that there were significant differences in the gaze duration between the group of attention-guided mode and the group of automated mode in all three traffic scenarios (three aircraft ( F = 36.198 , p = 0.000 ), six aircraft ( F = 54.778 , p = 0.000 ), and eight aircraft ( F = 12.301 , p = 0.002 )). The average gaze duration increased when the number of aircraft increased (see Figure 5a). In the manual mode and attention-guided mode, the gaze duration increased almost linearly with traffic (see Table 7; R 2 = 0.516 for the manual mode, and R 2 = 0.725 for the attention-guided mode). In contrast, it seems that gaze duration did not change in the automated mode when traffic varied ( R 2 = 0.035 ).
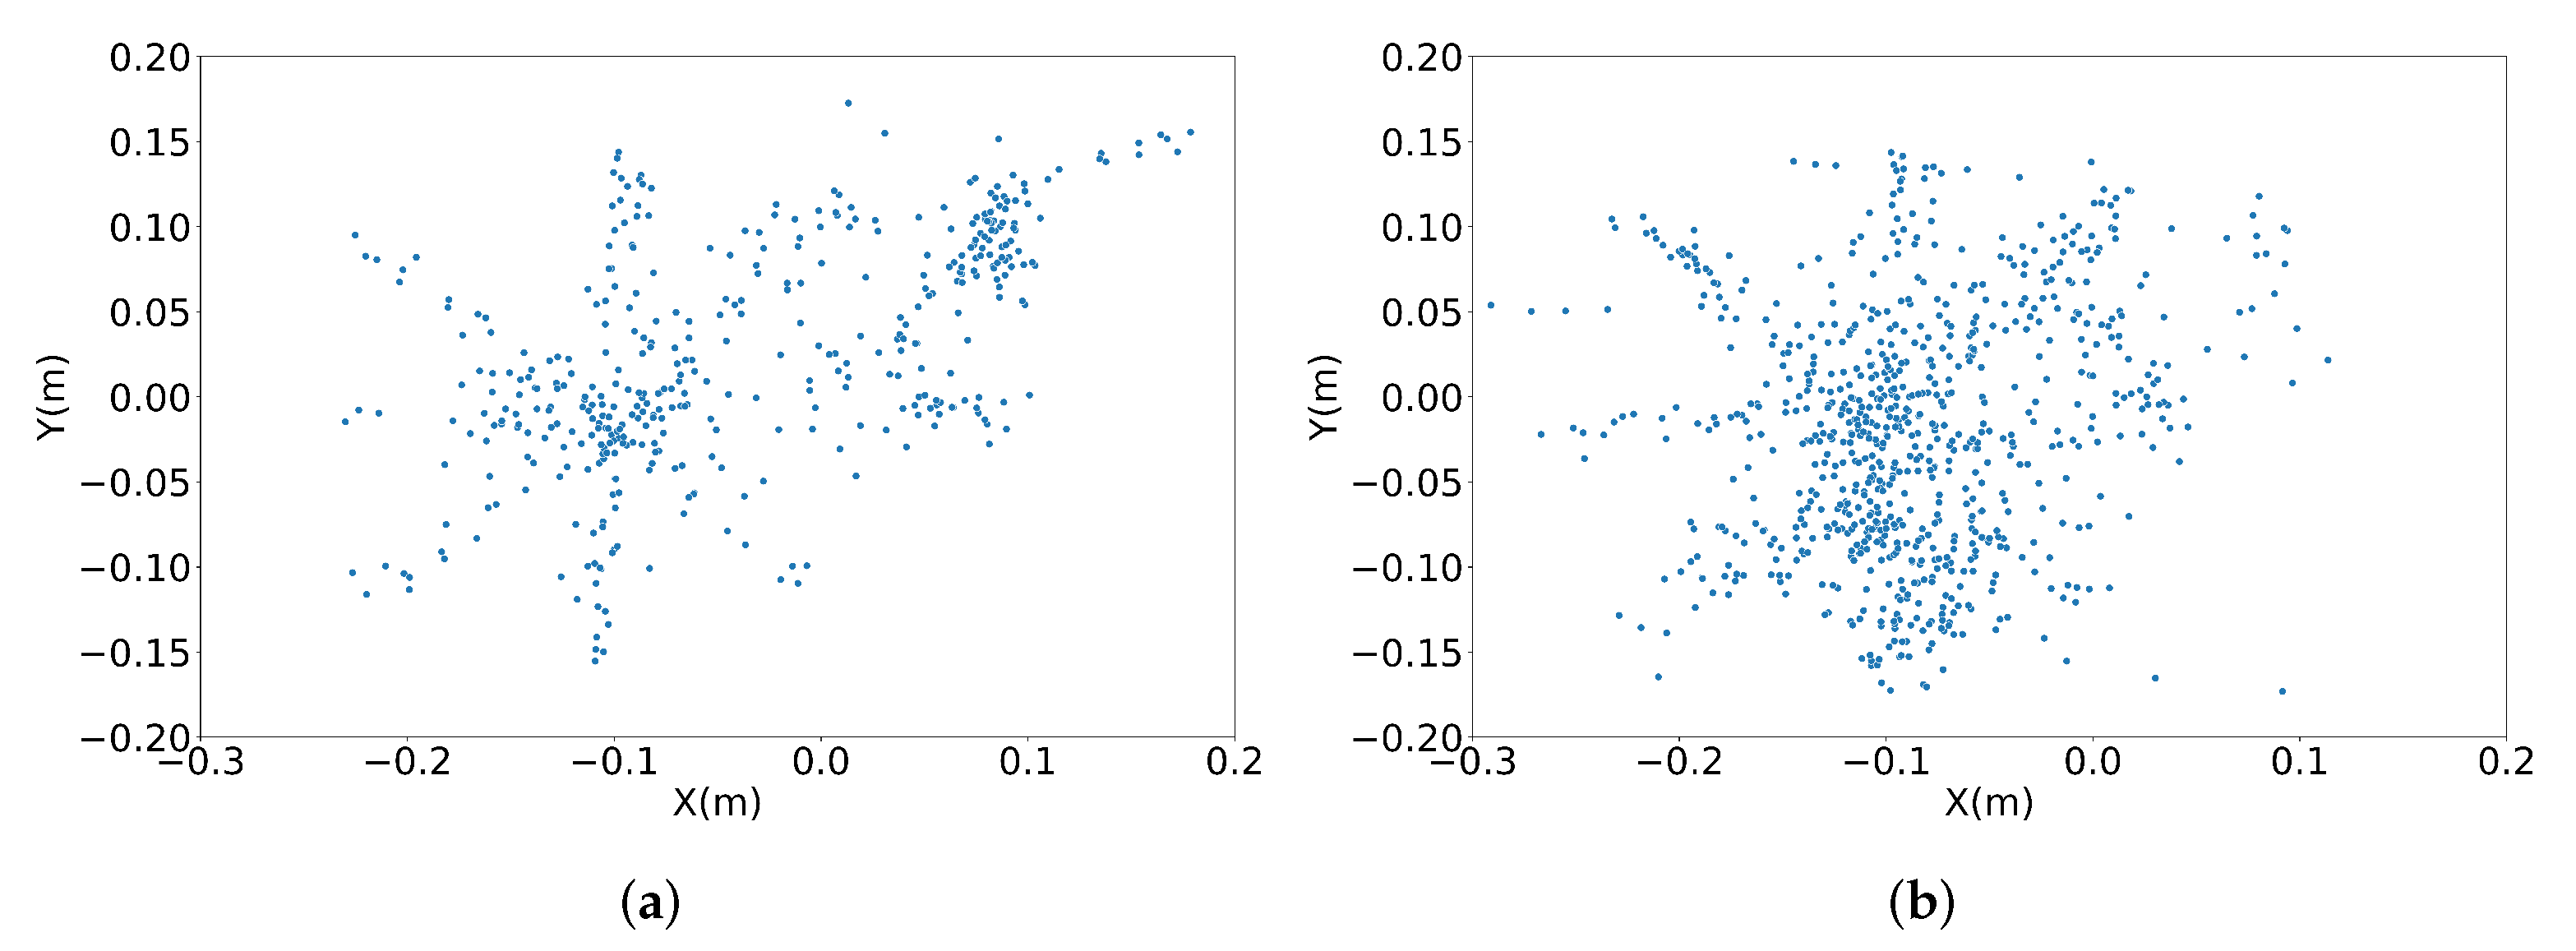
Figure 5b shows the average number of fixation points of all the participants under different automation levels and traffic scenarios. Figure 6a,b are the spatial distributions of fixation points of a same participant under the attention-guided mode and under the automated mode, both with three aircraft. Blue dots are the fixation points of the participant, showing the locations of the screen he/she viewed. Compared with manual mode or attention-guided mode, there was a significant increase in the number of fixation points of participants under automated mode. According to Table 6, when comparing the fixation behaviors of participants under the attention-guided mode and under automated mode, there were significant differences in the number of fixation points between three aircraft ( F = 24.264 , p = 0.000 ) and with six aircraft ( F = 5.449 , p = 0.028 ). However, no significant difference was observed when traffic increased to eight aircraft.
In order to compute the gaze entropy, we divided the radar screen into 1296 ( 48 × 27 ) small units, and computed the frequency that each small unit was viewed by the participant. Figure 7 plots a typical gaze distribution of one participant with the color indicating the frequency of gaze points falling into the region. Figure 7a shows the gaze frequency in the scenario of attention-guided mode with three aircraft. Figure 7b shows the gaze frequency in the scenario of automated mode with three aircraft. The statistical results on gaze entropy is shown in Figure 5c. As shown in Table 6, there was no significant difference in gaze entropy between the attention-guided group and automated group for all levels of traffic (three aircraft ( F = 2.224 , p = 0.148 ), sixaircraft ( F = 0.183 , p = 0.673 ), and eight aircraft ( F = 1.872 , p = 0.183 )). Under the manual mode or attention-guided mode, gaze entropy increased with the increase of traffic; while under automated mode, gaze entropy did not change when the traffic increased. Interestingly, in the high traffic scenario, i.e., when the number of aircraft was eight, the gaze entropy in the automated mode was lower than that in the manual mode or in the attention-guided mode.
Figure 5d shows the conditional entropy across all modes and traffic scenarios. According to Table 6, it can be seen that significant differences existed in conditional entropy between the attention-guided group and automated group for all traffic scenarios (three aircraft ( F = 55.851 , p = 0.000 ), six aircraft ( F = 19.761 , p = 0.000 ), and eight aircraft ( F = 5.739 , p = 0.024 )). In the manual mode and in the attention-guided mode, conditional entropy increased with the increase in traffic flow.

3.1.2. Saccade Behavior

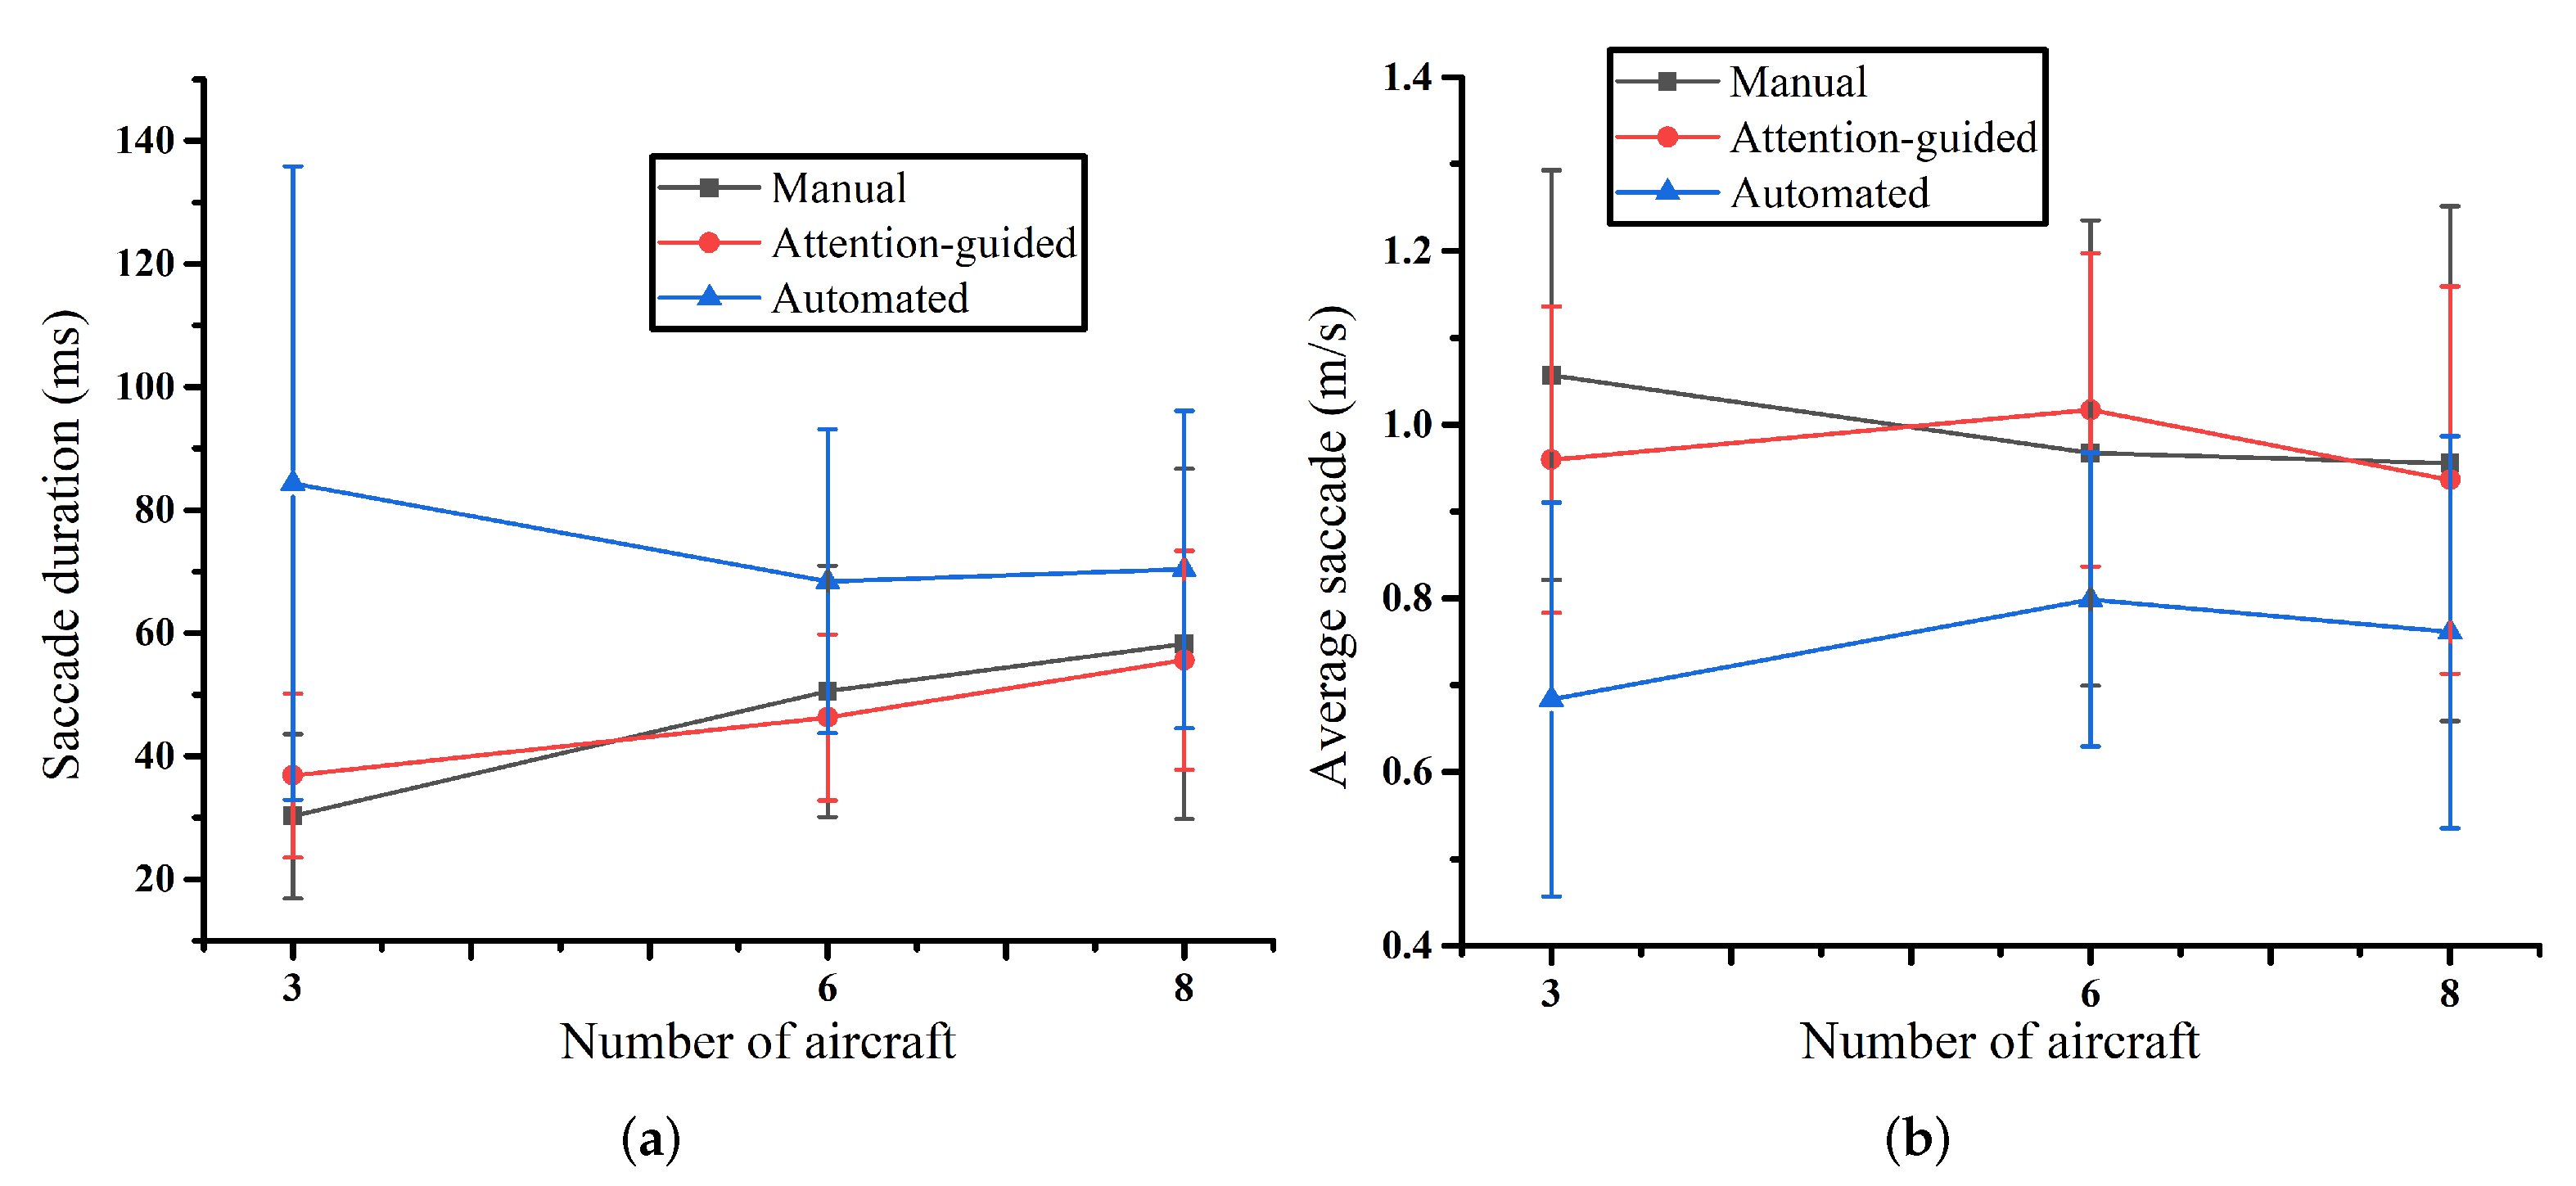
The saccade duration is commonly used as a measure of the searching efficiency [48]. Figure 8a plots the saccade duration under different levels of automation and traffic flow. It can be seen from Table 6 that there existed significant differences in the duration of saccades between the attention-guided group and automated mode group (three aircraft ( F = 11.162 , p = 0.003 ), six aircraft ( F = 8.662 , p = 0.007 ), and eight aircraft ( F = 3.100 , p = 0.090 ). The saccade duration increased with the increase in traffic flow in the manual/ attention-guided groups, while no clear regularity was found in saccade duration under the automated mode.
Figure 8b shows the average saccade under different levels of automation and traffic. It can be seen from Table 6 that there existed significant differences in the average saccade speed of participants between the attention-guided group and automated group (three aircraft ( F = 12.948 , p = 0.001 ), six aircraft ( F = 10.905 , p = 0.003 ), eight aircraft ( F = 4.268 , p = 0.077 )). The average saccade speed decreased with the increase in the traffic flow under manual mode and under the attention-guided mode, while the average saccade speed did not change significantly under the automated mode.

3.1.3. Effects of Traffic on Eye Movements

To examine whether traffic has effects on eye movements, we performed one-way ANOVA. Table 7 shows the statistical results. The R 2 listed in the last column of the table was calculated from linear regression models, with the traffic level as the independent variable. As it can be seen from the table, the average saccade velocity was not affected by the traffic levels. The other eye movements indicators were affected by the levels of traffic under the manual mode or under the attention-guided mode. Again, the levels of traffic had no effect on eye movements under the automated mode.

3.2. Impact of Automation on Situation Awareness

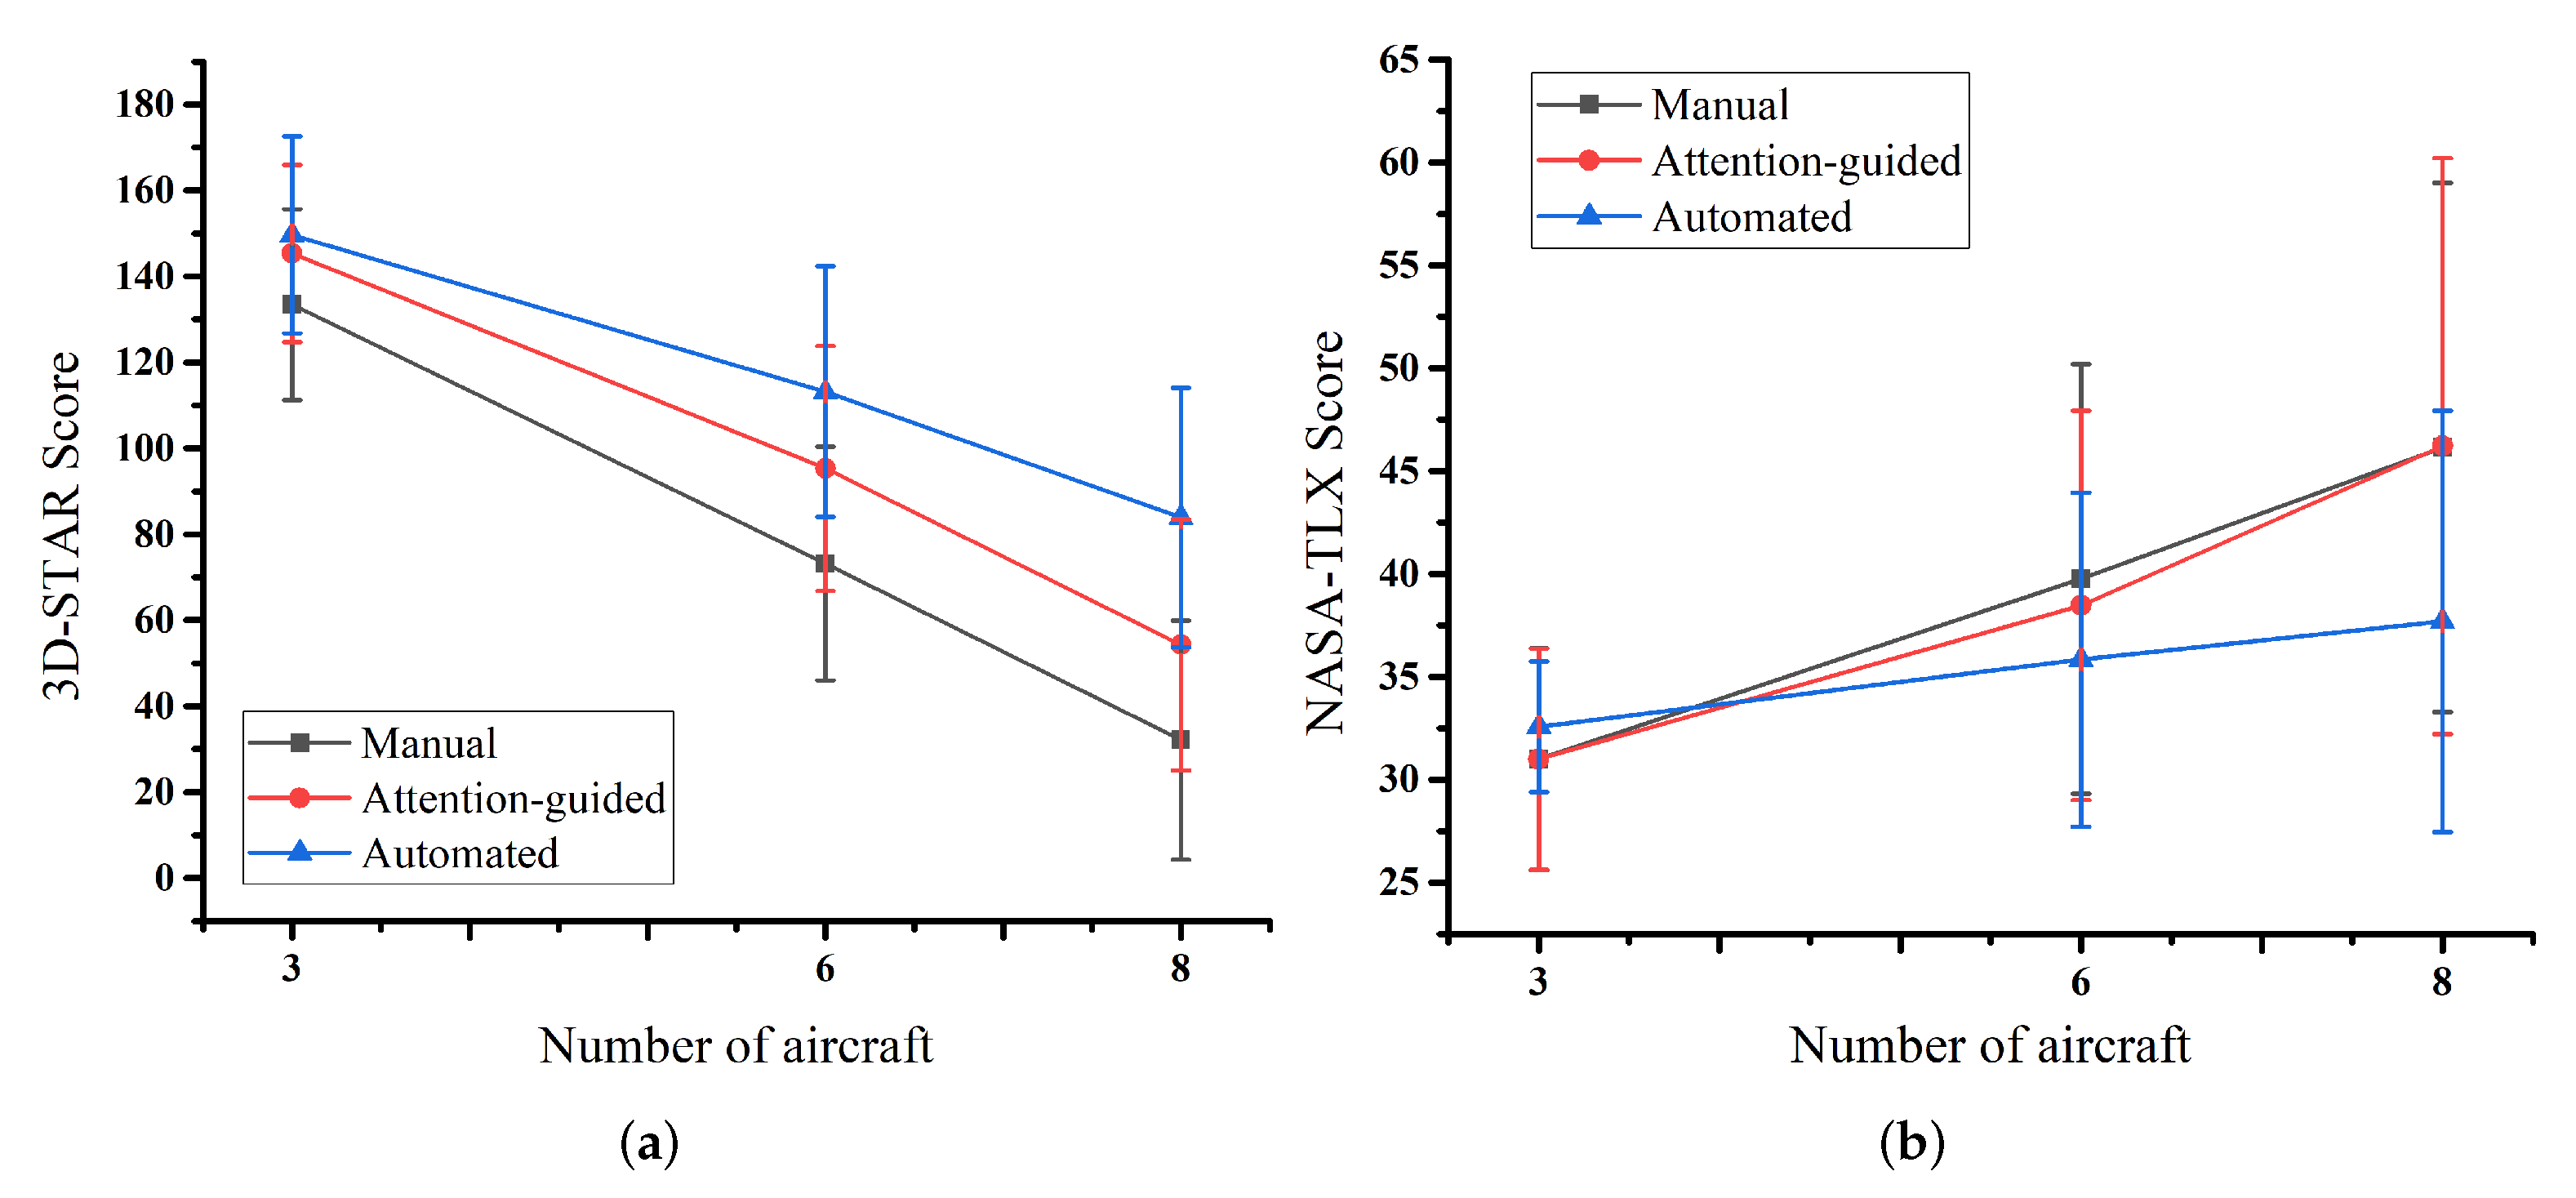
Figure 9a shows the results of the participants’ 3D-SART scores, i.e., SAS. It can be seen from the figure that the situation awareness significantly decreased when the flow increased under each level of automation. We also found that situation awareness increased when the level of automation increased under the same level of traffic. It was found that there were significant differences in the situation awareness of the participants under the manual and under automated mode both with eight aircraft scenarios ( F = 6.95 , p = 0.014 ), while there was no significant difference under the two modes with the three aircraft scenario ( F = 0.271 , p = 0.607 ) or six aircraft scenario ( F = 2.692 , p = 0.113 ).

3.3. Impact of Automation on Workload

Figure 9b shows the results of NASA-TLX for participants under different levels of automation. It can be seen from the figure that as the number of aircraft increased, the workload of participant increased. The homogeneity test was performed on the participant’s workload under the attention-guided and under automated mode. It was found that when the number of aircraft was eight, there were significant differences in the participant’s workload ( F = 3.380 , p = 0.077 ), while there was no significant difference found in the scenario with three aircraft ( F = 0.888 , p = 0.355 ) or with six aircraft ( F = 0.628 , p = 0.435 ).

3.4. Differences between Students and ATC Professionals

We found that nearly no differences existed between the students and ATC professionals among all the measurements, except for the saccadic velocity in a few scenarios. The ANOVA analysis results are reported in Table 8. Under the manual mode, there was a statistical difference between students and ATC professionals when traffic was six ( p = 0.040 ), while under the attention-guided mode or under the automated mode, significant differences were found to exist in two different traffic scenarios (three aircraft and six aircraft for attention-guided mode, three aircraft and eight aircraft for automated mode).

4. Discussions

4.1. Automation and Eye Movements

There was no significant difference found in the eye movement behavior of the participants between the manual group and attention-guided group. This may be due to the fact that both modes required participants to fully control the aircraft. We found that gaze duration, the number of fixation points, and saccade duration almost linearly increased with traffic (see the R 2 calculated from linear regression models in Table 7). The more aircraft in the airspace, the greater the difficulty in extracting and processing the information. Due to the decision support information provided in the attention-guided mode, the sound and colors of the flights were different when there was a potential conflict. Studies have shown that color can affect the distribution of human attention [49]. When there were different colors on the display, the participant’s attention was attracted. Consequently, compared with the manual mode, participants under the attention-guided mode had a slightly longer gaze duration, slightly larger number of gaze points, and larger conditional entropy.
Additionally, the participant’s eye movements were found to be significantly different between the attention-guided group and automated group. This may be the result of the change in the responsibilities of the participants, as their role shifted from that of an active regulatory decision maker to a passive supervisor. Recall that a longer duration of gaze may indicate that something has happened that is not according to the participant’s expectation. The participant monitored the aircraft on the screen under automated mode. He/she did not have to control the aircraft because the system can automatically resolve any potential conflict. However, the way that the system resolved the conflicts may be different from the one that the participant had planned. Therefore, it might take a longer duration for the participant to understand how the system worked, leading to a longer duration of gaze; (2) the increase in the number of fixation points, the increase in saccade duration, and the decrease in the average saccade all implied lower searching efficiency. All the air traffic controllers are trained to be able to quickly extract information from current traffic situation. Participants under the automated mode seemed to have difficulty in acquiring useful information. Again, this may be the result of differences in conflicts detection and resolution strategies between automation and humans.
Surprisingly, there was no significant difference found in the gaze entropy between different automation groups. The gaze entropy measures the chaos of the overall gaze behavior. We cannot tell from the gaze entropy any difference in the gaze behavior among the three groups. In contrast, the conditional gaze entropy was found to be significant lower under the manual/attention-guided mode compared to that under the automated mode. Lower entropy indicates more regularity and certainty of gaze behaviors, suggesting that a participant’s gaze was better planned if he/she had to resolve any potential conflict by themselves. In summary, changes in the level of automation did have effects on the gaze behavior and saccade behavior. To keep the ATCOs “in-the-loop” under a higher level of automation, maybe training on how automation works would help them to quickly gather information and take control, if necessary.

4.2. Automation and Situation Awareness and Workload

The results suggested that situation awareness decreased as traffic flow increased under each level of automation. This is mainly because the increase in the number of aircraft increased the difficulty in obtaining and understanding relevant information. The traffic situation became so complicated that participants could hardly spare any attention to other tasks. In other words, in the scenario of heavy traffic, the attentional demands ( D e ) increased, but the understanding of the current situation ( U d ) decreased. Thus, situation awareness decreased. We noted that situation awareness increased with the level of automation, improving under the same level of traffic. This is generally in agreement with previous studies [50]. Higher situation awareness indicated that participants are more competent. The participant’s situation awareness score was higher in the automated mode because the role of the participant changed. The participant only had to monitor the system. In the case of heavy traffic, the more automated the system is, the better it can improve the participant’s situation awareness. Similar results were found for the participants’ workload. The participants’ workload increased when the number of aircraft increased. The higher the level of automation used in a heavy traffic scenario, the more the workload can be reduced.

4.3. Automation and Levels of Expertise

Eye movement indicators were reported to be used as effective measurements for distinguishing novice and ATC experts [20]. Here, we did not find any significant difference among the eye movements indicators between students and ATC professionals. There may be several reasons for the little differences between these two groups of the subjects. First, the main objective of this study was to examine how automation may affect eye movements, situation awareness and workload. A simplified air traffic control simulation environment was developed to capture the basic skills of air traffic control. We did not impose too many constraints on the tasks, such as specific route structures that aircraft must follow, or target altitudes that aircraft must reach. The complexity of the tasks was not controlled. Second, the time to finish each simulation under low traffic was much shorter (typically less than 5 min) than that under heavy traffic. Third, we used a 3 × 3 fully crossed, within subjects design. The simulation took place in the order of “manual, attention-guided, automated”. Traffic was gradually increased from three aircraft, to six aircraft, and eight aircraft. We hoped that the participant could gradually participate “into the loop”. Perhaps a between-subjects design could further uncover how automation affects ATCOs’ behaviors.

5. Conclusions

This paper investigated the difference in air traffic controller’s eye movements, situation awareness and mental workload under three levels of automation. The results suggested that visual and sound prompts hardly changed eye movements, compared to the manual mode. While under the automated mode, the role of the participants shifted from control decision maker to the supervisor, and their eye movements significantly changed. In conclusion, we found that as the level of automation increased, the more chaotic the ATCO’s gaze behavior became. Moreover, the eye movement indicators of participants under automated mode remained almost stable no matter how the traffic flow varied. This may be because high automation freed ATCOs from a series of routine tasks, and ATCOs remained additional visual resources to allocate when serving as supervisors. Moreover, we found that in the scenario with a large number of aircraft, automation can improve ATCOs’ situation awareness and effectively reduce their workload.
This work has several limitations. First, the complexity of the task should be controlled more precisely. During simulations, aircraft were generated randomly at eight points on the screen. The task complexity of resolving conflict for each simulation exercise could be different. Second, the human–computer interaction interface was divided into areas of different functions; perhaps we could explore the eye-movement data on each area, respectively, to uncover the dependence of controllers on each area. Last, but not least, our simulation was different from a real air traffic control environment. In reality, air traffic controllers must make quick, correct decisions to keep air traffic safe and orderly. No mistake is allowed during real-world operation, whereas during a real-time simulation, the participants’ working attitude changes since they know that mistakes are allowed. This could have an impact on eye movements and other physiological behaviors.

Author Contributions

Conceptualization, Y.W., S.L., M.S. and D.D.; data curation, R.H.; formal analysis, Y.W.; investigation, Y.W., R.H., S.L., M.S. and D.D.; software, S.L.; writing—original draft, Y.W., S.L., M.S. and D.D.; writing—review and editing, Y.W., M.S. and D.D. All authors have read and agreed to the published version of the manuscript.

Funding

This research was supported by the National Natural Science Foundation of China (grant Nos. U1833126, U2033203, 61773203, 61304190).

Institutional Review Board Statement

The study was conducted according to the guidelines of the Declaration of Helsinki, and approved by the Institutional Review Board of College of Civil Aviation, Nanjing University of Aeronautics and Astronautics.

Informed Consent Statement

Informed consent was obtained from all subjects involved in the study.

Data Availability Statement

Due to the nature of this research, participants of this study did not agree for their data to be shared publicly, so supporting data is not available.

Acknowledgments

We thank air traffic controllers from East China Air Traffic Management Bureau and the students from NUAA for participating the experiments. We thank the editor and anonymous reviewers for their constructive comments and suggestions which helped us to improve the manuscript.

Conflicts of Interest

The authors declare no conflict of interest.

References

  1. Xiang, G. Automation Introduction-Automation Times. Autom. Panor. 2003, 020, 7–9. [Google Scholar]
  2. Schultz, M.; Fricke, H.; Kunze, T.; Gerbothe, T.; Grabow, C.; De Prins, J.; Wimmer, M.; Kappertz, P. Modelling and Evaluation of Automated Arrival Management Considering Air Traffic Demands. SESAR Innov. Days 2013, 1, 1–9. [Google Scholar]
  3. Parasuraman, R.; Molloy, R.; Singh, I.L. Performance Consequences of Automation-Induced ‘Complacency’. Int. J. Aviat. Psychol. 1993, 3, 1–23. [Google Scholar] [CrossRef]
  4. Metzger, U.; Parasuraman, R. Automation-Related “Complacency”: Theory, Empirical Data, and Design Implications. Proc. Hum. Factors Ergon. Soc. Annu. Meet. 2001, 45, 463–467. [Google Scholar] [CrossRef]
  5. SESAR Joint Undertaking. Automation in Air Traffic Management—Long-Term Vision and Initial Research Roadmap; SESAR Joint Undertaking: Brussels, Belgium, 2020. [Google Scholar]
  6. Kaber, D.B.; Perry, C.M.; Segall, N.; McClernon, C.K.; Prinzel, L.J. Situation awareness implications of adaptive automation for information processing in an air traffic control-related task. Int. J. Ind. Ergon. 2006, 36, 447–462. [Google Scholar] [CrossRef]
  7. Jones, D.G.; Endsley, M.R. Sources of situation awareness errors in aviation. Aviat Space Env. Med. 1996, 67, 507–512. [Google Scholar]
  8. Endsley, M. Situation Awareness In Aviation Systems. In Handbook of Aviation Human Factors, 2nd ed.; CRC Press: Boca Raton, FL, USA, 2009. [Google Scholar]
  9. Wickens, C.D. Situation Awareness and Workload in Aviation. Curr. Dir. Psychol. Sci. 2002, 11, 128–133. [Google Scholar] [CrossRef]
  10. Ahlstrom, U.; Friedman-Berg, F.J. Using eye movement activity as a correlate of cognitive workload. Int. J. Ind. Ergon. 2006, 36, 623–636. [Google Scholar] [CrossRef]
  11. Tokuda, S.; Palmer, E.; Merkle, E.; Chaparro, A. Using saccadic intrusions to quantify mental workload. Proc. Hum. Factors Ergon. Soc. Ann. Meet. 2009, 2, 809–813. [Google Scholar] [CrossRef]
  12. Di Stasi, L.L.; Marchitto, M.; Antolí, A.; Baccino, T.; Cañas, J.J. Approximation of on-line mental workload index in ATC simulated multitasks. J. Air Transp. Manag. 2010, 16, 330–333. [Google Scholar] [CrossRef]
  13. Müller, A.; Petru, R.; Seitz, L.; Englmann, I.; Angerer, P. The relation of cognitive load and pupillary unrest. Int. Arch. Occup. Environ. Health 2011, 84, 561. [Google Scholar] [CrossRef]
  14. Imants, P.; Greef, T.D. Eye Metrics for Task-Dependent Automation. In Proceedings of the European Conference on Cognitive Ergonomics, Vienna, Austria, 1–3 September 2014. [Google Scholar]
  15. Kang, Z.; Bass, E.J.; Lee, D.W. Air traffic controllers’ visual scanning, aircraft selection, and comparison strategies in support of conflict detection. In Proceedings of the Human Factors and Ergonomics Society Annual Meeting, Chicago, IL, USA, 27–31 October 2014; Volume 2014, pp. 77–81. [Google Scholar]
  16. Palma Fraga, R.; Kang, Z.; Crutchfield, J.M.; Mandal, S. Visual Search and Conflict Mitigation Strategies Used by Expert en Route Air Traffic Controllers. Aerospace 2021, 8, 170. [Google Scholar] [CrossRef]
  17. Marchitto, M.; Benedetto, S.; Baccino, T.; Cañas, J.J. Air traffic control: Ocular metrics reflect cognitive complexity. Int. J. Ind. Ergon. 2016, 54, 120–130. [Google Scholar] [CrossRef]
  18. Mertens, H.W.; Milburn, N.J.; Collins, W.E. Practical color vision tests for air traffic control applicants: En route center and terminal facilities. Aviat. Space Environ. Med. 2000, 71, 1210–1217. [Google Scholar]
  19. van Meeuwen, L.W.; Jarodzka, H.; Brand-Gruwel, S.; Kirschner, P.A.; de Bock, J.J.P.R.; van Merriënboer, J.J.G. Identification of effective visual problem solving strategies in a complex visual domain. Learn. Instr. 2014, 32, 10–21. [Google Scholar] [CrossRef]
  20. Wang, Y.; Wang, L.; Lin, S.; Cong, W.; Xue, J.; Ochieng, W. Effect of Working Experience on Air Traffic Controller Eye Movement. Engineering 2021, 7, 488–494. [Google Scholar] [CrossRef]
  21. Sheridan, T.B.; Verplank, W.L. Human and Computer Control of Undersea Teleoperators; Technical Report; Massachusetts Institute of Technology: Cambridge, MA, USA, 1978. [Google Scholar]
  22. FITTS, P.M. Psychological research on equipment design in the AAF. Am. Psychol. 1947, 2, 93–98. [Google Scholar] [CrossRef] [PubMed]
  23. Parasuraman, R.; Sheridan, T.; Wickens, C. A model for types and levels of human interaction with automation. IEEE Trans. Syst. Man Cybern.-Part A: Syst. Humans 2000, 30, 286–297. [Google Scholar] [CrossRef] [Green Version]
  24. Endsley, M.R. Toward a Theory of Situation Awareness in Dynamic Systems. Hum. Factors 1995, 37, 32–64. [Google Scholar] [CrossRef]
  25. Bedny, G.Z.; Karwowski, W.; Jeng, O.J. The situational reflection of reality in activity theory and the concept of situation awareness in cognitive psychology. Theor. Issues Ergon. Sci. 2004, 5, 275–296. [Google Scholar] [CrossRef]
  26. Rose, J.; Bearman, C.; Dorrian, J. The Low-Event Task Subjective Situation Awareness (LETSSA) technique: Development and evaluation of a new subjective measure of situation awareness. Appl. Ergon. 2018, 68, 273–282. [Google Scholar] [CrossRef]
  27. Mogford, R.H. Mental Models and Situation Awareness in Air Traffic Control. Int. J. Aviat. Psychol. 1997, 7, 331–341. [Google Scholar] [CrossRef]
  28. Durso, F.T.; Bleckley, M.K.; Dattel, A.R. Does Situation Awareness Add to the Validity of Cognitive Tests? Hum. Factors J. Hum. Factors Ergon. Soc. 2006, 48, 721–733. [Google Scholar] [CrossRef]
  29. Zhou, Y.; Zeng, Y.; Yang, J.; Shi, R.; Wang, Q. A computational approach to air traffic controller situation awareness based on multi-sensor data. Adv. Psychol. Sci. 2015, 23, 1879–1885. [Google Scholar] [CrossRef]
  30. Vidulich, M.A.; Stratton, M.; Crabtree, M.; Wilson, G. Performance-based and physiological measures of situational awareness. Aviat. Space Environ. Med. 1994, 65, A7–A12. [Google Scholar]
  31. Durso, F.T.; Geldbach, K.M.; Corballis, P. Detecting Confusion Using Facial Electromyography. Hum. Factors J. Hum. Factors Ergon. Soc. 2012, 54, 60–69. [Google Scholar] [CrossRef]
  32. Endsley, M.R. Direct measurement of situation awareness: Validity and use of SAGAT Development of Queries. In Situation Awareness Analysis and Measurement; Endsley, M.R., Garland, D.J., Eds.; CRC Press: New York, NY, USA, 2000. [Google Scholar]
  33. Zhang, T.; Yang, J.; Liang, N.; Pitts, B.J.; Prakah-Asante, K.O.; Curry, R.; Duerstock, B.S.; Wachs, J.P.; Yu, D. Physiological Measurements of Situation Awareness: A Systematic Review. Hum. Factors 2020. [Google Scholar] [CrossRef]
  34. Sethumadhavan, A. Effects of Automation Types on Air Traffic Controller Situation Awareness and Performance. Proc. Hum. Factors Ergon. Soc. Annu. Meet. 2009, 53, 1–5. [Google Scholar] [CrossRef]
  35. Casar, R.; Arranz, A.; Escribano, B.; Grosskreutz, A.; Garcia, R.; Suikat, R.; Jipp, M.; Zon, G.; Joosse, M. Assessment of impact of Degree of Automation on Human Roles: The Experts’ Analysis using Gaming. In Proceedings of the 2013 ATACCS’2013, Naples, Italy, 28–30 May 2013; Volume 1, pp. 1–8. [Google Scholar]
  36. Durand, N. Constant speed optimal reciprocal collision avoidance. Transp. Res. Part C: Emerg. Technol. 2018, 96, 366–379. [Google Scholar] [CrossRef] [Green Version]
  37. Durand, N.; Gotteland, J.B.; Matton, N. Visualizing complexities: The human limits of air traffic control. Cogn. Technol. Work 2018, 20, 233–244. [Google Scholar] [CrossRef] [Green Version]
  38. Suresh, K.; Chandrashekara, S. Sample size estimation and power analysis for clinical research studies. J. Hum. Reprod. Sci. 2012, 5, 7–13. [Google Scholar] [CrossRef] [PubMed]
  39. Fehd, H.M.; Seiffert, A.E. Eye movements during multiple object tracking: Where do participants look? Cognition 2008, 108, 201–209. [Google Scholar] [CrossRef] [Green Version]
  40. McIntire, L.K.; McKinley, R.A.; Goodyear, C.; McIntire, J.P. Detection of vigilance performance using eye blinks. Appl. Ergon. 2014, 45, 354–362. [Google Scholar] [CrossRef]
  41. van de Merwe, K.; van Dijk, H.; Zon, R. Eye Movements as an Indicator of Situation Awareness in a Flight Simulator Experiment. Int. J. Aviat. Psychol. 2012, 22, 78–95. [Google Scholar] [CrossRef]
  42. Shannon, C.E. A Mathematical Theory of Communication. Bell Syst. Tech. J. 1948, 27, 379–423. [Google Scholar] [CrossRef] [Green Version]
  43. Diaz-Piedra, C.; Rieiro, H.; Cherino, A.; Fuentes, L.J.; Catena, A.; Di Stasi, L.L. The effects of flight complexity on gaze entropy: An experimental study with fighter pilots. Appl. Ergon. 2019, 77, 92–99. [Google Scholar] [CrossRef]
  44. Salmon, P.; Stanton, N.; Walker, G.; Green, D. Situation awareness measurement: A review of applicability for C4i environments. Appl. Ergon. 2006, 37, 225–238. [Google Scholar] [CrossRef] [Green Version]
  45. Uhlarik, J.; Comerford, D.A. A Review of Situation Awareness Literature Relevant to Pilot Surveillance Functions; Technical Report; Federal Aviation Administration, National Technical Information Service: Springfield, VA, USA, 2002.
  46. Hart, S.G.; Staveland, L.E. Development of NASA-TLX (Task Load Index): Results of Empirical and Theoretical Research. In Advances in Psychology; Elsevier: North-Holland, The Netherlands, 1988; Volume 52, Chapter C; pp. 139–183. [Google Scholar]
  47. Levene, H. Contributions to Probability and Statistics: Essays in Honor of Harold Hotelling; Stanford University Press: Standford, CA, USA, 1960; pp. 278–292. [Google Scholar]
  48. Liang, Z. The Effectiveness of Infographics Layout in Information Searching and Scanning: An Eye tracking Study. Master’s Thesis, The Pennsylvania State University, State College, PA, USA, 2013. [Google Scholar]
  49. Anllo-Vento, L.; Luck, S.J.; Hillyard, S.A. Spatio-temporal dynamics of attention to color: Evidence from human electrophysiology. Hum. Brain Mapp. 1998, 6, 216–238. [Google Scholar] [CrossRef]
  50. Åsa Svensson. Human-Automation Teamwork: Current Practices and Future Directions in Air Traffic Control. Ph.D. Thesis, Linköping University, Linköping, Sweden, 2020.
Figure 1. The layout of the simulation software’s interface. Aircraft are generated and displayed on the left area, with specific information of each aircraft listed on the lower right area. The upper right area serves for displaying the time and score.
Aerospace 08 00260 g001
Figure 2. Airspace display area. Aircraft are generated randomly in green. When an aircraft is clicked, it turns yellow and the projected trajectory shows up. The aircraft turns red if it is involved in a conflict. The area covered by the green circle is the danger zone, where aircraft are not allowed to enter.
Aerospace 08 00260 g002
Figure 3. Human–computer interaction interface. A group of aircraft are generated and displayed on the left area, with specific information of each aircraft listed on the lower right area. The upper right area serves for displaying time and scores.
Aerospace 08 00260 g003
Figure 4. Data collecting during an experiment.
Aerospace 08 00260 g004
Figure 5. Statistical results on gaze behaviors. (a) Gaze duration, (b) number of fixation points, (c) gaze entropy, (d) conditional entropy.
Aerospace 08 00260 g005
Figure 6. Distribution of fixation points. (a) Attention-guide mode, (b) automated mode.
Aerospace 08 00260 g006
Figure 7. Frequency of ATCOs looking at each small unit in two scenarios. (a) Scenario in attention-guided mode with three aircraft; (b) scenario in automated mode with three aircraft.
Aerospace 08 00260 g007
Figure 8. Statistical results on saccade behaviors. (a) Saccade duration, (b) average saccade.
Aerospace 08 00260 g008
Figure 9. Statistical results on SA and workload. (a) 3D-SART scale score, (b) NASA-TLX scale score.
Aerospace 08 00260 g009
Table 1. Comparison of three modes.
ManualAttention-GuidedAutomated
Provide conflict detectionNoYesYes
Provide conflict warningsNoYesYes
Provide danger zone intrusion alertsNoYesYes
System automatically solve conflictsNoNoYes
ATCO’s main dutiesControlControlMonitor
Table 2. Information of the participants.
Participant IDAgeWorking Years
ATCOs1274
2252
3252
4263
5285
6379
Students719-
820-
920-
1021-
1122-
1221-
1320-
1420-
Table 3. Eye movements metrics.
Eye MovementsIndicatorsDefinitionGeneral Meaning
GazeGaze durationTotal duration of gaze during the experiment.A longer duration indicates that something has happened that is not what the participant excepted.
Number of fixation pointsTotal number of fixations in the experiment.More fixation points indicate lower searching efficiency.
Gaze entropyThe value of the entropy rate of the gaze area in the experiment.Higher gaze entropy indicates a wider range and more chaotic distribution of gaze.
Conditional entropyThe entropy rate of the gaze area with the transition relationship matrix given.Higher conditional entropy indicates that the shift between fixations is more irregular.
SaccadeSaccade durationDuration from the end of the last gaze to the start of the next gaze in the experiment.Larger saccade duration indicates lower searching efficiency.
Average saccadeThe ratio of saccade amplitude to the saccade duration.Larger average saccade indicates a more efficient searching.
Table 4. 3D-SART scale dimension description.
DimensionDescription
Attentional demand ( D e )The likeliness that changes happen to the ATCO’s working scenes (Instability of situation); The number of elements to be paid attention to in the task (Variability of situation); The complexity of the task situation (Complexity of situation).
Attentional supply ( S u )The level of arousal of ATCOs at work (Arousal); The ability to complete other tasks in addition to related tasks (Spare mental capacity); The level of concentration (Concentration); The ability to well distribute attention (Division of attention).
Understanding of the current situation ( U d )How much the ATCO accepts or understands the information at work (Information quantity); The ease or complexity of obtaining information (Information quality); The familiarity with the task at hand (Familiarity).
Table 5. Dimensions of the NASA-TLX scale.
DimensionDescription
Mental needsThe mental needs of ATCOs when observing, thinking, and making decisions at work.
Physical demandThe energy ATCOs need at work.
Time requirementTime and time pressure required for ATCOs to work.
Effort levelEfforts made by ATCOs to achieve a level of competence as they complete their tasks.
Performance levelSatisfaction of the ATCO with his task.
FrustrationWhether the ATCOs feel relaxed or stressed during the task.
Table 6. Significant analysis of participants’ eye movements under the attention-guided mode and under the automated mode.
No. of Aircraft (AC)Eye Movement IndicatorsAttention-Guided (Mean ± Standard Deviation)Automated (Mean ± Standard Deviation)FP
3Gaze duration(ms)152.071 (12.778)236.855 (51.155)36.1980.000 (***)
Number of fixation points608.5 (126.245)950.714 (227.228)24.2640.000 (***)
Gaze entropy7.300 (0.345)7.496 (0.348)2.2240.148 (–)
Conditional entropy1.493 (0.111)1.914 (0.179)55.8510.000 (***)
Saccade duration(ms)36.855 (13.304)84.340 (51.490)11.1620.003 (***)
Average saccade(m/s)0.960 (0.176)0.684 (0.227)12.9480.001 (***)
6Gaze duration(ms)196.141 (18.790)254.184 (22.534)54.7880.000 (***)
Number of fixation points823.357 (183.698)1020.071 (256.260)5.4490.028 (**)
Gaze entropy7.581 (0.291)7.528 (0.355)0.1830.673 (–)
Conditional entropy1.679 (0.162)1.963 (0.176)19.7610.000 (***)
Saccade duration(ms)46.300 (13.460)68.419 (24.689)8.6620.007 (**)
Average saccade(m/s)1.017 (0.180)0.799 (0.169)10.9050.003 (***)
8Gaze duration(ms)220.386 (21.358)251.582 (25.523)12.3010.002 (***)
Number of fixation points911.357 (180.299)987.000 (225.191)0.9630.336 (–)
Gaze entropy7.633 (0.257)7.486 (0.311)1.8720.183 (–)
Conditional entropy1.788 (0.208)1.971 (0.197)5.7930.024 (**)
Saccade duration(ms)55.599 (17.775)70.345 (25.806)3.1000.090 (*)
Average saccade(m/s)0.936 (0.223)0.761 (0.226)4.2680.077 (*)
Significant level: p < 0.1 ( * ) , p < 0.05 ( * * ) , and p < 0.01 ( * * * ) .
Table 7. Statistical tests on the effects of traffic on eye movements.
Eye Movements IndicatorLevel of AutomationFP R 2
Gaze durationManual21.4100.0000.516
Attention-guided51.8040.0000.725
Automated0.9710.3880.035
Number of fixation pointsManual13.5130.0000.396
Attention-guided12.4030.0000.383
Automated0.3010.7420.006
Gaze entropyManual6.2180.0050.221
Attention-guided4.9860.0120.190
Automated0.0600.9410.000
Conditional entropyManual11.0460.0000.341
Attention-guided11.4230.0000.369
Automated0.6783.2380.018
Saccade durationManual6.2440.0040.238
Attention-guided5.4730.0080.216
Automated0.8080.4530.030
Average saccadeManual0.6010.5530.027
Attention-guided0.6410.5320.001
Automated1.1060.3410.030
Table 8. Statistical tests on average saccade between students and ATC professionals.
ManualAttention-GuidedAutomated
Num. of AC368368368
F0.1035.2943.1835.5306.6873.02410.4012.1416.155
P0.7540.0400.1000.0370.0240.1080.0070.1690.029
Publisher’s Note: MDPI stays neutral with regard to jurisdictional claims in published maps and institutional affiliations.