
Application of Noise Certification Regulations within Conceptual Aircraft Design


Abstract
:1. Introduction
2. ICAO Noise Certification
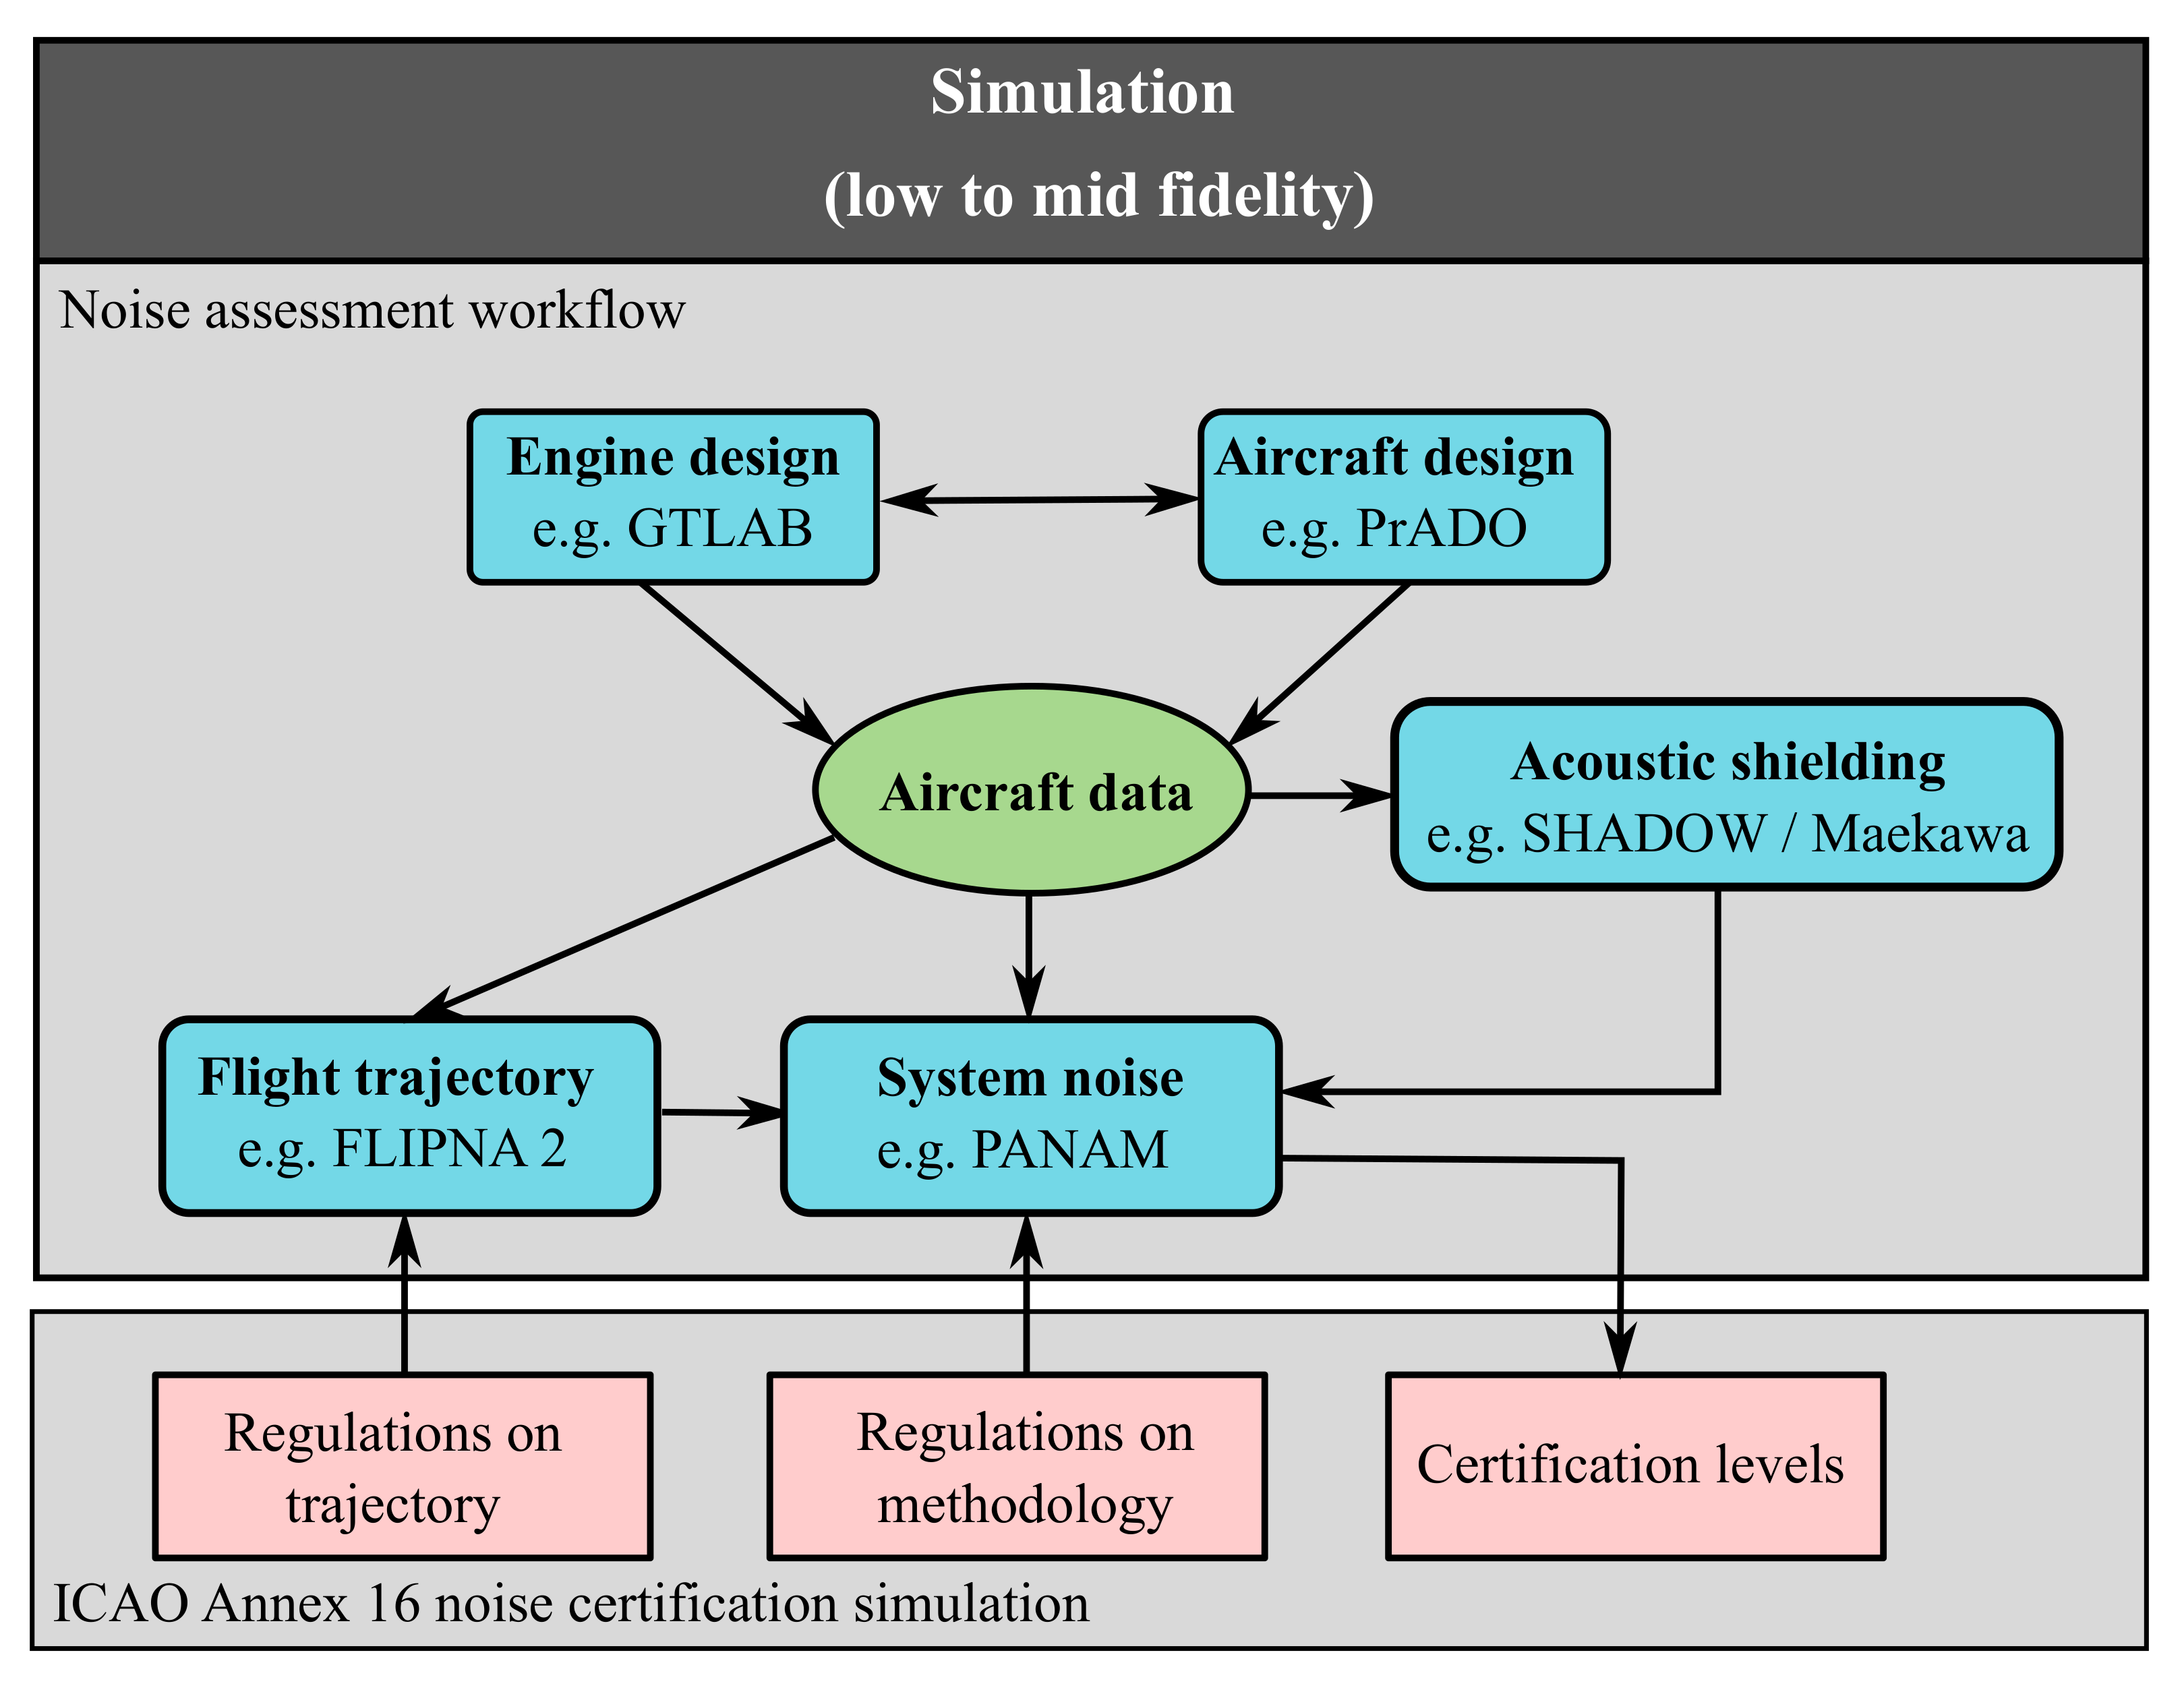
3. Simulation Environment
3.1. Aircraft Design
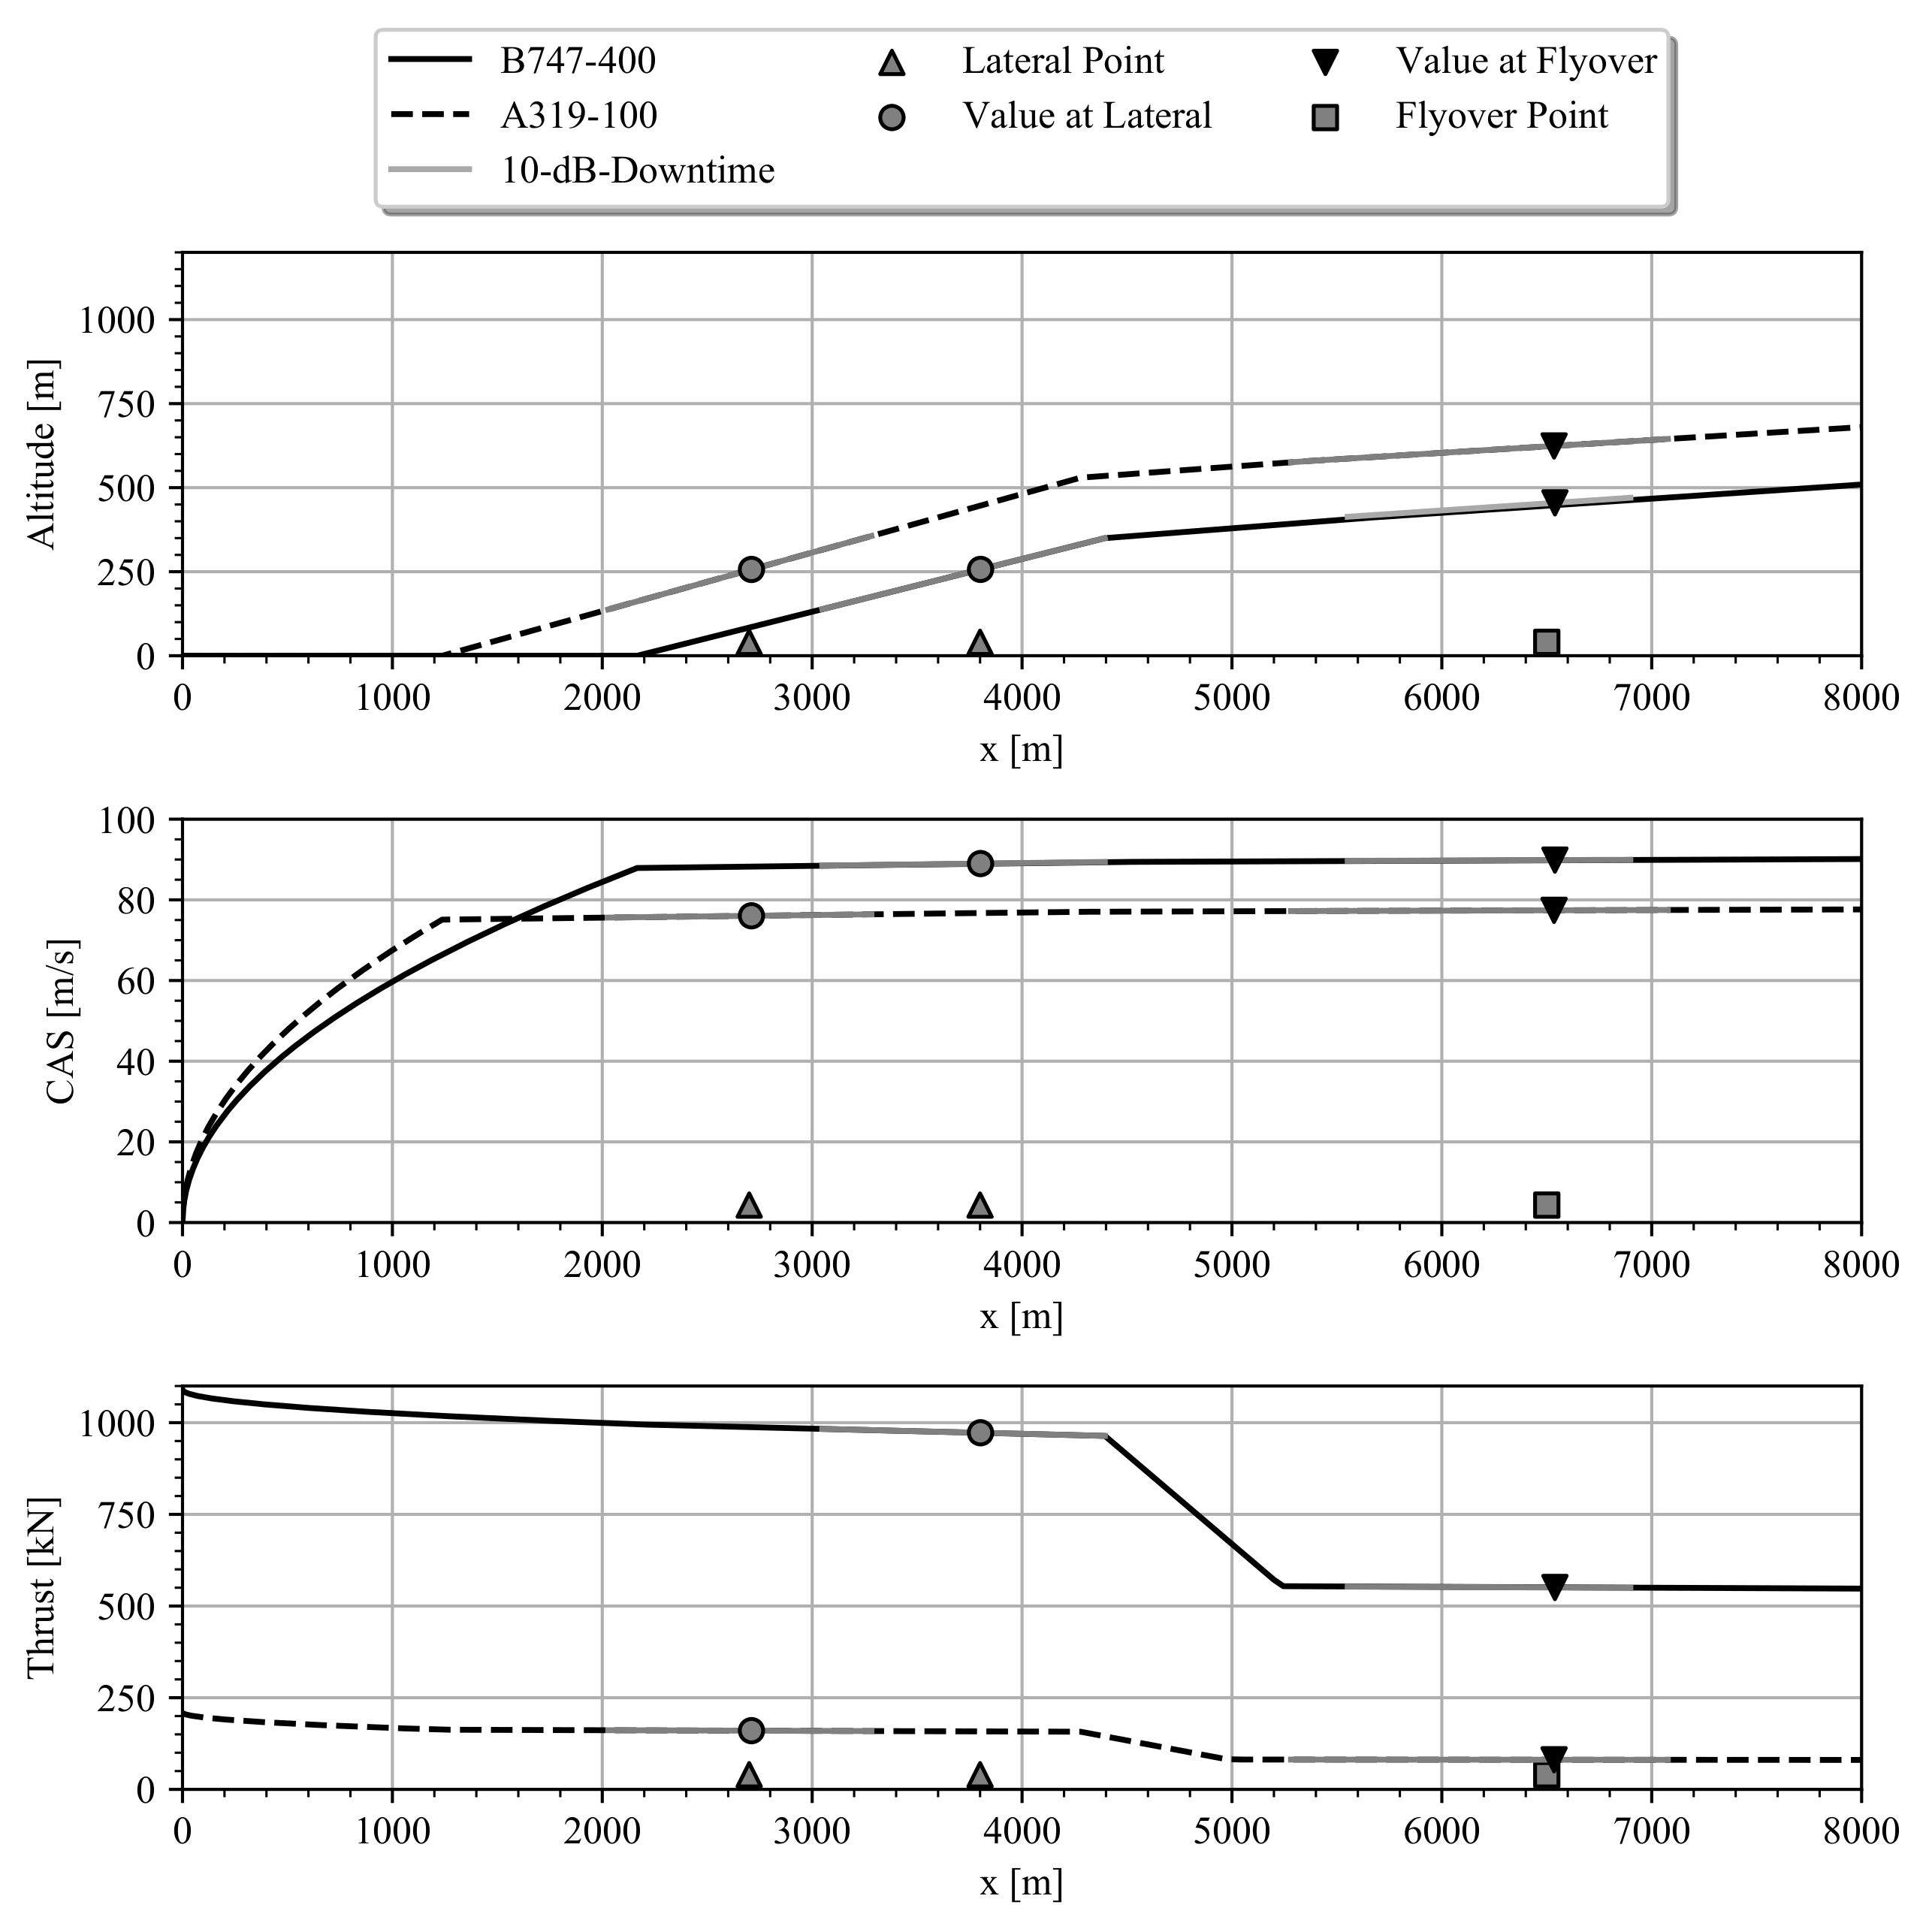
3.2. Flight Simulation
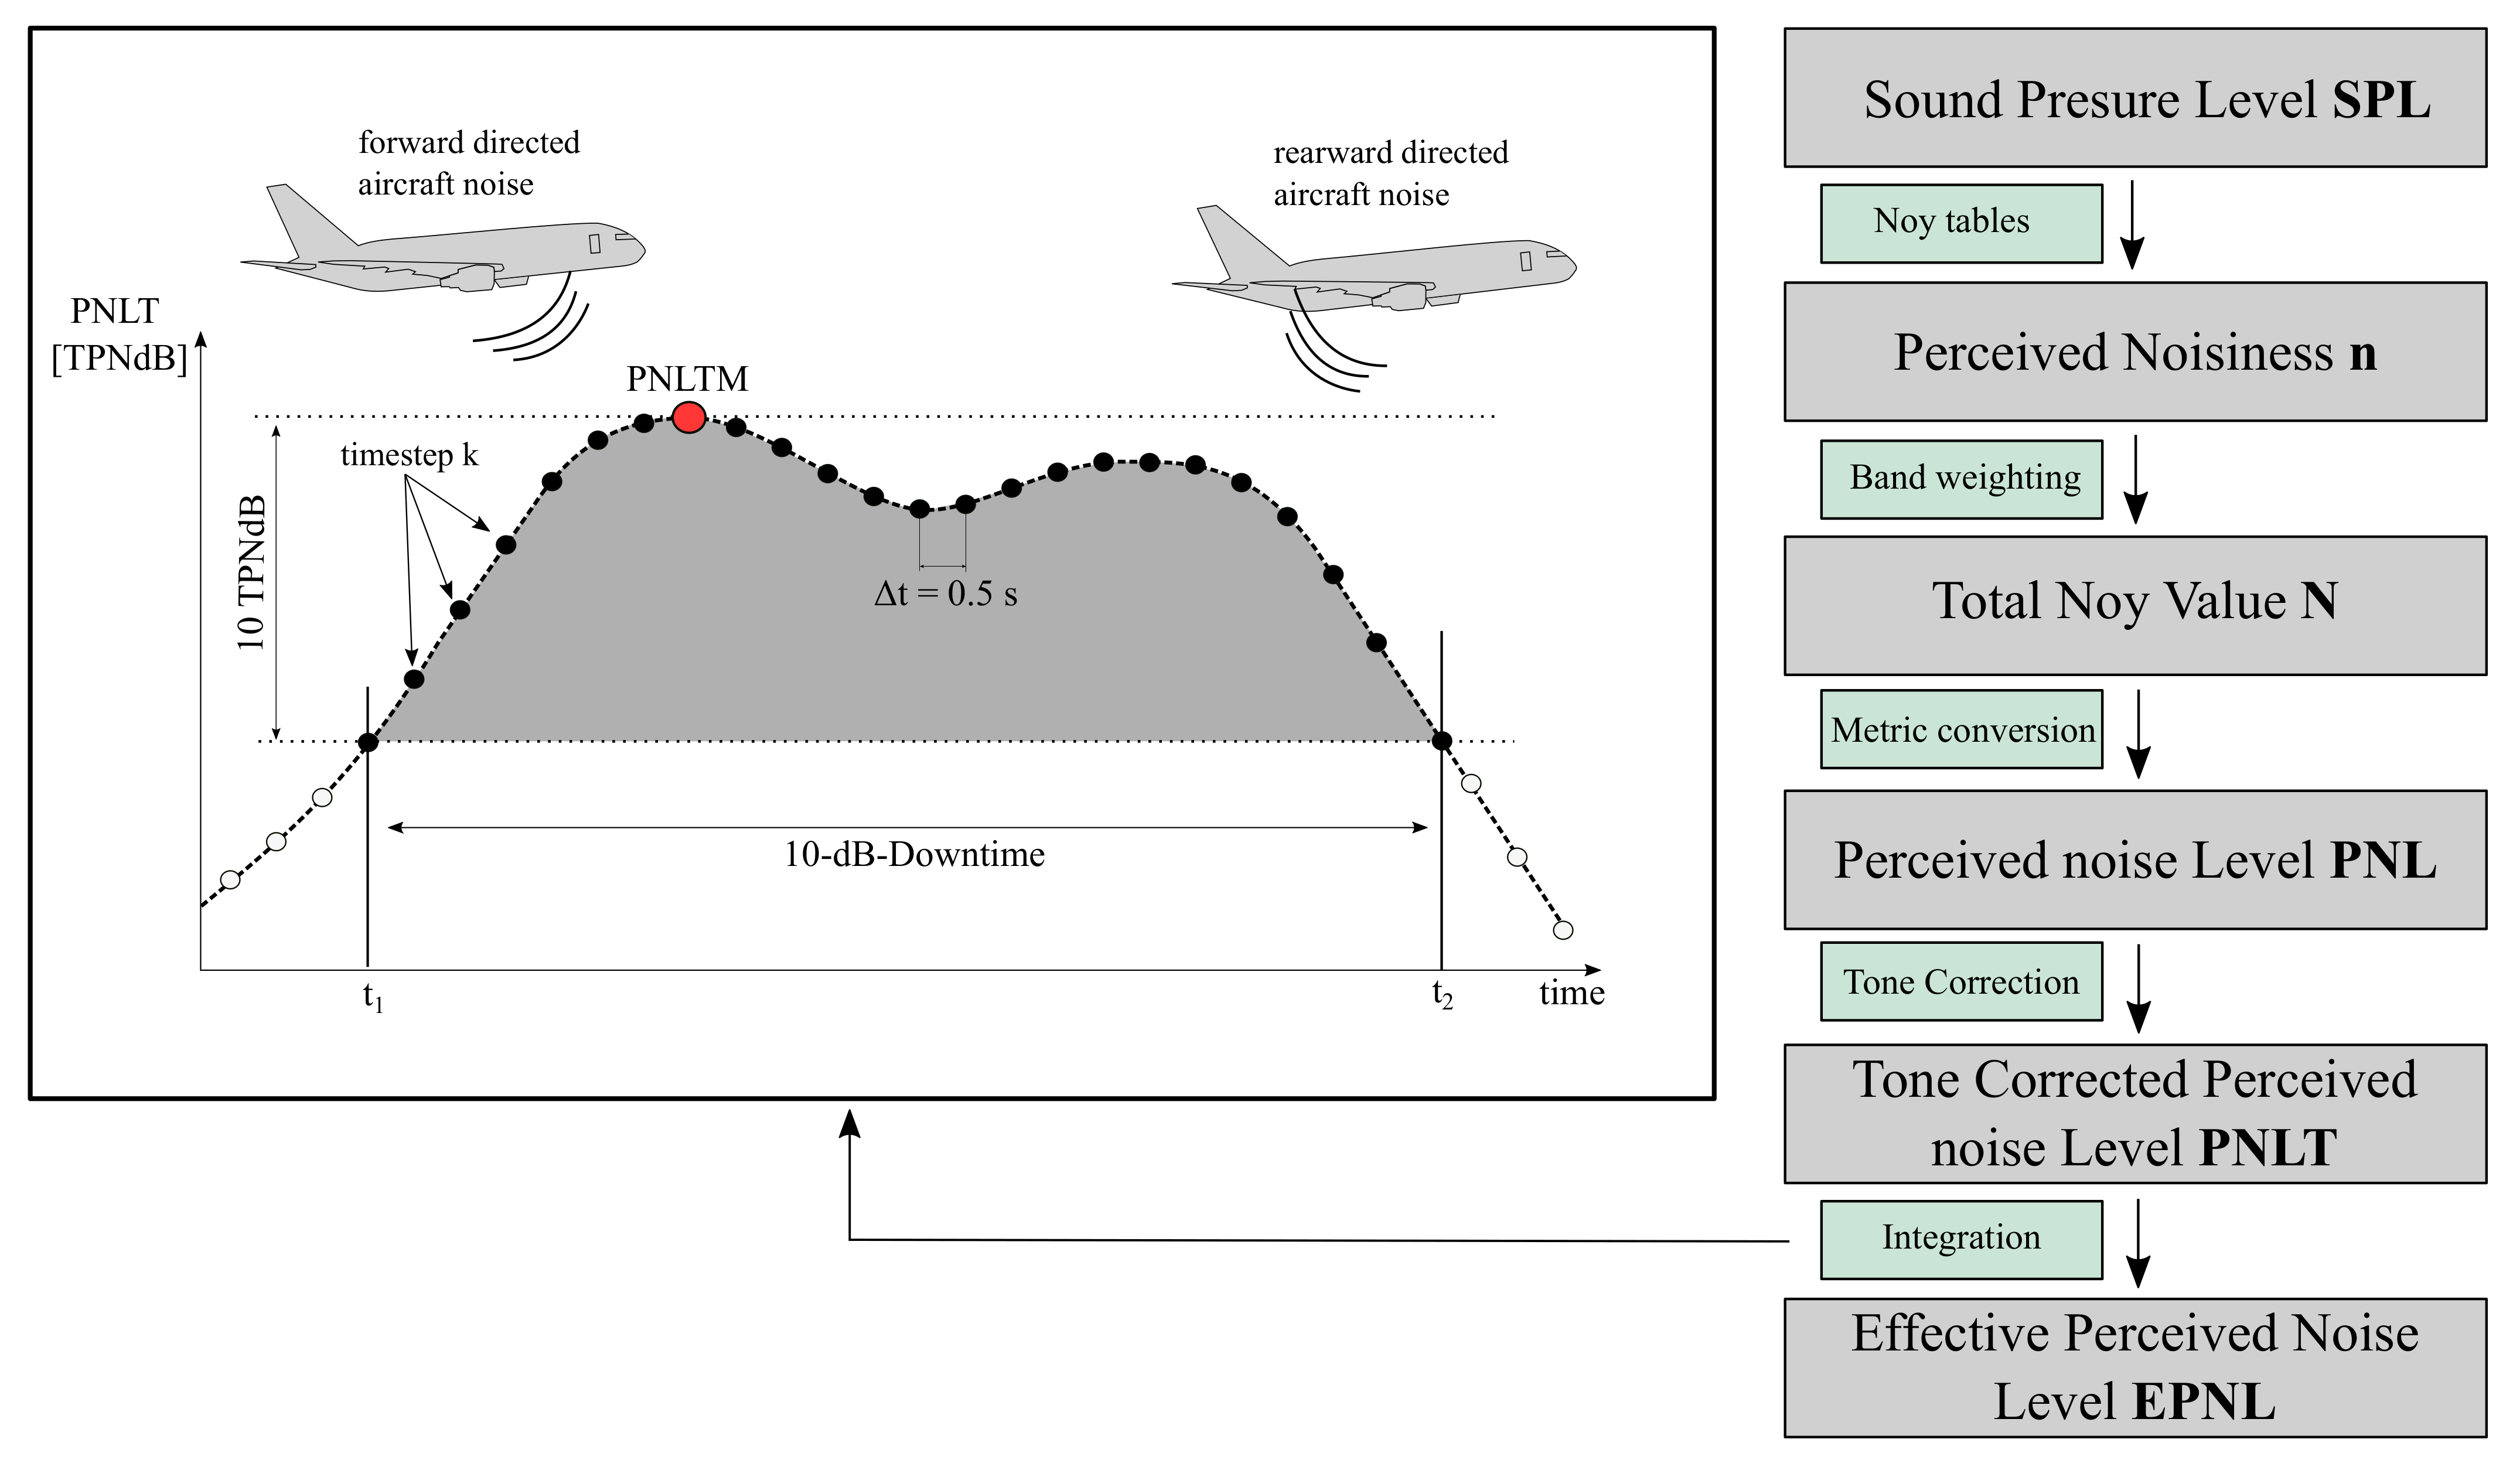
3.3. Noise Prediction
3.4. Virtual Noise Certification Simulation Process
4. Verification
4.1. Comparison of Predictions and Published Levels
4.2. Discussion of Deviations
4.3. Parameter Sensitivity Study: A319-100
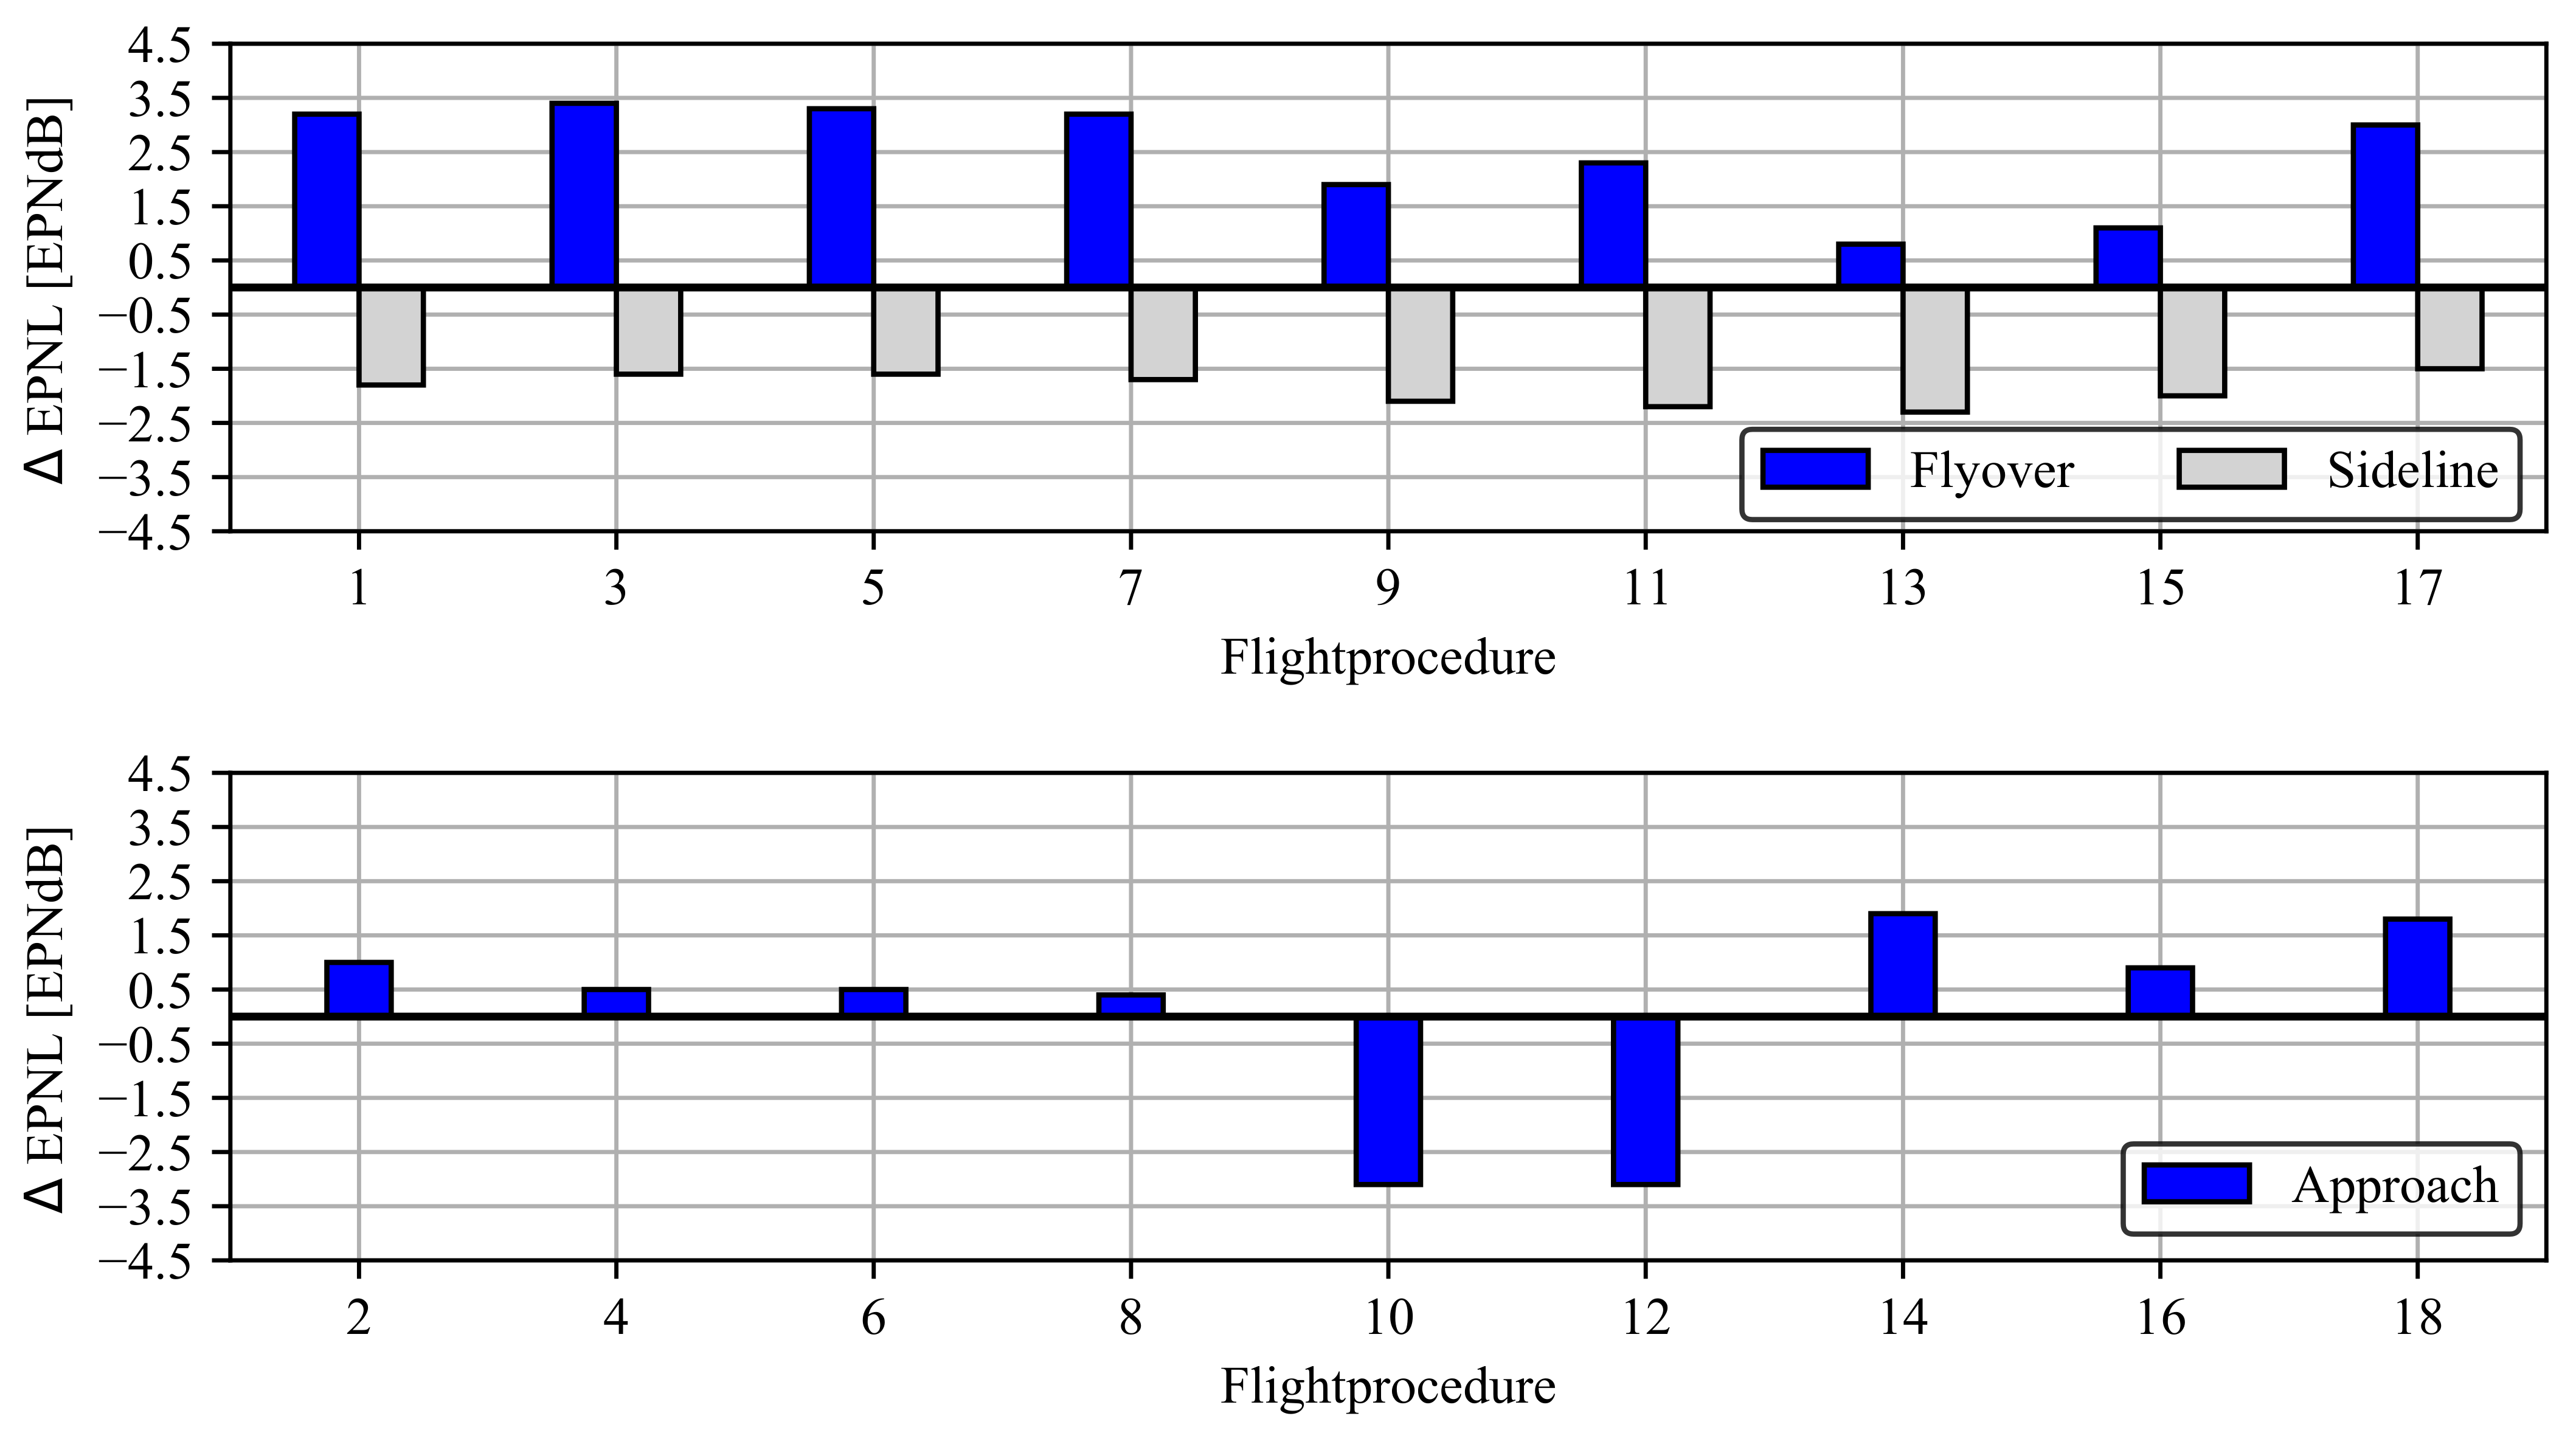
5. Application
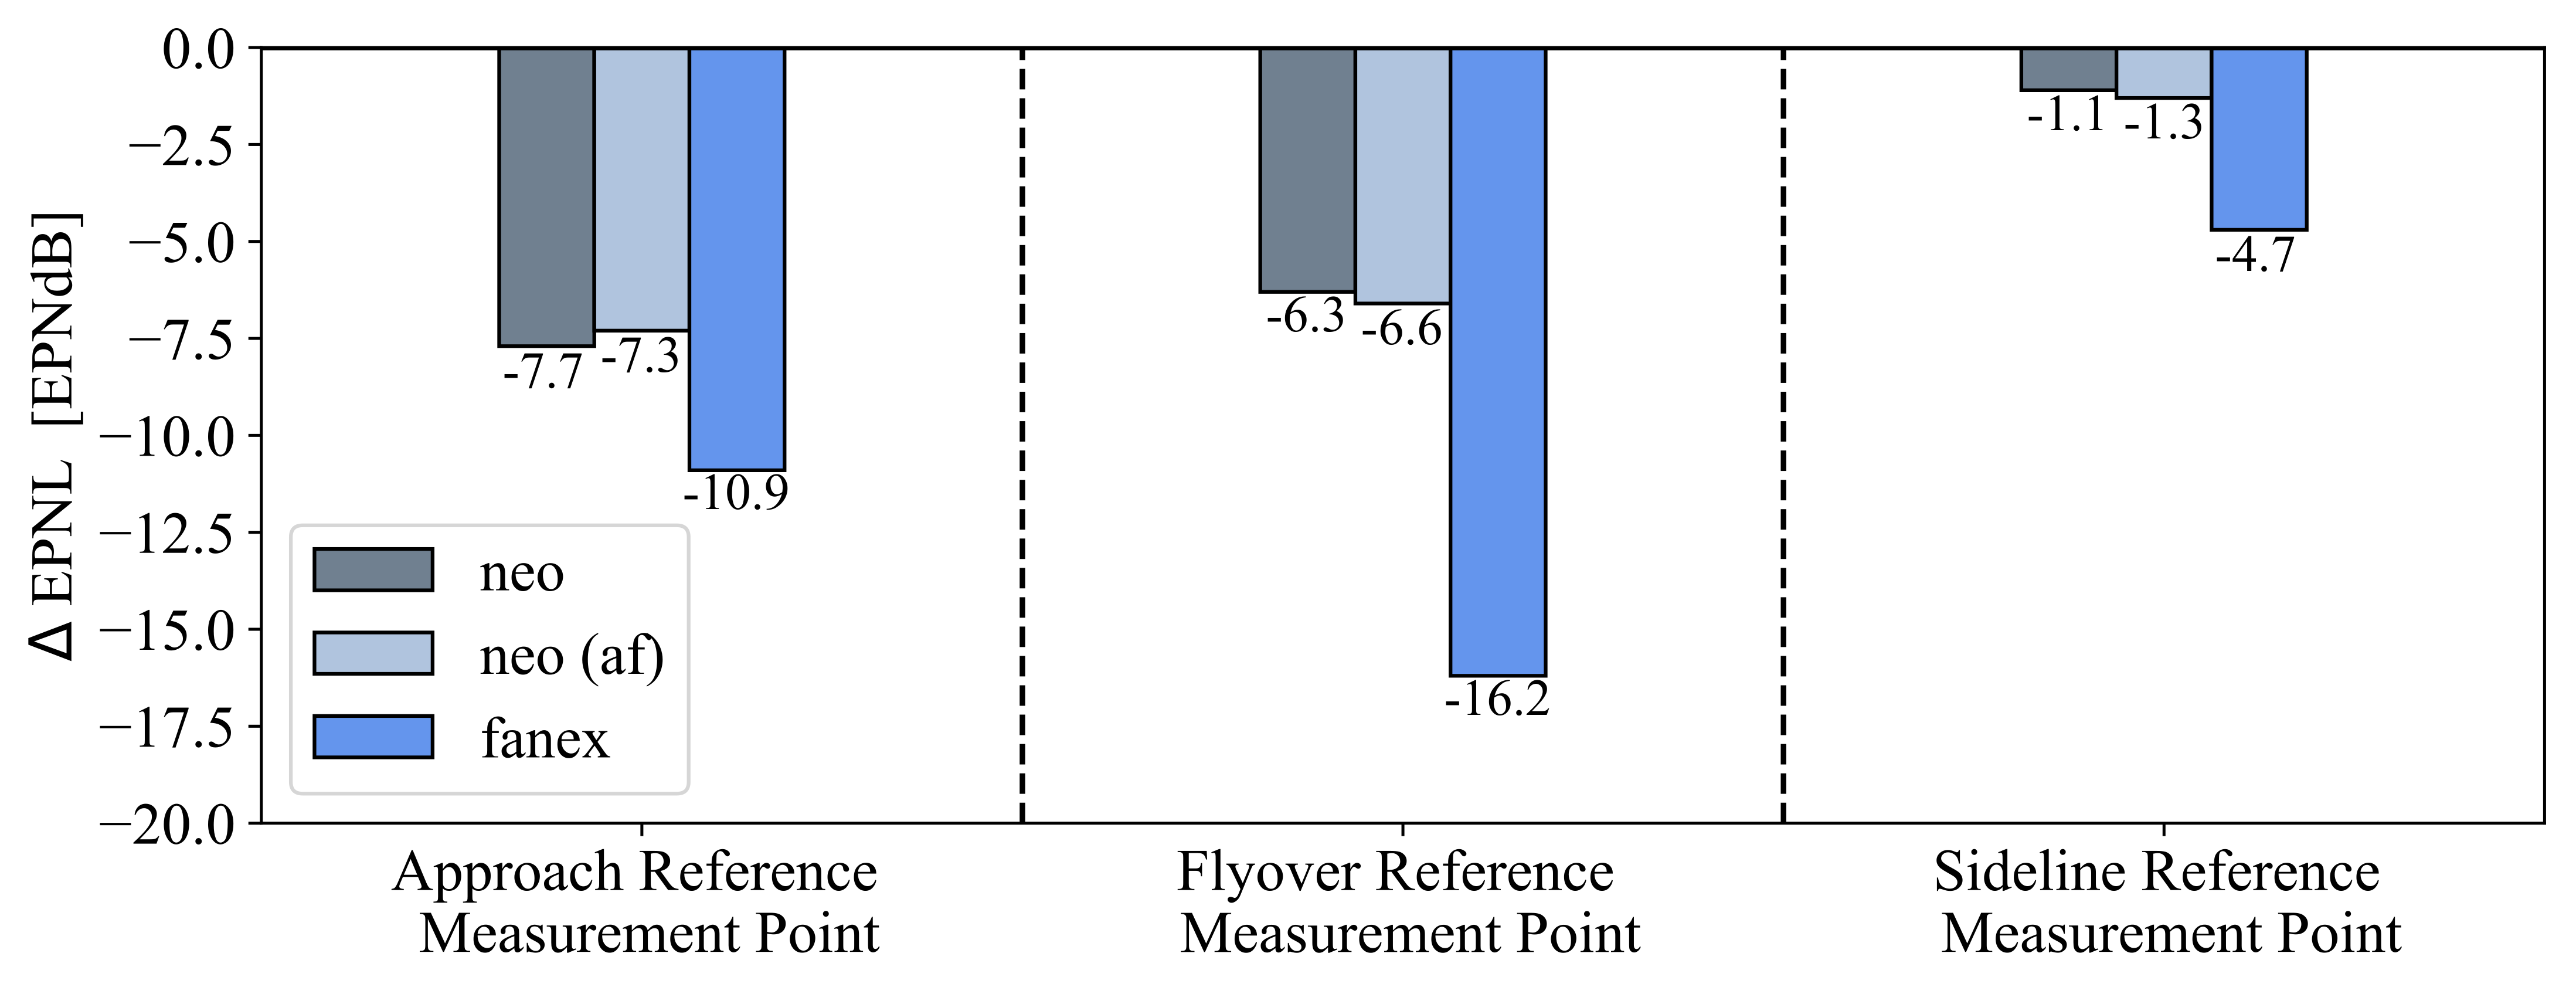
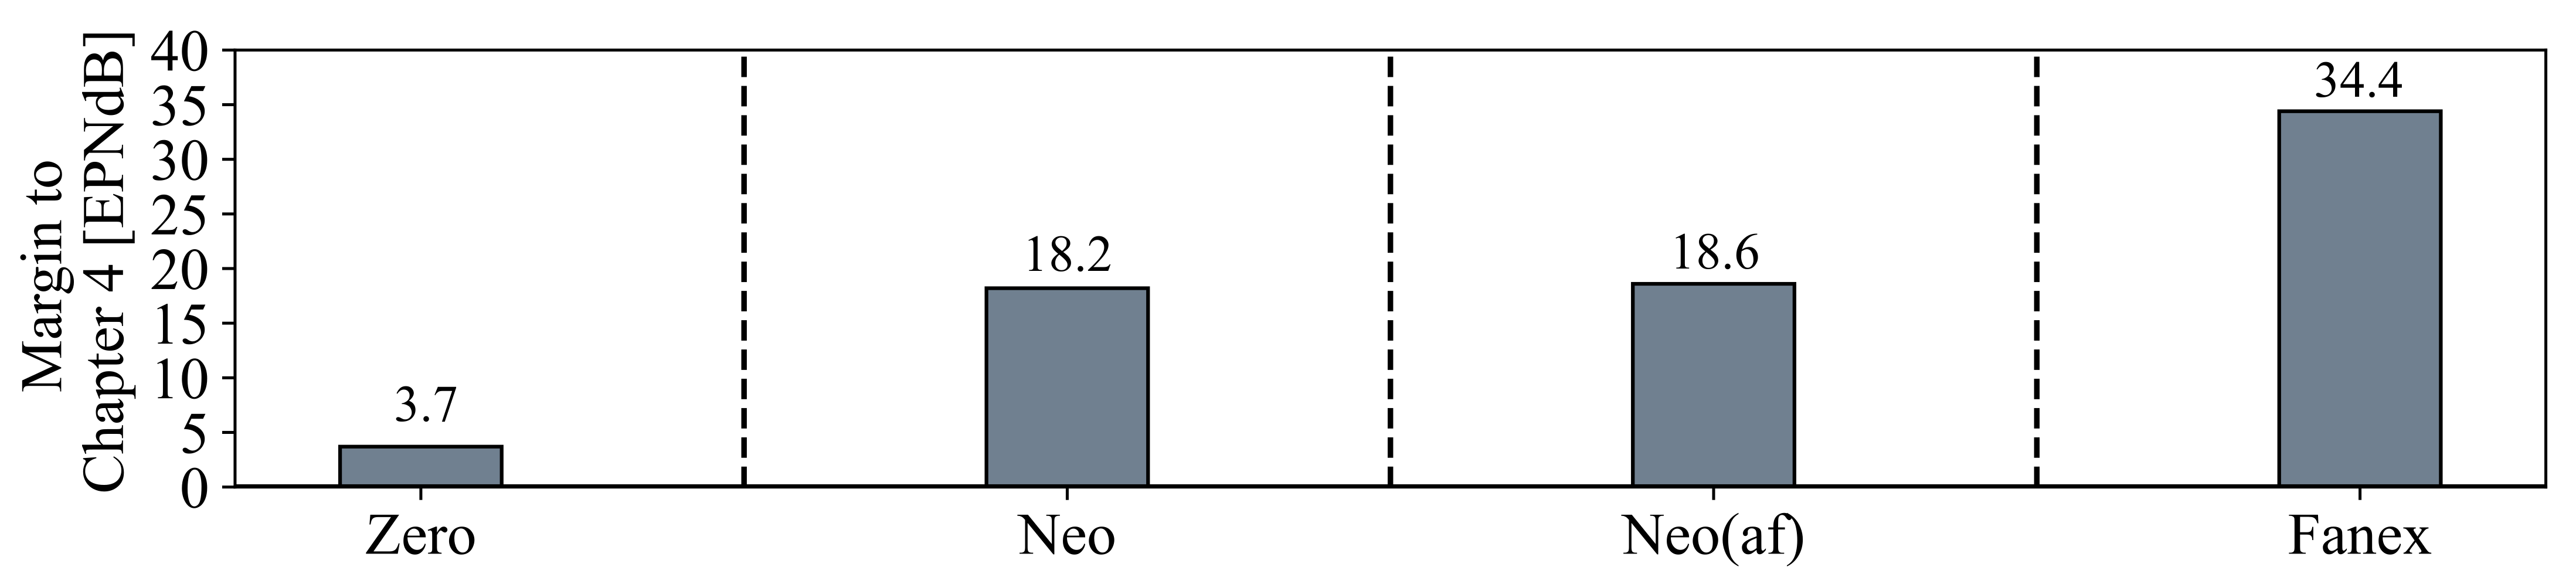
5.1. Novel Aircraft Concepts
5.2. Towards Certification Regulations for Supersonic Transport Aircraft
6. Discussion and Conclusions
7. Outlook
Author Contributions
Funding
Data Availability Statement
Acknowledgments
Conflicts of Interest
Abbreviations
| C | sound correction, penalty |
| CAS | calibrated airspeed |
| EPNL | Effective Perceived Noise level |
| FDR | Flight Data Recorder |
| FLIPNA | Flightpath for Noise Analysis |
| ICAO | International Civil Aviation Organization |
| MLM | Maximum landing mass |
| MTOM | Maximum takeoff mass |
| n | Perceived Noisiness as a function of time and frequency |
| N | Total Perceived Noisiness as a function of time |
| PANAM | Parametric Aircraft Noise Analysis Module, DLR software |
| PNL | Perceived Noise Level as a function of time |
| PNLT | Tone Corrected Perceived Noise Level as a function of time |
| PNLTM | maximum of Tone Corrected Perceived Noise Level |
| PrADO | Preliminary Aircraft Design and Optimization Program |
| SAE | Society of Automotive Engineers |
| SPL | Sound Pressure Level as a function of time |
| SST | Supersonic Transport |
| Variables: | |
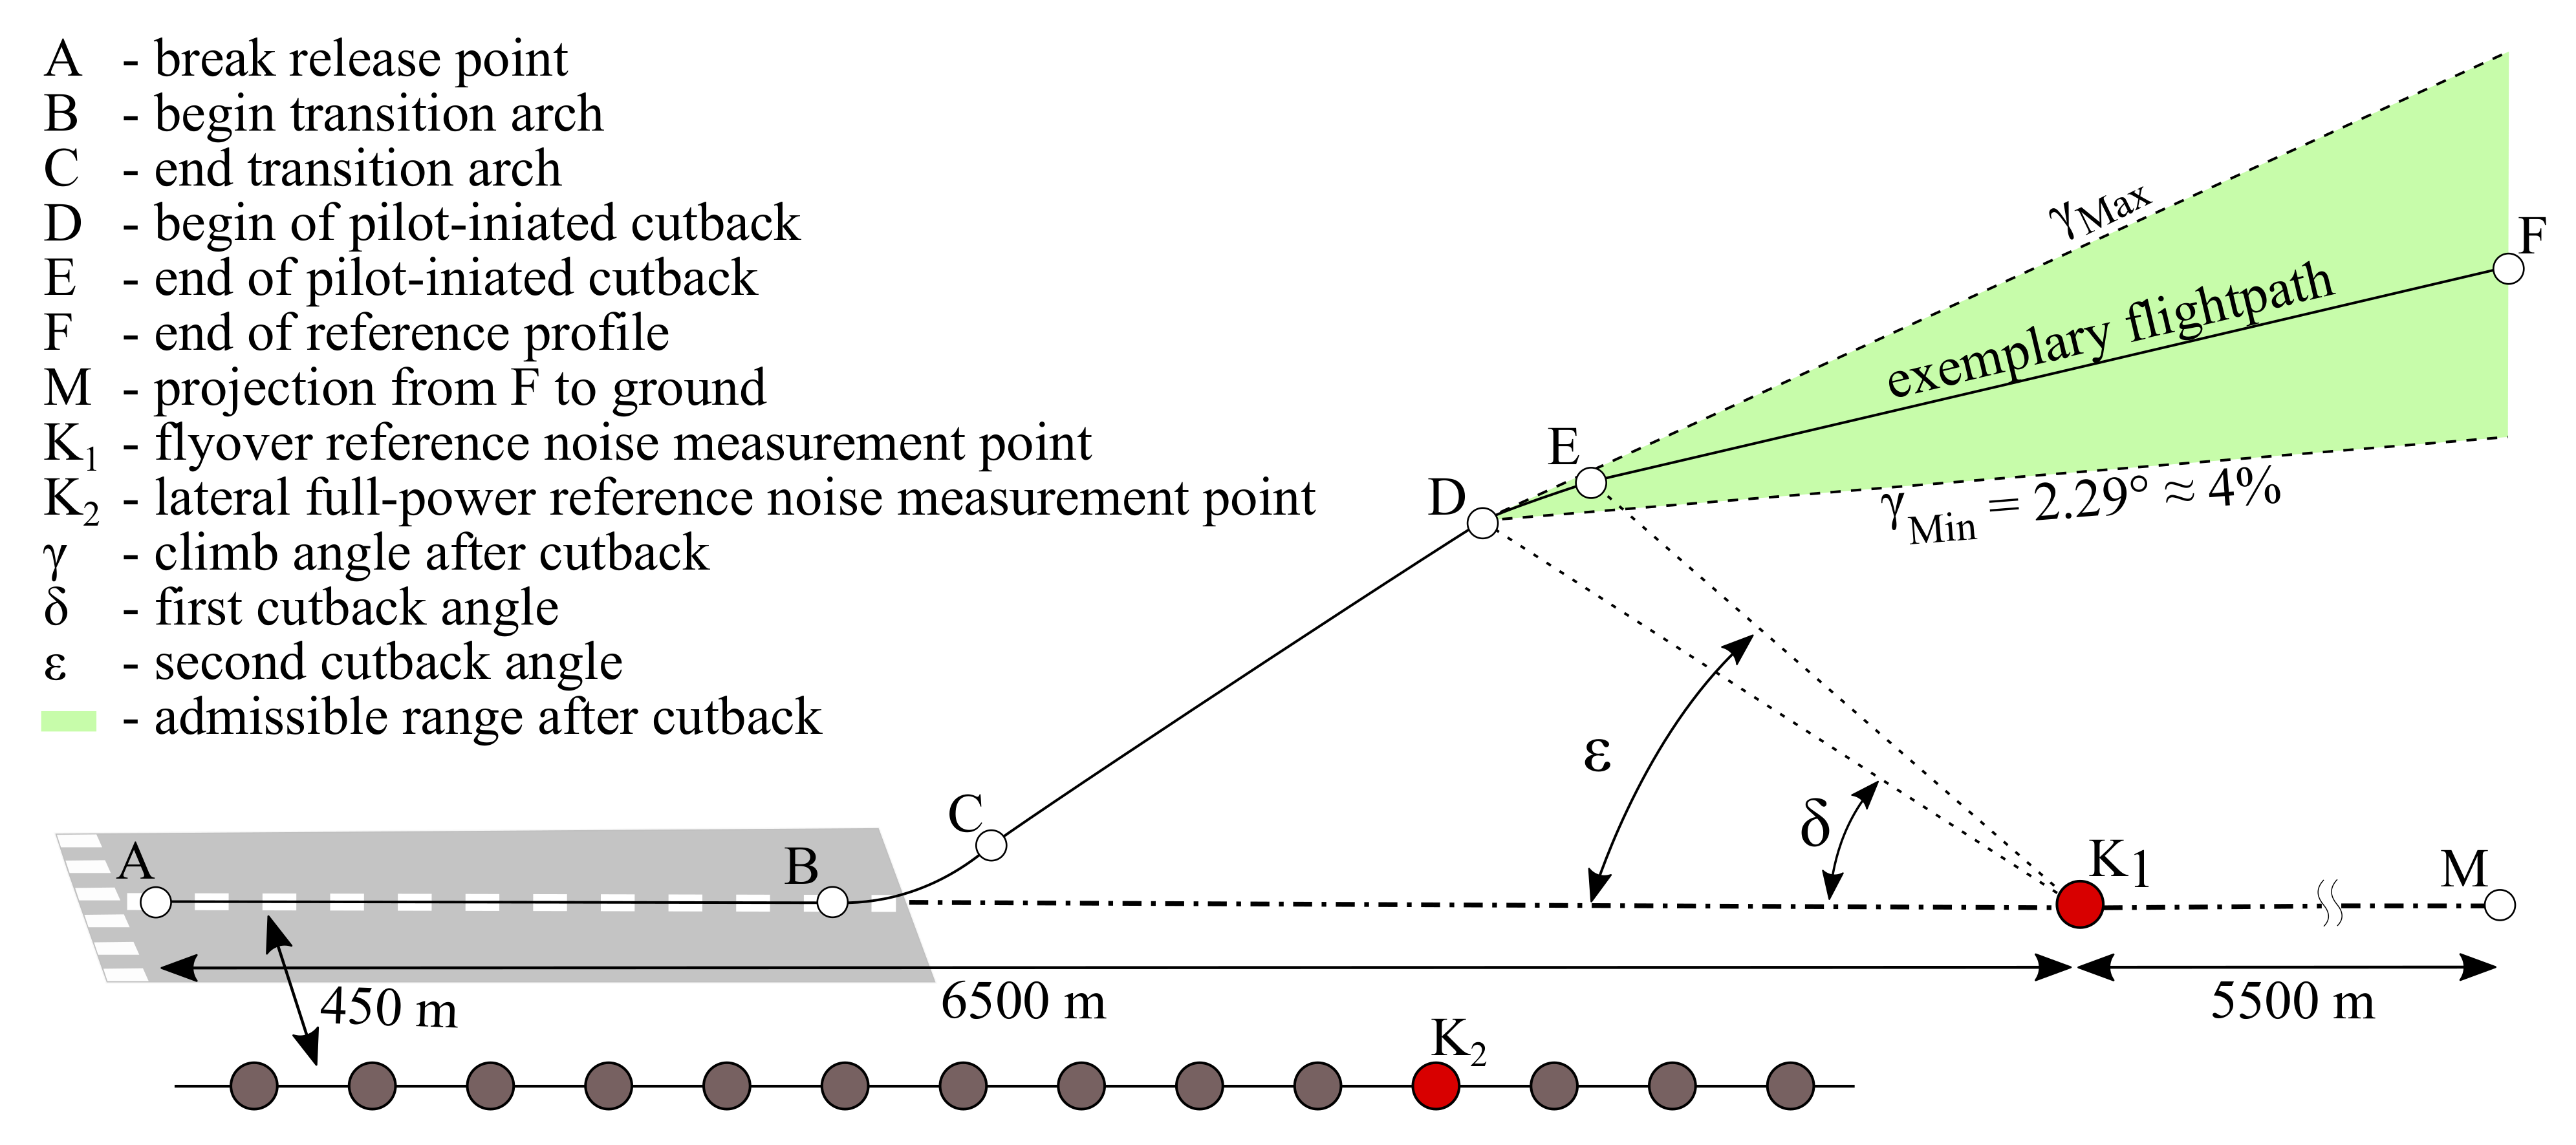
| A | break release point |
| B | begin transition arch |
| B’ | begin transition arch (SST regulations) |
| C | end transition arch |
| C’ | end transition arch (SST regulations) |
| D | begin of pilot-iniated cutback |
| D’ | begin of pilot-iniated cutback (SST regulations) |
| E | end of pilot-iniated cutback |
| F | end of reference profile |
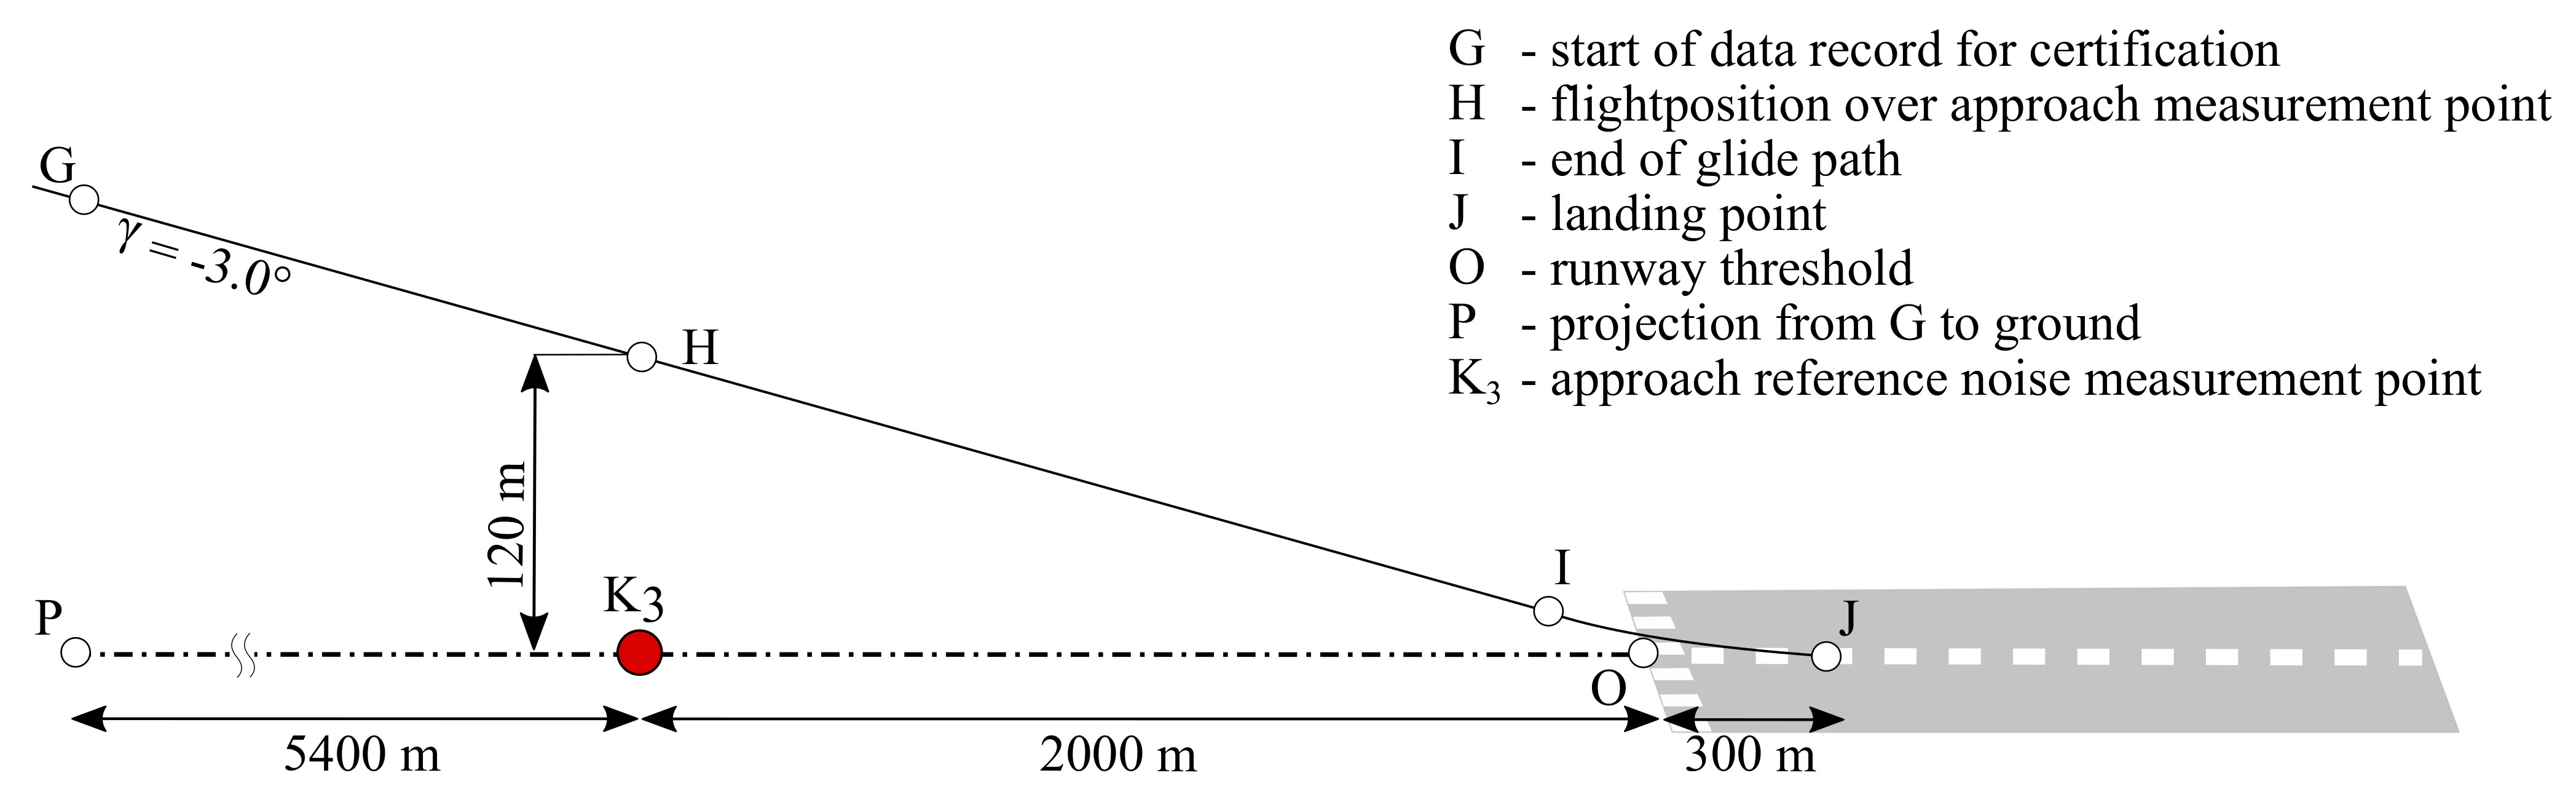
| G | start of data record for certification |
| H | flightposition over approach measurement point |
| I | end of glide path |
| J | landing point |
| K | flyover reference noise measurement point |
| K | lateral full-power reference noise measurement point |
| K | approach reference noise measurement point |
| M | projection from F to ground |
| O | runway threshold |
| P | projection from G to ground |
| climb angle | |
| first cutback angle | |
| ′ | modified first cutback angle (SST regulations) |
| second cutback angle | |
| ′ | modified second cutback angle (SST regulations) |
Appendix A
References
- Bertsch, L. Noise Prediction within Conceptual Aircraft Design; Technical Report DLR-FB-2013-20; Deutsches Zentrum für Luft- und Raumfahrt (DLR): Göttingen, Germany, 2013. [Google Scholar] [CrossRef]
- Bertsch, L.; Wolters, F.; Heinze, W.; Pott-Pollenske, M.; Blinstrub, J. System Noise Assessment of a Tube-and-Wing Aircraft with Geared Turbofan Engines. AIAA J. Aircr. 2019, 56, 1577–1596. [Google Scholar] [CrossRef]
- International Civil Aviation Organization (ICAO). Environmental Protection. Annex 16 to the Convention on International Civil Aviation. Vol. I, Aircraft Noise, 5th ed.; Technical Report Annex 16; ICAO: Montreal, QC, Canada, 2008; Volume I. [Google Scholar]
- Berton, J.; Envia, E.; Burley, C. An analytical assessment of NASA’s N+ 1 subsonic fixed wing project noise goal. In Proceedings of the 15th AIAA/CEAS Aeroacoustics Conference (30th AIAA Aeroacoustics Conference), Miami, FL, USA, 11–13 May 2010; p. 3144. [Google Scholar]
- Rizzi, S.A.; Burley, C.L.; Thomas, R.H. Auralization of NASA N+ 2 aircraft concepts from system noise predictions. In Proceedings of the 22nd AIAA/CEAS Aeroacoustics Conference, Lyon, France, 30 May–1 June 2016; p. 2906. [Google Scholar]
- Guo, Y.; Thomas, R.H.; Clark, I.A.; June, J.C. Far-Term Noise Reduction Roadmap for the Midfuselage Nacelle Subsonic Transport. AIAA J. Aircr. 2019, 56. [Google Scholar] [CrossRef]
- June, J.; Thomas, R.; Guo, Y. System Noise Prediction Uncertainty Quantification for a Hybrid Wing–Body Transport Concept. AIAA J. Aircr. 2020, 58, 1157–1170. [Google Scholar] [CrossRef]
- Nöding, M. Virtuelle Lärmzertifizierung im Flugzeugvorentwurf. Master’s Thesis, Deutsches Zentrum für Luft- und Raumfahrt (DLR), Göttingen, Germany, 2020. [Google Scholar]
- Nöding, M.; Bertsch, L. Beitrag zu einer virtuellen Lärmzertifizierung im Flugzeugvorentwurf. In Deutscher Luft- und Raumfahrtkongress; DLRK: Virtual Conference, 2020. [Google Scholar]
- ICAO Annex 16: Environmental Protection, Volume I—Aircraft Noise; International Civil Aviation Organization (ICAO): Montreal, QC, Canada, 2011.
- ICAO: Environmental Technical Manual, Volume I—Procedures for the Noise Certification of Aircraft; International Civil Aviation Organization (ICAO): Montreal, QC, Canada, 2018.
- Heinze, W. Beitrag zur Quantitativen Analyse der Technischen und Wirtschaftlichen Auslegungsgrenzen Verschiedener Flugzeugkonzepte für den Transport Grosser Nutzlasten; Technical Report ZLR-Forschungsbericht; ZLR: Braunschweig, Germany, 1994; ISBN 3-928628-14-3. [Google Scholar]
- Deidewig, F. Ermittlung der Schadstoffemissionen im Unter- und Ueberschallflug; Technical Report; DLR: Cologne, Germany, 1998. [Google Scholar]
- Blinstrub, J. Immission-Based Noise Reduction within Conceptual Aircraft Design; Technical Report DLR-FB-2019-12; Deutsches Zentrum für Luft- und Raumfahrt (DLR): Göttingen, Germany, 2019. [Google Scholar]
- Dobrzynski, W.; Chow, L.; Guion, P.; Shiells, D. A European Study on Landing Gear Airframe Noise Sources. In Proceedings of the 6th AIAA/CEAS Aeroacoustics Conference, Lahaina, HI, USA, 12–14 June 2000. [Google Scholar] [CrossRef]
- Dobrzynski, W.; Pott-Pollenske, M. Slat Noise Source Studies for Farfield Noise Prediction. In Proceedings of the 7th AIAA/CEAS Aeroacoustics Conference, Maastricht, The Netherlands, 28–30 May 2001. [Google Scholar] [CrossRef]
- Pott-Pollenske, M.; Dobrzynski, W.; Buchholz, H.; Gehlhar, B.; Walle, F. Validation of Semiempirical Airframe Noise prediction Method through Dedicated A319 Flyover Noise Measurements. In Proceedings of the 8th AIAA/CEAS Aeroacoustics Conference, Breckenridge, CO, USA, 17–19 June 2002. [Google Scholar] [CrossRef]
- Rossignol, K.S. Development of an empirical prediction model for flap side-edge noise. In Proceedings of the 16th AIAA/CEAS Aeroacoustics Conference, Stockholm, Sweden, 7–9 June 2010. [Google Scholar] [CrossRef]
- Rossignol, K.S. Empirical Prediction of Airfoil Tip Noise. In Proceedings of the 17th AIAA/CEAS Aeroacoustics Conference, Portland, OR, USA, 5–8 June 2011. [Google Scholar] [CrossRef] [Green Version]
- Heidmann, M. Interim Prediction Method for Fan and Compressor Source Noise; Technical Report NASA TMX-71763; NASA Langley Research Center: Langley, VA, USA, 1979. [Google Scholar]
- Stone, J.; Groesbeck, D.; Zola, C. Conventional profile coaxial jet noise prediction. AIAA J. 1983, 21, 336–342. [Google Scholar] [CrossRef]
- Lummer, M. Maggi-Rubinowicz Diffraction Correction for Ray-Tracing Calculations of Engine Noise Shielding. In Proceedings of the 14th AIAA/CEAS Aeroacoustics Conference, Vancouver, BC, Canada, 5–7 May 2008. [Google Scholar] [CrossRef]
- International Organization for Standardization (ISO). Acoustics—Attenuation of Sound during Propagation Outdoors. Part 1: Calculation of the Absorption of Sound by the Atmosphere; Technical Report ISO 9613-1:1993; ISO: Geneva, Switzerland, 1993. [Google Scholar]
- Society of Automotive Engineers. Prediction Method for Lateral Attenuation of Airplane Noise during Takeoff and Landing; Society of Automotive Engineers: Warrendale, PA, USA, 1981. [Google Scholar]
- Smith, M. Aircraft Noise; Cambridge Aerospace Series; Cambridge University Press: Cambridge, UK, 2004; ISBN 0-521-61699-9. [Google Scholar]
- Bertsch, L.; Sanders, L.; Thomas, R.H.; LeGriffon, I.; June, J.C.; Clark, I.A.; Lorteau, M. Comparative Assessment of Aircraft System Noise Simulation. AIAA J. Aircr. 2021, 1–18. [Google Scholar] [CrossRef]
- Bertsch, L.; Schäfer, B.; Guerin, S. Uncertainty analysis for parametric aircraft system noise prediction. AIAA J. Aircr. 2019, 56, 529–544. [Google Scholar] [CrossRef]
- Boden, B.; Flink, J.; Mischke, R.; Schaffert, K.; Weinert, A.; Wohlan, A.; Schreiber, A. RCE: An Integration Environment for Engineering and Science. SoftwareX 2021, 15, 100759. [Google Scholar] [CrossRef]
- EASA Jet Aeroplane Noise Database for Certification. Available online: https://www.easa.europa.eu/domains/environment/easa-certification-noise-levels (accessed on 17 April 2021).
- Thomas, J.L.; Hansman, R.J. Framework for Analyzing Aircraft Community Noise Impacts of Advanced Operational Flight Procedures. AIAA J. Aircr. 2019, 56, 1407–1417. [Google Scholar] [CrossRef]
- Pott-Pollenske, M.; Dobrzynski, W.; Buchholz, H.; Guérin, S.; Saueressig, G.; Finke, U. Airframe Noise Characteristics from Flyover Measurements and Prediction. In Proceedings of the 12th AIAA/CEAS Aeroacoustics Conference, Cambridge, MA, USA, 8–10 May 2006. [Google Scholar] [CrossRef]
- Deutsches Zentrum für Luft- und Raumfahrt e.V. (DLR). Leiser Flugverkehr II—Abschlussbericht; Resreport; Deutsches Zentrum für Luft- und Raumfahrt e.V.: Göttingen, Germany, 2007. [Google Scholar]
- Pott-Pollenske, M.; Wild, J.; Bertsch, L. Aerodynamic and Acoustic Design of Silent Leading Edge Devices. In Proceedings of the 20th AIAA/CEAS Aeroacoustics Conference, Atlanta, GA, USA, 16–20 June 2014. [Google Scholar] [CrossRef]
- Wicke, K.; Bertsch, L. SLED—Silent Leading Edge Devices—Abschlussbericht zum Flugzeugentwurf und der Systemanalyse; DLR Institutsbericht IB-328-2013-30; Deutsches Zentrum fuer Luft- und Raumfahrt: Hamburg, Germany, 2014. [Google Scholar]
- Department of Transportation and Federal Aviation Administration. Noise Certification of Supersonic Airplanes; Technical Report; Federal Register, Notice of Proposed Rulemaking (NPRM): Washington, DC, USA, 2021; Volume 85, pp. 20431–20447. Available online: https://www.govinfo.gov/content/pkg/FR-2020-04-13/pdf/2020-07039.pdf (accessed on 20 November 2020).
- Berton, J.J.; Huff, D.L.; Geiselhart, K.; Seidel, J. Supersonic Technology Concept Aeroplanes for Environmental Studies. In Proceedings of the AIAA Scitech 2020 Forum, Orlando, FL, USA, 6–10 January 2020; p. 0263. [Google Scholar]
- Rizzi, S.A.; Berton, J.J.; Tuttle, B.C. Auralization of a Supersonic Business Jet Using Advanced Takeoff Procedures. In Proceedings of the AIAA Scitech 2020 Forum, Orlando, FL, USA, 6–10 January 2020; p. 0266. [Google Scholar]
- Shaw, R.J.; Hines, R.; Gilkey, S. Engine Technology Challenges for a 21st Century High-Speed Civil Transport. In Proceedings of the International Symposium on Air Breathing Engines, Tokyo, Japan, 20–24 September 1993. [Google Scholar]
- Jackson, E.B. Piloted Simulation Assessment of a High-Speed Civil Transport Configuration; NASA Langley Research Center: Langley, VA, USA, 2002. [Google Scholar]
- Huff, D.L.; Henderson, B.S.; Berton, J.J.; Seidel, J.A. Perceived noise analysis for offset jets applied to commercial supersonic aircraft. In Proceedings of the 54th AIAA Aerospace Sciences Meeting, San Diego, CA, USA, 4–8 January 2016; p. 1635. [Google Scholar]
- Bertsch, L.; Looye, G.; Anton, E.; Schwanke, S. Flyover Noise Measurements of a Spiraling Noise Abatement Approach Procedure. AIAA J. Aircr. 2011, 48, 436–448. [Google Scholar] [CrossRef] [Green Version]


| Noise Source/Element | Model |
|---|---|
| airframe noise models (airf) | |
| trailing edge | DLR [1,15,16,17,18,19] |
| leading edge | DLR [1,15,16,17] |
| main landing gear | DLR [1,15,16,17] |
| nose landing gear | DLR [1,15,16,17] |
| engine noise models (eng) | |
| fan broadband & tonal | modified Heidmann [20] |
| jet | modified Stone [21] |
| noise shielding effects (PAA) | |
| - | SHADOW [22] |
| sound propagation effects | |
| - | ISO 9613 [23] |
| ground attenuation effects | |
| - | SAE AIR 1751 [24] |
| Parameter | Unit | A319-100 | B747-400 |
|---|---|---|---|
| maximum takeoff mass | kg | 68,000 | 396,893 |
| maximum landing mass | kg | 61,000 | 285,783 |
| overall length | m | 33.84 | 70.60 |
| overall height | m | 12.14 | 19.41 |
| engine type | - | CFM56-5A5 | CF6-80-C2-B5F |
| number of engines | - | 2 | 4 |
| static thrust per engine at sea level | N | 104,043 | 272,530 |
| bypass ratio | - | 6 | 5 |
| span | - | 33.94 | 64.40 |
| wing reference area | m | 122.6 | 561.93 |
| v | m/s | 65.51 | 68.65 |
| v | m/s | 70.78 | 73.93 |
| v | m/s | 75.13 to 80.13 | 87.90 to 92.89 |
| h | m | 300 | 210 |
| Observer Point | A/C | Simulation EPNL [EPNdB] | EASA EPNL [EPNdB] | Delta [EPNdB] |
|---|---|---|---|---|
| Flyover | A319-100 | 86.6 | 83.6 | +3.0 |
| Lateral | A319-100 | 90.7 | 93.9 | −3.2 |
| Approach | A319-100 | 96.3 | 94.5 | +1.8 |
| Flyover | B747-400 | 99.4 | 96.6 | +2.8 |
| Lateral | B747-400 | 101.0 | 100.2 | +0.8 |
| Approach | B747-400 | 104.1 | 103.3 | +0.8 |
| A/C | Description | MTOM [t] | MLM [t] | Takeoff Speed [m/s] | Landing Speed [m/s] |
|---|---|---|---|---|---|
| zero | Reference aircraft with reference engines | 83,548 | 72,082 | 67.86 | 63.17 |
| neo | Reference aircraft with GTF engines | 80,076 | 72,868 | 66.70 | 63.47 |
| neo (af) | Reference aircraft with low noise airframe modifications and GTF engines | 80,092 | 72,881 | 70.06 | 66.88 |
| fanex | Variant of V2 (Reference [1]) with airframe adapted adapted to GTF | 76,218 | 70,187 | 69.35 | 66.67 |
Publisher’s Note: MDPI stays neutral with regard to jurisdictional claims in published maps and institutional affiliations. |
© 2021 by the authors. Licensee MDPI, Basel, Switzerland. This article is an open access article distributed under the terms and conditions of the Creative Commons Attribution (CC BY) license (https://creativecommons.org/licenses/by/4.0/).
Share and Cite
Nöding, M.; Bertsch, L. Application of Noise Certification Regulations within Conceptual Aircraft Design. Aerospace 2021, 8, 210. https://doi.org/10.3390/aerospace8080210
Nöding M, Bertsch L. Application of Noise Certification Regulations within Conceptual Aircraft Design. Aerospace. 2021; 8(8):210. https://doi.org/10.3390/aerospace8080210
Chicago/Turabian StyleNöding, Michel, and Lothar Bertsch. 2021. "Application of Noise Certification Regulations within Conceptual Aircraft Design" Aerospace 8, no. 8: 210. https://doi.org/10.3390/aerospace8080210
APA StyleNöding, M., & Bertsch, L. (2021). Application of Noise Certification Regulations within Conceptual Aircraft Design. Aerospace, 8(8), 210. https://doi.org/10.3390/aerospace8080210