
Structural and Aeroelastic Studies of Wing Model with Metal Additive Manufacturing for Transonic Wind Tunnel Test by NACA 0008 Example


Abstract
:1. Introduction
2. Structural Evaluation
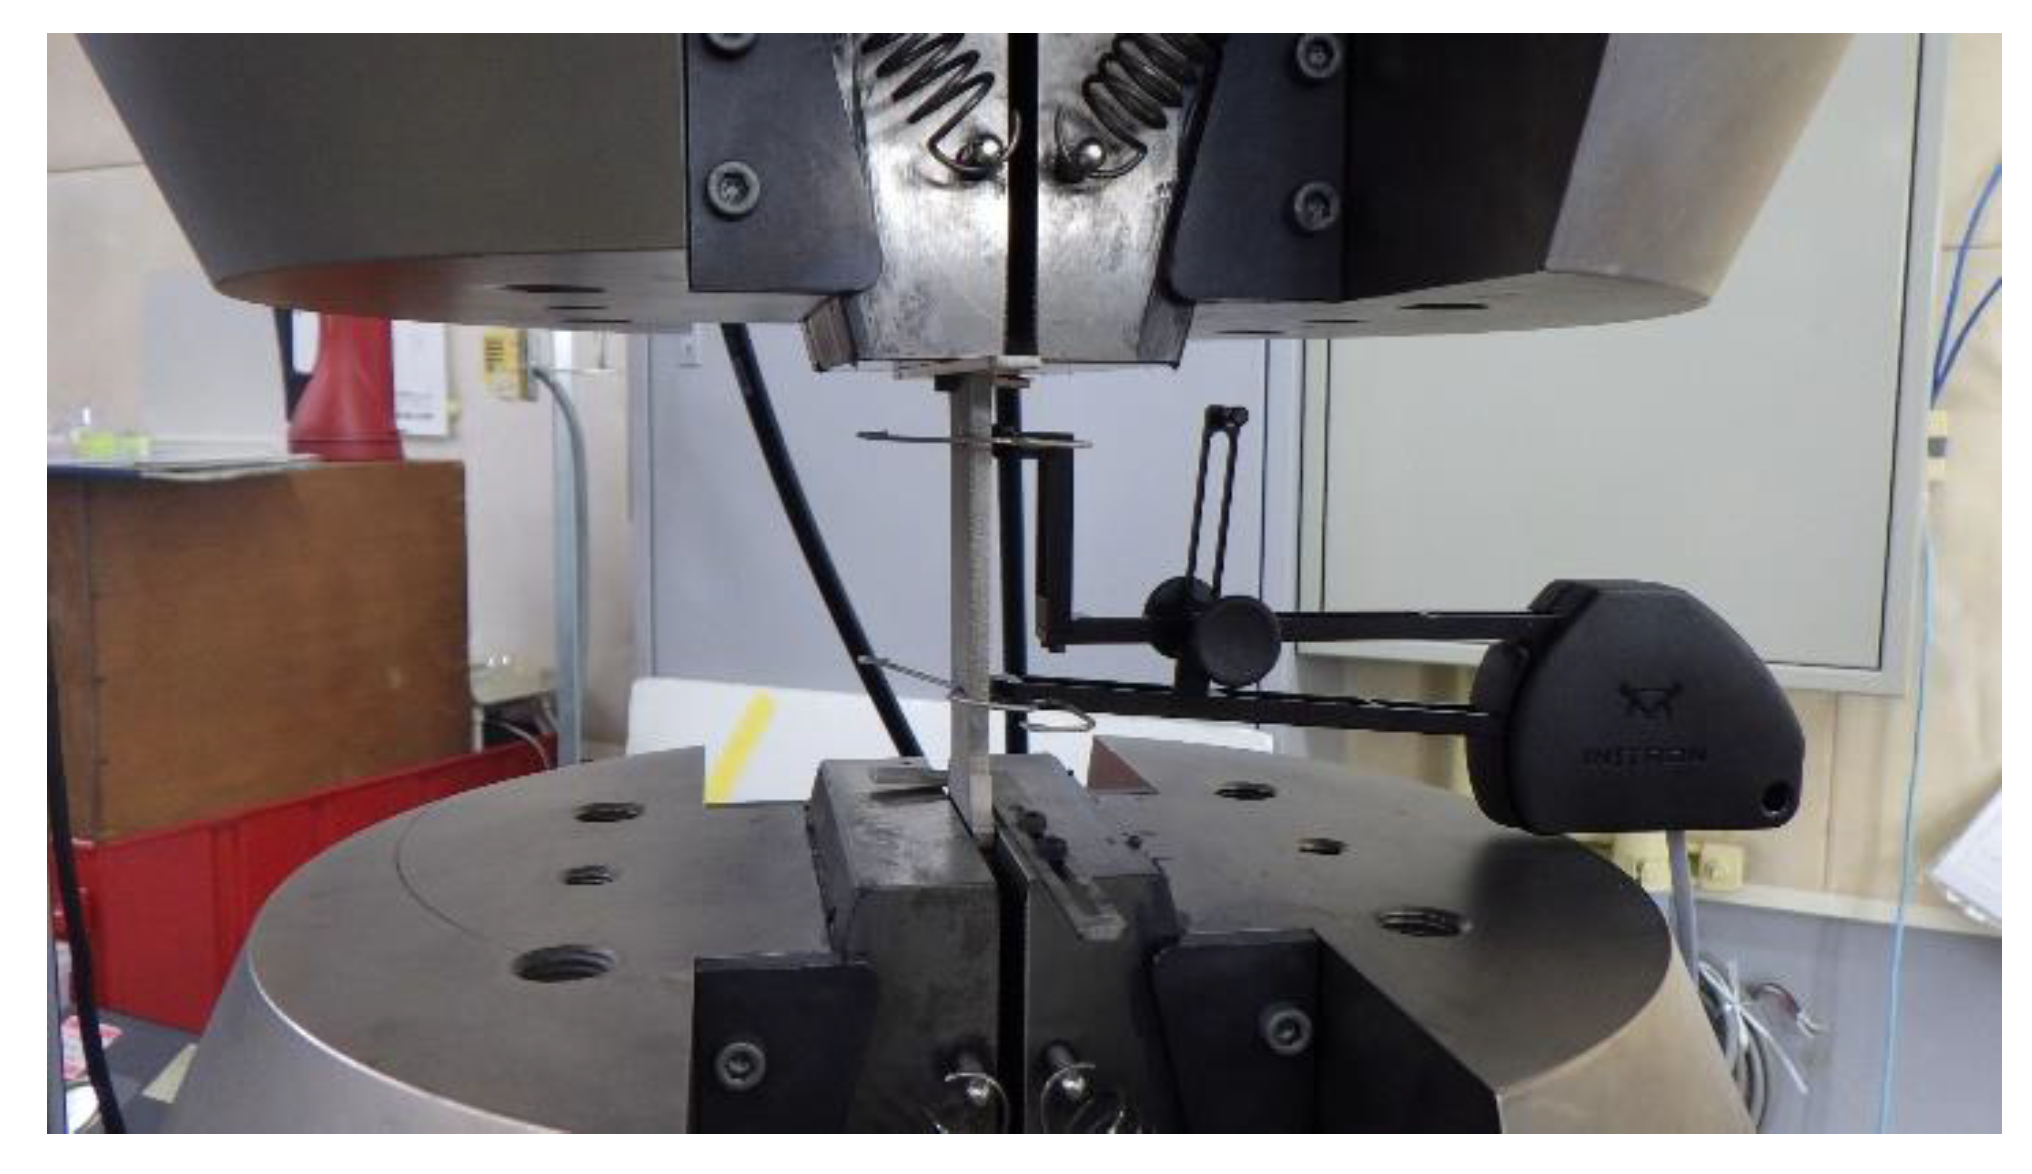
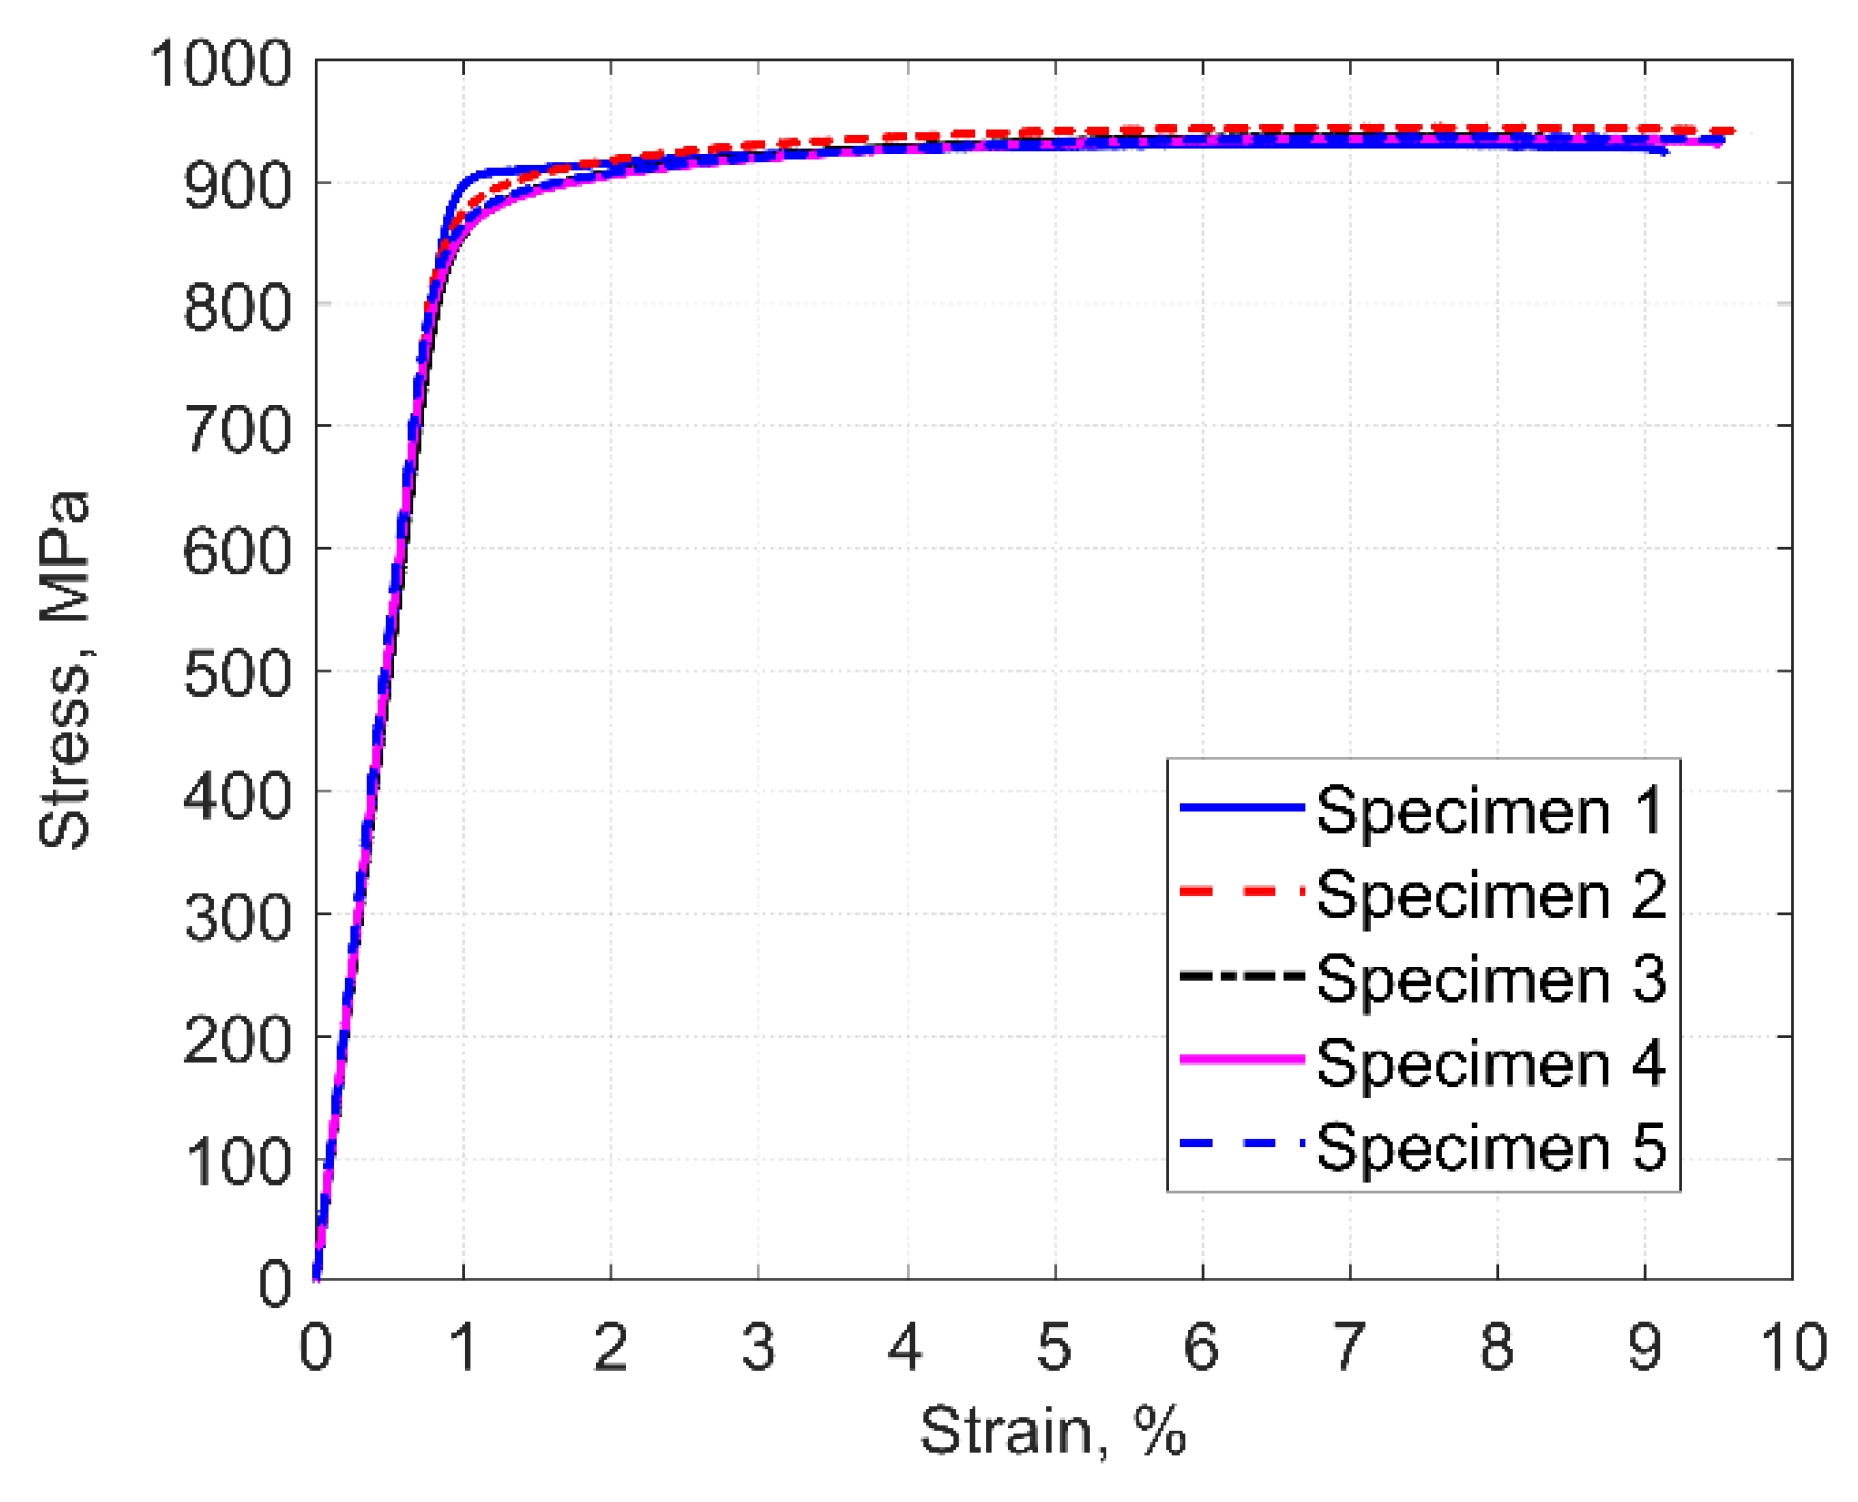
2.1. Structural Evaluation of Metal Additive Manufacturing (AM) Structures
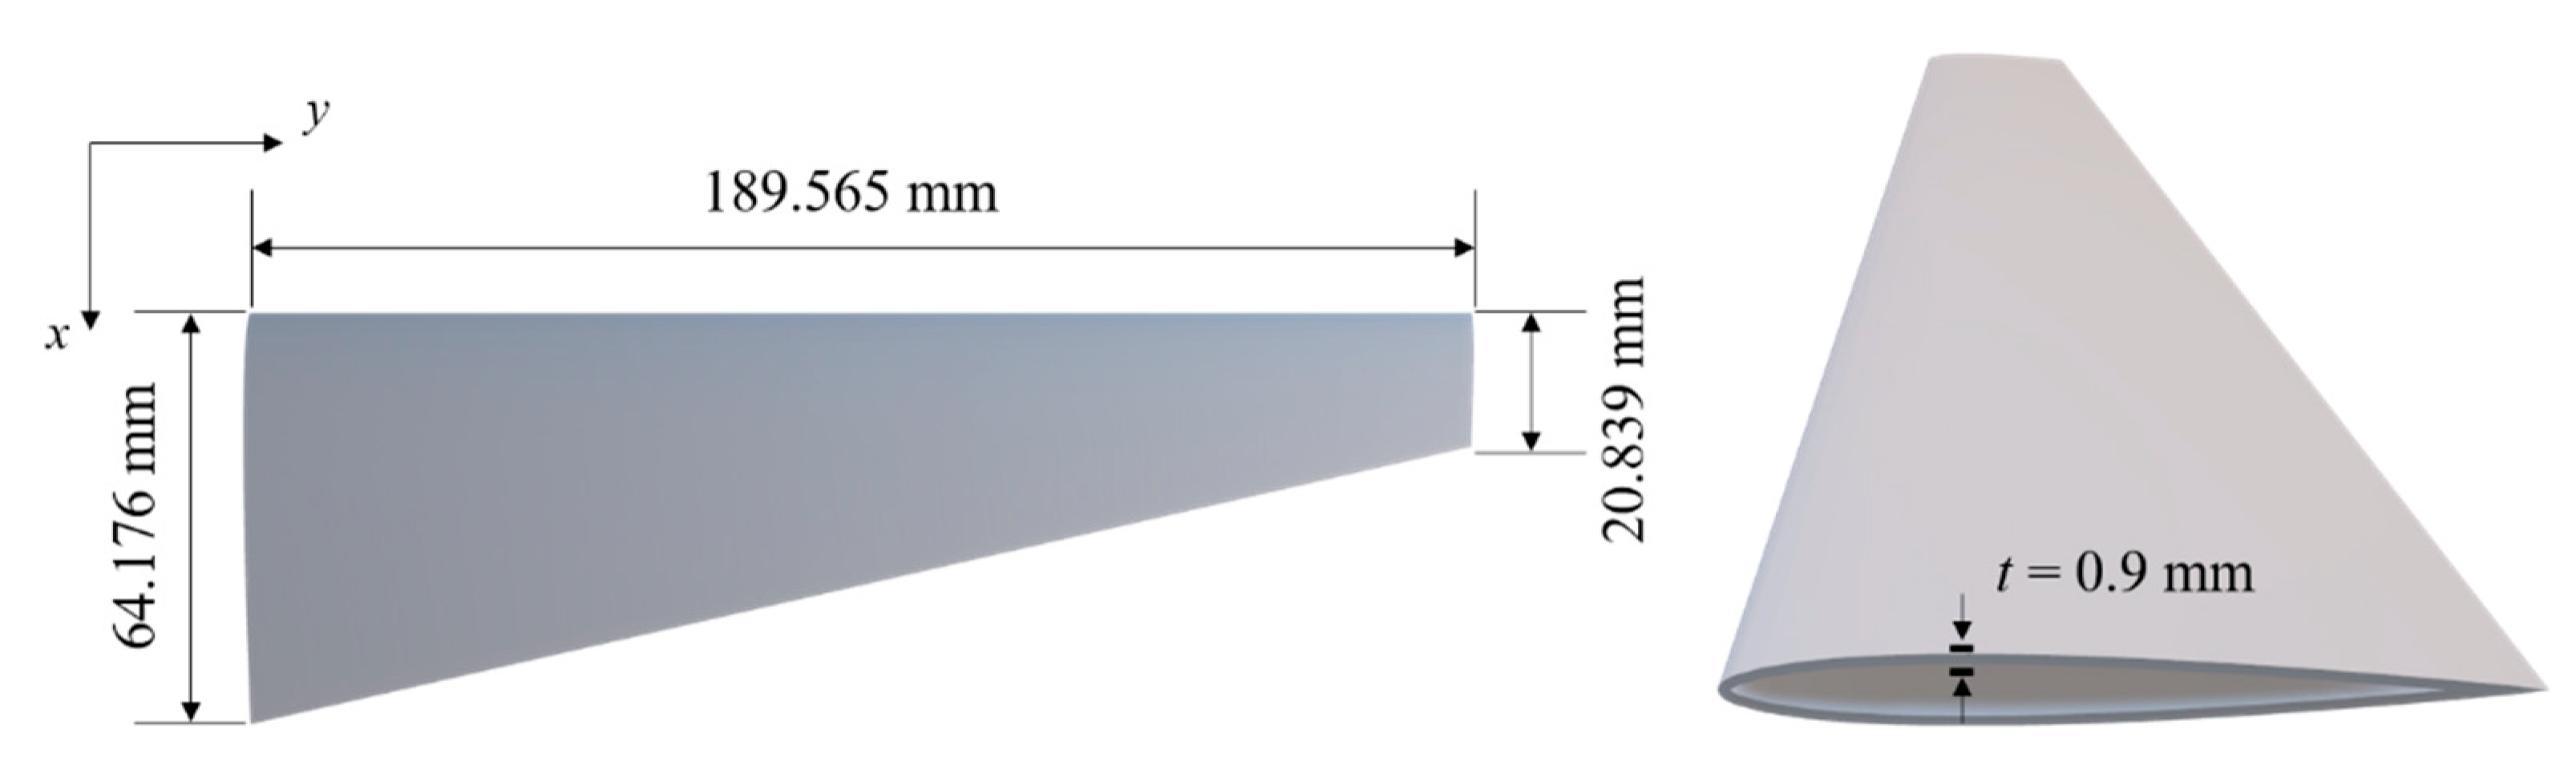
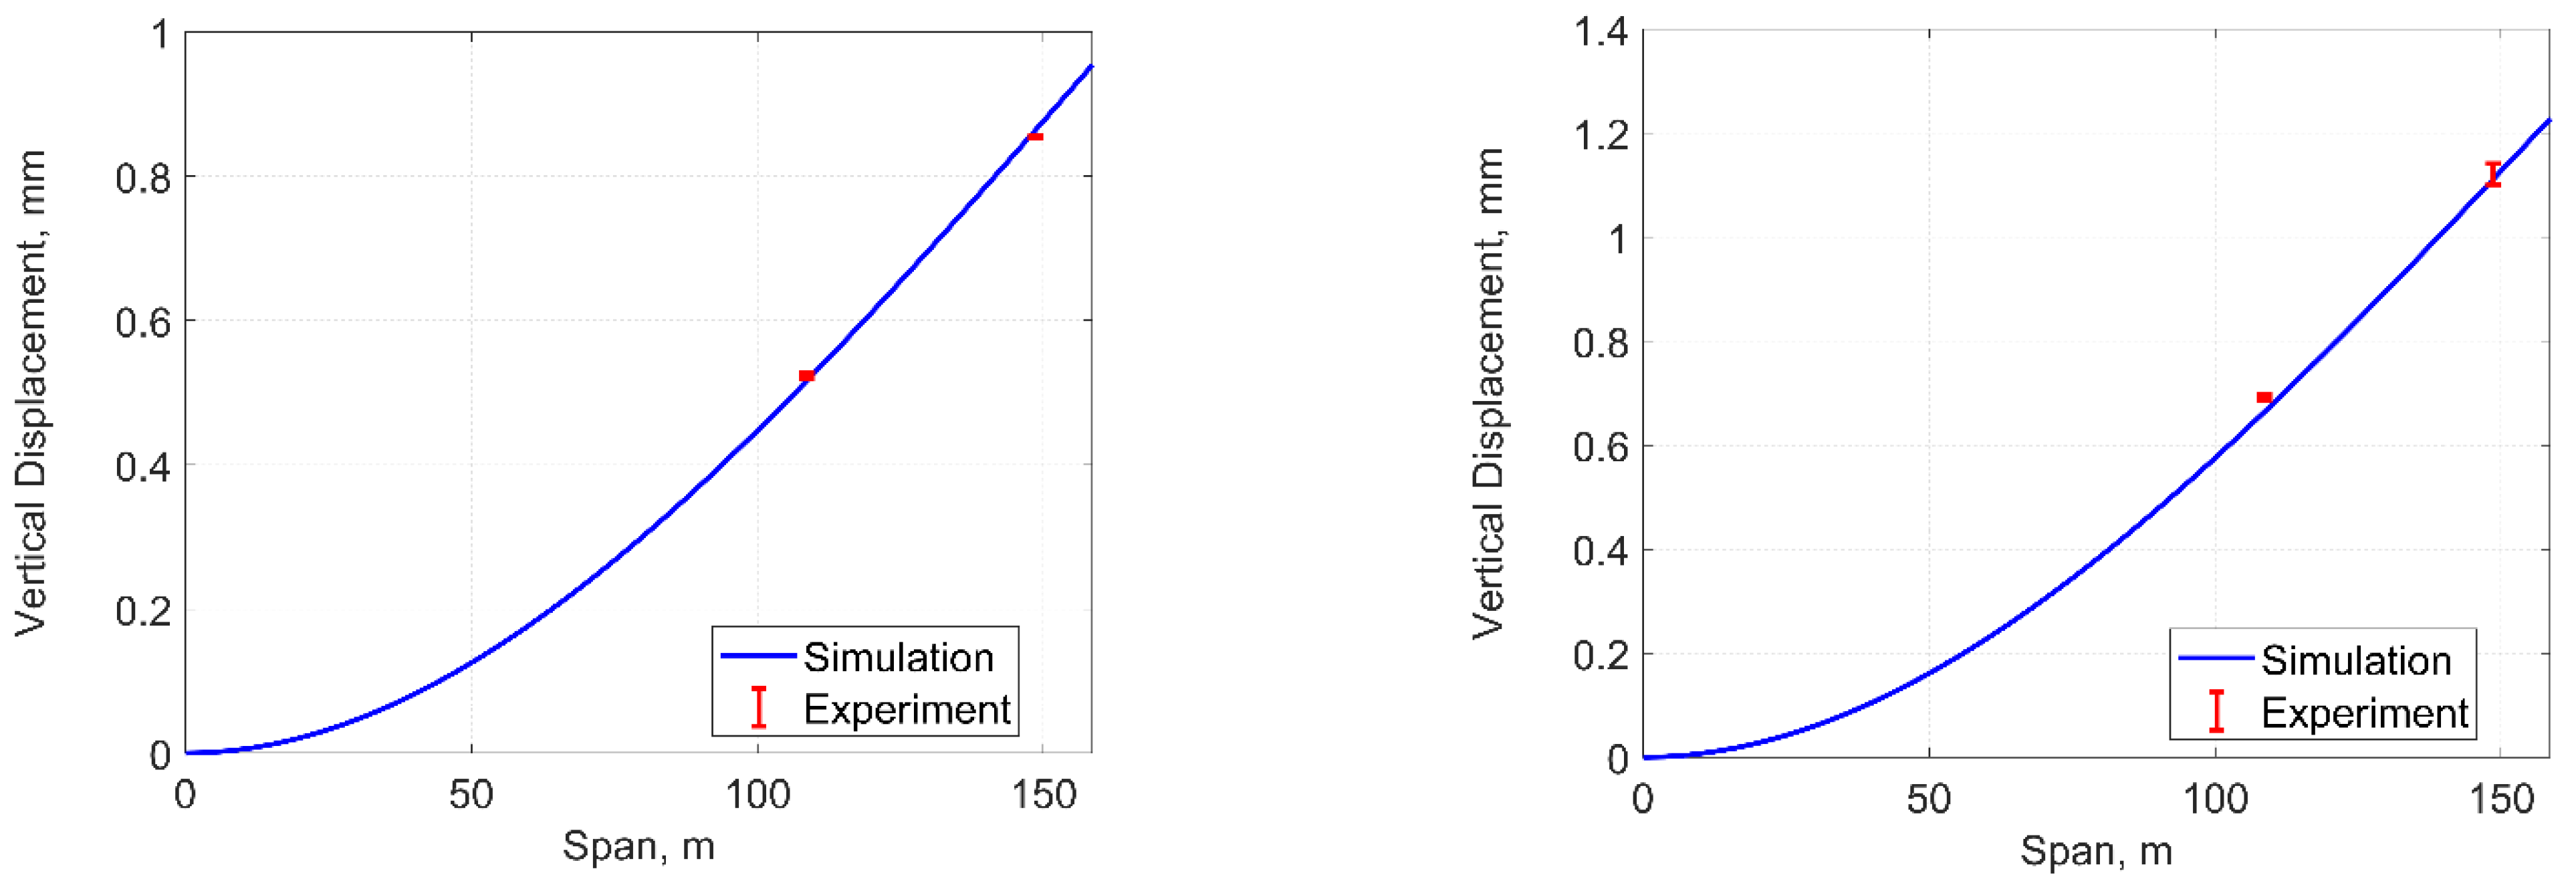
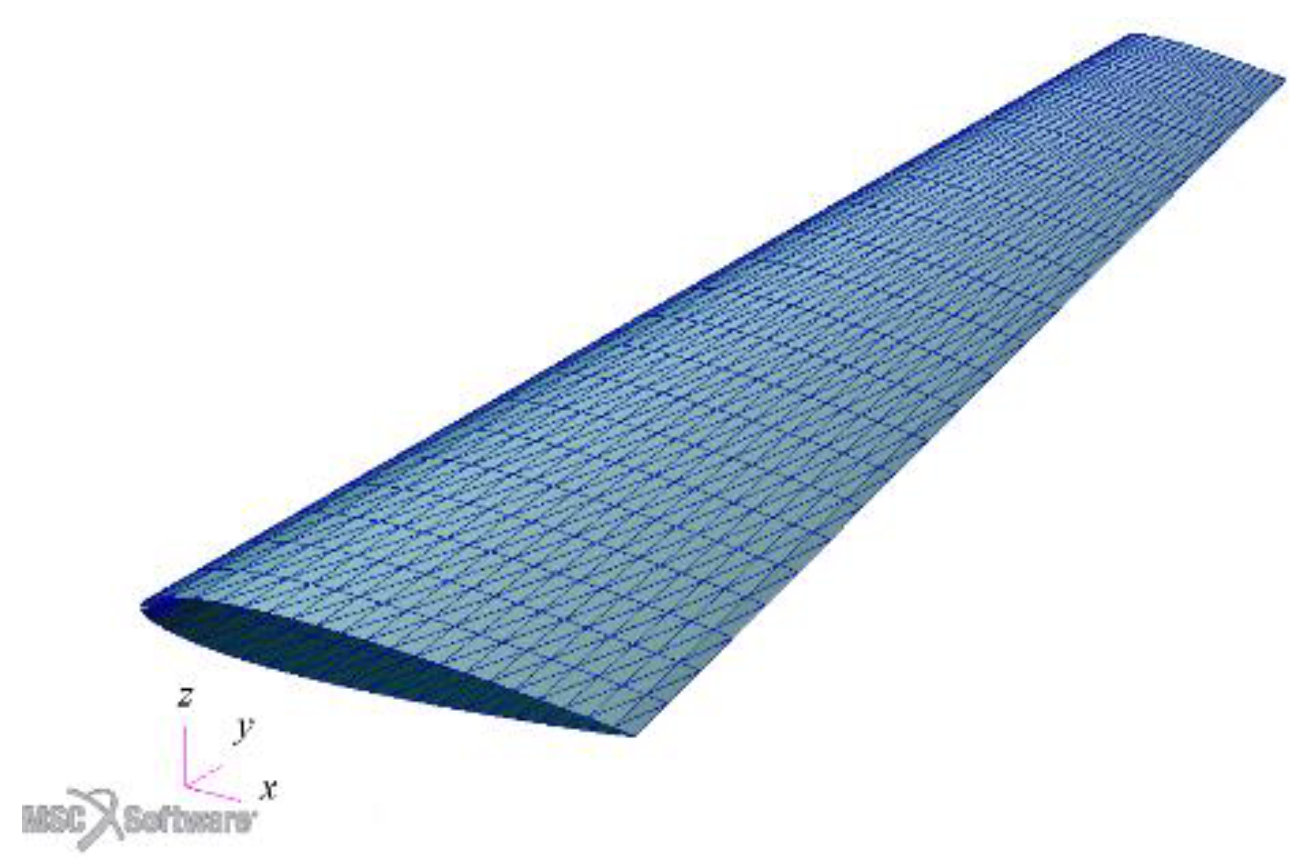
2.2. Structural Evaluation of A Metal AM Wing Model
3. Transonic Wind Tunnel Testing
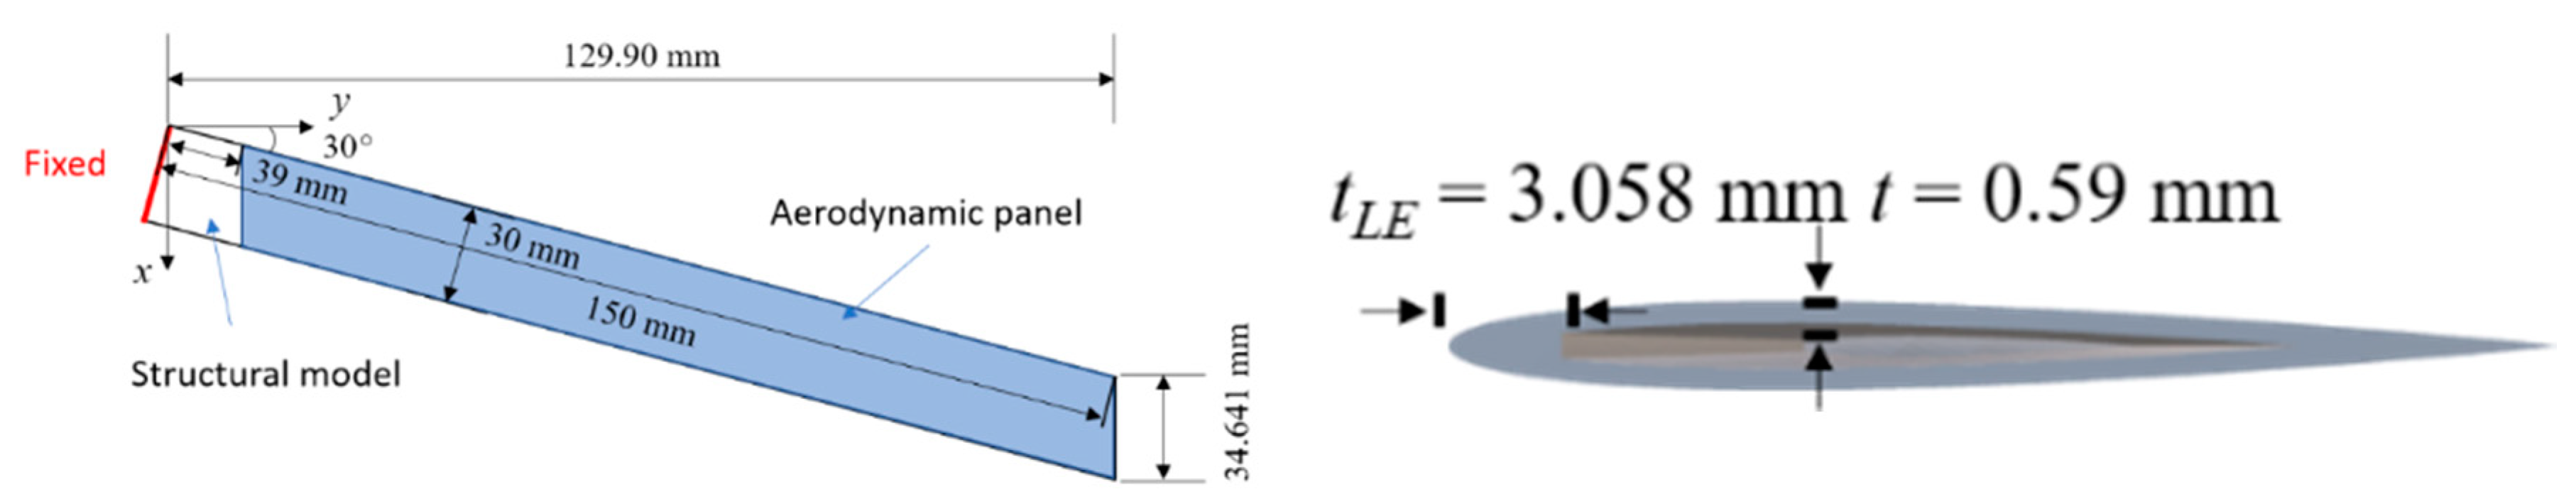
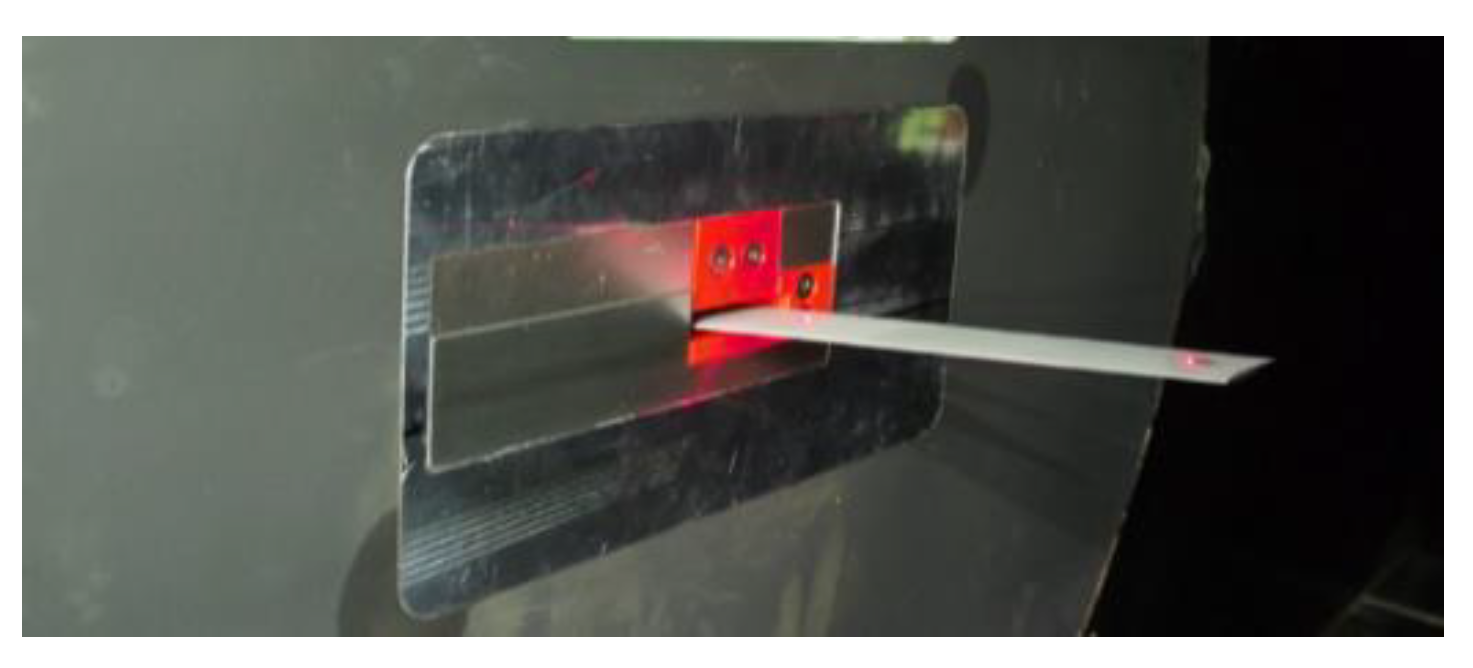
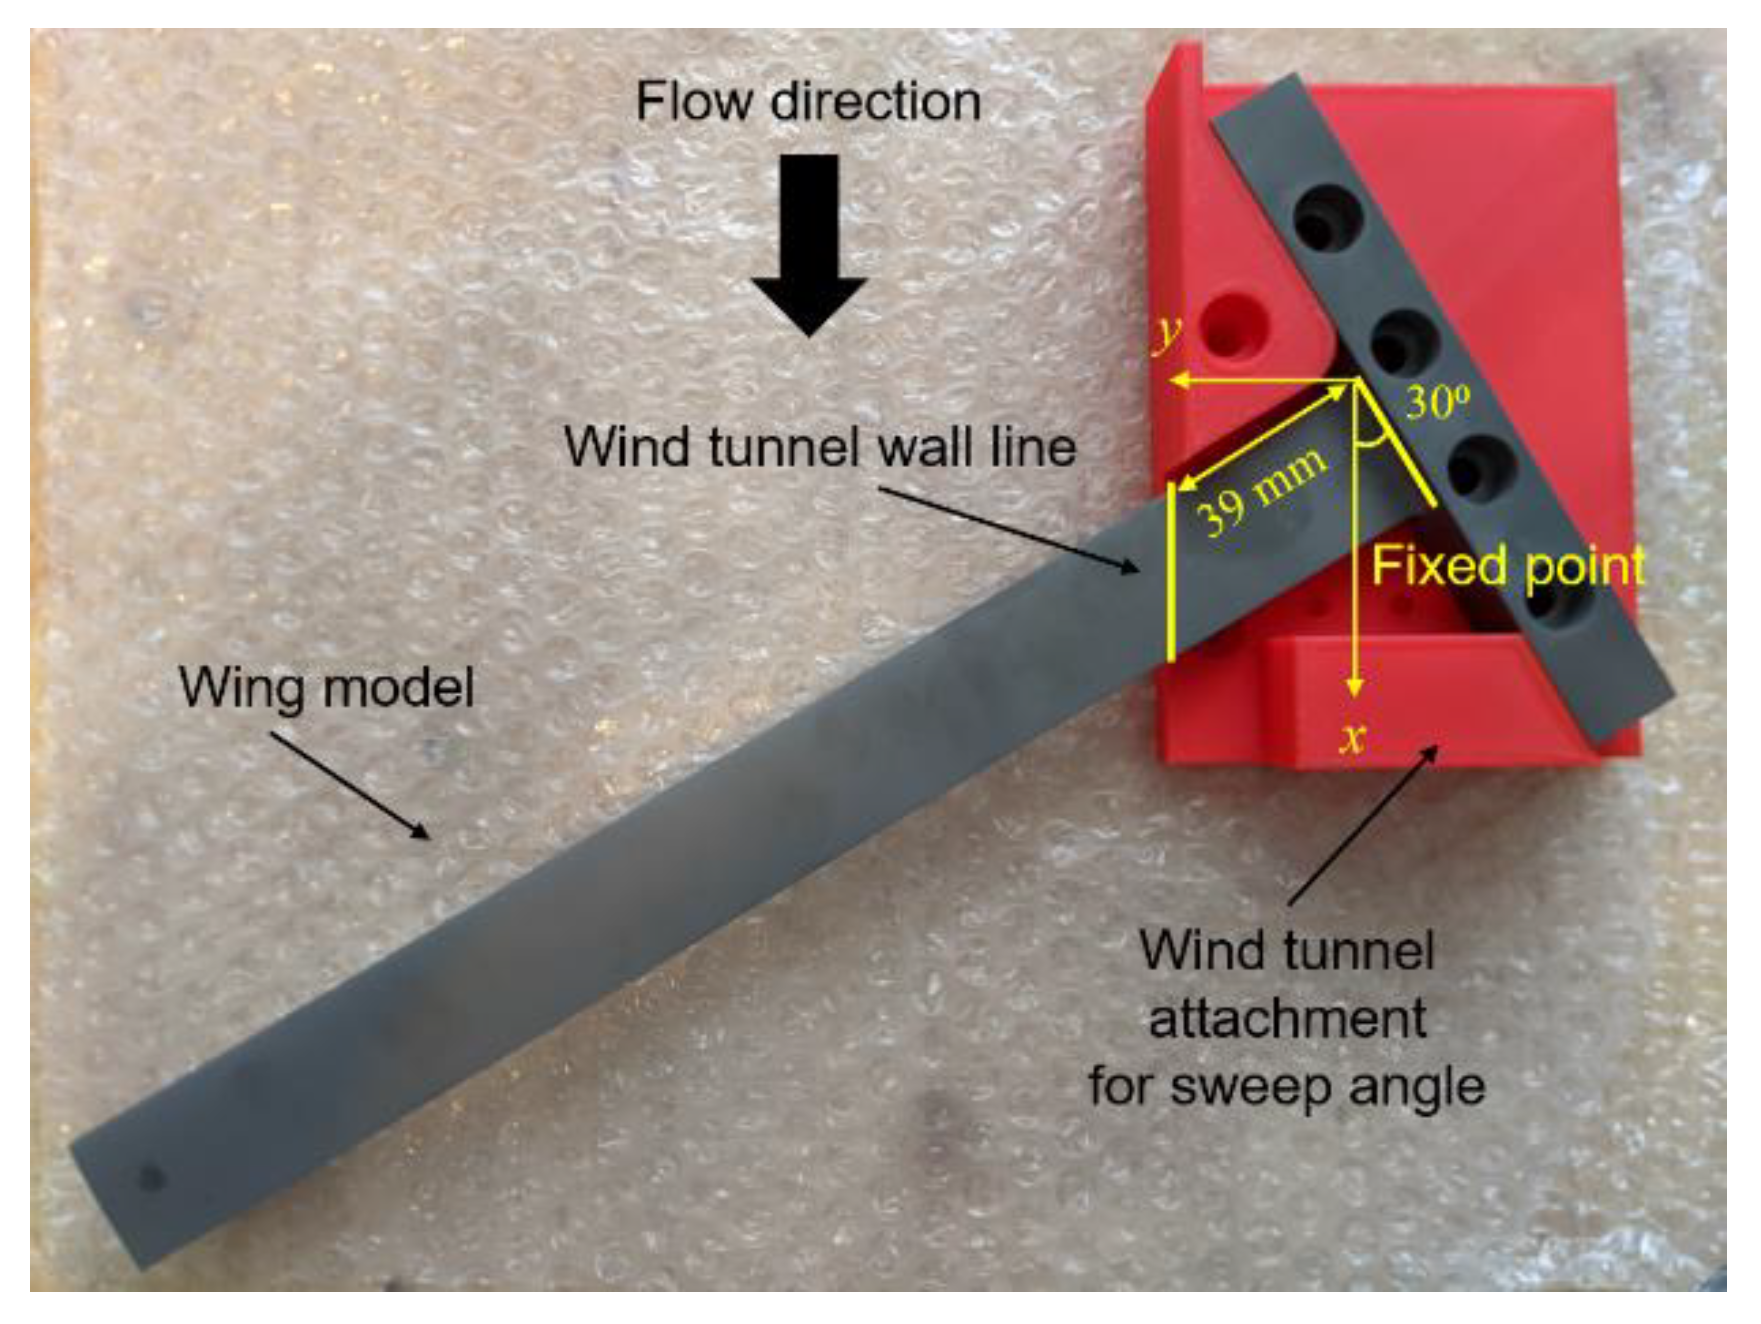
3.1. Wing Model Fabricated by Metal AM for Transonic Flutter Testing
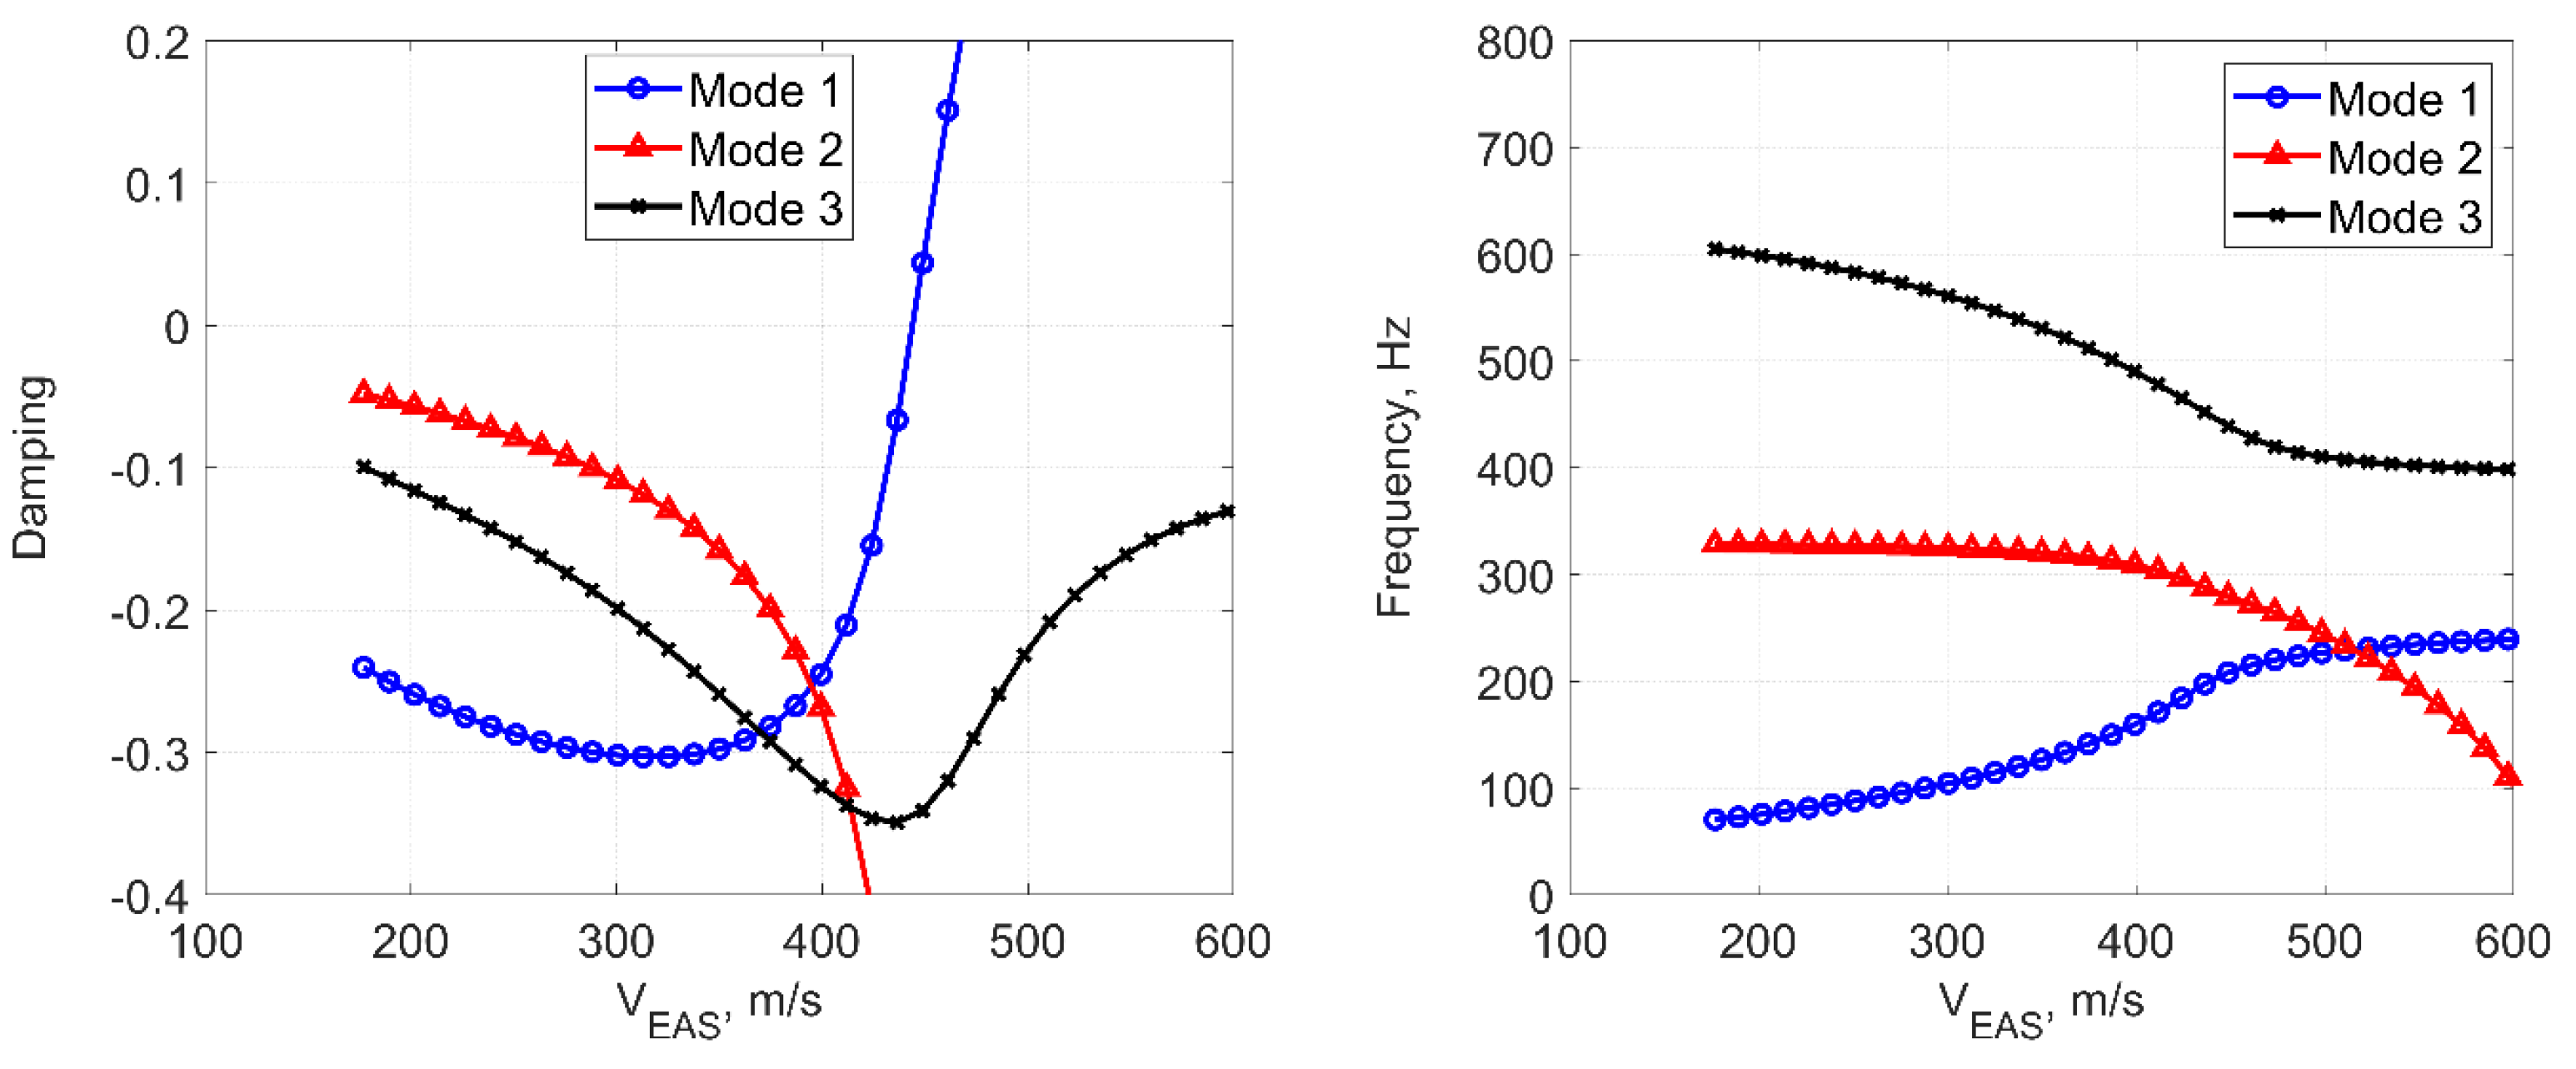
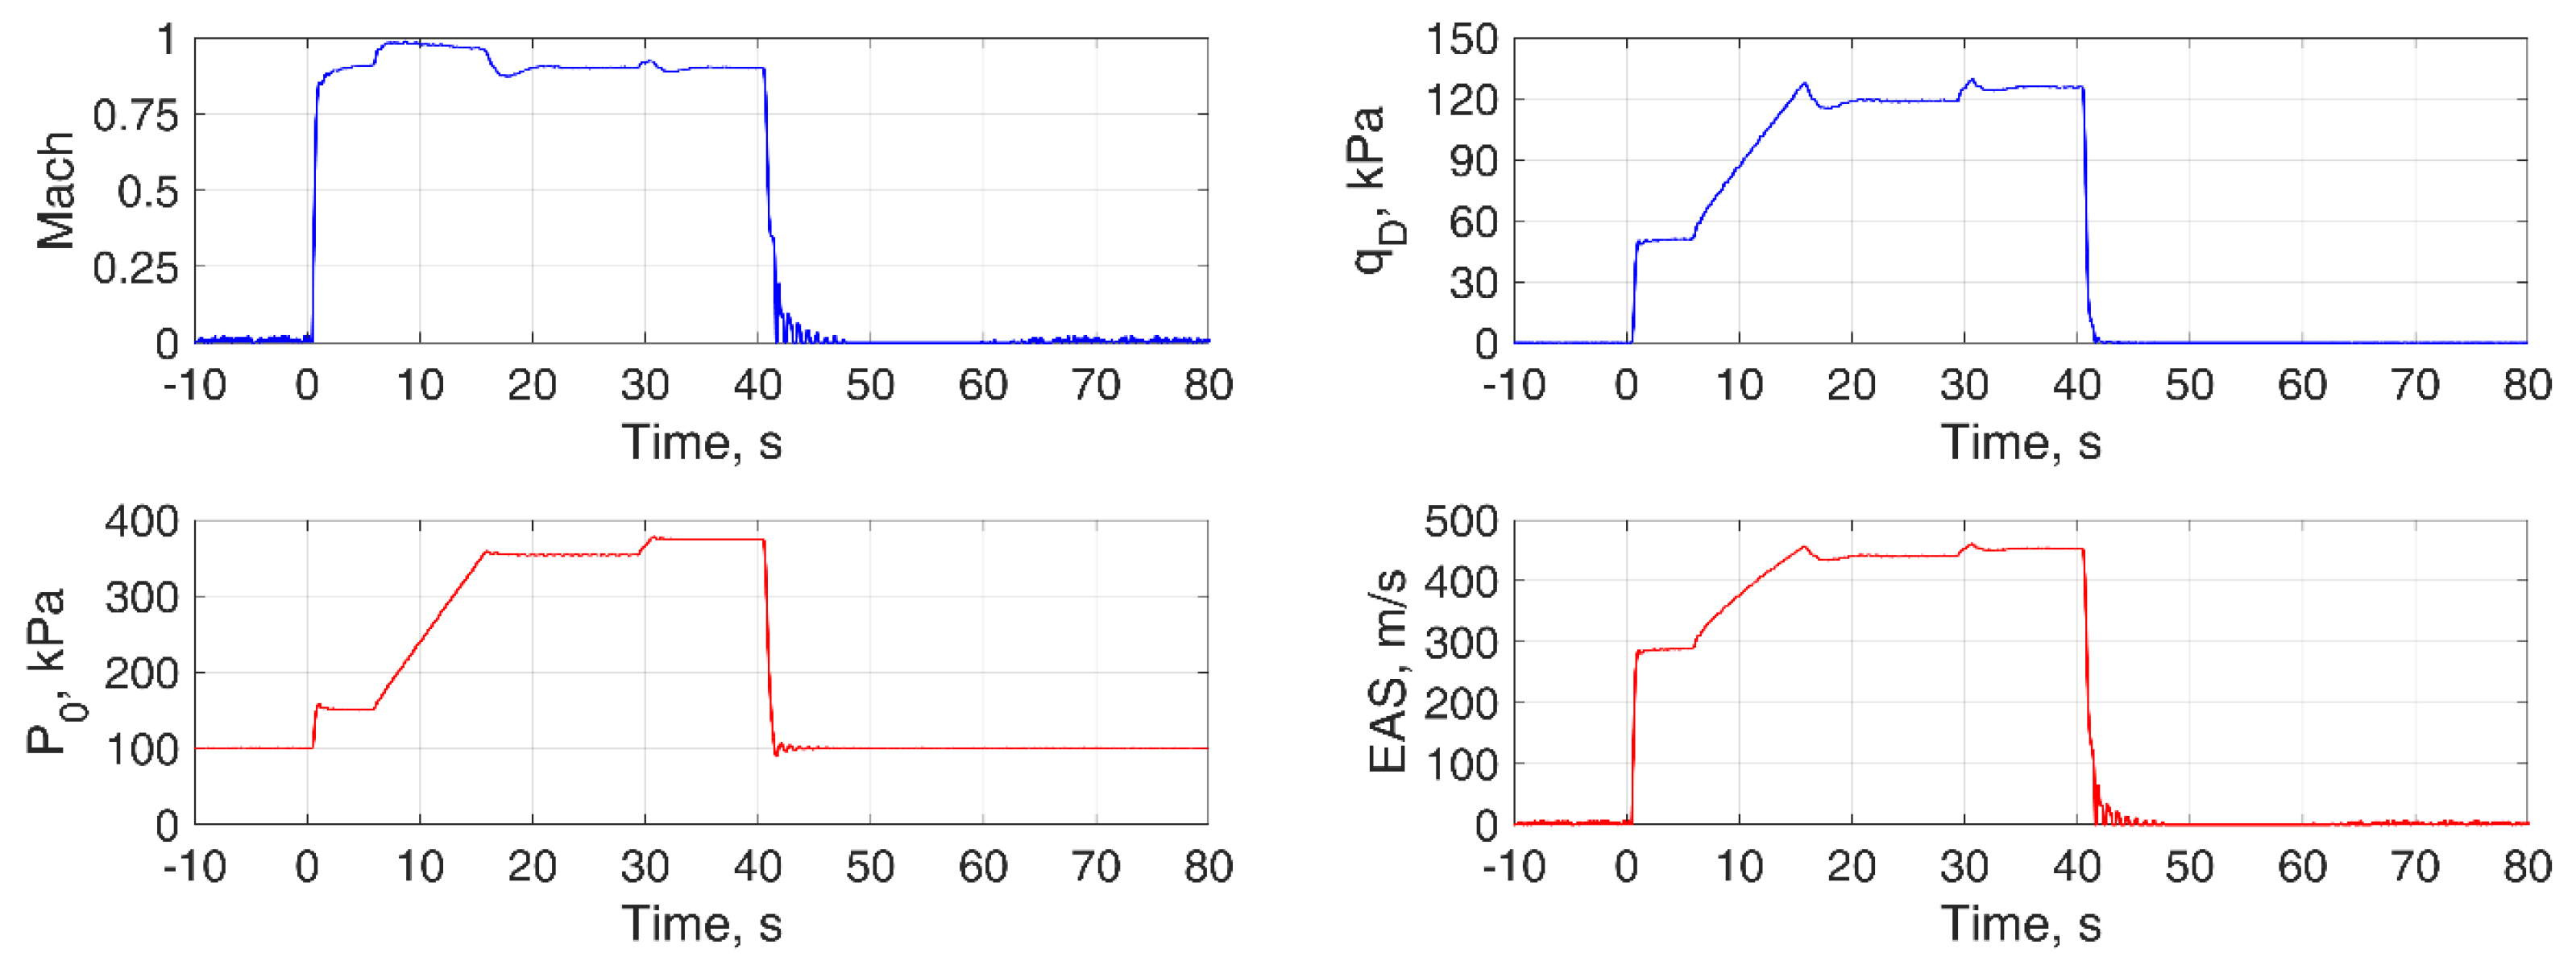
3.2. Transonic Flutter Testing
4. Conclusions
- The metal AM technique could provide enough accuracy to fabricate the designed structures with good reproducibility under constant printing conditions.
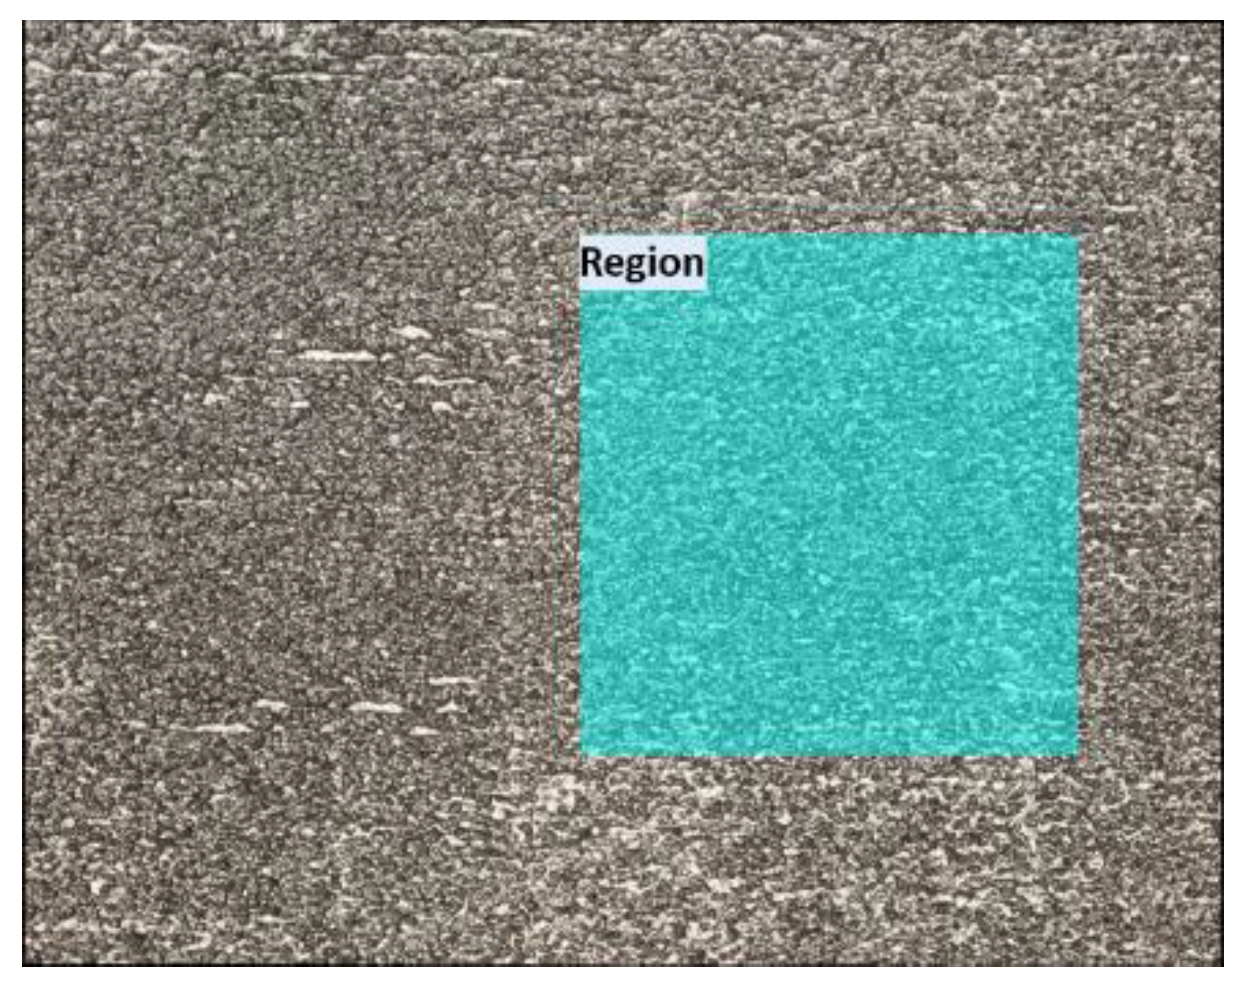
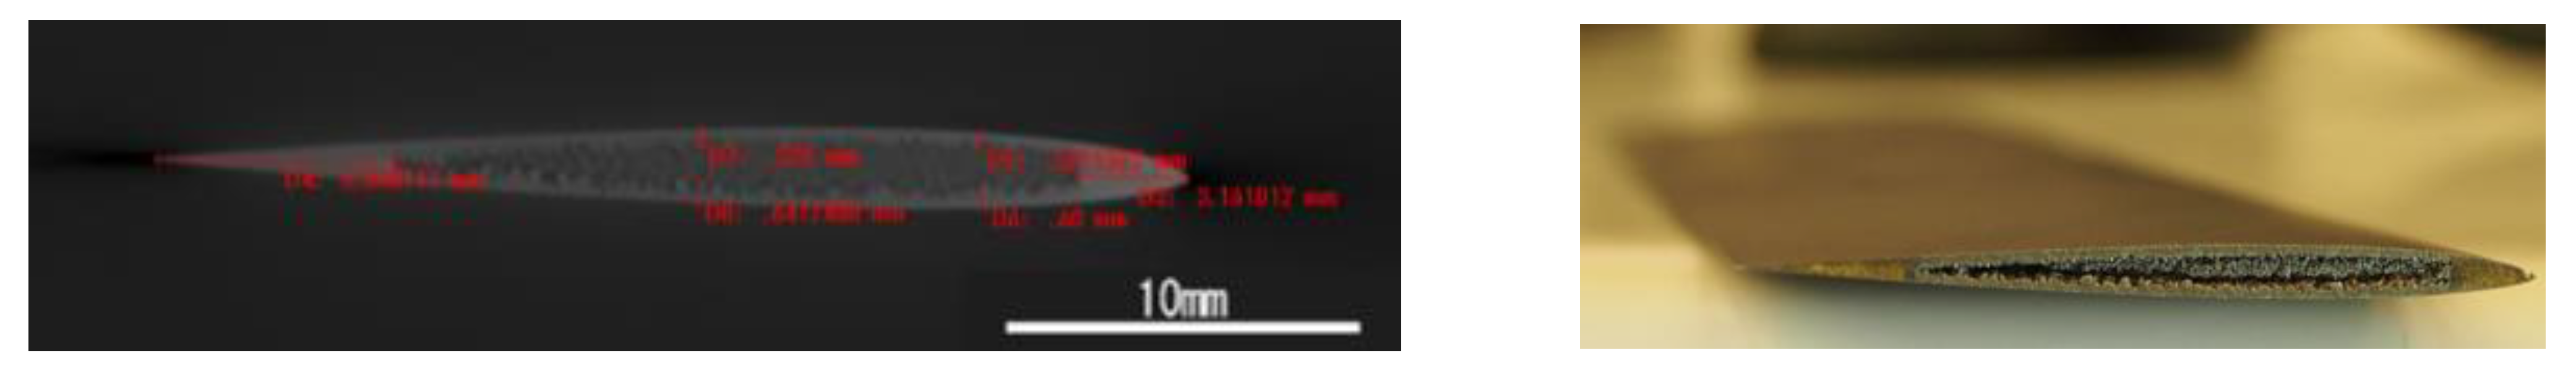
- The wing model fabricated by the EBM technique with Ti6A4V powder could achieve the designed elastic and vibration characteristics, appropriate for wind tunnel testing. However, additional surface treatment was needed to achieve a reasonable surface roughness level for wind tunnel testing.
- The transonic wind tunnel experiment demonstrated the feasibility of the metal AM-based wing in a transonic flutter wind tunnel test showing the capability to provide reliable experimental data, which was consistent with the numerical solutions by MSC.Nastran.
Author Contributions
Funding
Acknowledgments
Conflicts of Interest
References
- Kehoe, M.W. A Historical Overview of Flight Flutter Testing; NASA TM-4720; NASA: Edwards, CA, USA, 1995.
- Dowell, E.H.; Thomas, J.P.; Hall, K.C. Transonic Limit Cycle Oscillation Analysis Using Reduced Order Aerodynamic Models. J. Fluid. Struct. 2004, 19, 17–27. [Google Scholar] [CrossRef]
- Isogai, K. On the Transonic-Dip Mechanism of Flutter of a Sweptback Wing. AIAA J. 1979, 17, 793–795. [Google Scholar] [CrossRef]
- Berger, J.B.; Wadley, H.N.G.; McMeeking, R.M. Mechanical Metamaterials at the Theoretical Limit of Isotropic Elastic Stiffness. Nature 2017, 543, 533–537. [Google Scholar] [CrossRef] [PubMed] [Green Version]
- Goh, G.D.; Agarwala, S.; Goh, G.L.; Dikshit, V.; Sing, S.L.; Yeong, W.Y. Additive Manufacturing in Unmanned Aerial Vehicles (UAVs): Challenges and Potential. Aerosp. Sci. Technol. 2017, 63, 140–151. [Google Scholar] [CrossRef]
- Moioli, M.; Reinbold, C.; Sørensen, K.; Breitsamter, C. Investigation of Additively Manufactured Wind Tunnel Models with Integrated Pressure Taps for Vortex Flow Analysis. Aerospace 2019, 6, 113. [Google Scholar] [CrossRef] [Green Version]
- Bauer, J.; Meza, L.R.; Schaedler, T.A.; Schwaiger, R.; Zheng, X.; Valdevit, L. Nanolattices: An Emerging Class of Mechanical Metamaterials. Adv. Mater. 2017, 29, 1701850. [Google Scholar] [CrossRef] [PubMed]
- Banfield, C.; Kidd, J.; Jacob, J.D. Design and Development of a 3d Printed Unmanned Aerial Vehicle. In Proceedings of the 54th AIAA Aerospace Sciences Meeting, San Diego, CA, USA, 4–8 January 2016. [Google Scholar]
- McSwain, R.G.; Geuther, S.C.; Howland, G.; Patterson, M.D.; Whiteside, S.K.; North, D.D.; Glaab, L.J.; Rhew, R.D. An Experimental Approach to a Rapid Propulsion and Aeronautics Concepts Testbed; NASA TM-2020-220437; NASA: Hampton, VA, USA, 2020.
- Rodriguez, J.; Thomas, J.; Renaud, J. Maximizing the Strength of Fused-Deposition ABS Plastic Parts. In Proceedings of the 10th Solid Freeform Fabrication Symposium (SFF), Austin, TX, USA, 9–11 August 1999. [Google Scholar]
- Adelnia, R.; Daneshmand, S.; Aghanajafi, S. Production of Wind Tunnel Testing Models with Use of Rapid Prototyping Methods. In Proceedings of the 6th WSEAS International Conference on Robotics, Control and Manufacturing Technology, Hangzhou, China, 16–18 April 2006. [Google Scholar]
- Cuan-Urquizo, E.; Barocio, E.; Tejada-Ortigoza, V.; Pipes, R.B.; Rodriguez, C.A.; Roman-Flores, A. Characterization of the Mechanical Properties of FFF Structures and Materials: A Review on the Experimental, Computational and Theoretical Approaches. Materials 2019, 12, 895. [Google Scholar] [CrossRef] [PubMed] [Green Version]
- Zhu, W. Models for Wind Tunnel Tests Based on Additive Manufacturing Technology. Prog. Aeosp. Sci. 2019, 110, 100541. [Google Scholar] [CrossRef]
- Association, J.S. Test Pieces for Tensile Test for Metalic Materials, JIS Z 2201; Japanese Standards Association: Tokyo, Japan, 2004; p. 227. [Google Scholar]
- ASM Aerospace Specification Metals, Inc., Titanium Ti-6Al-4V (Grade 5), Annealed. Available online: Asm.matweb.com (accessed on 22 June 2021).
- Polentz, P.P. Comparison of the Aerodynamic Characteristics of the Naca 0010 and 0010-64 Airfoil Sections at High Subsonic Mach Numbers; NACA RM-A9G19; NASA: Moffett Field, CA, USA, 1949.
- Wang, X.; Gong, X.; Chou, K. Scanning Speed Effect on Mechanical Properties of Ti-6Al-4V Alloy Processed by Electron Beam Additive Manufacturing. Procedia Manuf. 2015, 1, 287–295. [Google Scholar] [CrossRef] [Green Version]
- Tiferet, E.; Ganor, M.; Zolotaryov, D.; Garkun, A.; Hadjadj, A.; Chonin, M.; Ganor, Y.; Noiman, D.; Halevy, I.; Tevet, O.; et al. Mapping the Tray of Electron Beam Melting of Ti-6Al-4V: Properties and Microstructure. Materials 2019, 12, 1470. [Google Scholar] [CrossRef] [PubMed] [Green Version]
- MSC Software Corp. MSC.Nastran 2004 Reference Manual; MSC Software Corp.: Newport Beach, CA, USA, 2004. [Google Scholar]
- Adelnia, R.; Aghanajafi, S.; Daneshmand, S.; Toosi, K. Evaluation of Surface Finish Affect on Aerodynamic Coefficients of Wind Tunnel Testing Models. In Proceedings of the 4th WSEAS International Conference on Fluid Mechanics and Aerodynamics, Elounda, Greece, 21–23 August 2006. [Google Scholar]
- Tsushima, N.; Tamayama, M.; Arizono, H.; Makihara, K. Geometrically Nonlinear Aeroelastic Characteristics of Highly Flexible Wing Fabricated by Additive Manufacturing. Aerosp. Sci. Technol. 2021, 117, 106923. [Google Scholar] [CrossRef]


| Powder | Layer Height, mm | Speed Function (SF) |
|---|---|---|
| Ti6Al4V | 0.08 | 20 |
| Powder | Young’s Modulus, GPa | Yield Strength, MPa | Ultimate Tensile Strength, MPa | Elongation, % | Density, g/cm3 |
|---|---|---|---|---|---|
| Ti6Al4V (reference) | 113.8 | 880 | 950 | 14 | 4.43 |
| Ti6Al4V (powder) | 104.87 (2.9850) | 867.21 (6.6155) | 937.56 (5.0590) | 9.2627 (0.52993) | 4.3730 (0.0040139) |
| Result | Natural Frequency, Hz |
|---|---|
| Simulation | 164.7 |
| Experiment | 163.5 |
| Inner Upper Surface Sa, µm | Outer Upper Surface Sa, µm | Inner Lower Surface Sa, µm | Outer Lower Surface Sa, µm |
|---|---|---|---|
| 22.6 | 47.2 | 54.0 | 61.8 |
| Upper Surface Sa, µm | Upper Surface Ra (Chordwise), µm | Upper Surface Ra (Spanwise), µm | Lower Surface Sa, µm | Lower Surface Ra (Chordwise), µm | Lower Surface Ra (Spanwise), µm |
|---|---|---|---|---|---|
| 1.2 | 1.1 | 0.7 | 1.0 | 1.0 | 0.7 |
| Mode ID. | Mode | Simulation, Hz | GVT, Hz * |
|---|---|---|---|
| 1 | 1st out-of-plane bending | 53.05 | 53.7 |
| 2 | 2nd out-of-plane bending | 329.19 | 318.4 |
| 3 | 1st torsion | 615.38 | 700.5 |
| 4 | 1st edgewise bending | 762.29 | -- |
| 5 | 3rd out-of-plane bending | 916.74 | 859.8 |
Publisher’s Note: MDPI stays neutral with regard to jurisdictional claims in published maps and institutional affiliations. |
© 2021 by the authors. Licensee MDPI, Basel, Switzerland. This article is an open access article distributed under the terms and conditions of the Creative Commons Attribution (CC BY) license (https://creativecommons.org/licenses/by/4.0/).
Share and Cite
Tsushima, N.; Saitoh, K.; Arizono, H.; Nakakita, K. Structural and Aeroelastic Studies of Wing Model with Metal Additive Manufacturing for Transonic Wind Tunnel Test by NACA 0008 Example. Aerospace 2021, 8, 200. https://doi.org/10.3390/aerospace8080200
Tsushima N, Saitoh K, Arizono H, Nakakita K. Structural and Aeroelastic Studies of Wing Model with Metal Additive Manufacturing for Transonic Wind Tunnel Test by NACA 0008 Example. Aerospace. 2021; 8(8):200. https://doi.org/10.3390/aerospace8080200
Chicago/Turabian StyleTsushima, Natsuki, Kenichi Saitoh, Hitoshi Arizono, and Kazuyuki Nakakita. 2021. "Structural and Aeroelastic Studies of Wing Model with Metal Additive Manufacturing for Transonic Wind Tunnel Test by NACA 0008 Example" Aerospace 8, no. 8: 200. https://doi.org/10.3390/aerospace8080200
APA StyleTsushima, N., Saitoh, K., Arizono, H., & Nakakita, K. (2021). Structural and Aeroelastic Studies of Wing Model with Metal Additive Manufacturing for Transonic Wind Tunnel Test by NACA 0008 Example. Aerospace, 8(8), 200. https://doi.org/10.3390/aerospace8080200