Article

The Effect of Real-World Interference on CNN Feature Extraction and Machine Learning Classification of Unmanned Aerial Systems

by
Carolyn J. Swinney
1,2,* and
John C. Woods
1
1
Computer Science and Electronic Engineering Department, University of Essex, Colchester CO4 3SQ, UK
2
Air and Space Warfare Centre, Royal Air Force Waddington, Lincoln LN5 9NB, UK
*
Author to whom correspondence should be addressed.
Aerospace 2021, 8(7), 179; https://doi.org/10.3390/aerospace8070179
Submission received: 1 June 2021 / Revised: 24 June 2021 / Accepted: 26 June 2021 / Published: 1 July 2021
(This article belongs to the Special Issue AI/Machine Learning in Aerospace Autonomy)

Abstract

:
Small unmanned aerial systems (UASs) present many potential solutions and enhancements to industry today but equally pose a significant security challenge. We only need to look at the levels of disruption caused by UASs at airports in recent years. The accuracy of UAS detection and classification systems based on radio frequency (RF) signals can be hindered by other interfering signals present in the same frequency band, such as Bluetooth and Wi-Fi devices. In this paper, we evaluate the effect of real-world interference from Bluetooth and Wi-Fi signals concurrently on convolutional neural network (CNN) feature extraction and machine learning classification of UASs. We assess multiple UASs that operate using different transmission systems: Wi-Fi, Lightbridge 2.0, OcuSync 1.0, OcuSync 2.0 and the recently released OcuSync 3.0. We consider 7 popular UASs, evaluating 2 class UAS detection, 8 class UAS type classification and 21 class UAS flight mode classification. Our results show that the process of CNN feature extraction using transfer learning and machine learning classification is fairly robust in the presence of real-world interference. We also show that UASs that are operating using the same transmission system can be distinguished. In the presence of interference from both Bluetooth and Wi-Fi signals, our results show 100% accuracy for UAV detection (2 classes), 98.1% (+/−0.4%) for UAV type classification (8 classes) and 95.4% (+/−0.3%) for UAV flight mode classification (21 classes).

1. Introduction

Deloitte Economics recently reported that UASs could tackle issues in industry problems, such as logistics and road congestion [1]. In the UK, the Royal Mail have started a trial using UASs for mail delivery to remote parts of the island [2]. The current scope of the benefits UASs could bring to the economy has been branded limitless. However, in February 2021, concerns were raised over small UASs that could be purchased at retail shops such as Costco and the need for dependable countermeasures [3]. Nassi et al. [4] consider societal threats, in particular those surrounding security and privacy for areas that allow UAS flights. Nassi et al. highlighted the ‘detection purpose problem’ asking the question, how do you know whether a UAS flying over a back garden is delivering a pizza or being used for illegitimate purposes? They suggest ways of authenticating UASs and UAS operators. Altawy and Youssef [5] consider security, safety and privacy issues raised by UAS use in national airspace and conclude that security will enable the next generation of UAS. Lykou et al. [6] consider asymmetric threats to Airports from UASs in three categories: spying; carrying chemical radiological, biological, nuclear and explosive materials; and conducting cyber-attacks. Since 2016, a number of security incidents have occurred around airports and other buildings deemed critical national infrastructure.
The Department for Transport, the Military Aviation Authority and the British Airline Pilots’ Association commissioned a study to consider whether critical damage (major structural damage) could occur from mid-air collisions between UASs and manned aircraft. The report showed that helicopter windscreens, especially those which were not bird strike certified, were vulnerable to UASs weighing 400 g, as were tail rotors. Passenger airlines were more resilient, showing critical damage to occur with 2 kg UASs, but in both cases, the structure of the UAS also had an effect on the damage [7]. The last UK AIRPROX board summary for 2019 reported 125 aircraft to small UAS incidents with a 62% chance of an encounter with a small UAS being risk bearing [8]. Incidents with small UASs are not always illegitimate; for example, a small UAS being used for demonstration purposes at Goodwood Aerodrome lost control and crashed close to an active airport airspace [9]. The largest incident to disrupt airport activities happened in 2018 at Gatwick Airport. Table 1 shows a selection of events that have disrupted airports since December 2018, but this is by no means an exhaustive list.
A number of different ways of detecting and classifying UASs are being researched and implemented today, including a number of significant European Projects. The European ALADDIN project integrates RADAR, acoustic and optical sensors to perform detection, classification and localisation with a command and control node. The project boasts an integrated system that counters malicious UASs [25]. Another project called SafeShore aims to detect UAS launching from boats and people in the sea. The project seeks to achieve this using three-dimensional LIDAR integrated with acoustic, radio and imagery data [26]. While current research and development programs, such as SafeShore and ALADDIN, look to combine and integrate various types of detection and classification methods, each individual method is still advancing with current research.
With respect to current literature we will first consider audio detection and classification methods. Many commercial UASs have an audio signature at 200 Hz, and detection methods have been evaluated using microphone arrays. Mezei et al. [27] use correlation with varied results, improving with the use of high-quality microphones and a larger sampling rate. We note that this technique succeeded with a technique using feature extraction and machine learning techniques in [28,29]. This method is short range at 100 m [27] and has shown to be susceptible to noise [30]. Shi et al. [29] design a detection and localisation system using audio signals and an array of microphones. The system works in real time and uses TDOA and a Bayesian filter for localisation.
Another well-documented detection and classification method is the use of video and imagery data. Thai et al. [31] use a CNN for feature extraction of motion patterns and k-nearest neighbour (kNN) to classify results. Schumann et al. [32] use a convolutional neural network (CNN) to detect UASs for the birds vs. drones competition. They find that when they increase the training data to include images from the web from many varied scenarios, their results increase in accuracy. The birds vs. drones challenge [33] is set up because drones can be confused with birds. As such, false detection rates have shown to be high with video detection methods [30]. Coluccia et al. [34] consider the results of the 2020 drones vs. birds competition and in particular consider the top three performing algorithms. They observed the biggest challenges to be detection at a distance and moving cameras, recommending that training and test data be expanded to include this. Further, discrimination between birds and UASs becomes considerably harder with distance.
RADAR has been shown to be very effective at detecting aircraft across large distances but has failed when trying to detect smaller UASs. This is determined to be due to their size and lack of noise and signal emissions [30]. Mendis et al. [35] use a radar sensor and a deep belief network (DBN) to classify three types of micro UASs with an accuracy of over 90%, but the paper only considered a lab environment. Zulkifli and Balleri [36] design and develop a radar system to detect nano-drones using a micro-Doppler technique. Semkin et al. [37] consider radar cross-sections for detection and classification in urban environments and suggest further work to include the use of machine learning. Practical issues with RADAR detection systems include the cost of implementation and the requirement for licenses for transmission [6]. Andraši et al. [38] consider thermal detection using heat signatures and found that engines that were electrically powered (compared to fuel powered) only gave off a very small signature as they were so efficient. However, the heat from the batteries instead of the motors could provide a signature for detection at night time, but a human in the loop was required due to noise interference. Yaacoub et al. [30] suggest that thermal detection systems are associated not only with high cost, like with RADAR, but short detection distances and low detection accuracy. Coluccia et al. [39] provide a comprehensive review of radar systems for UAS detection and classification. They consider the main challenges relating to detection, verification and classification. They also focus on the latest technology with respect to frequency modulated continuous wave (FMCW) radar and spatially distributed sensors. Passafiume et al. [40] investigate the reliability of FMCW radar images for the classification of a UAS by the amount of motors it has, and they rule out the rotation speed from effecting classification.
RF detection systems boast advantages such as range, cost and the ability to perform triangulation to determine location. RF systems in conjunction with machine learning have proven successful in recent research [41,42,43,44,45]. RF has its own challenges as with the other detection methods previously discussed. It requires an active RF signal with the controller, and it suffers from interference in congested RF environments [6]. This paper extends previous work conducted by Swinney and Woods [44,45] by expanding the open ‘DroneDetect’ dataset [46] to 21 classes for 7 UAS types and flight modes to include hovering, switched on but not taken off and flying. Secondly, the work on interference is extended to the evaluation of environments where both Bluetooth and Wi-Fi signals are present concurrently. The paper is constructed as follows: Section 2 discusses the methodology, Section 3 the results and Section 4 the conclusions.

2. Materials and Methods

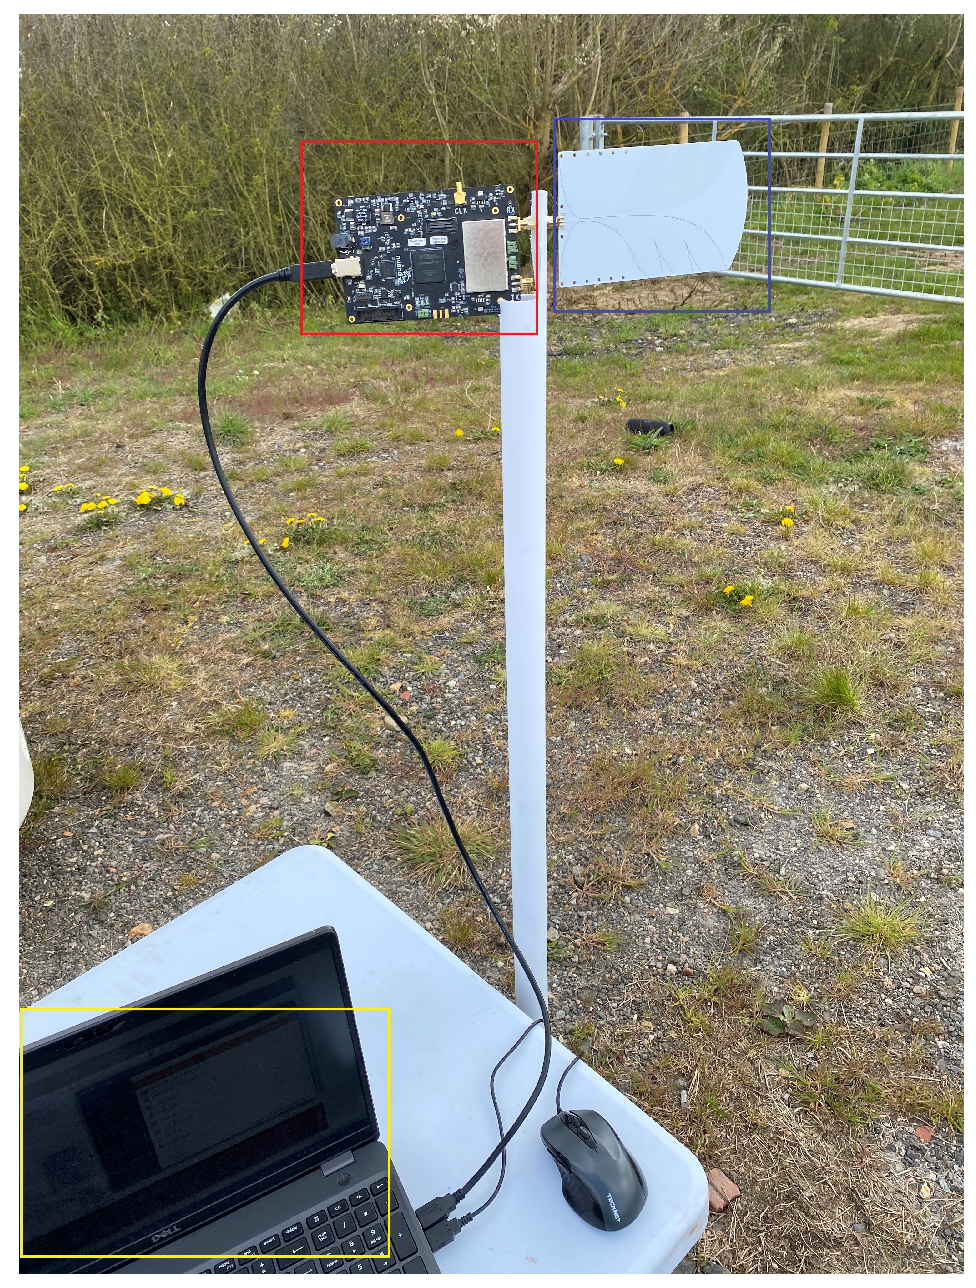
2.1. Experimental Setup

The experimental setup can be seen in Figure 1, and it was used to create the DroneDetect dataset [46]. The yellow box shows the laptop that is running GNURadio. GNURadio is an open-source toolkit designed for signal processing with SDRs [47], and it was used to capture the signals.
The SDR used in our experiments was the BladeRF by Nuand. It has a frequency range of 47 MHz to 6 GHz and is low cost at USD 480 [48]. The Palm Tree Vivaldi Antenna [49,50] with a frequency range of 800 MHz to 6 GHz was chosen due to its small, portable and low cost ($18.99 [51]) attributes. Signals were recorded with a centre frequency of 2.4375 GHz and a sample rate of 60 MBits/s over a 28 MHz bandwidth. Each sample was the result of 20 ms of recording time in complex form, and the dataset comprised of 500 samples per class. Table 2 describes the classes evaluated over a mix of quadcopter and fixed-wing UAS. To capture the class ‘switched on’, the UAS and controller were placed 4 m from the antenna on the ground. Hovering was conducted at an altitude of 20 m and flying at an altitude of 20 m within a radius of 40 m around the antenna. Bluetooth interference was added by playing music through an end device (JBL Charge Bluetooth Speaker) placed 2 m from the antenna and the connecting phone next to the antenna. Wi-Fi interference was added by playing a YouTube video over a phone hotspot, end device (Apple MacBook) placed 2 m from the antenna and a connected phone hotspot next to the antenna. Both interference sources were active during dataset collection.

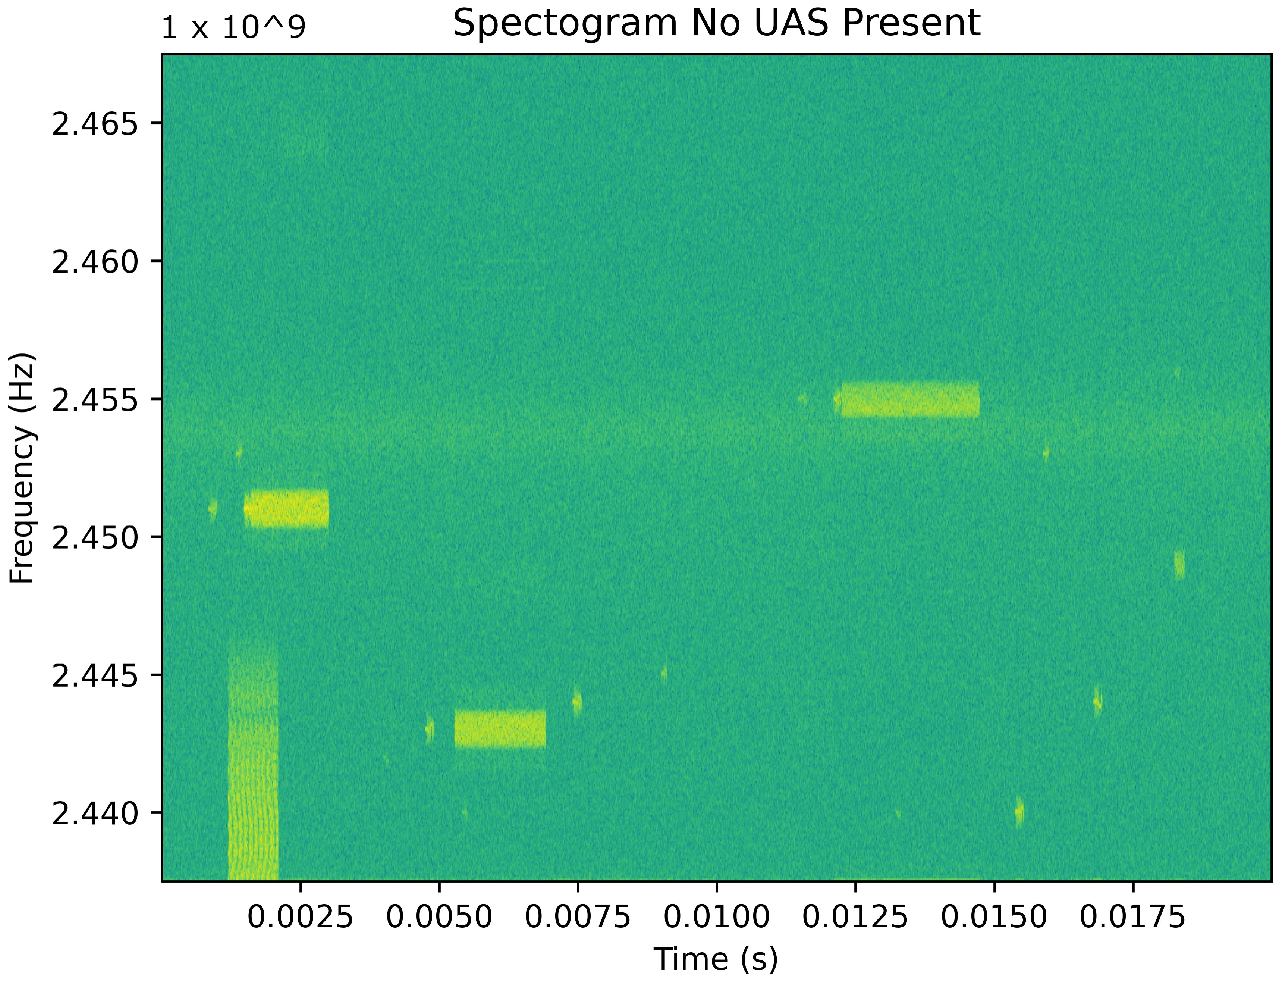
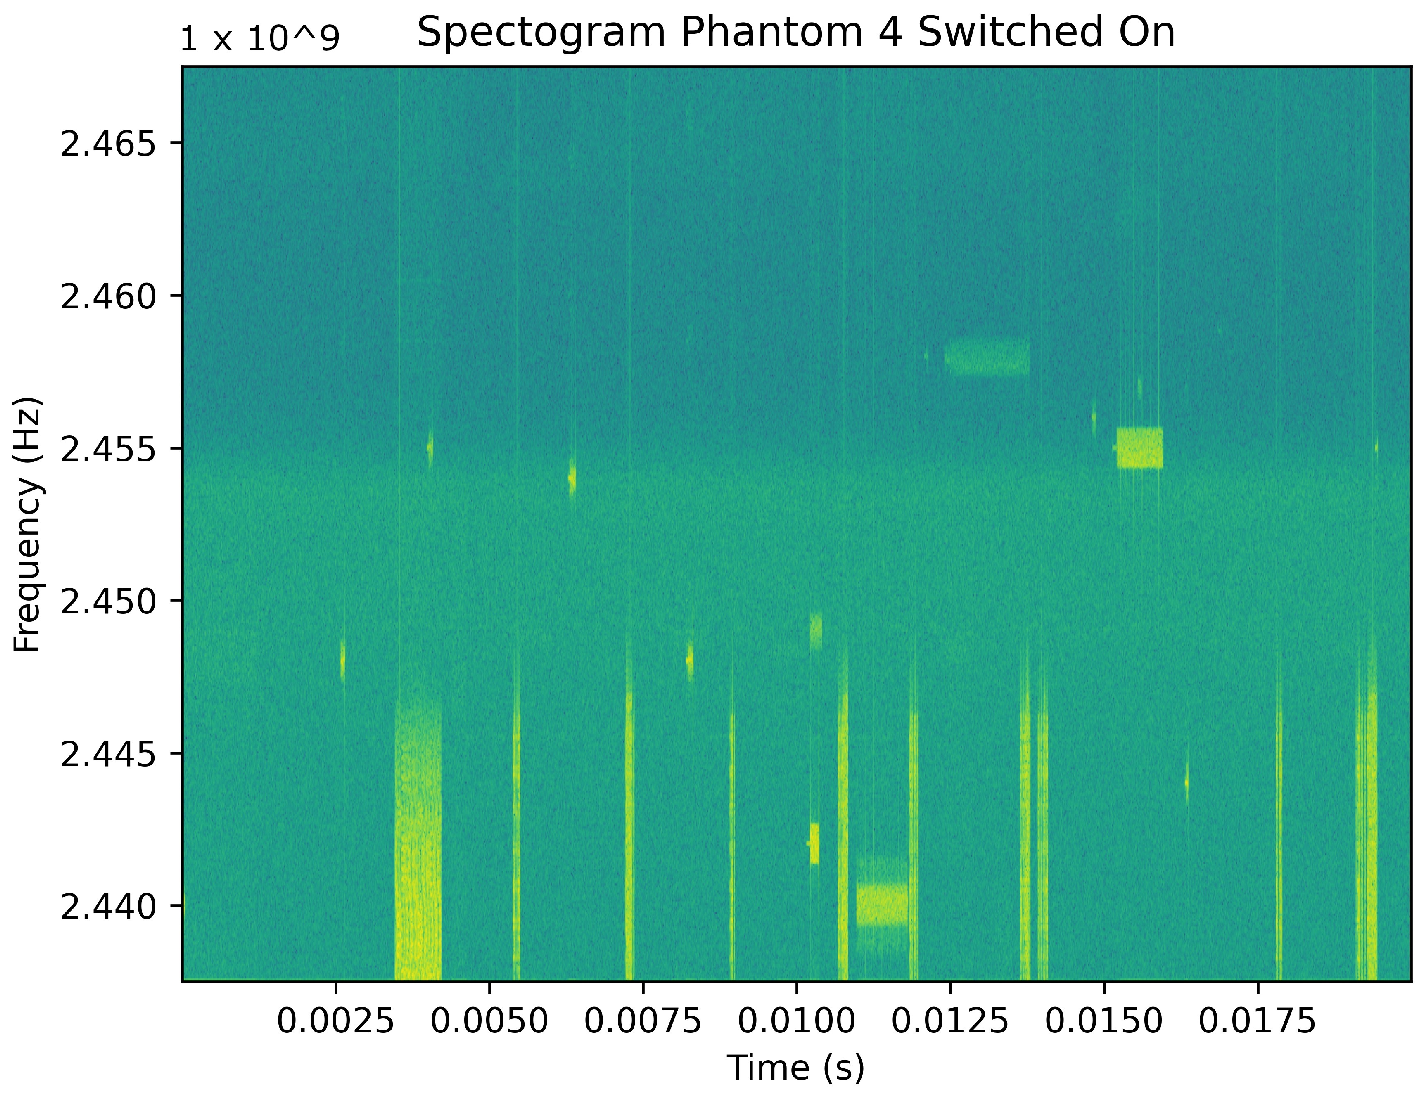
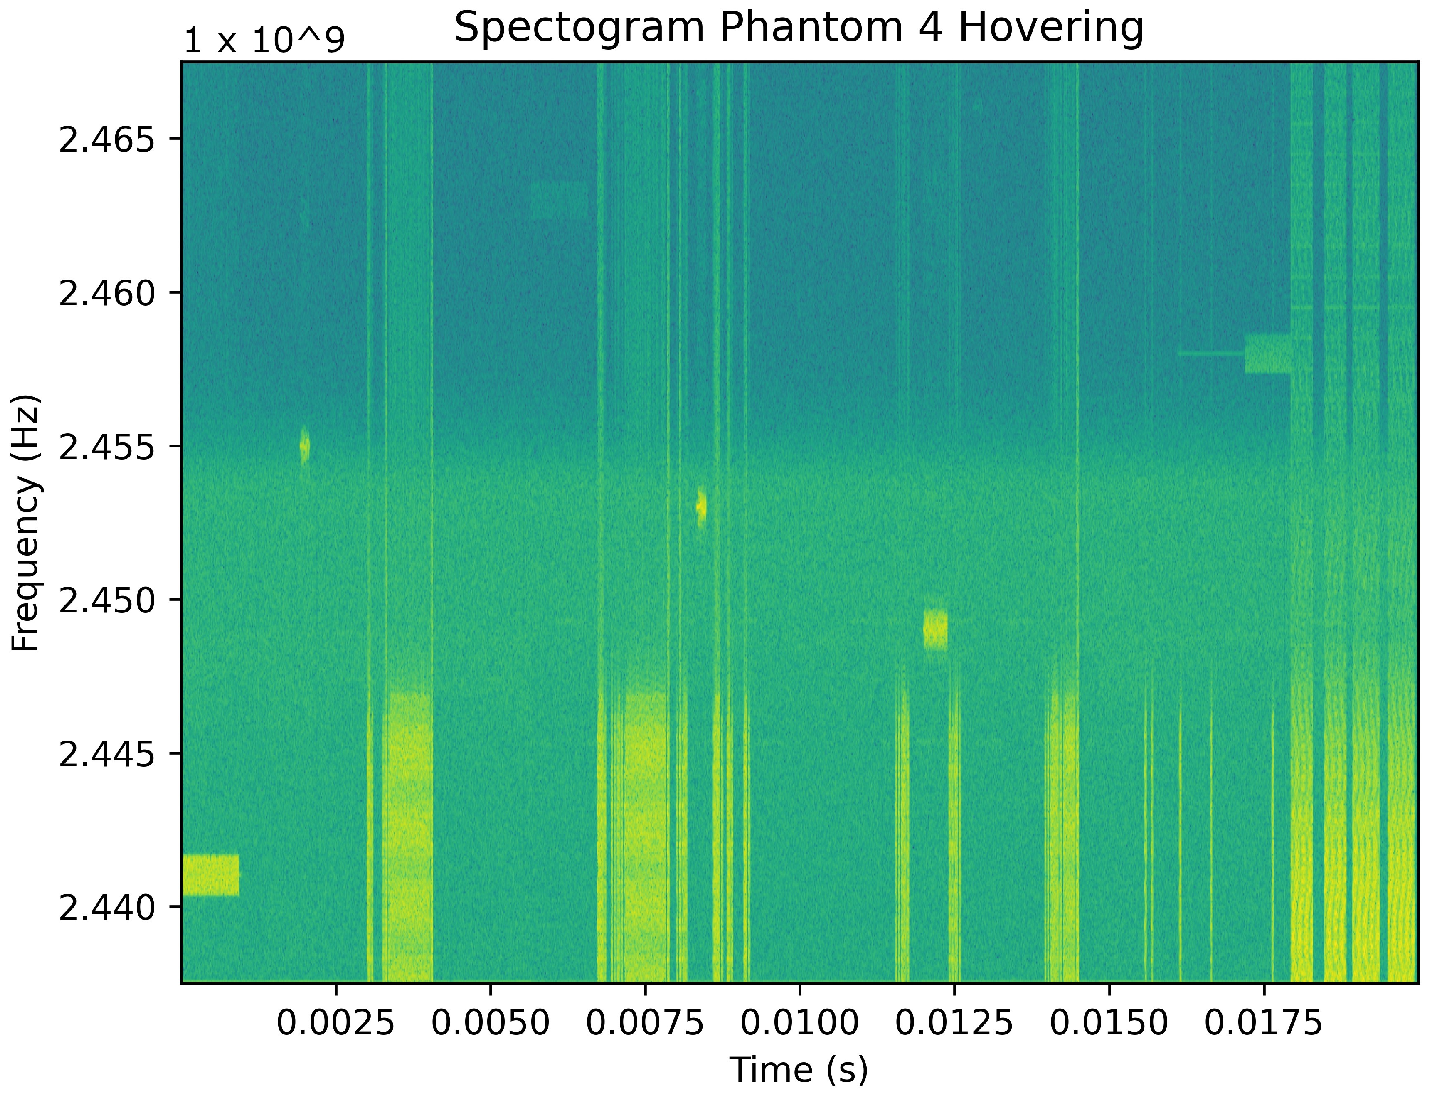
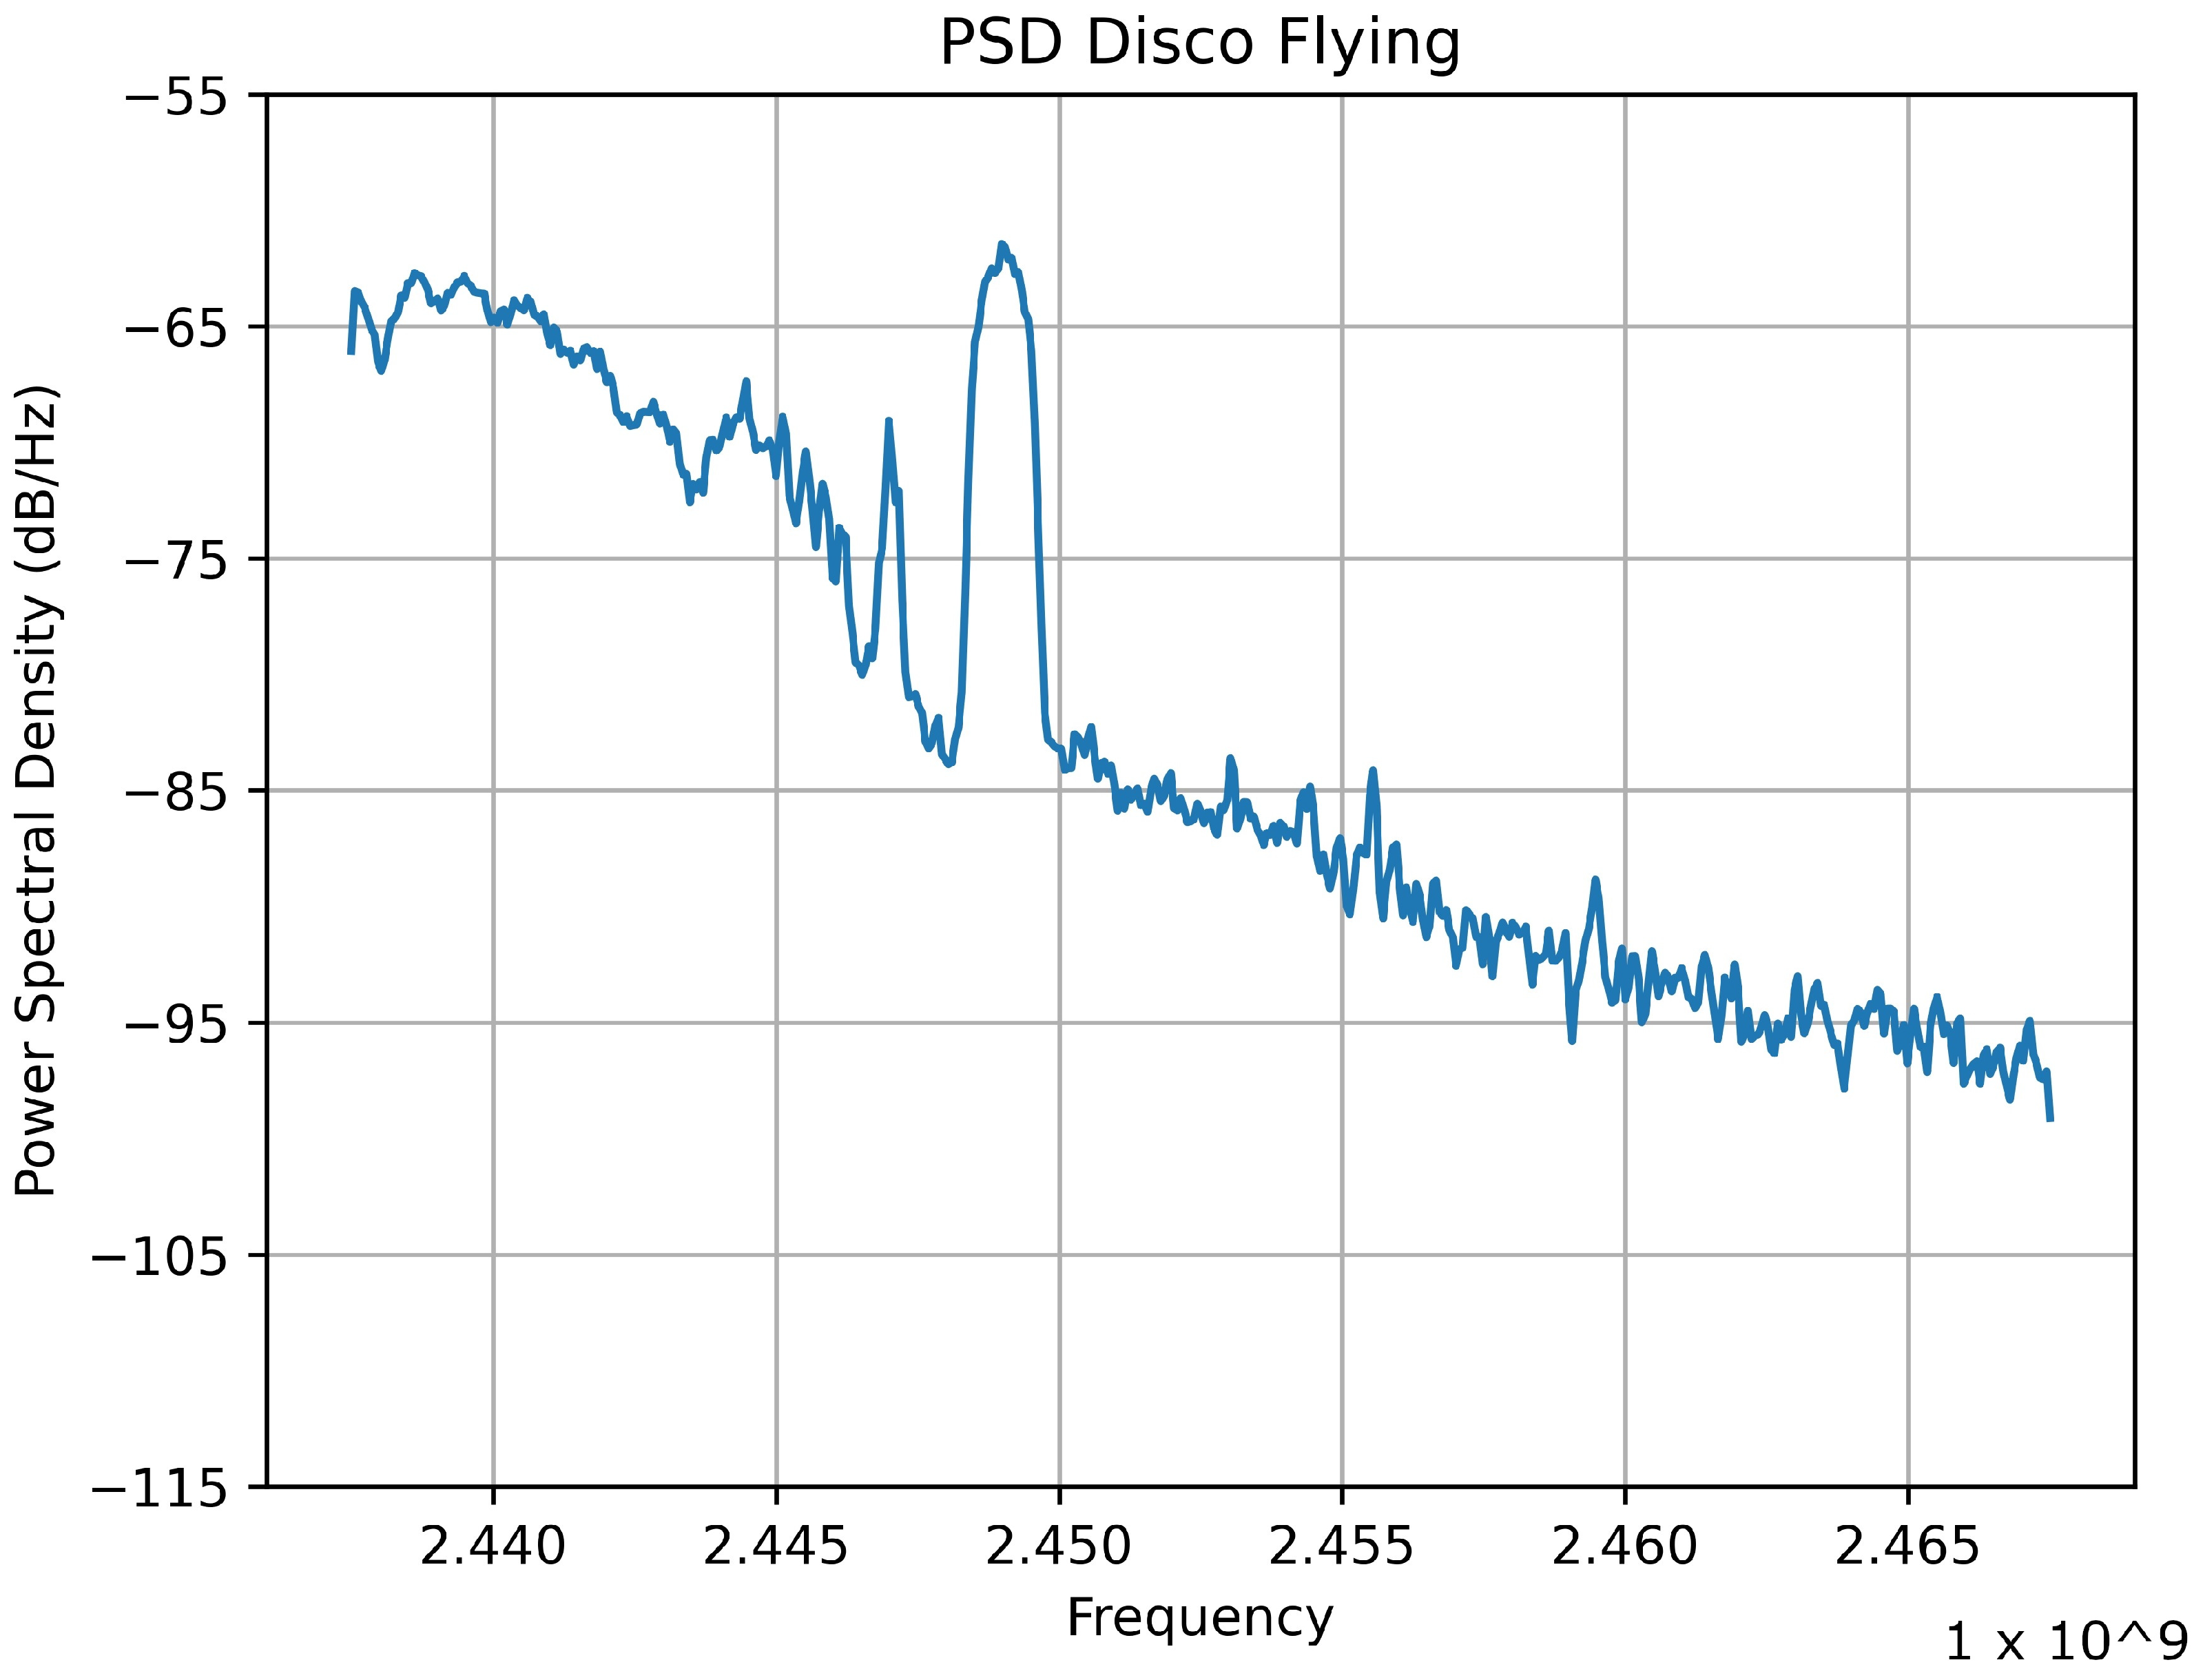
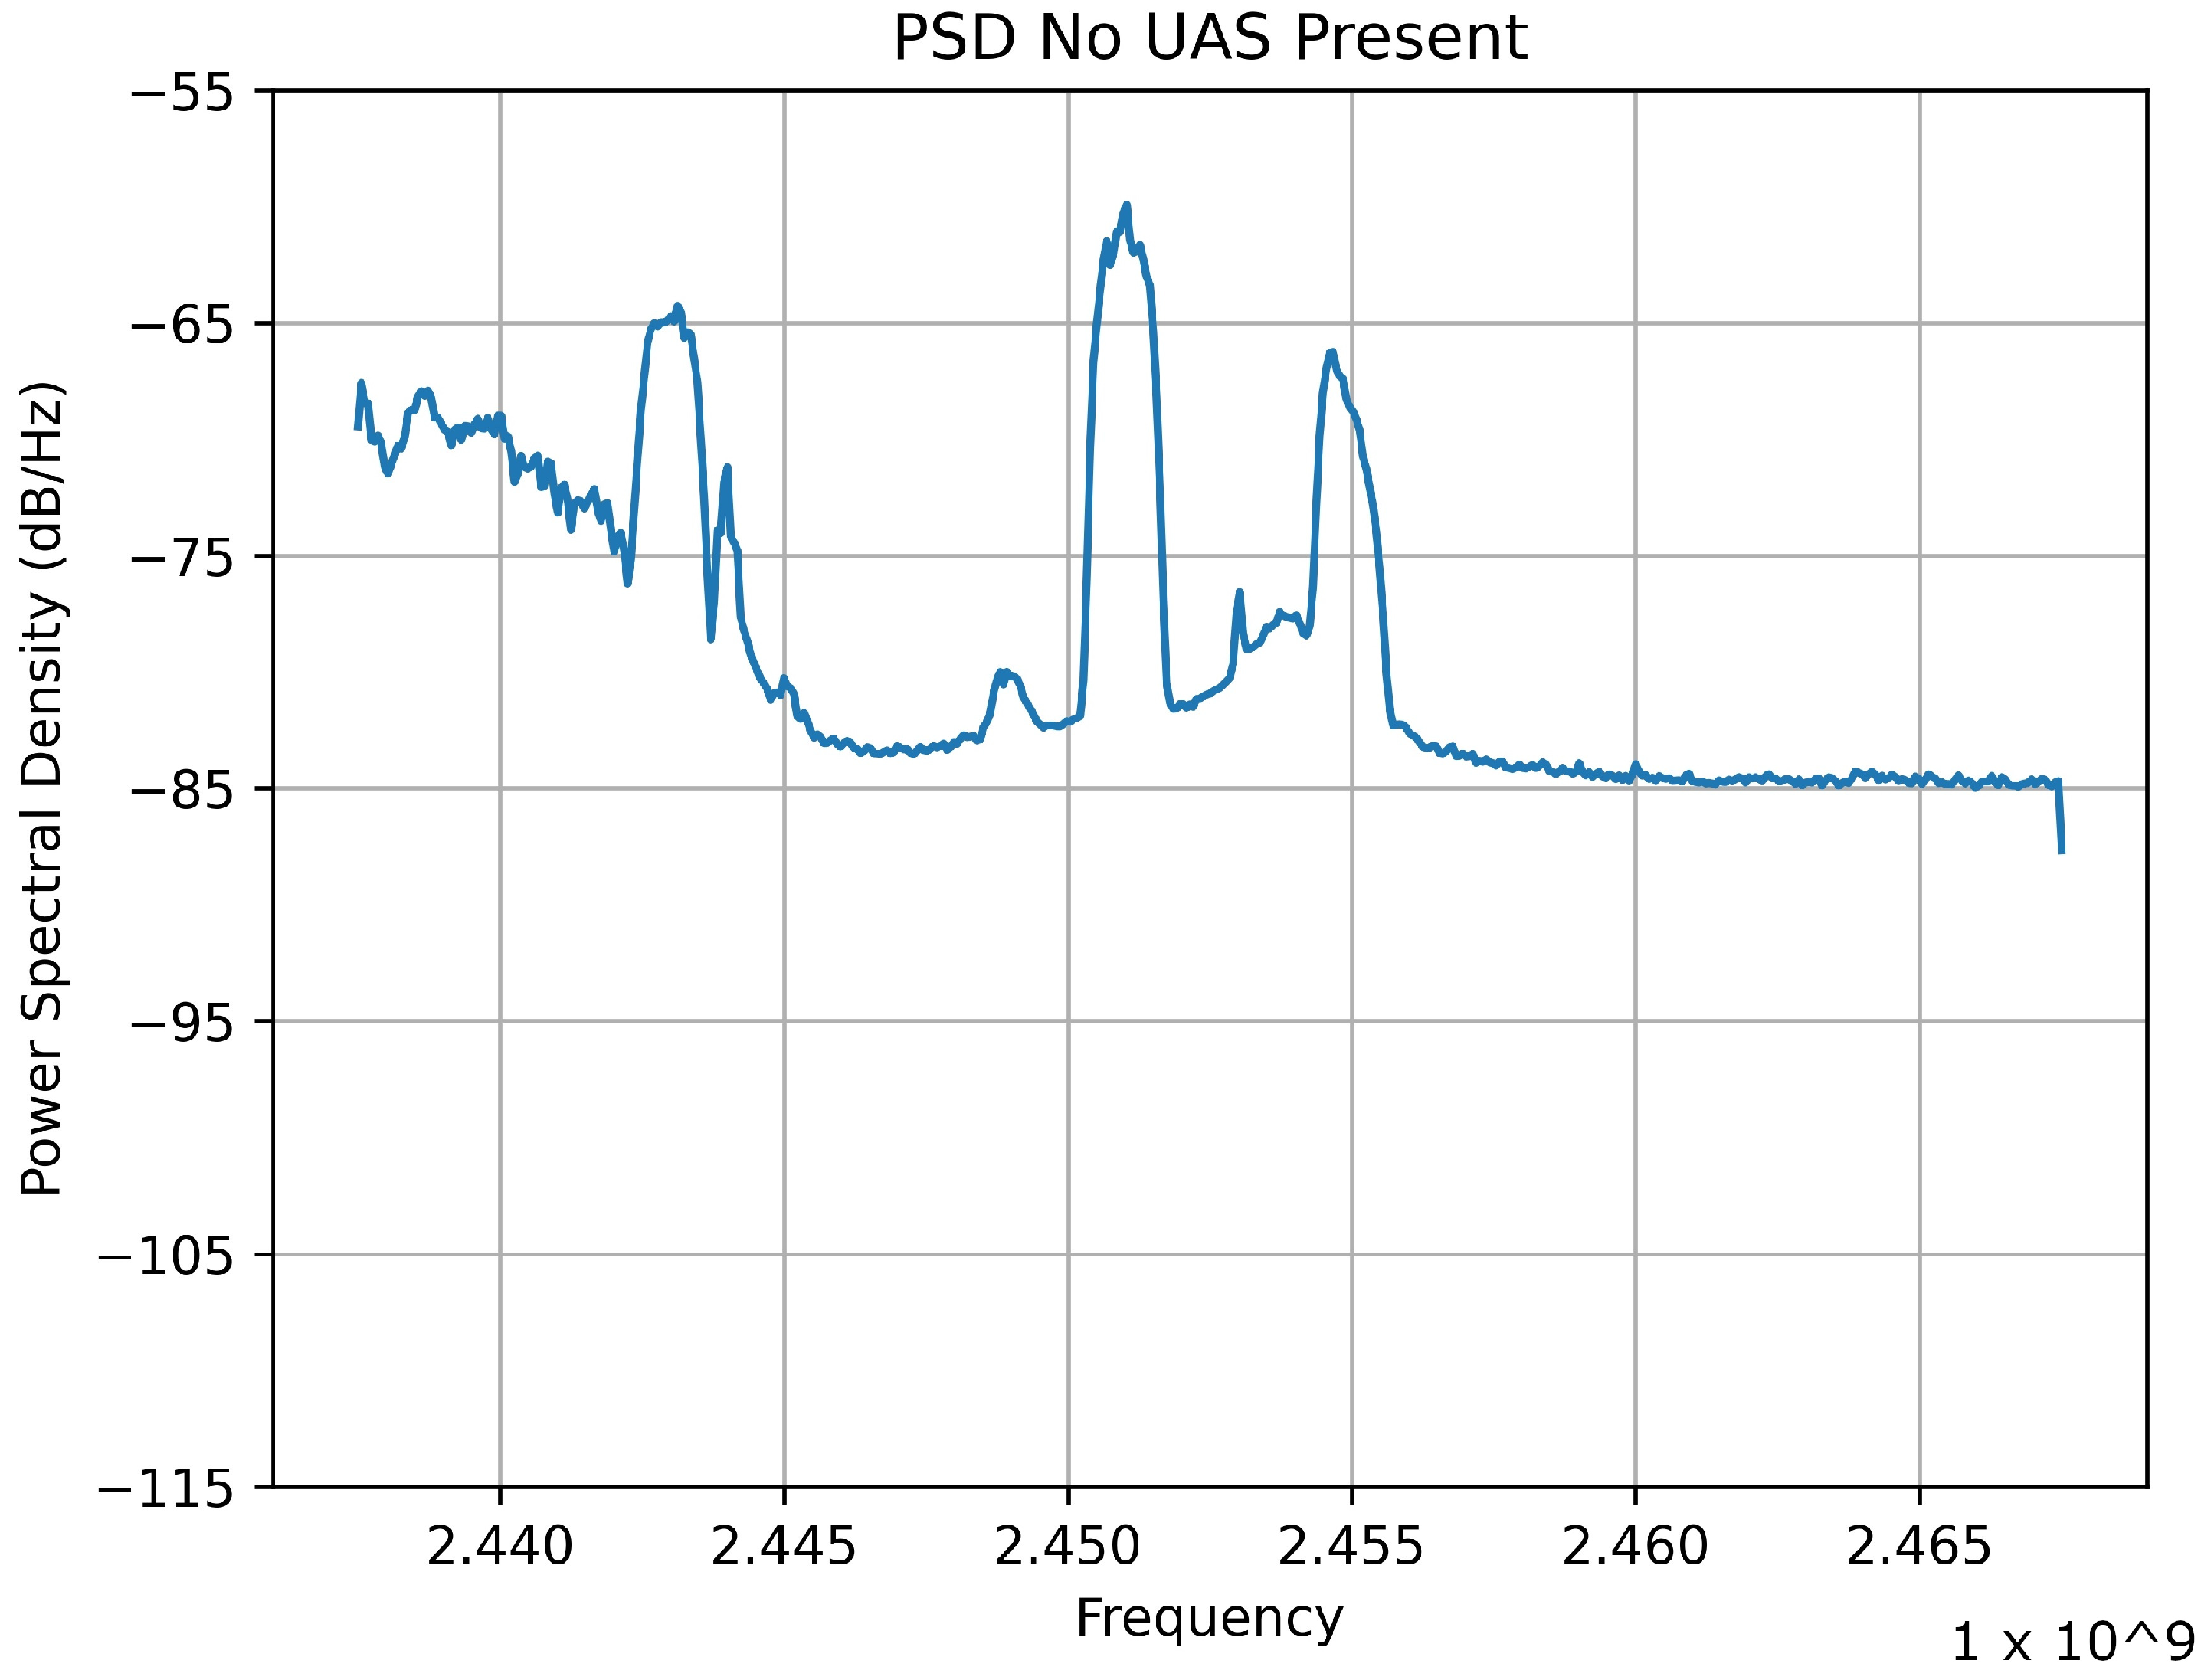
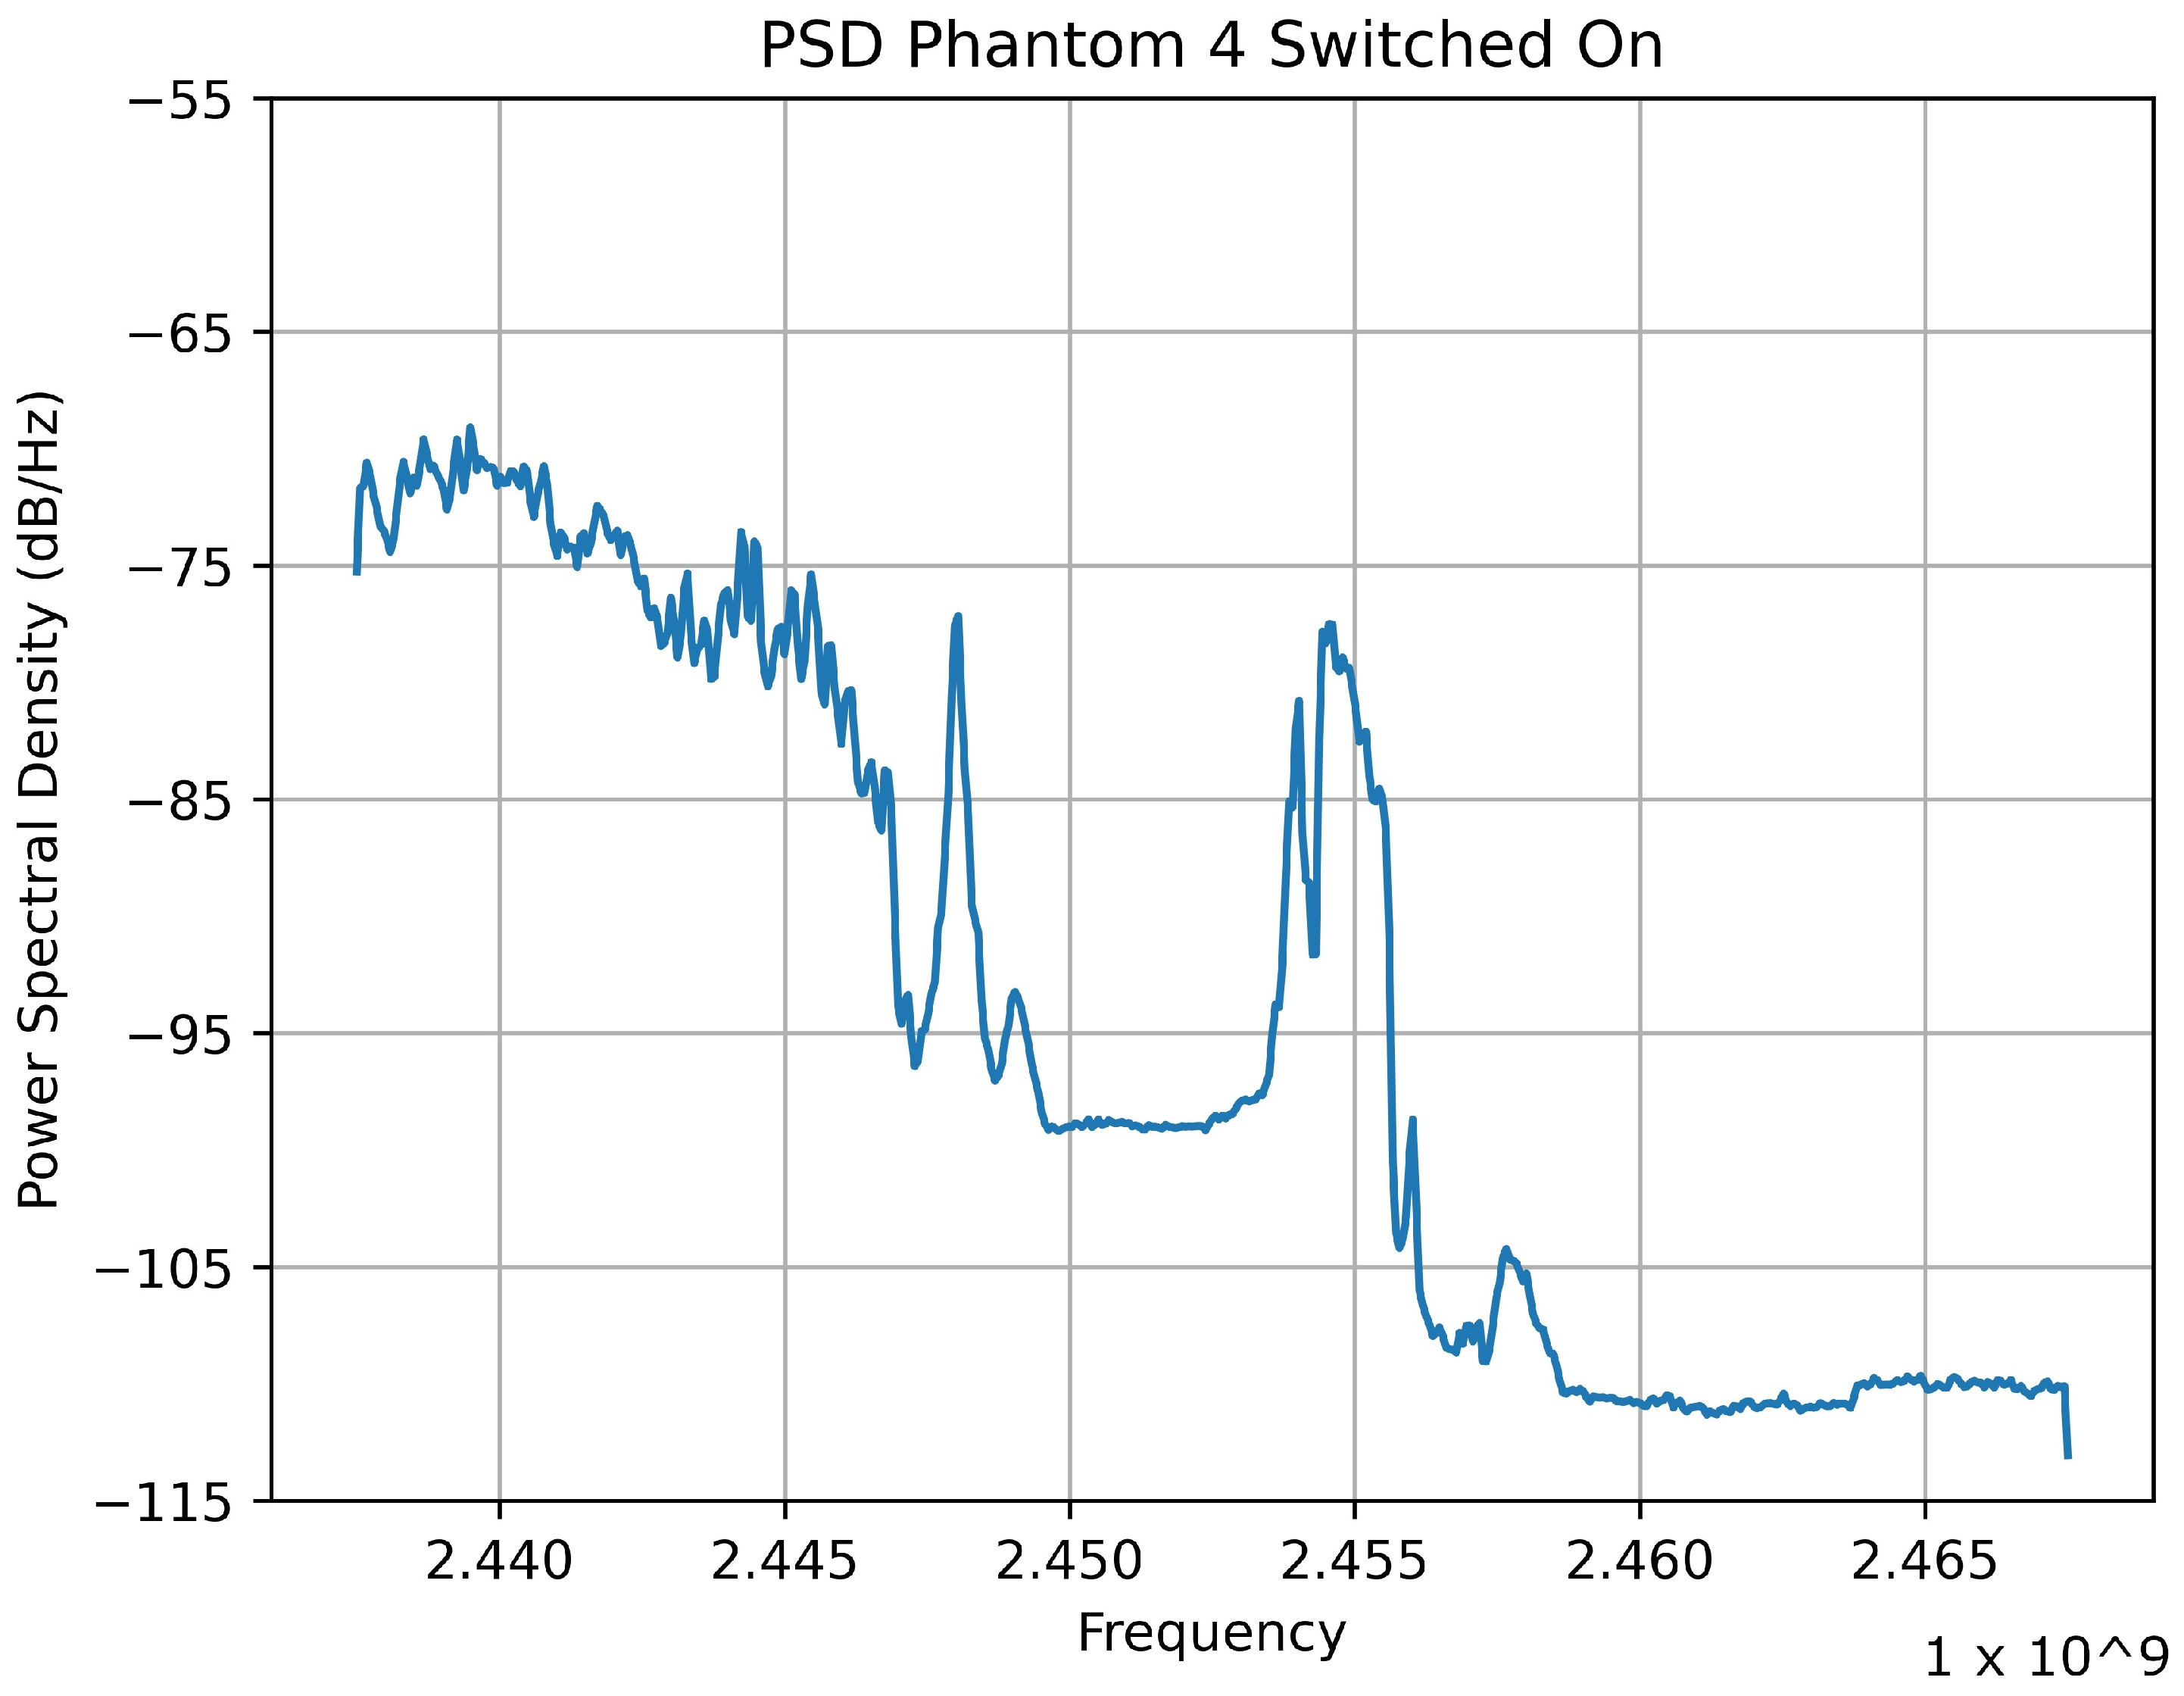
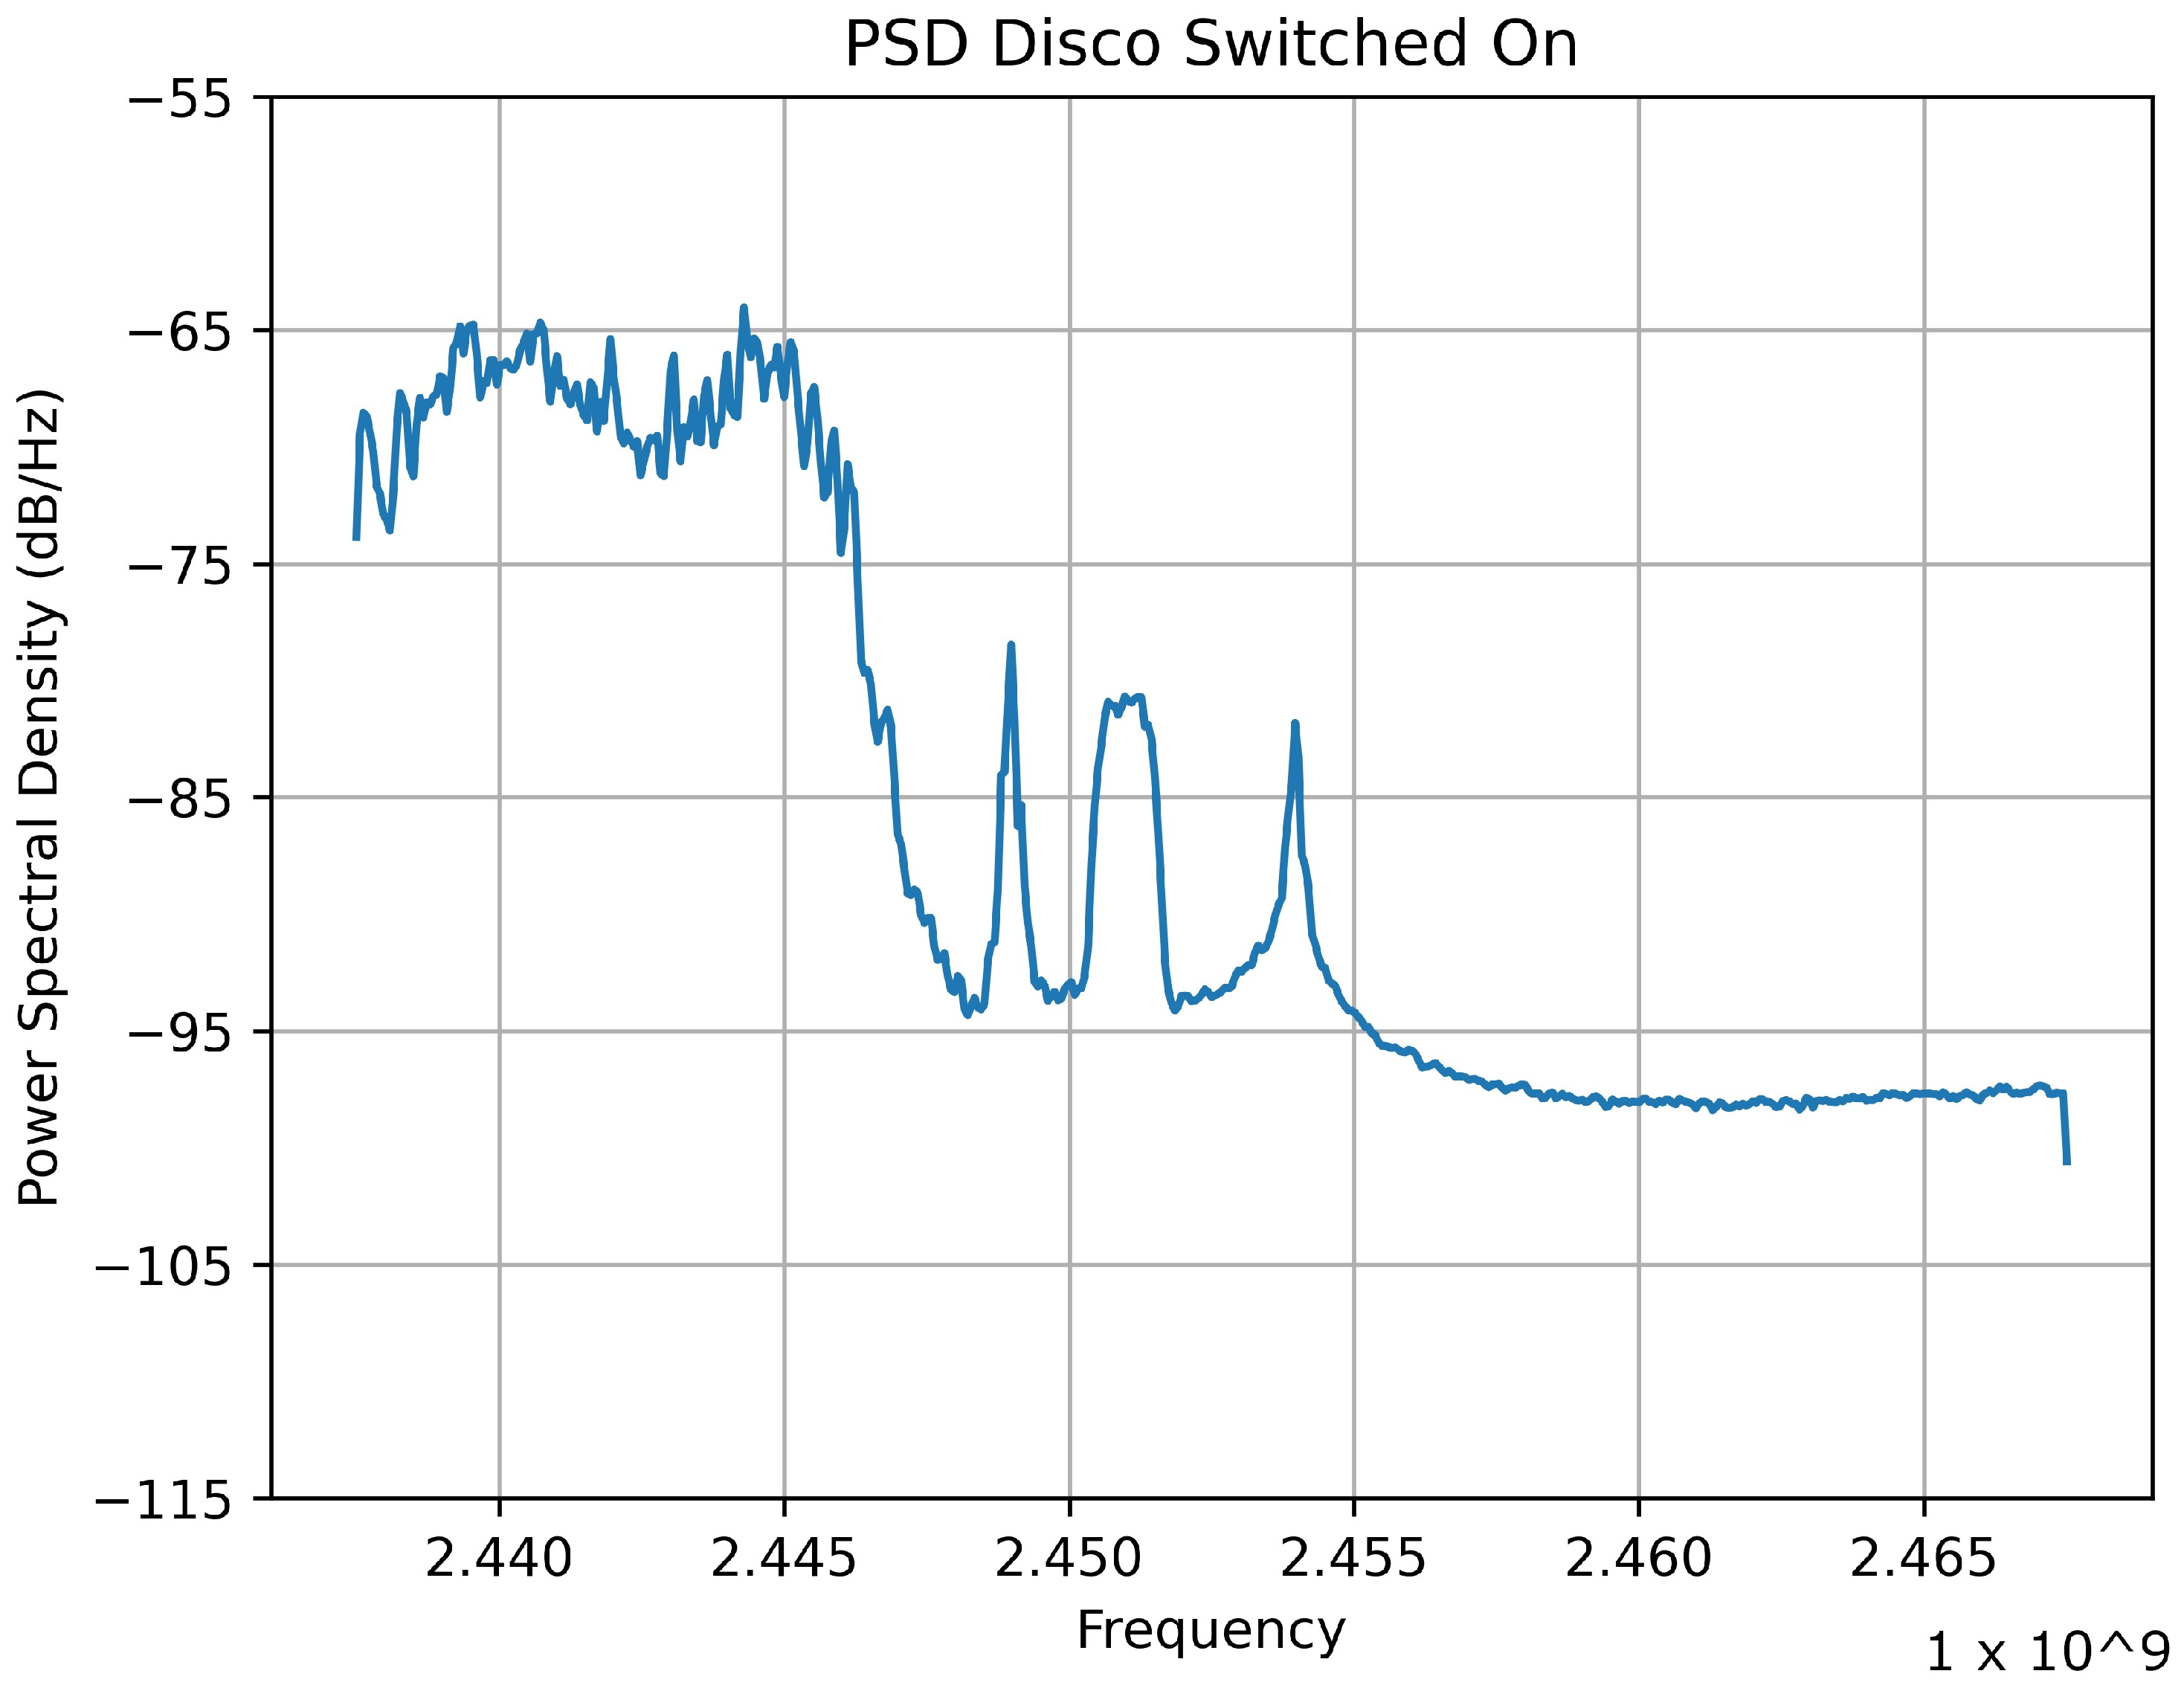
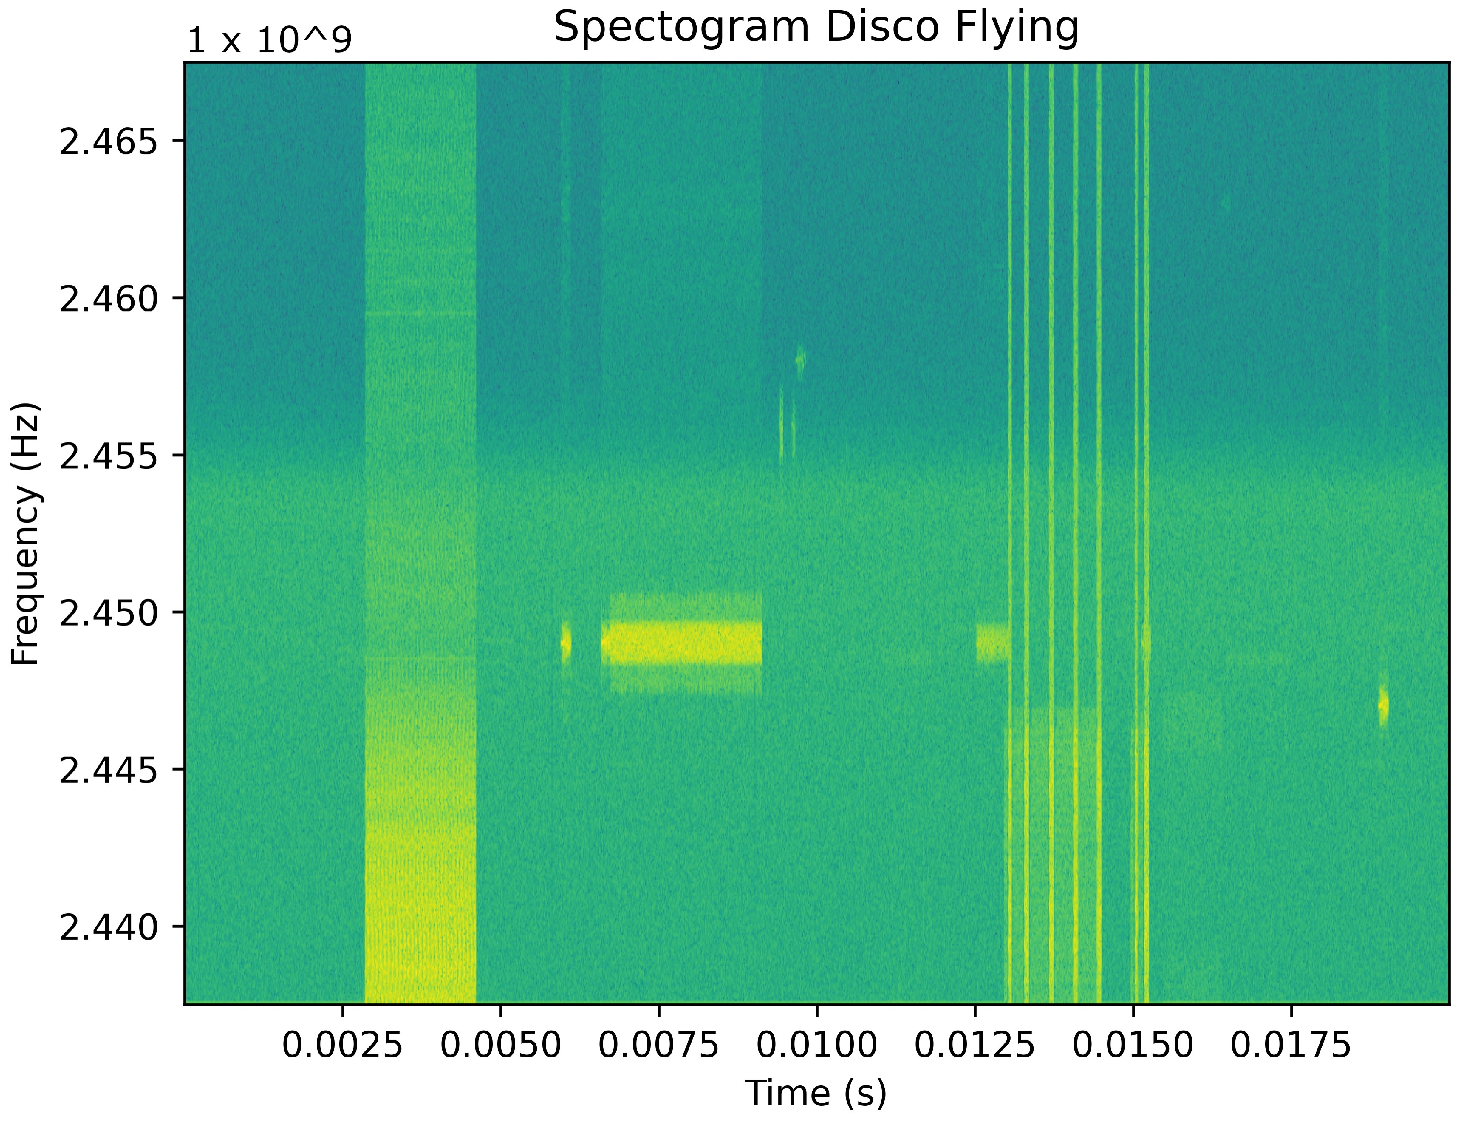
2.2. Graphical Signal Representation
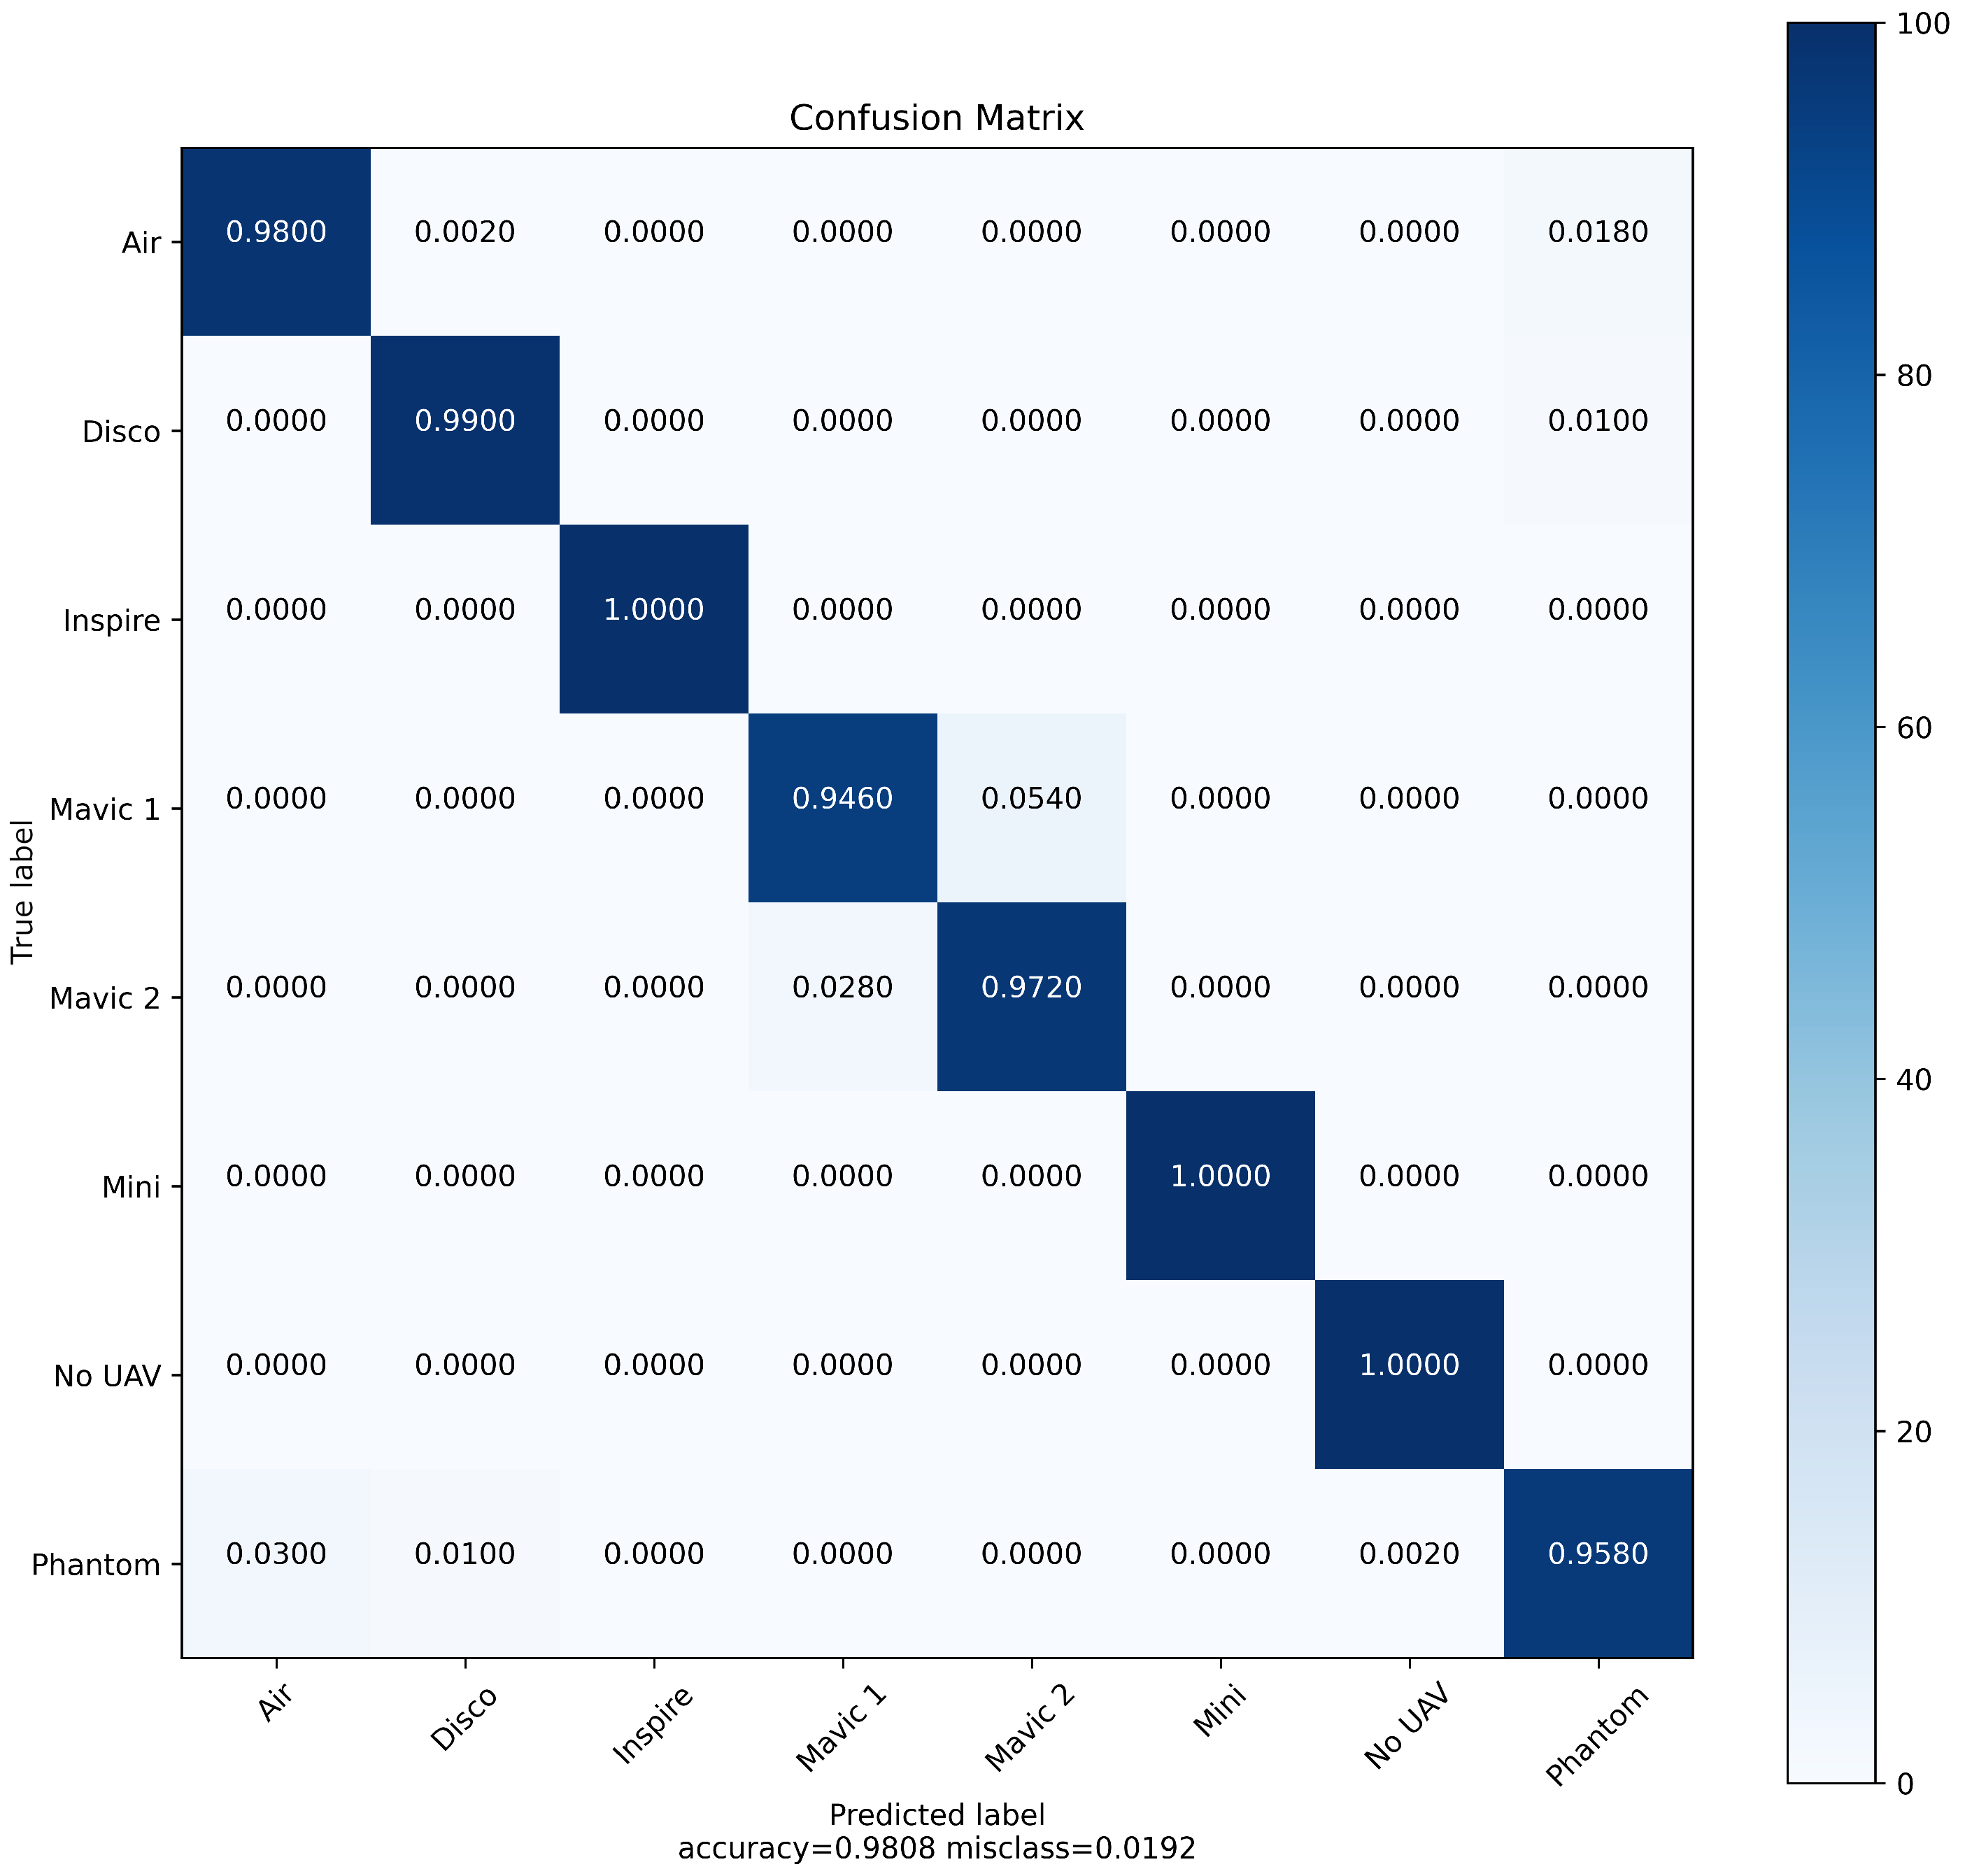
For each 20 ms sample, a power spectral density (PSD) and spectrogram were plotted using Python3 MatplotLib using 1024 FFT, a Hanning window and a 120 overlap. PSD is a representation in the frequency domain considering the power distribution at various frequencies. The spectrogram provides a representation of the power of the signal in the time domain. Considering the signal in different graphical representations allows us to benefit from transfer learning, a technique shown by Swinney and Woods in [44,45]. Figure 2 shows a capture of the spectrum in the time domain where no UAS signals are present, only the interference. The yellow bursts of horizontal activity represent the Bluetooth signal, and the larger vertical band spanning the lower end of the frequency range at the beginning of the time frame is the Wi-Fi signal.
Figure 3 shows the same data represented in the frequency domain through a PSD.
Figure 4 and Figure 5 show Phantom 4 when it is switched on in the presence of Bluetooth and Wi-Fi interference in spectrogram and PSD representations, respectively. We can see some clear activity in the lower end of the spectrum.
If we compare Figure 5 with Figure 3, we can see there is a distinct difference between the shape of the signals. Figure 6 and Figure 7 show Phantom 4 hovering at an altitude of 20 m. If we compare Figure 6 with Figure 4, we can observe an increase in activity in yellow.
Comparing Figure 7 to Figure 5, we can see two spikes in activity compared to three in Figure 7 at the centre frequency. Figure 8 and Figure 9 show Phantom 4 flying. It is clear from looking at Figure 9 compared to Figure 5 and Figure 7 that there is another increase in the number of spikes in power at different frequencies.
Now, we move on from Phantom 4, which is a quadcopter-style UAS, to the Parrot Disco, which is fixed wing. For the Disco, we only have two flight modes, as it is not capable of hovering. Figure 10 and Figure 11 shows the Disco switched on in spectrogram and PSD representations, respectively.
When we compare the Disco switched on in Figure 10 to the Phantom 4 in Figure 4, we can see that the disco is a more concentrated signal with less bursts of activity. However, when we compare Figure 11 to Figure 5, we can see a visible difference in the frequency domain.
Figure 12 and Figure 13 shows the Disco flying. We see an increase in power across the whole band in Figure 11 compared to that in Figure 10 and also with the PSD in Figure 13 compared to Figure 11. It is important to note that what we are observing in the RF spectrum is the transmission system. Table 3 lists the UASs we are looking at against their respective transmission systems.
The DJI range of UASs use three types of transmission system: Wi-Fi, Lightbridge and OcuSync. The Mavic Mini uses Wi-Fi and operates in the 5.8 GHz range (5.725–5.850 GHz) and in the 2.4 GHz range (2.4–2.4835 GHz), with an effective isotropic radiated power (EIRP) or transmission power of 19 dBm at 2.4 GHz [52]. The Lightbridge 2 has a maximum (interference free) transmission distance of 5 km, the EIRP of the antenna is 100 mW at 2.4 GHz, and it can operate in the 5.8 GHz range (5.725–5.825 GHz) and the 2.4 GHz range (2.4–2.483 GHz) [53]. The OcuSync scans the band for any interference and decides which transmission channel is best. It then automatically switches between channels during the flight. OcuSync 1.0 and 2.0 have a range of 7 km; they differ due to Ocusync 2.0 being able to utilise 2.4 and 5.8 GHz frequency diversity. OcuSync 1.0 has an EIRP of 26 dBm [54] and OcuSync 2.0 an EIRP of 25.5 dBm. The OcuSync 3.0 range is increased again to 12 km [55] and EIRP 26 dBm [56]. The Parrot Disco uses the SkyController 2, which is a Wi-Fi-based protocol with a range of 2 km using MIMO antennas in the 2.4 and 5.0 Ghz frequency bands [57].

2.3. Classification

Once the datasets of spectrogram and PSD graph images were created and saved as 224 × 224 pixels, a pre-trained VGG16 CNN on ImageNet [58] was used as a feature extractor. Through a process of transfer learning, neural networks trained for one purpose can be used for another purpose. ImageNet is an object detection database consisting of millions of images. Using a pre-trained VGG-16, we are able to utilise the process of transfer learning. This means we do not need to train our weights from scratch, a procedure which needs a massive amount of data and time. Table 4 shows the structure of a VGG-16 CNN [59].
At the end of the last pooling layer, we are left with 25,088 features. These features are then used to train machine learning classifiers, logistic regression (LR) and k-nearest neighbour (kNN). LR works by fitting an ‘S’ shaped curved, otherwise known as a Sigmoid function, to our features. The equation representing the sigmoid function can be seen in Equation (1).
s i g m o i d ( x ) = 1 / ( 1 + e x )
LR estimates the discrete value based on a set of independent variables. It estimates the probability of occurrence by measuring the relationships between one (or more) of those variables and a categorical dependant variable. Limited-memory Broyden–Fletcher–Goldfarb– Shanno was chosen as the solver for our experiments as it deals with multiclass due to its ability to handle multinomial loss [60]. kNN, on the other hand, uses the dataset to find the closet point to the input point. The classifier then works by using a majority vote of neighbours. The Minkowski distance was utilisied as part of our experiments and can be calculated as show in Equation (2).
s u m ( | x y | p ) ( 1 / p )
The k-nearest neighbour of the particular data point is then found and assigned to the class that has the highest probability.
P ( y = j X = x ) = 1 K i ϵ A I ( y i = j )
Equation (3) shows the probability of an input x being assigned to the class that has the highest probability [61]. For each of the models, fivefold cross validation was used to indicate whether the model was overfitting. Hyper-parameter regularisation for LR and the number of neighbours for kNN were optimised using threefold nested cross-validation. The same process was followed for classification as described in previous work, and more information can be found in the references [44,45].
Accuracy and F1-score were used to evaluate the models’ performances. To understand both metrics, we first must understand that a true positive is when the algorithm predicted, for example, that Phantom 4 was present and it was there in the data. A true negative is where the prediction was no Phantom 4 and the prediction was correct or true. A false positive is where the algorithm thinks Phantom 4 was there but it was not, and, lastly, the false negative predicts that it was not there but it actually was. Accuracy and F1-score can now be defined. Accuracy is show in Equation (4).
A c c u r a c y = T r u e P o s i t i v e + T r u e N e g a t i v e T r u e P o s i t i v e + T r u e N e g a t i v e + F a l s e P o s i t i v e + F a l s e N e g a t i v e
F1-score includes the metrics precision and recall. Equation (5) shows the formula for precision showing how many positive predictions were correct.
P r e c i s i o n = T r u e P o s i t i v e T r u e P o s i t i v e + F a l s e P o s i t i v e
Equation (6) shows the equation for recall and considers the correctly predicted positives as a fraction.
R e c a l l = T r u e P o s i t i v e T r u e P o s i t i v e + F a l s e N e g a t i v e
F1-score can then be calculated as seen in Equation (7).
F 1 - score = 2 ( P r e c i s i o n R e c a l l ) P r e c i s i o n + R e c a l l

3. Results

Table 5 shows that in the presence of real-world interference Bluetooth and Wi-Fi signals, we can still detect a UAS with 100% accuracy and 100% F1-score using LR and PSD graphical representation. UAS-type classification produces 98.1 (+/−0.4)% accuracy and a 98.1 (+/−0.4)% F1-score, with PSD and LR and UAS flight mode classification achieving 95.4 (+/−0.3)% accuracy and a 95.4 (+/−0.3)% F1-score.
Accuracy and F1-score decrease as the classes increase, but high accuracy is maintained for flight mode classification. The table shows that LR outperforms kNN in all the experiments. Time domain features from the spectrogram graphical signal representations are less robust to the interference than frequency domain PSD features are.
Figure 14 shows the confusion matrix for UAS-type classification. We can observe that the classifier has some misclassification between the Mavic Pro and the Mavic 2 Pro. If we go back to Table 3, we can see that the Mavic Pro uses OcuSync 1.0 and that the Mavic 2 Pro uses OcuSync 2.0. The main difference between the two transmission systems is that OcuSync 2.0 utilises both the 2.4 and 5.8 GHz frequency bands. The misclassification is likely due to the similar nature of the systems in the 2.4 GHz band.
Figure 15 shows the confusion matrix for 21 class UAV flight mode classification. We can observe that the misclassification occurs again between the classes of Mavic Pro and Mavic Pro 2, which we can put down to the similarities between OcuSync 1.0 and 2.0. The second area of misclassification occurs between Phantom 4 switched on and Phantom 4 flying. However, the misclassification is small.

4. Discussion

Overall, we have shown that although UASs can prove a serious security challenge, especially in airfield scenarios, detection and classification can be achieved amongst real-world interference. Using CNN feature extraction with transfer learning and machine learning classifiers, UASs operating with the same transmission systems can be distinguished amongst concurrent Bluetooth and Wi-Fi signals. For UAS detection, 100% accuracy can be achieved, and for UAS types and flight mode classification, values of 98.1% (+/−0.4%) and 95.4% (+/−0.3%), respectively, are achieved. Future work should consider more than one UAS of the same type entering the airspace to evaluate how specific the neural network feature extraction is. Further to this, metrics such as detection distance and detection time can be applied for a trained model to detect and classify a UAS in real time to understand real-world feasibility.

Author Contributions

Conceptualisation, C.J.S. and J.C.W.; methodology, C.J.S. and J.C.W.; software, C.J.S.; validation, C.J.S. and J.C.W.; investigation, C.J.S.; resources, C.J.S. and J.C.W.; data curation, C.J.S.; writing—original draft preparation, C.J.S.; writing—review and editing, C.J.S. and J.C.W.; visualisation, C.J.S. and J.C.W.; supervision, J.C.W.; project administration, C.J.S. and J.C.W. All authors have read and agreed to the published version of the manuscript.

Funding

This research received no external funding.

Institutional Review Board Statement

Not applicable.

Informed Consent Statement

Not applicable.

Data Availability Statement

Dataset has been made publically avaliable on IEEE Dataport, details at reference [46].

Acknowledgments

This work was carried out through the support of the School of Computer Science and Electronic Engineering, University of Essex, UK and the Royal Air Force, UK. Special thank you to Pilot Jim Pullen for flying the UAVs needed to produce the dataset for this work.

Conflicts of Interest

The authors declare no conflict of interest.

References

  1. Tagabe, P.M. Economy-wide impact of drones. Infrastruct. Mag. 2021. Available online: https://infrastructuremagazine.com.au/2021/02/10/economy-wide-impact-of-drones/ (accessed on 23 June 2021).
  2. Partidge, J. Royal Mail to deliver to Scilly Isles by drone in first UK trial of its kind. The Guardian, 2021. Available online: https://www.theguardian.com/business/2021/may/10/royal-mail-to-deliver-to-scilly-isles-by-drone-in-first-uk-trial-of-its-kind(accessed on 23 June 2021).
  3. McKenzie, K. US Army General: Small Drones Biggest Threat Since IEDs. The Defense Post, 2021. Available online: https://www.thedefensepost.com/2021/02/10/small-drones-threat-us-general/(accessed on 23 June 2021).
  4. Nassi, B.; Shabtai, A.; Masuoka, R.; Elovici, Y. SoK—Security and privacy in the age of drones: Threats, challenges, solution mechanisms, and scientific gaps. arXiv 2019, arXiv:1903.05155. [Google Scholar]
  5. Altawy, R.; Youssef, A.M. Security, privacy, and safety aspects of civilian drones: A survey. ACM Trans. Cyber Phys. Syst. 2017, 1. [Google Scholar] [CrossRef]
  6. Lykou, G.; Moustakas, D.; Gritzalis, D. Defending airports from uas: A survey on cyber- attacks and counter-drone sensing technologies. Sensors 2020, 20, 3537. [Google Scholar] [CrossRef]
  7. Department for Transport. Small Remotely Piloted Aircraft Systems (Drones) Mid-Air Collision Study; Department of Transport: London, UK, 2017; p. 18. Available online: https://www.gov.uk/government/publications/drones-and-manned-aircraft-collisions-test-results (accessed on 23 June 2021).
  8. A Joint Civil Aviation Authority/Military Aviation Authority Service: Report Number 35. Analysis of Airprox in UK Airspace; UK AirProx Board: Middlesex, UK, 2019. [Google Scholar]
  9. BBC News. ‘Kill switch’ Failed as Drone Hit Controlled Space near GATWICK. BBC News, 2021. Available online: https://www.bbc.co.uk/news/uk-england-sussex-56112694(accessed on 23 June 2021).
  10. NZ Herald. Drone Spotted 30 Metres from Plane at Auckland Airport; NZ Herald, 2021; Available online: https://www.nzherald.co.nz/nz/drone-spotted-30-metres-from-plane-at-auckland-airport/JLFJA4D6OLRHIAHHRZO3W3LVXY/ (accessed on 23 June 2021).
  11. US News. Flights Halted at North Carolina Airport After Drone Sighted|North Carolina News. US News, 2021. Available online: https://www.usnews.com/news/best-states/north-carolina/articles/2021-03-10/flights-halted-at-north-carolina-airport-after-drone-sighted(accessed on 23 June 2021).
  12. Snuggs, T. Madrid Airport Forced to Close for Two Hours after Drone Sightings. Sky News, 2020. Available online: https://news.sky.com/story/madrid-airport-forced-to-close-for-two-hours-after-drone-sightings-11925578(accessed on 23 June 2021).
  13. ITV News. Flights grounded for two hours at Frankfurt airport after drone sighting. ITV News, 2020. Available online: https://www.itv.com/news/2020-03-02/flights-grounded-for-two-hours-at-frankfurt-airport-after-drone-sighting(accessed on 23 June 2021).
  14. Corr, S. Apache Attack Helicopters Assist Essex Police in Hunt for Stansted Airport Drone; Bishops Stortford Independant, 2020; Available online: https://www.bishopsstortfordindependent.co.uk/news/army-helicopters-help-police-hunt-drone-above-stansted-airport-9142882/ (accessed on 23 June 2021).
  15. BBC News. Changi Airport: Drones disrupt flights in Singapore. BBC News, 2019. Available online: https://www.bbc.co.uk/news/business-48754432(accessed on 23 June 2021).
  16. International Airport Review. Drone Sighting at Dubai International Airport Temporarily Suspends Flights. 2019. Available online: https://www.internationalairportreview.com/news/81308/drone-dubai-suspend-flights/ (accessed on 23 June 2021).
  17. Mee, E. Flights resume at Dublin Airport after Drone Sighting. Sky News, 2019. Available online: https://news.sky.com/story/dublin-airport-suspends-flights-after-drone-sighting-11643644(accessed on 23 June 2021).
  18. Lomas, N. Drone sighting at Germany’s busiest airport grounds flights for about an hour. TechCrunch, 9 May 2019. [Google Scholar]
  19. DW News. Frankfurt Airport halts flights after drone sighted. DW News, 2019. Available online: https://www.dw.com/en/frankfurt-airport-halts-flights-after-drone-sighted/a-48030789(accessed on 23 June 2021).
  20. BBC News. Heathrow airport drone investigated by police and military. BBC News, 12 January 2019.
  21. Morrison, S. Heathrow drone protest fails as activists marred by technical breakdowns before police make two arrests. London Evening Standard, 2019. Available online: https://www.standard.co.uk/news/transport/heathrow-drone-protest-four-men-arrested-at-airport-as-climate-activists-prepared-to-disrupt-flights-with-drones-a4235641.html(accessed on 23 June 2021).
  22. Japan Today. Drone disrupts operations at Kansai airport. Japan Today, 2019. Available online: https://japantoday.com/category/national/Drone-disrupts-operations-at-Kansai-airport(accessed on 23 June 2021).
  23. Lee, D. Drone sighting disrupts major US airport. BBC News, 23 January 2019. [Google Scholar]
  24. Shackle, S. The mystery of the Gatwick drone. The Gaurdian, 2020. Available online: https://www.theguardian.com/uk-news/2020/dec/01/the-mystery-of-the-gatwick-drone(accessed on 23 June 2021).
  25. ALADDIN Project ALADDIN—Advanced hoListic Adverse Drone Detection, Identification and Neutralization. ALADDIN Project, 2020. Available online: https://aladdin2020.eu/(accessed on 23 June 2021).
  26. De Cubber, G.; Shalom, R.; Coluccia, A.; Borcan, O.; Chamrád, R.; Radulescu, T.; Izquierdo, E.; Gagov, Z. The SafeShore system for the detection of threat agents in a maritime border environment. In Proceedings of the IARP Workshop on Risky Interventions and Environmental Surveillance, Les Bons Villers, Belgium, 18–19 May 2017. [Google Scholar] [CrossRef]
  27. Mezei, J.; Fiaska, V.; Molnar, A. Drone sound detection. In Proceedings of the CINTI 2015—16th IEEE International Symposium on Computational Intelligence and Informatics, Budapest, Hungary, 19–21 November 2016; pp. 333–338. [Google Scholar] [CrossRef]
  28. Anwar, M.Z.; Kaleem, Z.; Jamalipour, A. Machine Learning Inspired Sound-Based Amateur Drone Detection for Public Safety Applications. IEEE Trans. Veh. Technol. 2019, 68, 2526–2534. [Google Scholar] [CrossRef]
  29. Shi, Z.; Chang, X.; Yang, C.; Wu, Z.; Wu, J. An Acoustic-Based Surveillance System for Amateur Drones Detection and Localization. IEEE Trans. Veh. Technol. 2020, 69, 2731–2739. [Google Scholar] [CrossRef]
  30. Yaacoub, J.P.; Noura, H.; Salman, O.; Chehab, A. Security analysis of drones systems: Attacks, limitations, and recommendations. Internet Things 2020, 11, 100218. [Google Scholar] [CrossRef]
  31. Thai, V.P.; Zhong, W.; Pham, T.; Alam, S.; Duong, V. Detection, Tracking and Classification of Aircraft and Drones in Digital Towers Using Machine Learning on Motion Patterns. In Proceedings of the 2019 Integrated Communications, Navigation and Surveillance Conference (ICNS), Herndon, VA, USA, 9–11 April 2019; pp. 1–8. [Google Scholar] [CrossRef]
  32. Schumann, A.; Sommer, L.; Klatte, J.; Schuchert, T.; Beyerer, J. Deep cross-domain flying object classification for robust UAV detection. In Proceedings of the 2017 14th IEEE International Conference on Advanced Video and Signal Based Surveillance, Lecce, Italy, 29 August–1 September 2017. [Google Scholar] [CrossRef]
  33. AVSS. Drone-vs-Bird Detection Challenge; WOSDETC, 2019; Available online: https://wosdetc2019.wordpress.com/challenge/ (accessed on 23 June 2021).
  34. Coluccia, A.; Fascista, A.; Schumann, A.; Sommer, L.; Dimou, A.; Zarpalas, D.; Méndez, M.; de la Iglesia, D.; González, I.; Mercier, J.-P.; et al. Drone vs. Bird detection: Deep learning algorithms and results from a grand challenge. Sensors 2021, 21, 2824. [Google Scholar] [CrossRef]
  35. Mendis, G.J.; Randeny, T.; Wei, J.; Madanayake, A. Deep learning based doppler radar for micro UAS detection and classification. In Proceedings of the IEEE Military Communications Conference MILCOM, Cleveland, OH, USA, 27–28 June 2016; pp. 924–929. [Google Scholar] [CrossRef]
  36. Zulkifli, S.; Balleri, A. Design and Development of K-Band FMCW Radar for Nano-Drone Detection. In Proceedings of the IEEE National Radar Conference, Florence, Italy, 21–25 September 2020. [Google Scholar] [CrossRef]
  37. Semkin, V.; Yin, M.; Hu, Y.; Mezzavilla, M.; Rangan, S. Drone detection and classification based on radar cross section signatures. In Proceedings of the 2020 International Symposium on Antennas and Propagation, Montreal, QC, Canada, 4–11 July 2021; pp. 223–224. [Google Scholar] [CrossRef]
  38. Andraši, P.; Radišić, T.; Muštra, M.; Ivošević, J. ScienceDirect Night-time Detection of UAVs using Thermal Infrared Camera. Transp. Res. Procedia 2017, 28. [Google Scholar] [CrossRef]
  39. Coluccia, A.; Parisi, G.; Fascista, A. Detection and Classification of Multirotor Drones in Radar Sensor Networks: A Review. Sensors 2020, 20, 4172. [Google Scholar] [CrossRef] [PubMed]
  40. Passafiume, M.; Rojhani, N.; Collodi, G.; Cidronali, A. Modeling Small UAV Micro-Doppler Signature UsingMillimeter-Wave FMCW Radar. Electronics 2020, 10, 747. [Google Scholar] [CrossRef]
  41. Ezuma, M.; Erden, F.; Anjinappa, C.K. Detection and Classification of UAVs Using RF Fingerprints in the Presence of Wi-Fi and Bluetooth Interference. IEEE Open J. Commun. Soc. 2020, 1, 60–76. [Google Scholar] [CrossRef]
  42. Zhao, C.; Chen, C.; Cai, Z.; Shi, M.; Du, X.; Guizani, M. Classification of Small UAVs Based on Auxiliary Classifier Wasserstein GANs. In Proceedings of the 2018 IEEE Global Communications Conference, GLOBECOM, Abu Dhabi, United Arab Emirates, 9–13 December 2018. [Google Scholar] [CrossRef]
  43. Al-Sa’d, M.F.; Al-Ali, A.; Mohamed, A.; Khattab, T.; Erbad, A. RF-based drone detection and identification using deep learning approaches: An initiative towards a large open source drone database. Future Gener. Comput. Syst. 2019, 100, 86–97. [Google Scholar] [CrossRef]
  44. Swinney, C.J.; Woods, J.C. Unmanned Aerial Vehicle Flight Mode Classification using Convolutional Neural Network and Transfer Learning. In Proceedings of the 2020 16th International Computer Engineering Conference (ICENCO), Cairo, Egypt, 29–30 December 2020; pp. 83–87. [Google Scholar]
  45. Swinney, C.J.; Woods, J.C. Unmanned Aerial Vehicle Operating Mode Classification Using Deep Residual Learning Feature Extraction. Aerospace 2021, 8, 79. [Google Scholar] [CrossRef]
  46. Swinney, C.J.; Woods, J.C. DroneDetect Dataset: A Radio Frequency dataset of Unmanned Aerial System (UAS) Signals for Machine Learning Detection and Classification. IEEE Dataport 2021. [Google Scholar] [CrossRef]
  47. GNU Radio. About GNU Radio. GNU Radio. Available online: https://www.gnuradio.org/about/ (accessed on 23 June 2021).
  48. Nuand. bladeRF 2.0. Available online: https://www.nuand.com/bladerf-2-0-micro/ (accessed on 26 April 2021).
  49. Nassar, I.T.; Weller, T.M. A Novel Method for Improving Antipodal Vivaldi Antenna Performance. IEEE Trans. Antennas Propag. 2015, 63, 3321–3324. [Google Scholar] [CrossRef]
  50. De Oliveira, A.M.; Perotoni, M.B.; Kofuji, S.T.; Justo, J.F. A palm tree Antipodal Vivaldi Antenna with exponential slot edge for improved radiation pattern. IEEE Antennas Wirel. Propag. Lett. 2015, 14, 1334–1337. [Google Scholar] [CrossRef]
  51. Tindie. Ultra-WideBand Vivaldi Antenna 800 MHz to 6 GHz+ from Hex and Flex. Tindie. Available online: https://www.tindie.com/products/hexandflex/ultra-wideband-vivaldi-antenna-800mhz-to-6ghz/ (accessed on 23 June 2021).
  52. Mavic Mini—Specifications—DJI. DJI. Available online: https://www.dji.com/uk/mavic-mini/specs (accessed on 23 June 2021).
  53. DJI Lightbridge 2—Product Information—DJI. DJI. Available online: https://www.dji.com/uk/lightbridge-2/info (accessed on 23 June 2021).
  54. DJI. Mavic Pro—Product Information. DJI. Available online: https://www.dji.com/uk/mavic/info (accessed on 23 June 2021).
  55. DJI Store Sofia. What Is DJI OcuSync And How Does it Work? DJI Store Sofia, 2019; Available online: https://store.dji.bg/en/blog/what-is-dji-ocusync-and-how-does-it-work (accessed on 23 June 2021).
  56. DroneLabs CA. Mavic Air 2s. DroneLabs CA. Available online: https://www.dronelabs.ca/products/mavic-air-2s-1 (accessed on 23 June 2021).
  57. Brown, J. Parrot Disco: Features, Reviews, Specifications, Competitors; My Drone Lab, 2021; Available online: https://www.mydronelab.com/reviews/parrot-disco.html (accessed on 23 June 2021).
  58. Krizhevsky, A.; Sutskever, I.; Hinton, G.E. ImageNet Classification with Deep Convolutional Neural Networks. Commun. ACM 2017, 6, 84–90. [Google Scholar] [CrossRef]
  59. Kaggle VGGNet-16 Architecture: A Complete Guide. Kaggle 2020. Available online: https://www.kaggle.com/blurredmachine/vggnet-16-architecture-a-complete-guide (accessed on 24 June 2021).
  60. Hale, J. Don’t Sweat the Solver Stuff. Tips for Better Logistic Regression. Towards Data Sci. 2019. Available online: https://towardsdatascience.com/dont-sweat-the-solver-stuff-aea7cddc3451 (accessed on 23 June 2021).
  61. Pandey, A. The Math Behind KNN. Artif. Intell. Plain Engl. 2021. Available online: https://ai.plainenglish.io/the-math-behind-knn-7883aa8e314c (accessed on 23 June 2021).

Short Biography of Authors

Aerospace 08 00179 i001Carolyn J. Swinney received a B.Eng.(hons.) degree (first class) in 2007 and a M.Sc.(dist.) in Electronics Engineering from the University of Essex, Colchester, UK in 2013. She graduated as a Communications and Electronics Engineering Officer in the Royal Air Force in 2014. She currently works within the Air and Space Warfare Centre and is working towards a Ph.D. degree in Electronic Systems Engineering at the University of Essex, Colchester, UK. Her main research interests are signal processing, unmanned aerial vehicles, neural networks, machine learning and cyber security.
Aerospace 08 00179 i002John C. Woods was born in a small fishing village near Colchester, U.K., in 1964. He received the B.Eng. (hons.) degree (first class) in 1996 and the Ph.D. degree in 1999 from the University of Essex, Colchester, UK. He has been a Lecturer in the Department of Computer Science and Electronic Systems Engineering, University of Essex, since 1999. Although his field of expertise is image processing, he has a wide range of interests including telecommunications, autonomous vehicles and robotics.
Figure 1. Experimental Setup.
Aerospace 08 00179 g001
Figure 2. Spectrogram: No UAS present.
Aerospace 08 00179 g002
Figure 3. PSD: No UAS present.
Aerospace 08 00179 g003
Figure 4. Spectrogram: Phantom 4 switched on.
Aerospace 08 00179 g004
Figure 5. PSD: Phantom 4 switched on.
Aerospace 08 00179 g005
Figure 6. Spectrogram: Phantom 4 hovering.
Aerospace 08 00179 g006
Figure 7. PSD: Phantom 4 hovering.
Aerospace 08 00179 g007
Figure 8. Spectrogram: Phantom 4 flying.
Aerospace 08 00179 g008
Figure 9. PSD: Phantom 4 flying.
Aerospace 08 00179 g009
Figure 10. Spectrogram: Disco switched on.
Aerospace 08 00179 g010
Figure 11. PSD: Disco switched on.
Aerospace 08 00179 g011
Figure 12. Spectrogram: Disco flying.
Aerospace 08 00179 g012
Figure 13. PSD: Disco flying.
Aerospace 08 00179 g013
Figure 14. UAS type classification confusion matrix.
Aerospace 08 00179 g014
Figure 15. UAS flight mode classification confusion matrix.
Aerospace 08 00179 g015
Table 1. UAS Airport Disruptions.
DateLocationObservationDisruption
2021Auckland Airport, New Zealand [10]Pilot sighting of drone 30 m from helicopter and 5 m aboveFlights grounded 15 min
2021Piedmont Triad International Airport, North Carolina Airport, USA [11]Drone sightings over airportFlights suspended 2 h, 1 flight diverted
2020Adolfo Suárez-Barajas Airport, Spain [12]2 pilot sightings of dronesFlights grounded 1 h, 26 flights diverted
2020Frankfurt Airport, Germany [13]Pilot sighting of droneFlights grounded 2 h, flights diverted and cancelled
2020Stansted Airport, UK [14]Military helicopter confirmed sighting of droneNo flight disruption, one police arrest made
2019Changi Airport, Singapore [15]Drone sightings in vicinity of airport37 flights delayed, 1 flight diverted
2019Dubai Airport [16]Drone sightings in vicinity of airport30 min suspension of flights
2019Dublin Airport, Ireland [17]Pilot sighting of droneFlights grounded 30 min, 3 flights diverted
2019Frankfurt Airport, Germany [18]Sighting of droneFlights grounded 1 h, 100 take-offs and landings were cancelled
2019Frankfurt Airport, Germany [19]Sighting of droneFlights grounded 30 min
2019Heathrow Airport, UK [20]Undisclosed number of sightingsFlights grounded for 1 h
2019Heathrow Airport, UK [21]Heathrow Pause group planned drone flights to disrupt flights1 attempted flight which was unsuccessful
2019Kansai International Airport, Japan [22]Drone sighted hovering near terminal and flying over runway 1 week prior aircrew sighting of drone in vicinity of incoming aircraft1 h suspension flights 40 min suspension of flights
2019Newark Airport, USA [23]2 pilot sightings on route into Newark, above Teterboro airport, drone coming within 9 m of aircraftFlights disrupted for short duration
2018Gatwick Airport, UK [24]170 sightings, 115 sightings deemed credibleAirport closed for 33 h, 1000 flights cancelled, 140,000 passengers affects at a cost of GBP 50 million. 18 month police operation costing GBP 800,000 across 5 different forces.
Table 2. UAS Classes.
Classification TypeClassDescription
Detection1No UAS detected
Detection2UAS detected
midrule Type1No UAS detected
Type2Mavic 2 Air S detected
Type3Parrot Disco detected
Type4Inspire 2 Pro detected
Type5Mavic Pro detected
Type6Mavic Pro 2 detected
Type7Mavic Mini detected
Type8Phantom 4 detected
midruleFlight Mode1No UAS detected
Flight Mode2Air Mode 1—Switched on
Flight Mode3Air Mode 2—Hovering
Flight Mode4Air Mode 3—Flying
Flight Mode5Disco Mode 1—Switched on
Flight Mode6Disco Mode 3—Flying
Flight Mode7Inspire Mode 1—Switched on
Flight Mode8Inspire Mode 2—Hovering
Flight Mode9Inspire Mode 3—Flying
Flight Mode10Mavic 1 Mode 1—Switched on
Flight Mode11Mavic 1 Mode 2—Hovering
Flight Mode12Mavic 1 Mode 3—Flying
Flight Mode13Mavic Pro 2 Mode 1—Switched on
Flight Mode14Mavic Pro 2 Mode 2—Hovering
Flight Mode15Mavic Pro 2 Mode 3—Flying
Flight Mode16Mini Mode 1—Switched on
Flight Mode17Mini Mode 2—Hovering
Flight Mode18Mini Mode 3—Flying
Flight Mode19Phantom 4 Mode 1—Switched on
Flight Mode20Phantom 4 Mode 2—Hovering
Flight Mode21Phantom Mode 3—Flying
Table 3. UAS Transmission Systems.
UAS TypeTransmission System
Mavic 2 Air SOcuSync 3.0
Parrot DiscoWi-Fi
Inspire 2 ProLightbridge 2.0
Mavic ProOcuSync 1.0
Mavic Pro 2OcuSync 2.0
Mavic MiniWi-Fi
Phantom 4Lightbridge 2.0
Table 4. VGG-16 CNN.
Layer TypeSizeFeature Map
Input Image224 × 224 × 31
2× Convolutional224 × 224 × 6464
Max Pooling112 × 112 × 6464
2× Convolutional112 × 112 × 128128
Max Pooling56 × 56 × 128128
2× Convolutional56 × 56 × 256256
Max Pooling28 × 28 × 256256
3× Convolutional28 × 28 × 512512
Max Pooling14 × 14 × 512512 v
3× Convolutional14 × 14 × 512512
Max Pooling7 × 7 × 512512 v
Table 5. Results accuracy (%) and F1-score (%).
Classifier MetricDetectionTypeFlight
LRPSDAcc100(+/−0.0)98.1 (+/−0.4)95.4 (+/−0.3)
PSDF1100(+/−0.0)98.1 (+/−0.4)95.4 (+/−0.3)
SpecAcc96.7 (+/−1.5)90.5 (+/−0.8)87.3 (+/−0.4)
SpecF196.7 (+/−1.5)90.5 (+/−0.9)87.3 (+/−0.4)
kNNPSD
PSDAcc99.6 (+/−0.2)93.5 (+/−0.6)86.5 (+/−0.5)
PSDF199.6 (+/−0.2)93.4 (+/−0.7)86.3 (+/−0.5)
SpecAcc88.0 (+/−1.3)75.1 (+/−1.5)64.6 (+/−0.9)
SpecF187.9 (+/−1.4)75.3 (+/−1.5)64.8 (+/−0.8)
Publisher’s Note: MDPI stays neutral with regard to jurisdictional claims in published maps and institutional affiliations.

