
Background Pressure Effects on the Performance of a 20 kW Magnetically Shielded Hall Thruster Operating in Various Configurations

 ,
,
Abstract

1. Introduction
2. Materials and Methods
2.1. HT20k Second Development Model, the HT20k DM2
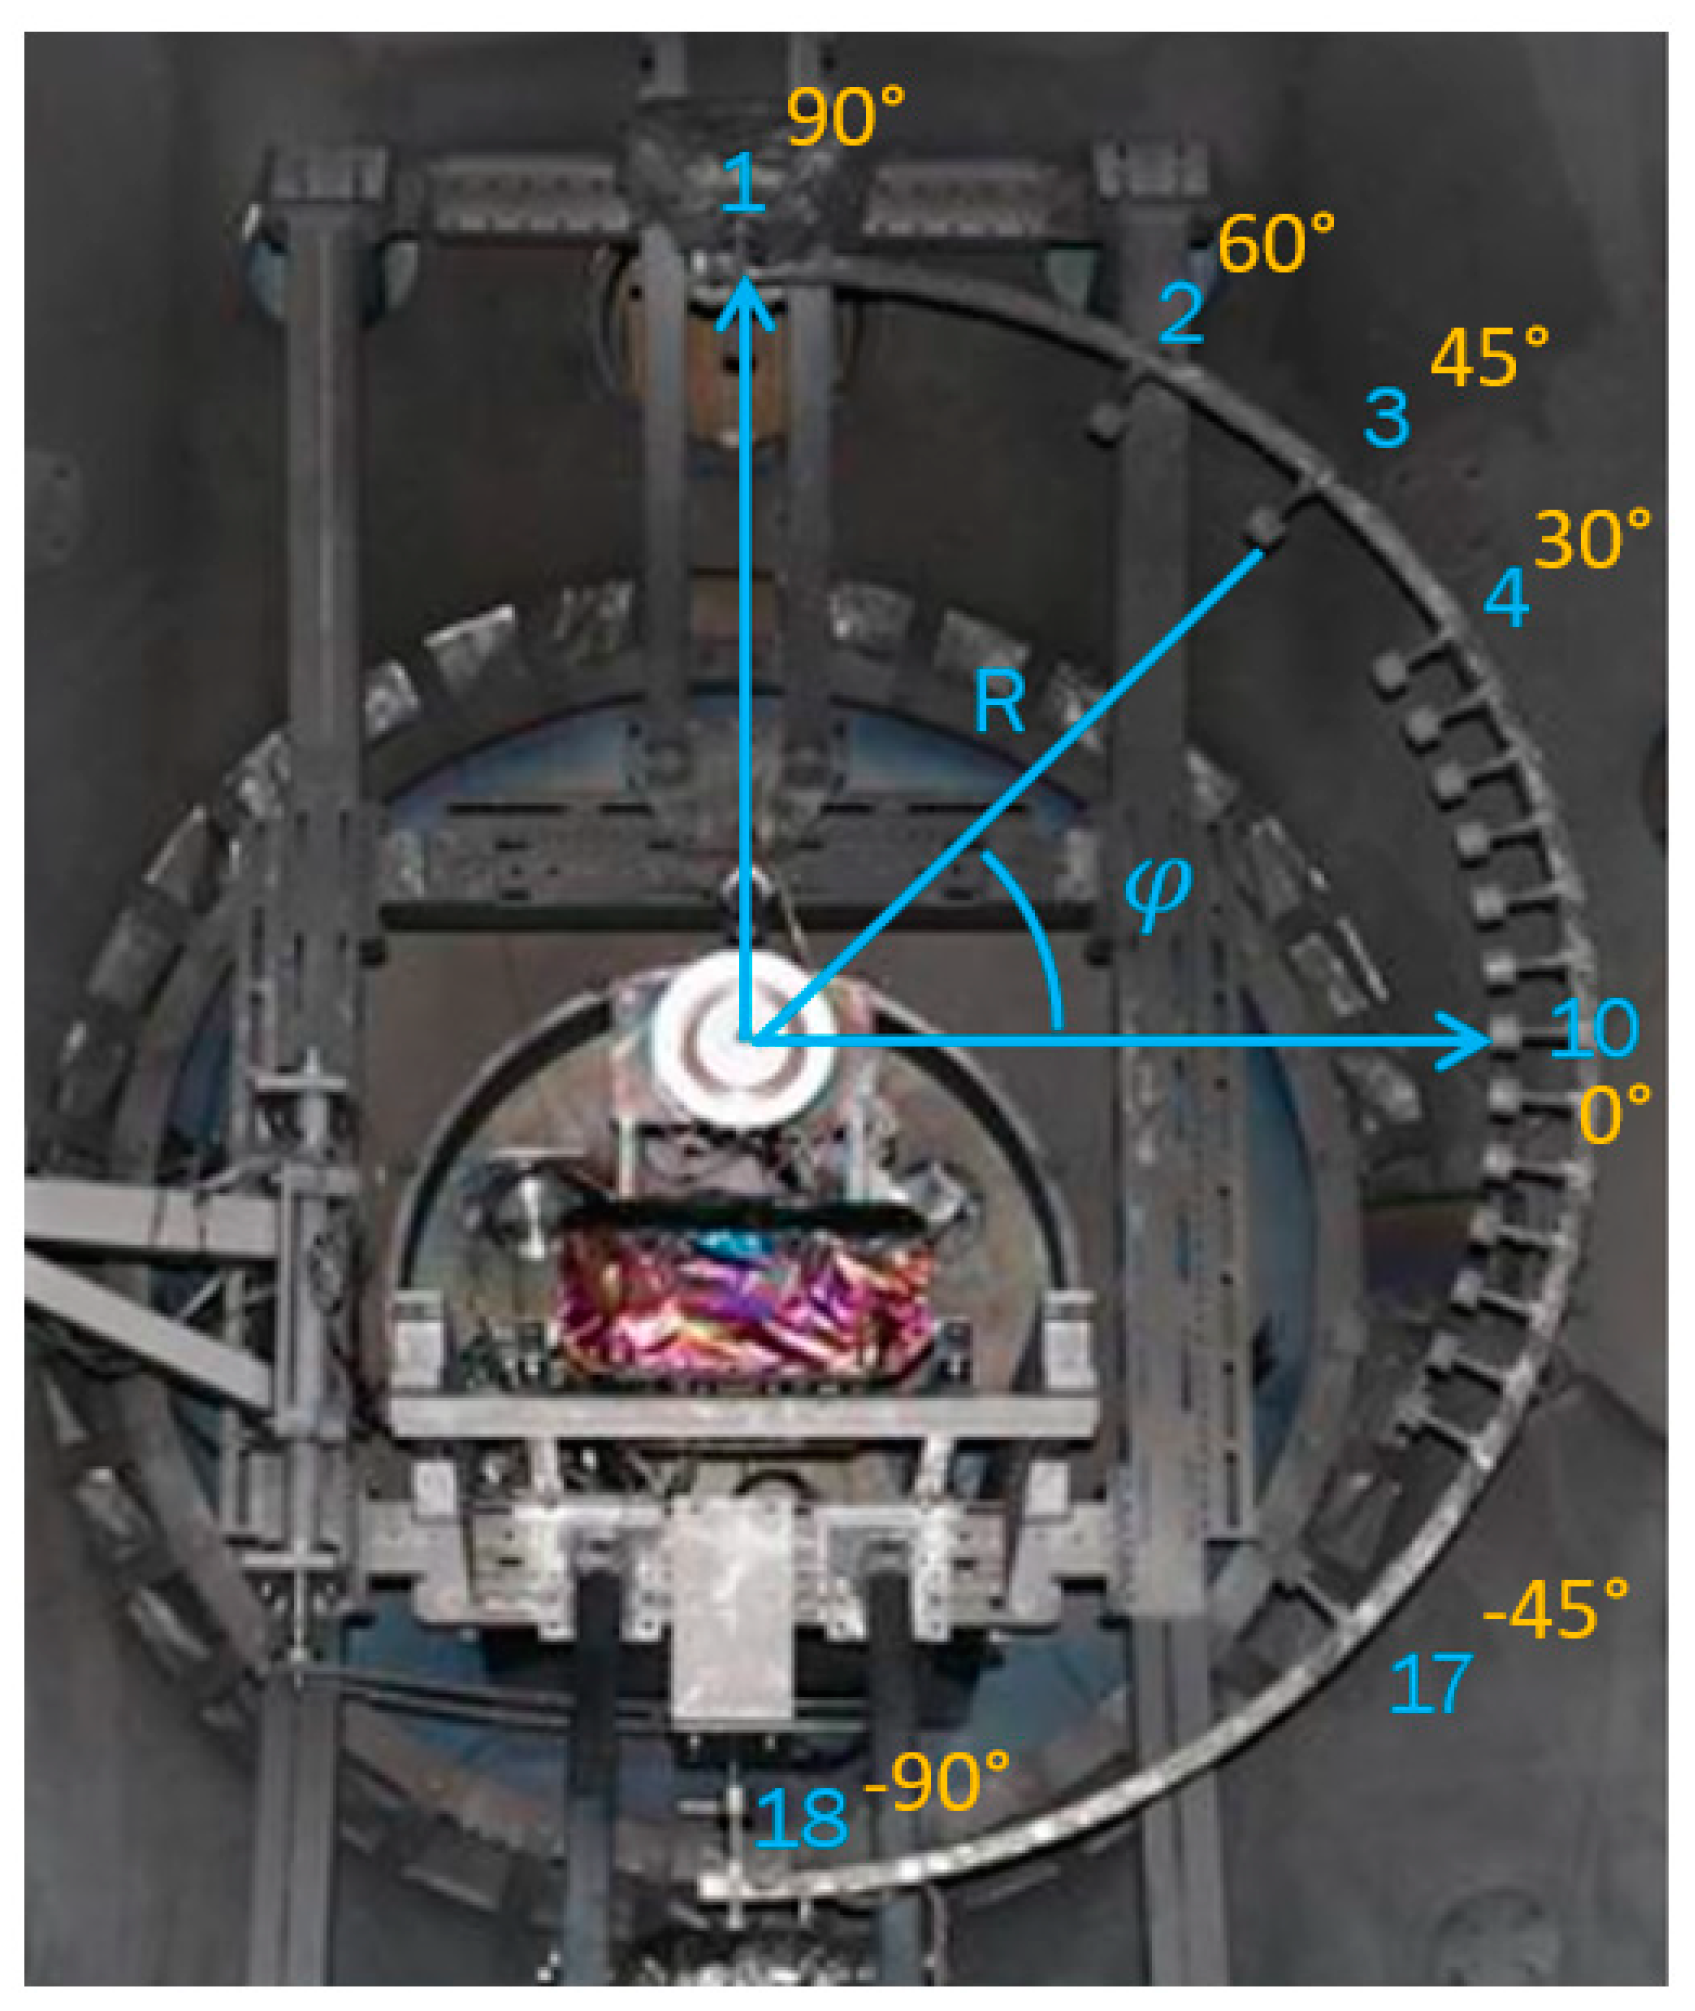
2.2. Vacuum Facility, Electrical Configuration, and Diagnotics
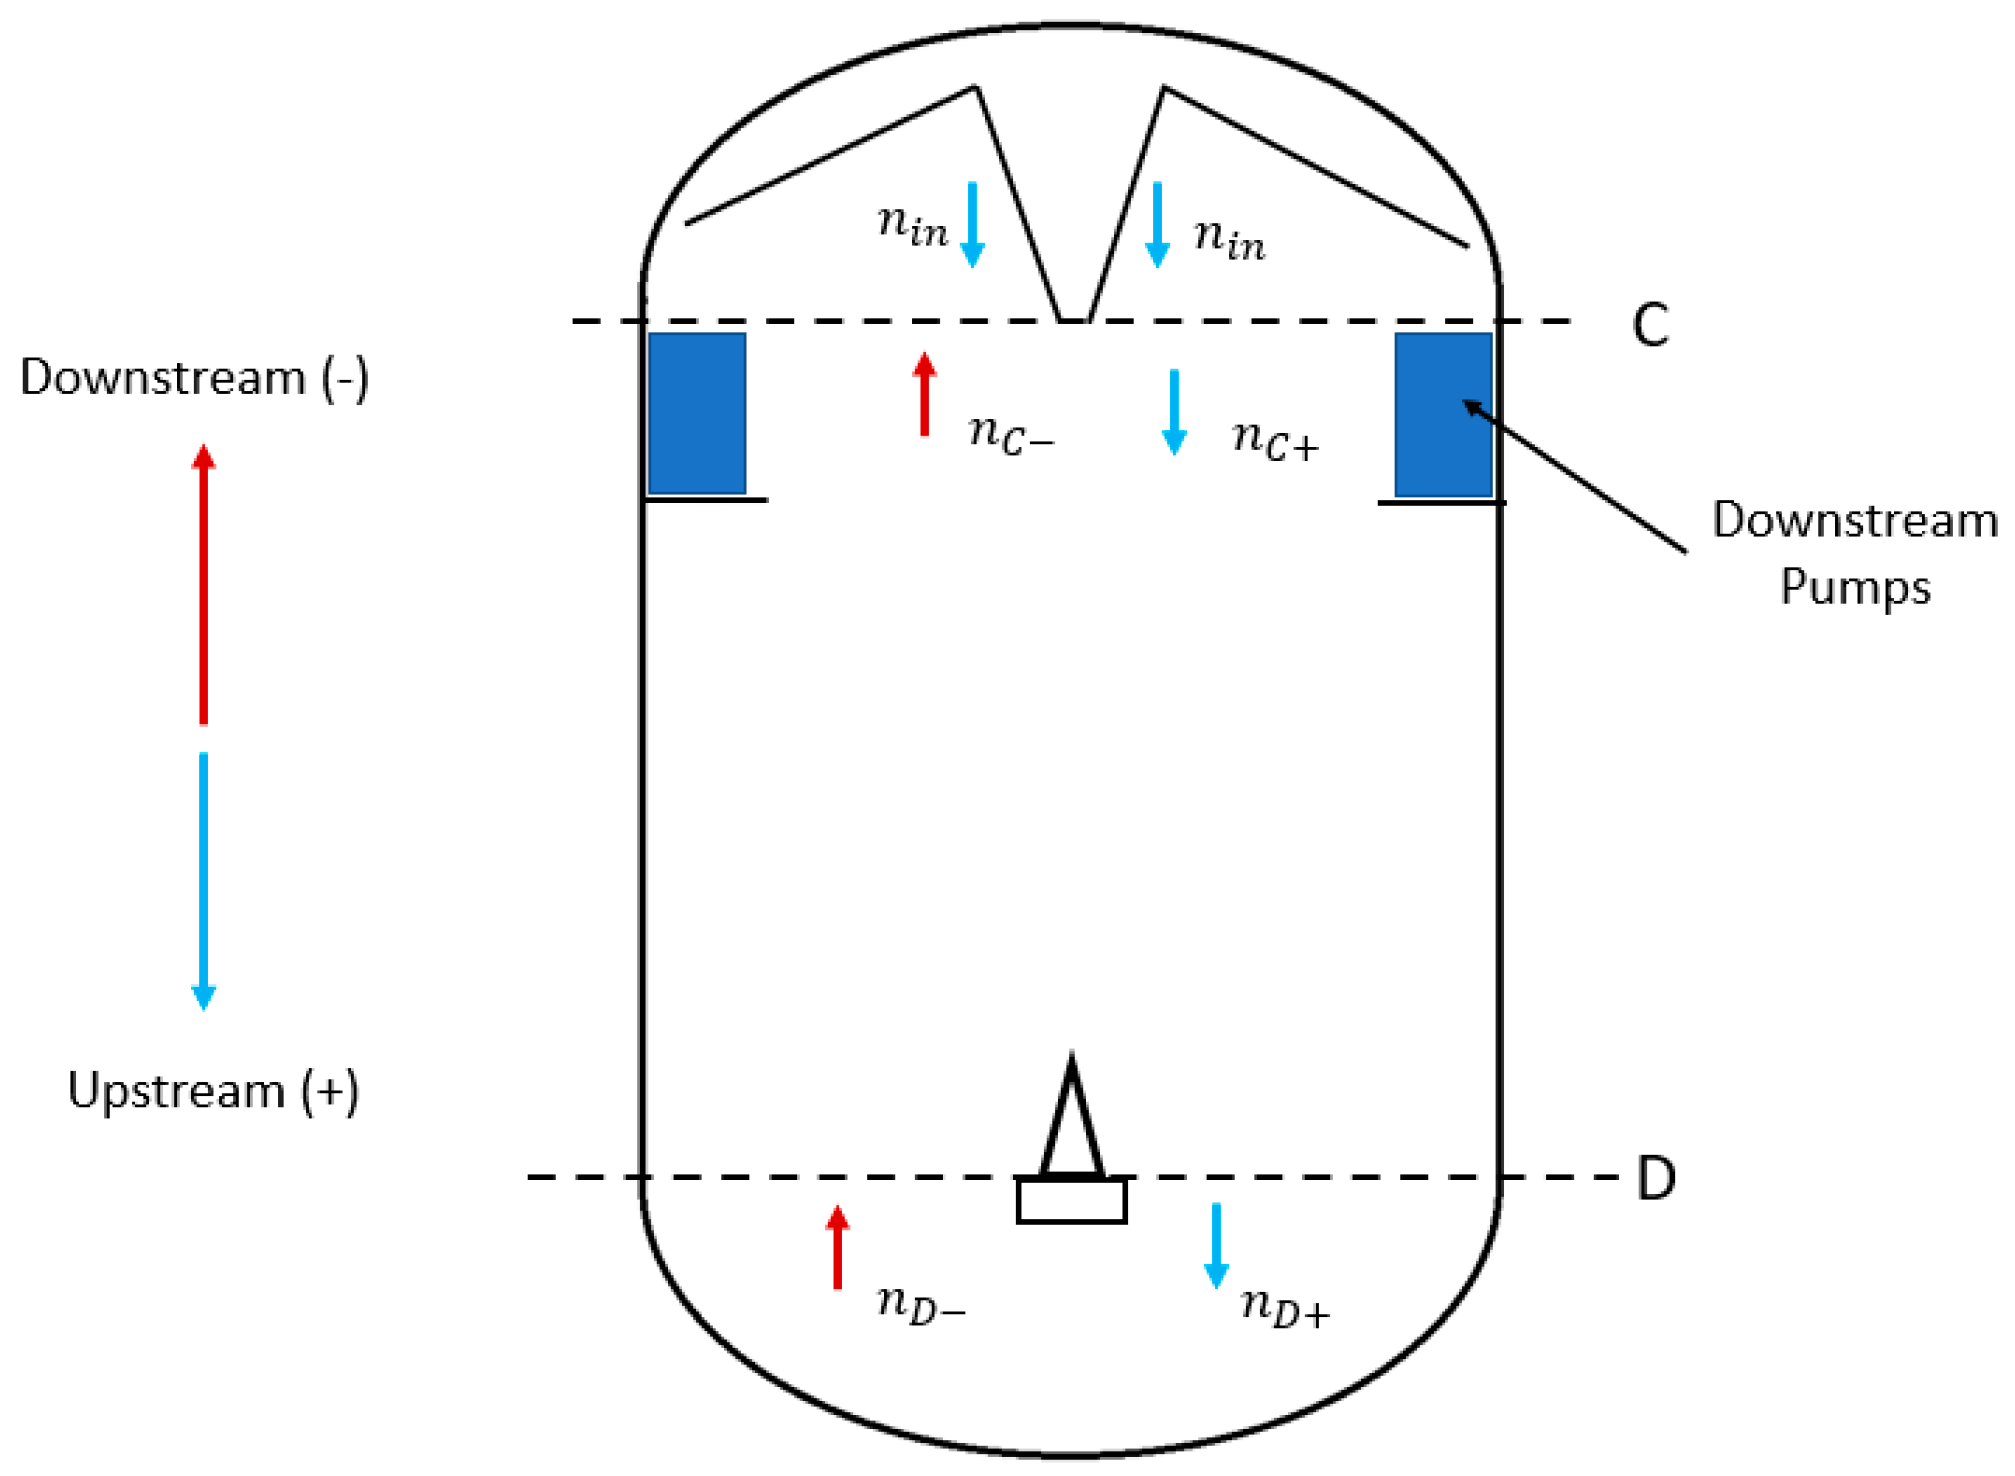
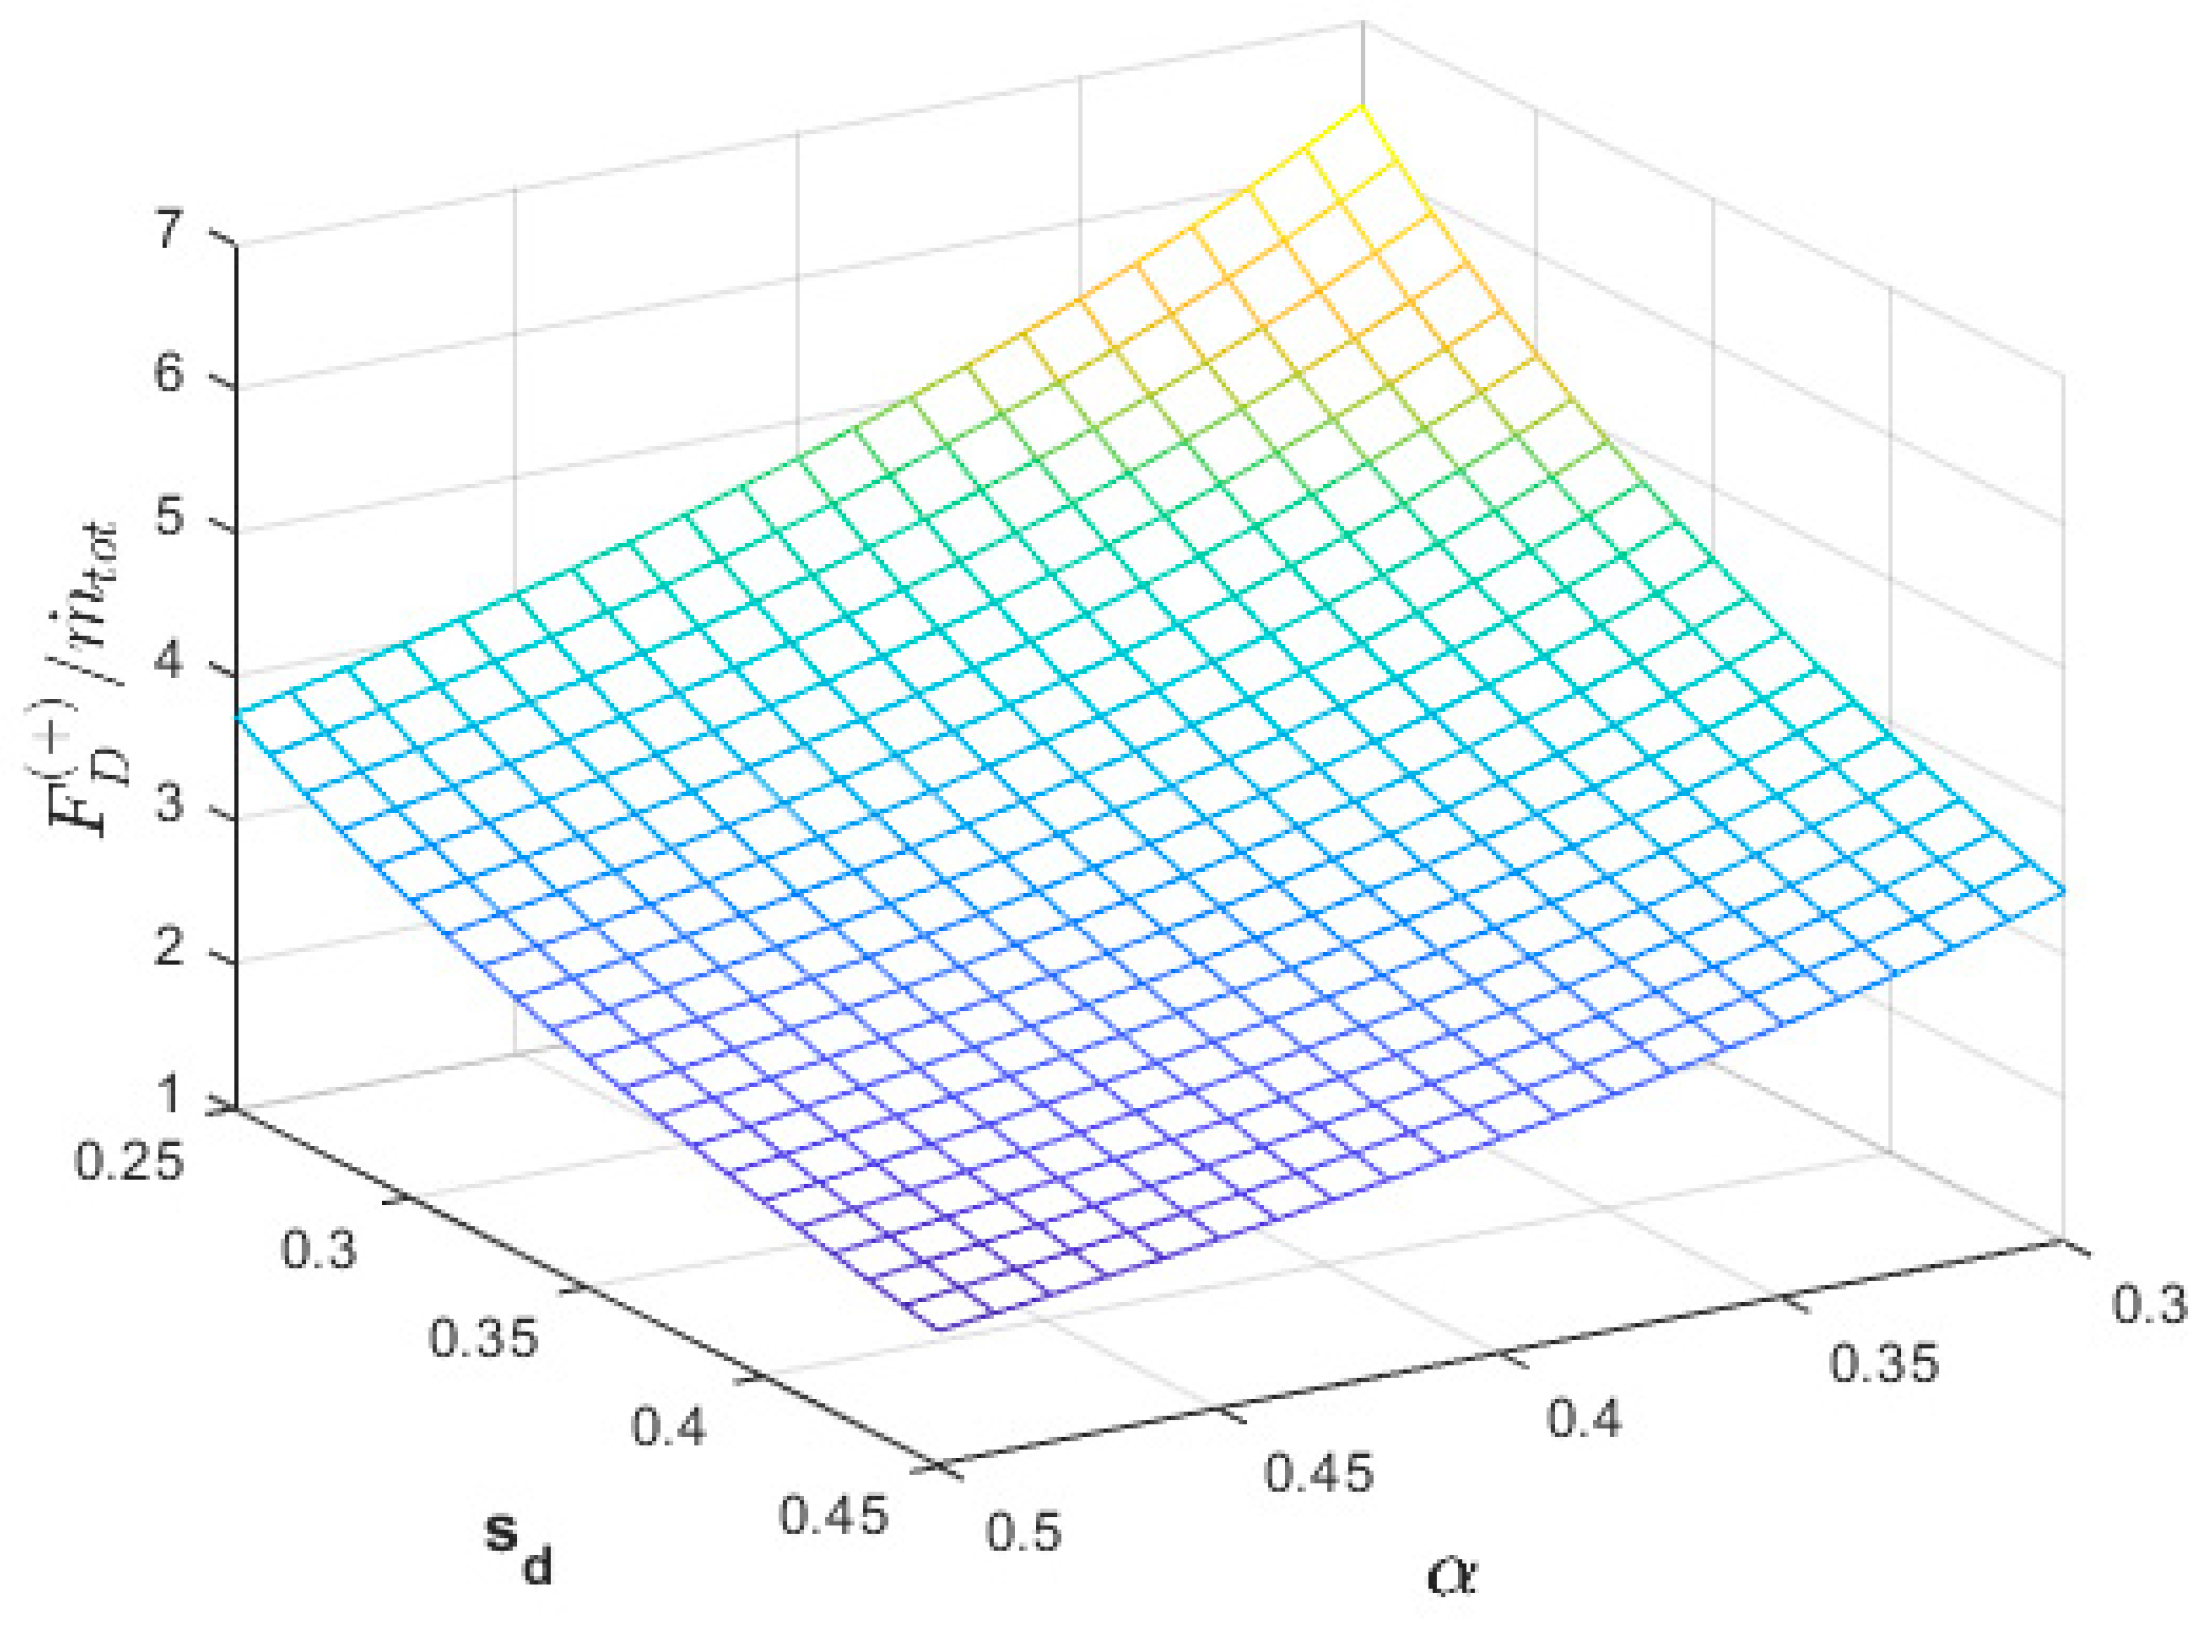
2.3. Background Flow Model
2.4. Thrust and Discharge Current
3. Results
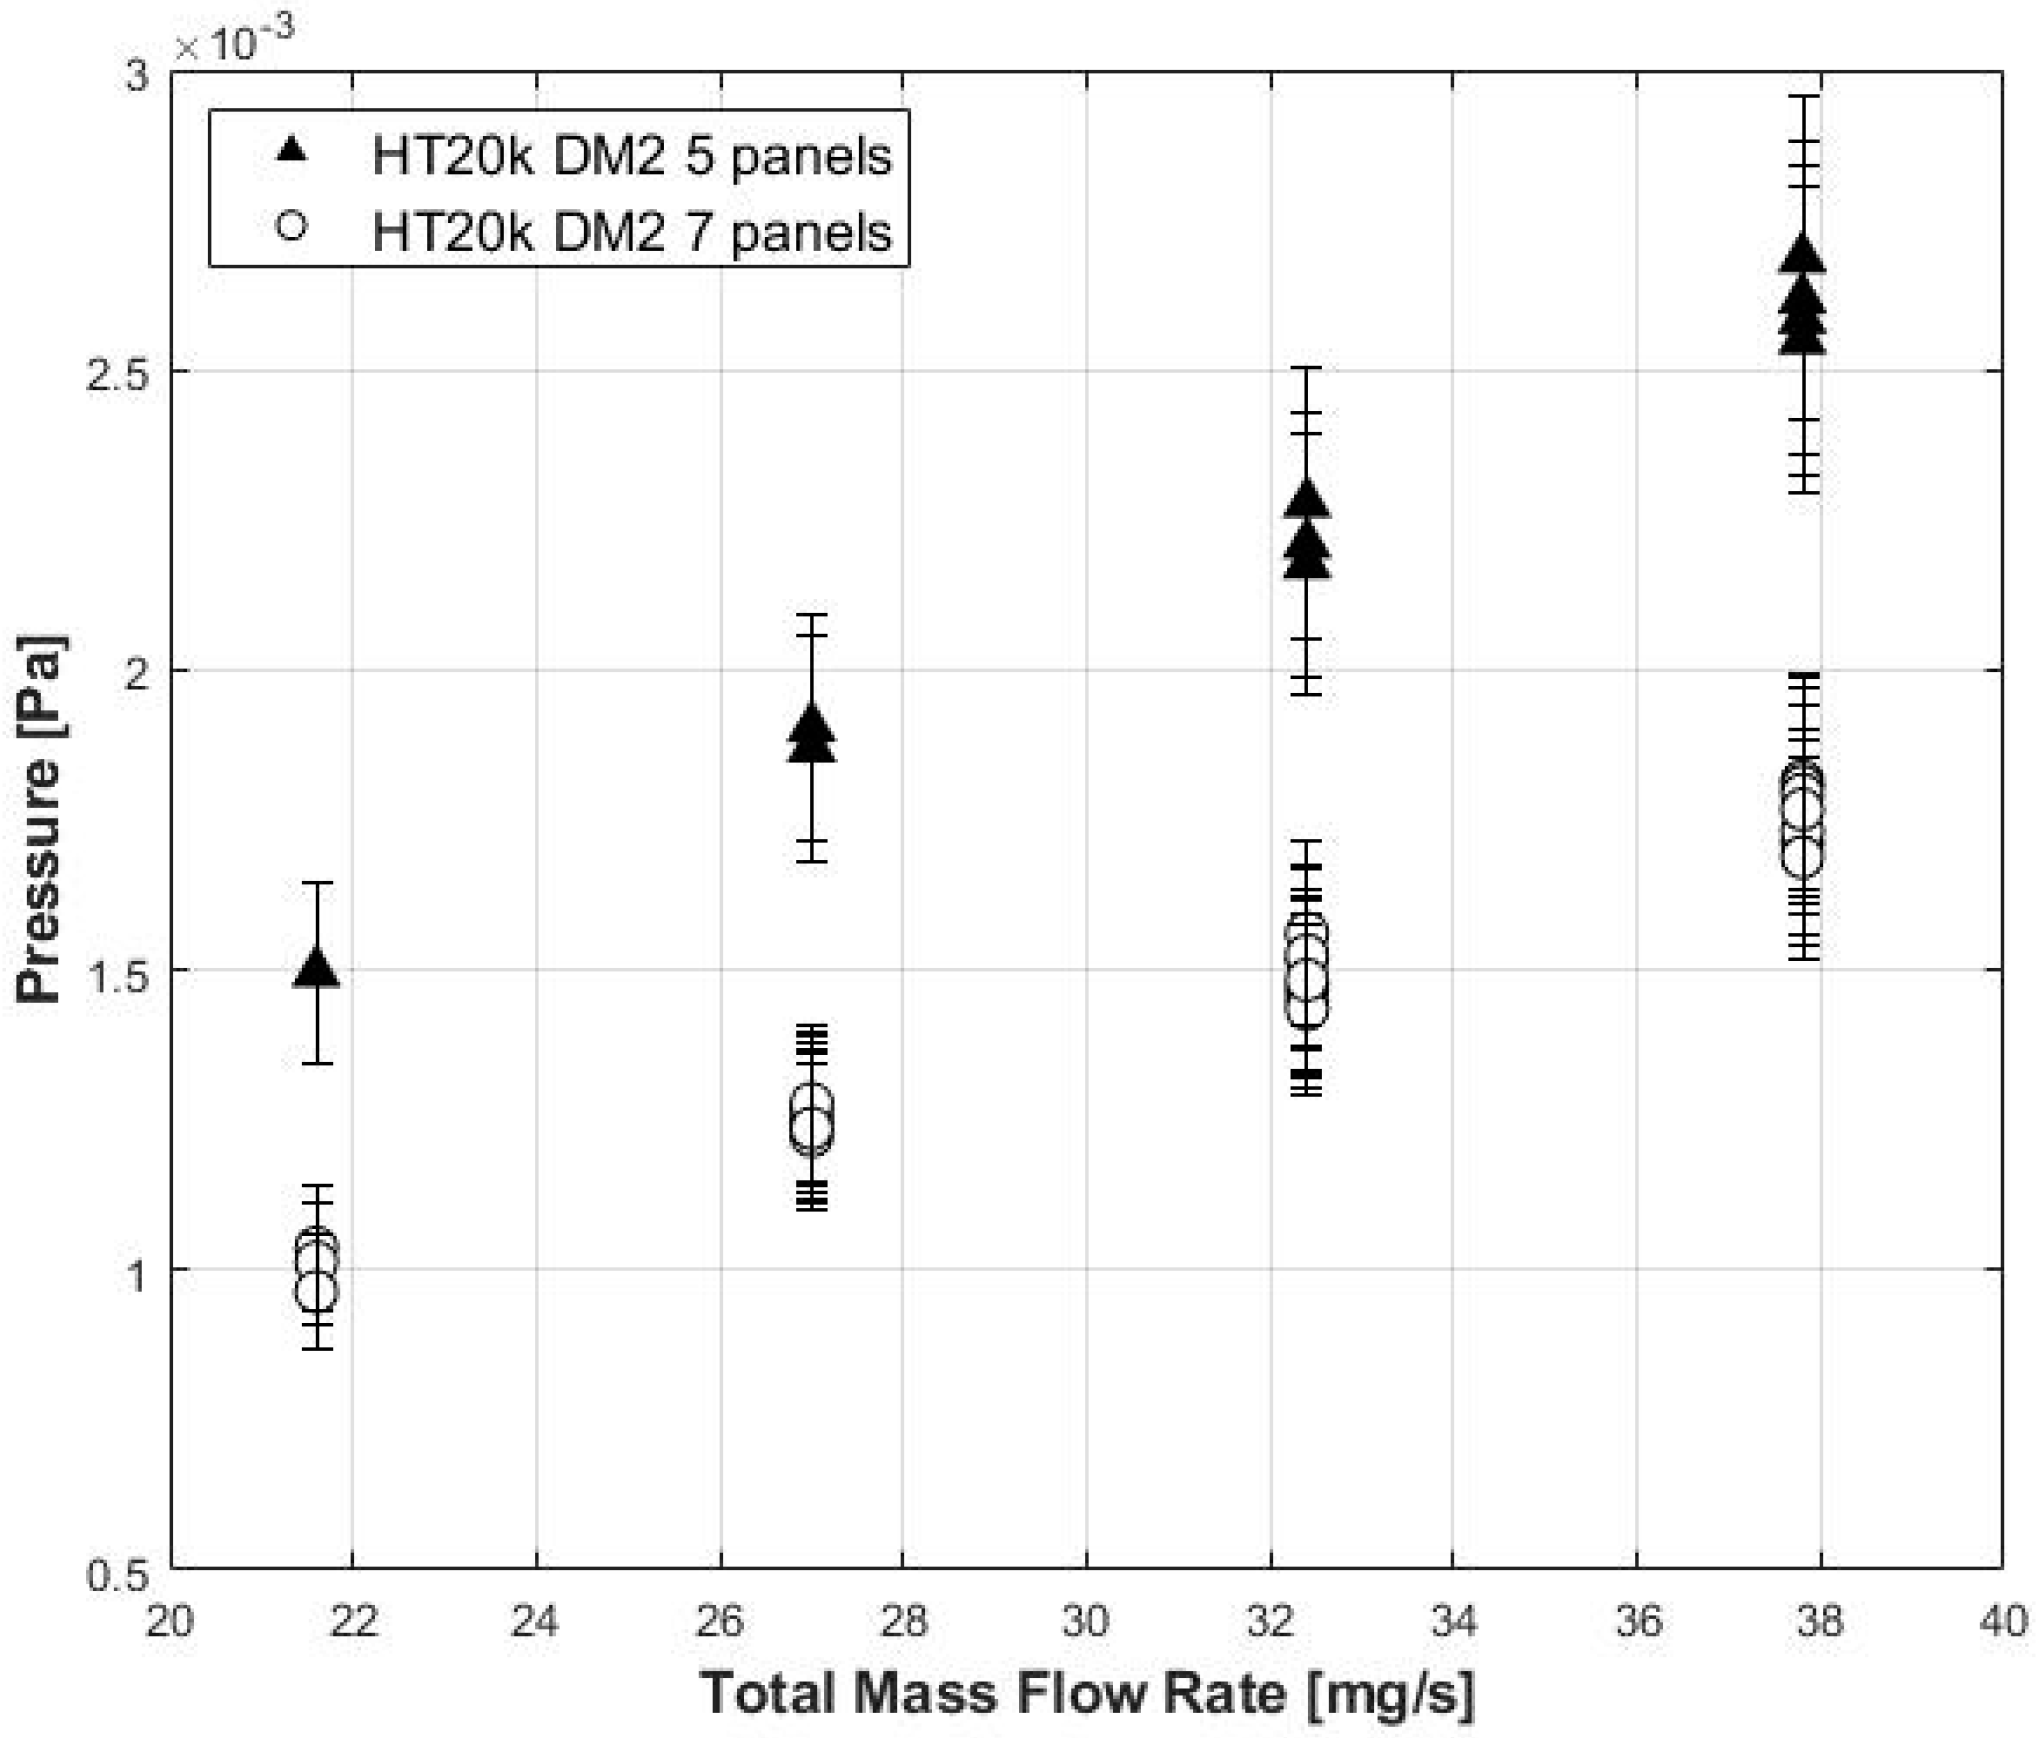
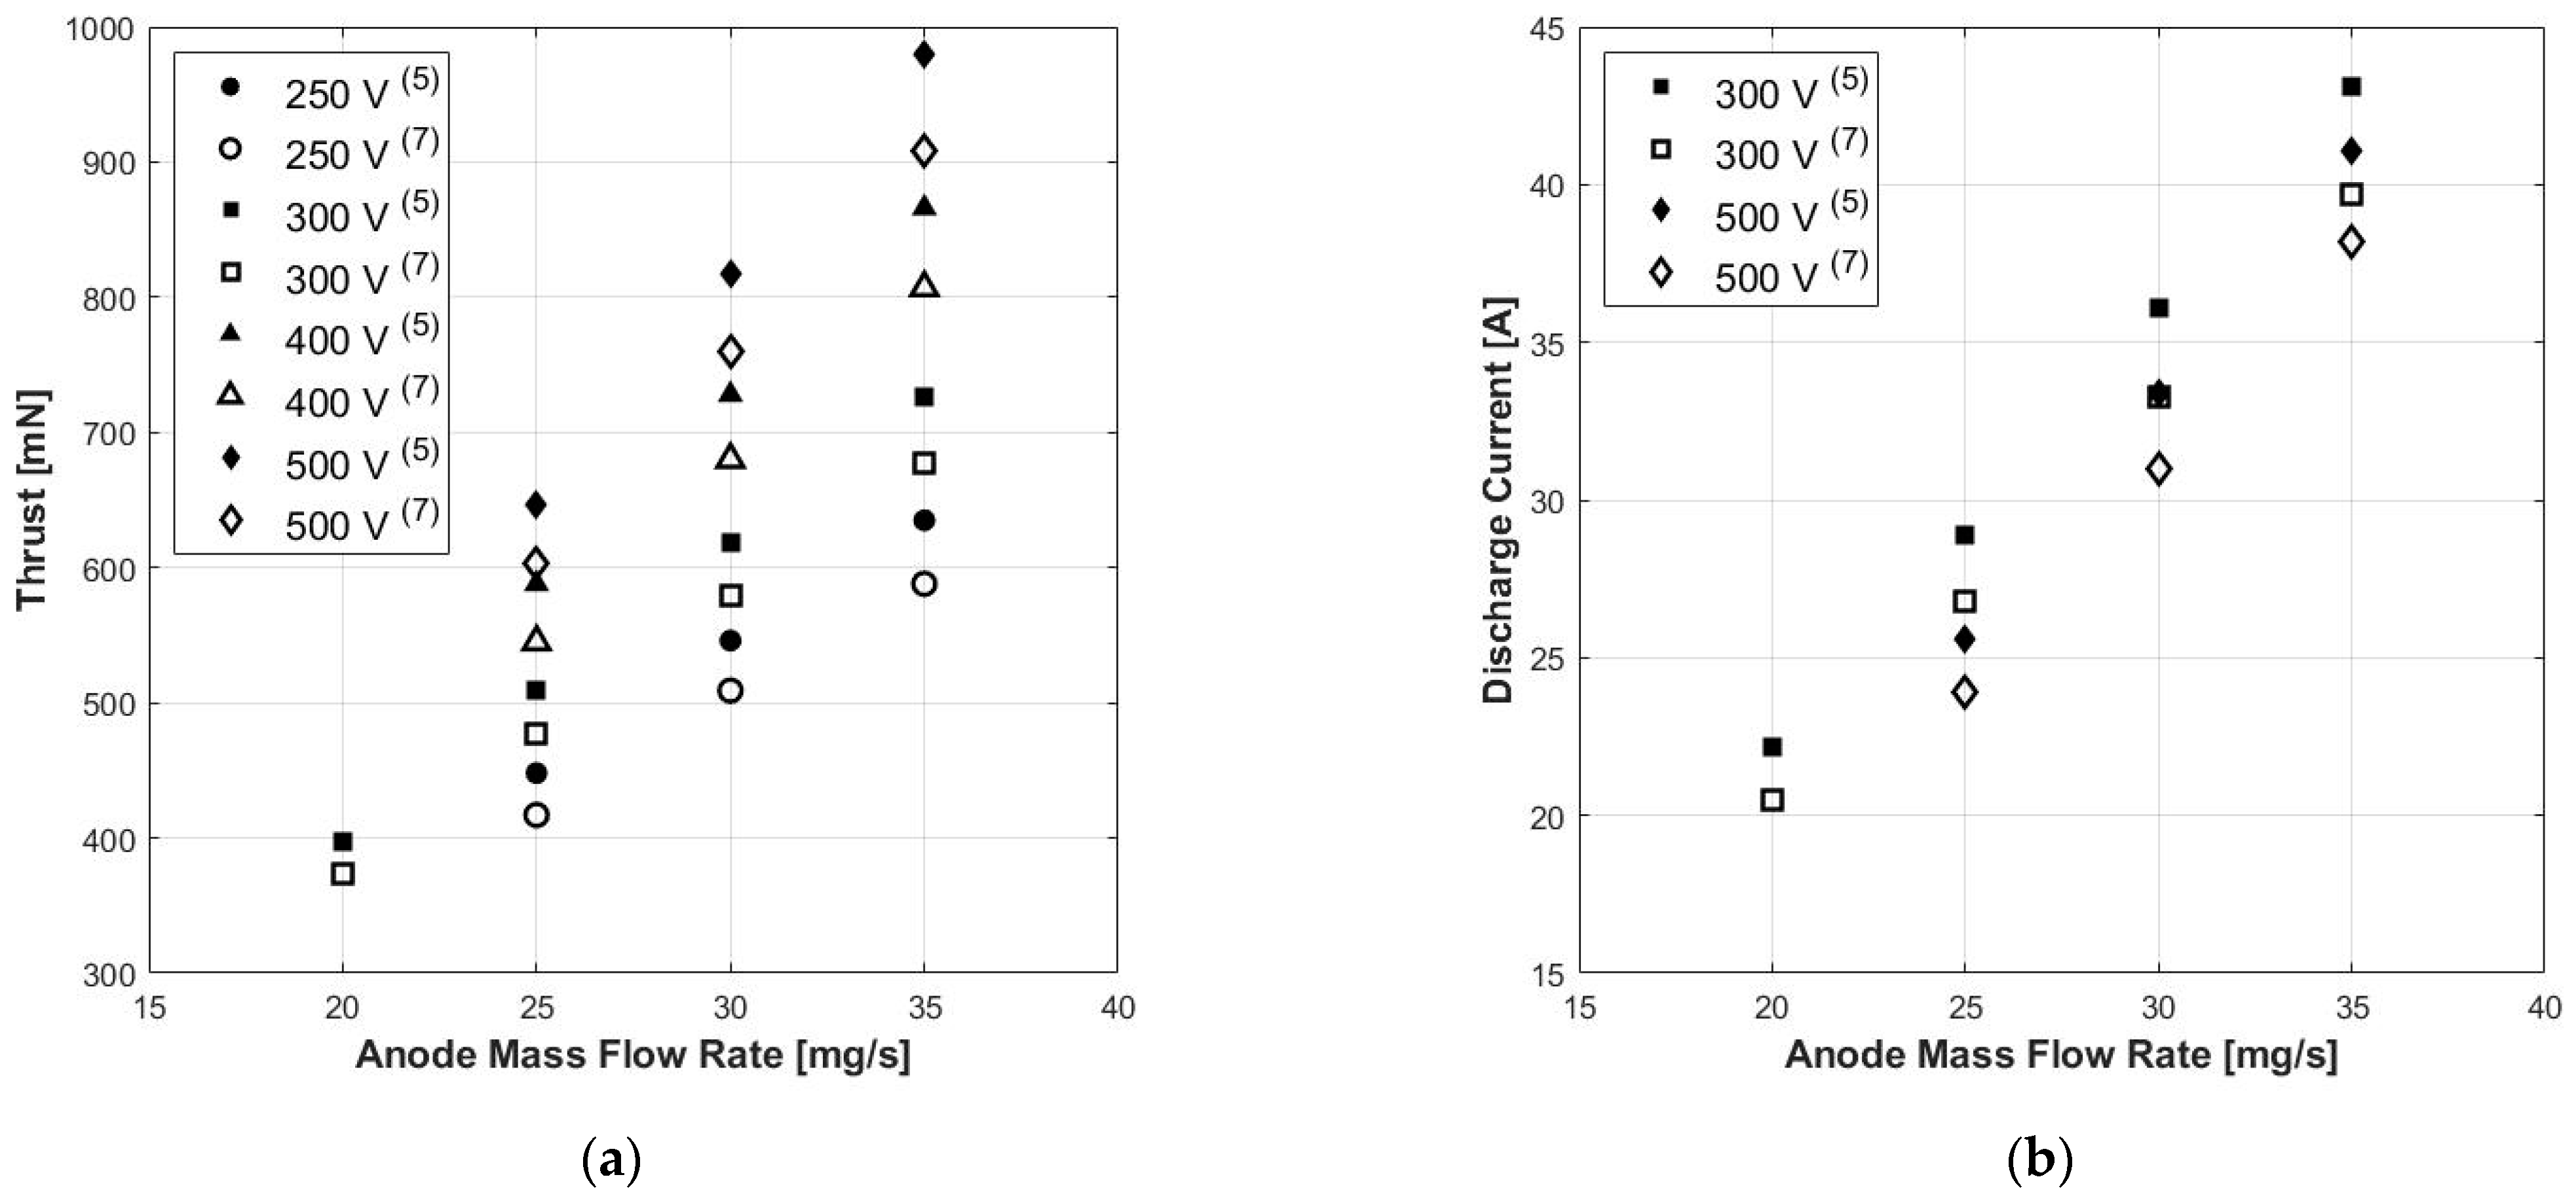
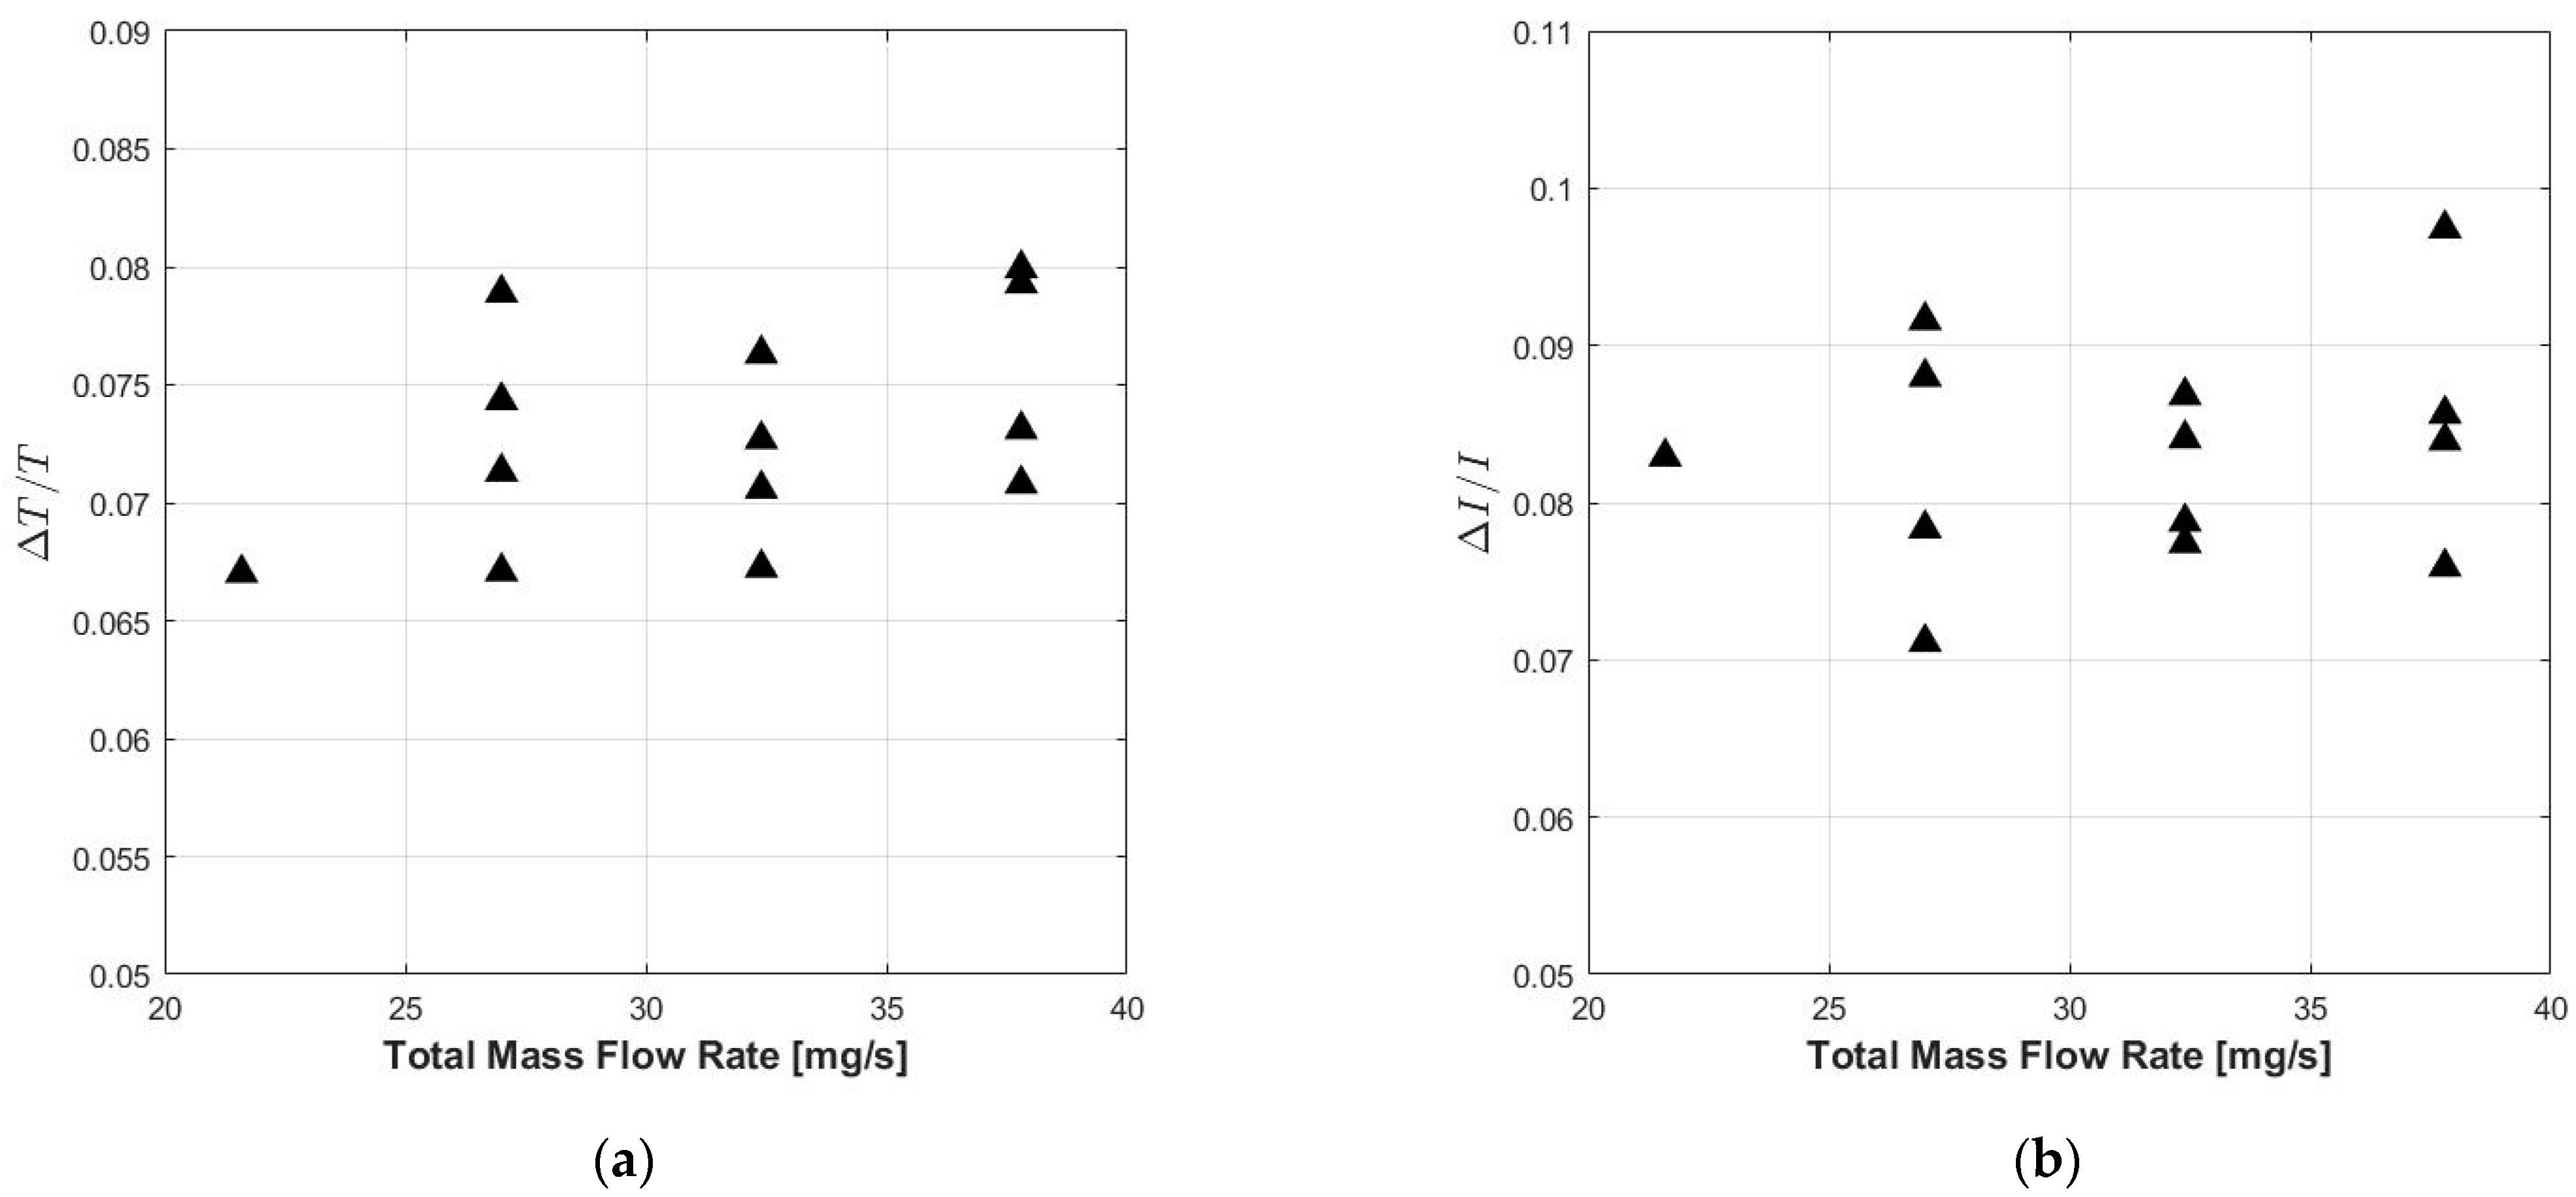
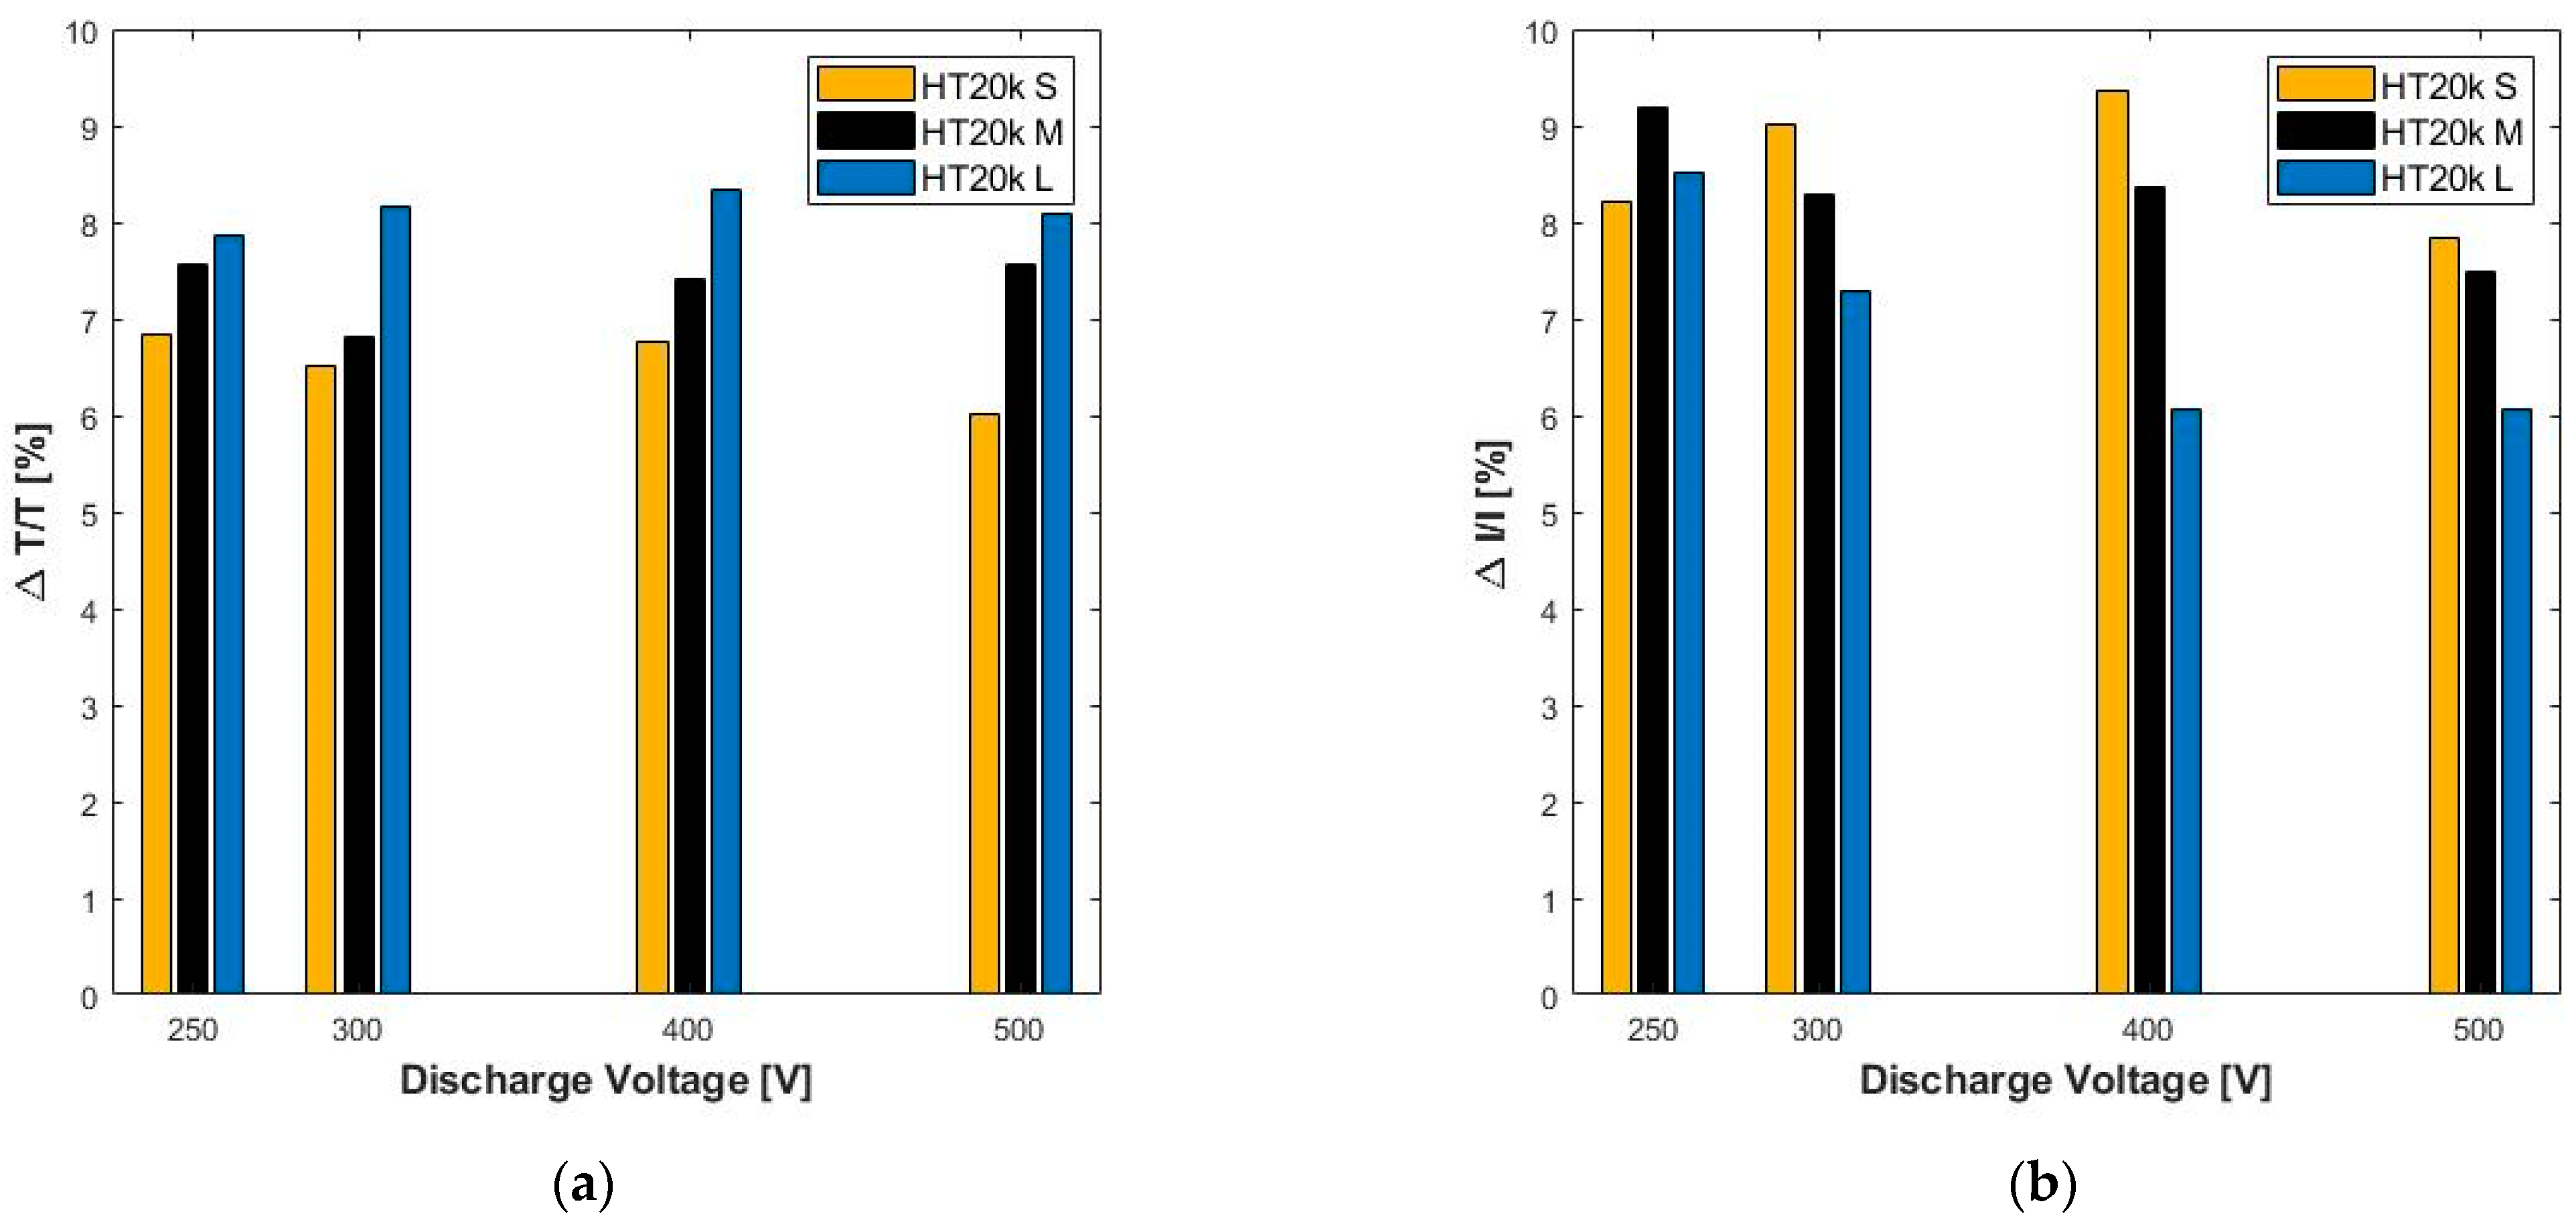
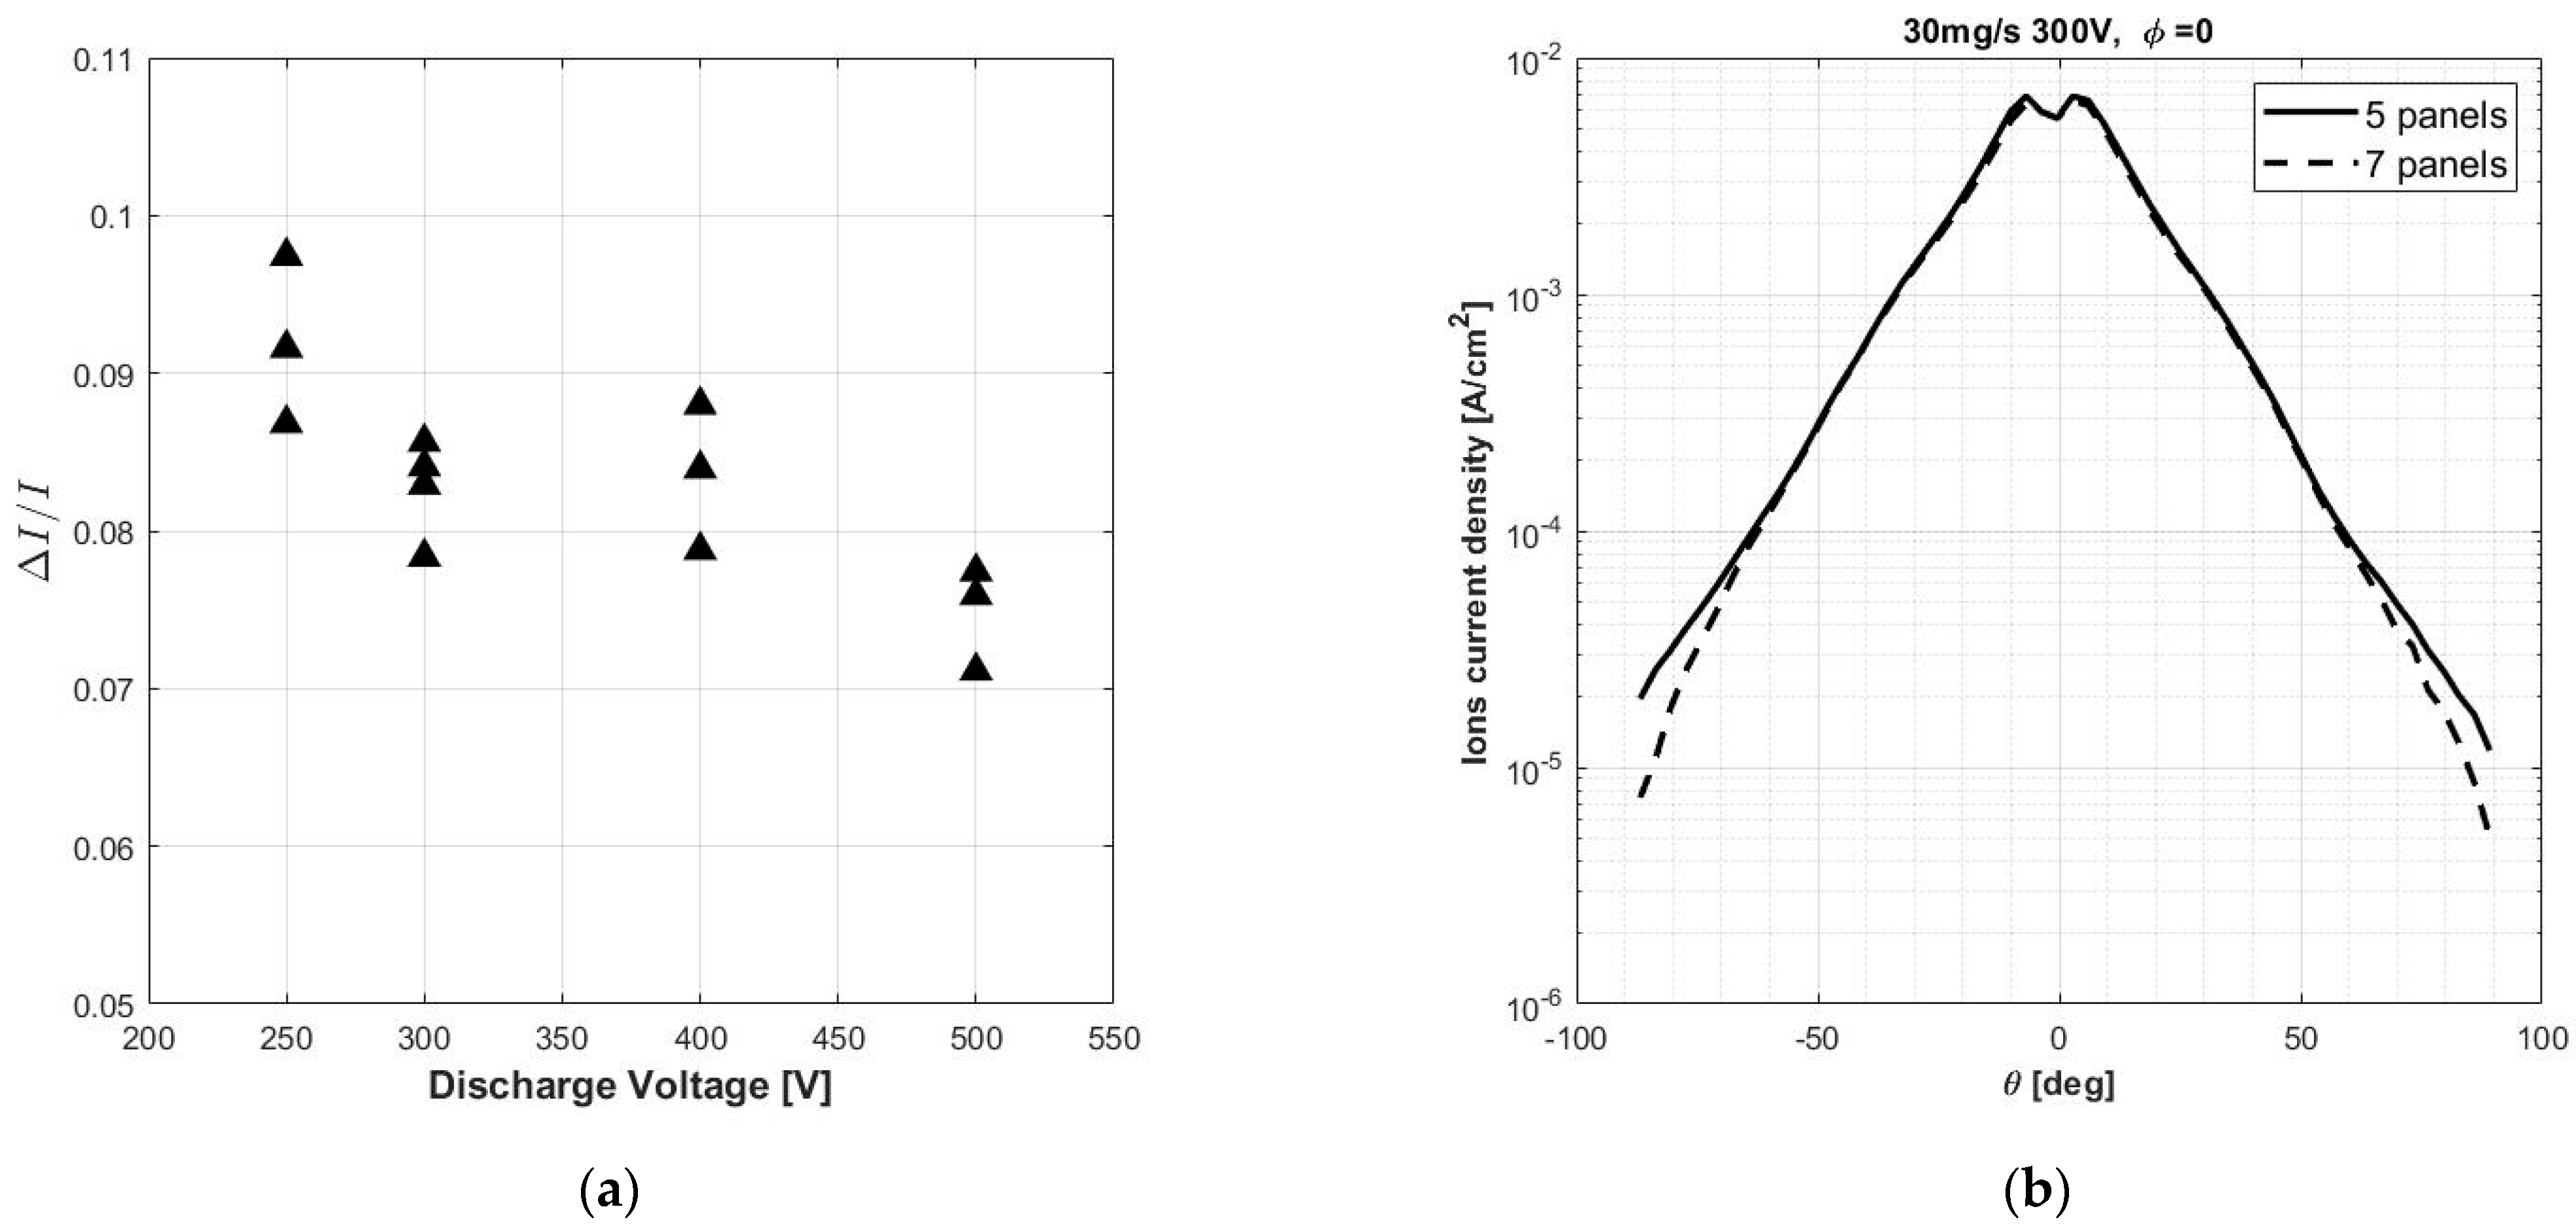
Thruster Performance
4. Discussion
5. Conclusions
Author Contributions
Funding
Institutional Review Board Statement
Informed Consent Statement
Data Availability Statement
Acknowledgments
Conflicts of Interest
Appendix A

| Operative Point | 5 Panels | 7 Panels | |||
|---|---|---|---|---|---|
| [rad] | [rad] | ||||
| 25 | 250 | 0.54 ± 0.02 | 0.77 ± 0.02 | 0.53 ± 0.02 | 0.76 ± 0.02 |
| 30 | 250 | 0.54 ± 0.02 | 0.76 ± 0.02 | 0.53 ± 0.02 | 0.75 ± 0.02 |
| 35 | 250 | 0.56 ± 0.02 | 0.77 ± 0.02 | 0.56 ± 0.02 | 0.77 ± 0.02 |
| 20 | 300 | 0.51 ± 0.02 | 0.80 ± 0.02 | 0.50 ± 0.02 | 0.80 ± 0.02 |
| 25 | 300 | 0.51 ± 0.02 | 0.80 ± 0.02 | 0.50 ± 0.02 | 0.80 ± 0.02 |
| 30 | 300 | 0.51 ± 0.02 | 0.79 ± 0.02 | 0.51 ± 0.02 | 0.80 ± 0.02 |
| 35 | 300 | 0.54 ± 0.02 | 0.80 ± 0.02 | 0.54 ± 0.02 | 0.82 ± 0.02 |
| 25 | 400 | 0.46 ± 0.02 | 0.84 ± 0.02 | 0.44 ± 0.02 | 0.85 ± 0.02 |
| 30 | 400 | 0.49 ± 0.02 | 0.83 ± 0.02 | 0.49 ± 0.02 | 0.84 ± 0.02 |
| 35 | 400 | 0.50 ± 0.02 | 0.83 ± 0.02 | 0.49 ± 0.02 | 0.84 ± 0.02 |
| 25 | 500 | 0.49± 0.02 | 0.90 ± 0.02 | 0.48 ± 0.02 | 0.91 ± 0.02 |
| 30 | 500 | 0.51 ± 0.02 | 0.91 ± 0.02 | 0.50 ± 0.02 | 0.91 ± 0.02 |
| 35 | 500 | 0.53 ± 0.02 | 0.90 ± 0.02 | 0.53 ± 0.02 | 0.91 ± 0.02 |
| Operative Point | 5 Panels | 7 Panels | |
|---|---|---|---|
| [V] | [%] | [%] | |
| 25 | 250 | 4.4 | 2.8 |
| 30 | 250 | 3.7 | 2.3 |
| 35 | 250 | 4.1 | 1.9 |
| 20 | 300 | 6.1 | 1.9 |
| 25 | 300 | 5.1 | 2.3 |
| 30 | 300 | 4.7 | 2.2 |
| 35 | 300 | 4.1 | 1.9 |
| 25 | 400 | 21.9 | 15.3 |
| 30 | 400 | 20.5 | 7.6 |
| 35 | 400 | 13.8 | 4.4 |
| 25 | 500 | 23.1 | 19 |
| 30 | 500 | 19.2 | 16.3 |
| 35 | 500 | 23.6 | 14 |
| Operative Point | 5 Panels | 7 Panels | |
|---|---|---|---|
| [V] | [V] | [V] | |
| 25 | 250 | −8.6 ± 0.3 | −9.6 ± 0.3 |
| 30 | 250 | −7.5 ± 0.3 | −9.3 ± 0.3 |
| 35 | 250 | −7.0 ± 0.3 | −9.0 ± 0.3 |
| 20 | 300 | −9.6 ± 0.3 | −10.3 ± 0.3 |
| 25 | 300 | −8.1 ± 0.3 | −8.3 ± 0.3 |
| 30 | 300 | −6.7 ± 0.3 | −8.2 ± 0.3 |
| 35 | 300 | −6.5 ± 0.3 | −8.0 ± 0.3 |
| 25 | 400 | −11.7 ± 0.3 | −12.8 ± 0.3 |
| 30 | 400 | −9.1 ± 0.3 | −10.7 ± 0.3 |
| 35 | 400 | −8.9 ± 0.3 | −9.1 ± 0.3 |
| 25 | 500 | −16.1 ± 0.3 | −14 ± 0.3 |
| 30 | 500 | −13.8 ± 0.3 | −12.8 ± 0.3 |
| 35 | 500 | −11.8 ± 0.3 | −12.5 ± 0.3 |
References
- Levchenko, I.; Xu, S.; Mazouffre, S.; Lev, D.; Pedrini, D.; Goebel, D.; Garrigues, L.; Taccogna, F.; Bazaka, K. Perspectives, frontiers, and new horizons for plasma-based space electric propulsion. Phys. Plasmas 2020, 27, 020601. [Google Scholar] [CrossRef]
- Mazouffre, S. Electric propulsion for satellites and spacecraft: Established technologies and novel approaches. Plasma Sources Sci. Technol. 2016, 25, 033002. [Google Scholar] [CrossRef]
- Boeuf, J.-P. Tutorial: Physics and modeling of Hall thrusters. J. Appl. Phys. 2017, 121, 011101. [Google Scholar] [CrossRef]
- Levchenko, I.; Xu, S.; Wu, Y.-L.; Bazaka, K. Hopes and concerns for astronomy of satellite constellations. Nat. Astron. 2020, 4, 1012–1014. [Google Scholar] [CrossRef]
- Anonymous. Sustainable space mining. Nat. Astron. 2019, 3, 465. [Google Scholar] [CrossRef]
- Kim, V.; Popov, G.; Arkhipov, B.; Murashko, V.; Gorshkov, O.; Koroteyev, A.; Garkusha, V.; Semenkin, A.; Tverdokhlebov, S. Electric Propulsion Activity in Russia. In Proceedings of the 27th International Electric Propulsion Conference (IEPC), Pasadena, CA, USA, 15–19 October 2001. IEPC-01-05. [Google Scholar]
- Arkhipov, B.A.; Veoelovzorov, A.N.; Gavryushin, V.M.; Khartov, S.A.; Kim, V.; Kozlov, V.I.; Maslennikov, N.A.; Morozov, A.I.; Murashko, V.M.; Pokrovski, I.B. Development and Investigation of Characteristics of Increased Power SPT Models. In Proceedings of the International Electric Propulsion Conference, Seattle, WA, USA, 13–16 September 1993. IEPC-93-222. [Google Scholar]
- Jankovsky, R.S.; McLean, C.; McVey, J. Preliminary Evaluation of a 10kW Hall Thruster. In Proceedings of the 37th Aerospace Sciences Meeting and Exhibit, Reno, NV, USA, 11–14 January 1999. AIAA-99-0456. [Google Scholar] [CrossRef]
- Manzella, D.H.; Jankovsky, R.S.; Hofer, R. Laboratory Model 50 kW Hall Thruster. In Proceedings of the 38th AIAA/ASME/SAE/ASEE Joint Propulsion Conference & Exhibit, Indianapolis, IN, USA, 7–10 July 2002. AIAA 2002-3676. [Google Scholar] [CrossRef]
- Peterson, P.Y.; Jacobson, D.T.; Manzella, D.H.; John, J.W. The Performance and Wear Characterization of a High-Power High-Isp NASA Hall Thruster. In Proceedings of the 41st AIAA/ASME/SAE/ASEE Joint Propulsion Conference & Exhibit, Tucson, AZ, USA, 10–13 July 2005. AIAA 2005-4243. [Google Scholar] [CrossRef]
- Kamhawi, H.; Haag, T.W.; Jacobson, D.T.; Manzella, D.H. Performance Evaluation of the NASA-300M 20 kW Hall Effect Thruster. In Proceedings of the 47th AIAA/ASME/SAE/ASEE Joint Propulsion Conference & Exhibit, San Diego, CA, USA, 31 July–3 August 2011. AIAA 2011-5521. [Google Scholar] [CrossRef]
- Kamhawi, H.; Huang, W.; Haag, T.; Shastry, R.; Soulas, G.; Smith, T.; Mikellides, I.G.; Hofer, R.R. Performance and Thermal Characterization of the NASA300MS 20 kW Hall Effect Thruster. In Proceedings of the IEPC, Washington, DC, USA, 6–10 October 2013. IEPC-2013-444. [Google Scholar]
- Szabo, J.; Pote, B.; Hruby, V.; Byrne, L.; Tedrake, R.; Kolencik, G. A Commercial One Newton Hall Effect Thruster for High Power in Space Missions. In Proceedings of the 47th AIAA/ASME/SAE/ASEE Joint Propulsion Conference & Exhibit, San Diego, CA, USA, 31 July–3 August 2011. AIAA 2011-6152. [Google Scholar] [CrossRef]
- Pyatykh, I.N.; Bernikova, M.Y.; Gopanchuk, V.V.; Gnizdor, R.Y.; Zhasan, V.S.; Katashova, M.I.; Savchenko, K.A. Development of stationary plasma thruster SPT-230 with discharge power of 10–15 Kw. In Proceedings of the 35th International Electric Propulsion Conference (IEPC), Atlanta, GA, USA, 8–12 October 2017. IEPC-2017-548. [Google Scholar]
- Zubair, J. Development of a 12.5kW Hall Thruster for Advanced Electric Propulsion System. In Proceedings of the AIAA Propulsion and Energy 2020 Forum, New Orleans, LA, USA, 24–28 August 2020. AIAA 2020-3628. [Google Scholar] [CrossRef]
- Available online: https://www1.grc.nasa.gov/facilities/eppl/#facility-overview (accessed on 14 January 2021).
- Peterson, P.Y.; Kamhawi, H.; Huang, W.; Yim, J.; Haag, T.; Mackey, J.; McVetta, M.; Sorrelle, L.; Tomsik, T.; Gillagan, R.; et al. Reconfiguration of NASA GRC’s Vacuum Facility 6 for Testing of Advanced Electric Propulsion System (AEPS) Hardware. In Proceedings of the 35th International Electric Propulsion Conference Georgia Institute of Technology, Atlanta, GA, USA, 8–12 October 2016. IEPC-2017-028. [Google Scholar]
- Viges, E.A.; Jorns, B.A.; Gallimore, A.D.; Sheehan, J.P. University of Michigan’s Upgraded Large Vacuum Test Facility. In Proceedings of the 36th International Electric Propulsion Conference, Vienna, Austria, 15–20 September 2019. IEPC-2019-653. [Google Scholar]
- Available online: https://www.sitael.com/space/advanced-propulsion/electric-propulsion/tools-services/ (accessed on 14 January 2021).
- Randolph, T.; Kim, V.; Kaufman, H.; Kozubky, K.; Zhurin, V.; Day, M. Facility Effects on Stationary Plasma Thruster Testing. In Proceedings of the 23rd International Electric Propulsion Conference, Seattle, WA, USA, 13–16 September 1993. IEPC-93-93. [Google Scholar]
- Reid, B.M. The Influence of Neutral Flow Rate in the Operation of Hall Thrusters. Ph.D. Thesis, Aerospace Egineerng Department, University of Michigan, Ann Arbor, MI, USA, 2009; pp. 306–319. [Google Scholar]
- Walker, M.L.R.; Gallimore, A.D. Performance Characteristics of a Cluster of 5-kW Laboratory Hall Thrusters. J. Propuls. Power 2007, 23, 35–43. [Google Scholar] [CrossRef]
- Hofer, R.R.; Anderson, J.R. Finite Pressure Effects in Magnetically Shielded Hall Thrusters. In Proceedings of the 50th AIAA/ASME/SAE/ASEE Joint Propulsion Conference, Cleveland, OH, USA, 28–30 July 2014. AIAA 2014-3709. [Google Scholar] [CrossRef]
- Diamant, K.D.; Liang, R.; Corey, R.L. The Effect of Background Pressure on SPT-100 Hall Thruster Performance. In Proceedings of the 50th AIAA/ASME/SAE/ASEE Joint Propulsion Conference, Cleveland, OH, USA, 28–30 July 2014. AIAA 2014-3710. [Google Scholar] [CrossRef]
- Huang, W.; Kamhawi, H.; Lobbia, R.B.; Brown, D.L. Effect of Background Pressure on the Plasma Oscillation Characteristics of the HiVHAc Hall Thruster. In Proceedings of the 50th AIAA/ASME/SAE/ASEE Joint Propulsion Conference, Cleveland, OH, USA, 28–30 July 2014. AIAA 2014-3708. [Google Scholar] [CrossRef]
- Snyder, J.S.; Lenguito, G.; Frieman, J.D.; Haag, T.W.; Mackey, J.A. Effects of Background Pressure on SPT-140 Hall Thruster Performance. J. Propuls. Power 2020, 36, 668–676. [Google Scholar] [CrossRef]
- Cusson, S.E. Impact of the Neutral Density on the Operation of High-Power Magnetically Shielded Hall Thrusters. Ph.D. Thesis, University of Michigan, Ann Arbor, MI, USA, 2019. [Google Scholar]
- Reid, B.M. Empirically-Derived Corrections for Facility Effects in Performance and Plume Measurements of Hall Thrusters. In Proceedings of the 34th International Electric Propulsion Conference, Seattle, WA, USA, 13–16 September 1993. IEPC 2015-362. [Google Scholar]
- Walker, M.L.R.; Gallimore, A.D. Neutral density map of Hall thruster plume expansion in a vacuum chamber. Rev. Sci. Instrum. 2005, 76, 053509. [Google Scholar] [CrossRef]
- Nakles, M.R.; Hargus, W.A. Background Pressure Effects on Ion Velocity Distribution Within a Medium-Power Hall Thruster. J. Propuls. Power 2011, 27, 737–743. [Google Scholar] [CrossRef]
- Cusson, S.E.; Jorns, B.A.; Gallimore, A.D. Non-invasive in situ measurement of the near-wall ion kinetic energy in a magnetically shielded Hall thruster. Plasma Sources Sci. Technol. 2019, 28, 105012. [Google Scholar] [CrossRef]
- Cusson, S.E.; Dale, E.T.; Jorns, B.A.; Gallimore, A.D. Acceleration region dynamics in a magnetically shielded Hall thruster. Phys. Plasmas 2019, 26, 023506. [Google Scholar] [CrossRef]
- Spektor, R.; Tighe, W.G.; Stoltz, P.H.; Beckwith, K.R.C. Facility Effects on Hall Thruster Performance through Cathode Coupling. In Proceedings of the Joint Conference of 30th International Symposium on Space Technology and Science, 34th International Electric Propulsion Conference and 6th Nano-satellite Symposium, Hyogo-Kobe, Japan, 4–10 July 2015. IEPC-2015-309/ISTS-2015-b-309. [Google Scholar]
- Jorns, B.A.; Byrne, M. Model for the dependence of cathode voltage in a Hall thruster on facility pressure. Plasma Sources Sci. Technol. 2020, 30, 015012. [Google Scholar] [CrossRef]
- Dale, E.; Jorns, B.; Gallimore, A. Future Directions for Electric Propulsion Research. Aerospace 2020, 7, 120. [Google Scholar] [CrossRef]
- Huang, W.; Kamhawi, H.; Haag, T. Facility Effect Characterization of NASA’s HERMeS Hall Thruster. In Proceedings of the 52nd AIAA/SAE/ASEE Joint Propulsion Conference, Salt Lake City, UT, USA, 25–27 July 2016. AIAA 2016-4828. [Google Scholar] [CrossRef]
- Paissoni, C.; Viola, N.; Mammarella, M.; Andreussi, T.; Rossodivita, A.; Saccoccia, G. Deep space transportation enhanced by 20 kW-Class Hall Thrusters. Acta Astronaut. 2020, 171, 83–96. [Google Scholar] [CrossRef]
- Piragino, A.; Ferrato, E.; Faraji, F.; Reza, M.; Andreussi, T.; Rossodivita, A.; Andrenucci, M. Experimental Characterization of a 5kW Magnetically Shielded Hall Thruster. In Proceedings of the Space Propulsion Conference 2018, Seville, Spain, 16–18 May 2018. SP2018_427. [Google Scholar]
- Saravia, M.M.; Giacobbe, A.; Andreussi, T. Bayesian analysis of triple Langmuir probe measurements for the characterization of Hall thruster plasmas. Rev. Sci. Instrum. 2019, 90, 023502. [Google Scholar] [CrossRef]
- Giannetti, V.; Ferrato, E.; Piragino, A.; Reza, M.; Faraji, F.; Andrenucci, M.; Andreussi, T. HT5k Thruster Unit Development History, Status and Way Forward. In Proceedings of the 36th International Electric Propulsion Conference, Vienna, Austria, 15–20 September 2019. IEPC-2019-878. [Google Scholar]
- Andreussi, T.; Giannetti, V.; Leporini, A.; Saravia, M.M.; Andrenucci, M. Influence of the magnetic field configuration on the plasma flow in Hall thrusters. Plasma Phys. Control. Fusion 2017, 60, 014015. [Google Scholar] [CrossRef]
- Piragino, A.; Leporini, A.; Giannetti, V.; Pedrini, D.; Rossodivita, A.; Andreussi, T.; Andrenucci, M. Characterization of a 20 kW-class Hall Effect Thruster. In Proceedings of the 35th International Electric Propulsion Conference, Atlanta, GA, USA, 8–12 October 2017. IEPC-2017-381. [Google Scholar]
- Pedrini, D.; Misuri, T.; Paganucci, F.; Andrenucci, M. Development of Hollow Cathodes for Space Electric Propulsion at Sitael. Aerospace 2017, 4, 26. [Google Scholar] [CrossRef]
- Saverdi, M.; Signori, M.; Milaneschi, L.; Cesari, U.; Biagioni, L. The IV10 Space Simulator for High Power Electric Propulsion Testing: Performance Improvements and Operation Status. In Proceedings of the 30th International Electric Propulsion Conference, Florence, Italy, 17–20 September 2007. IEPC-2007-321. [Google Scholar]
- Piragino, A.; Giannetti, V.; Reza, M.; Faraji, F.; Ferrato, E.; Kitaeva, A.; Pedrini, D.; Andreussi, T.; Paganucci, F.; Andrenucci, M. Development Status of SITAEL’s 20 kW Class Hall Thruser. In Proceedings of the AIAA Propulsion and Energy 2019 Forum, Indianapolis, IN, USA, 19–22 August 2019. AIAA-2019-3812. [Google Scholar] [CrossRef]
- Walker, M.L.R. Effects of Facility Backpressure on the Performance and Plume of a Hall Thruster; The University of Michigan: Ann Arbor, MI, USA, 2005; pp. 56–57. [Google Scholar]
- Brown, D.L.; Walker, M.L.R.; Szabo, J.; Huang, W.; Foster, J.E. Recommended Practice for Use of Faraday Probes in Electric Propulsion Testing. J. Propuls. Power 2017, 33, 582–613. [Google Scholar] [CrossRef]
- Frieman, J.D.; Liu, T.M.; Walker, M.L.R. Background Flow Model of Hall Thruster Neutral Ingestion. J. Propuls. Power 2017, 33, 1–15. [Google Scholar] [CrossRef]
- Frieman, J.D. Characterization of Background Neutral Flow in Vacuum Test Facilities and Impact on Hall Effect Thruster Operation. Ph.D. Thesis, Georgia Institute of Technology, Atlanta, GA, USA, August 2017. [Google Scholar]
- Cai, C.; Boyd, I.; Sun, Q. Rarefied Background Flow in a Vacuum Chamber Equipped with One-Sided Pumps. J. Thermophys. Heat Transf. 2006, 20, 524–535. [Google Scholar] [CrossRef]
- Hofer, R.R. Development and Characterization of High-Efficiency, High-Specific Impulse Xenon Hall Thrusters. Ph.D. Thesis, University of Michigan, Ann Arbor, MI, USA, 2004. [Google Scholar]
- Piragino, A.; Ferrato, E.; Faraji, F.; Reza, M.; Giannetti, V.; Kitaeva, A.; Pedrini, D.; Andrenucci, M.; Andreussi, T. SITAEL’s Magnetically Shielded 20 kW Hall Thruster Tests. In Proceedings of the 36th International Electric Propulsion Conference, Vienna, Austria, 15–20 September 2019. IEPC-2019-879. [Google Scholar]
- Andreussi, T.; Piragino, A.; Reza, M.; Giannetti, V.; Farajii, F.; Ferrato, E.; Pedrini, D.; Kitaeva, A.; Rossodivita, A.; Andrenucci, M.; et al. Development status and way forward of SITAEL’s 20kW class Hall Thruster, the HT20k. In Proceedings of the 36th International Electric Propulsion Conference, Vienna, Austria, 15–20 September 2019. IEPC-2019-825. [Google Scholar]
- Cai, C. Theoretical and Numerical Studies of Plume Flows in a Vacuum Chamber. Ph.D. Thesis, University of Michigan, Ann Arbor, MI, USA, 2005. [Google Scholar]
- Dankanich, J.W.; Walker, M.; Swiatek, M.W.; Yim, J.T. Recommended Practice for Pressure Measurement and Calculation of Effective Pumping Speed in Electric Propulsion Testing. J. Propuls. Power 2017, 33, 668–680. [Google Scholar] [CrossRef]
- Andrenucci, M. Arcjet Modeling and Engine Health Monitoring. In Proceedings of the 30th Joint Propulsion Conference and Exhibit, Indianapolis, IN, USA, 27–29 June 1994. AIAA-94-3007. [Google Scholar] [CrossRef]
- Peng, E.; Yu, D.; Jiang, B. Experimental Investigation of Backpressure Effects on the Ionization and Acceleration Processes in a Hall Thruster. In Proceedings of the 31th International Electric Propulsion Conference, Ann Arbor, MI, USA, 20–24 September 2009. IEPC 2009-119. [Google Scholar]
- Cusson, S.E.; Jorns, B.A.; Gallimore, A.D. Simple Model for Cathode Coupling Voltage versus Background Pressure in a Hall Thruster. In Proceedings of the 53rd AIAA/SAE/ASEE Joint Propulsion Conference, Atlanta, GA, USA, 10–12 July 2017. AIAA 2017-4889. [Google Scholar] [CrossRef]
- Jorns, B.A.; Hofer, R.R.; Mikellides, I.G. Power Dependence of the Electron mobility profile in a Hall Thruster. In Proceedings of the 50th AIAA/ASME/SAE/ASEE Joint Propulsion Conference, Cleveland, OH, USA, 28–30 July 2014. AIAA 2014-3620. [Google Scholar] [CrossRef]
- Choueiri, E.Y. Plasma oscillations in Hall thrusters. Phys. Plasmas 2001, 8, 1411. [Google Scholar] [CrossRef]


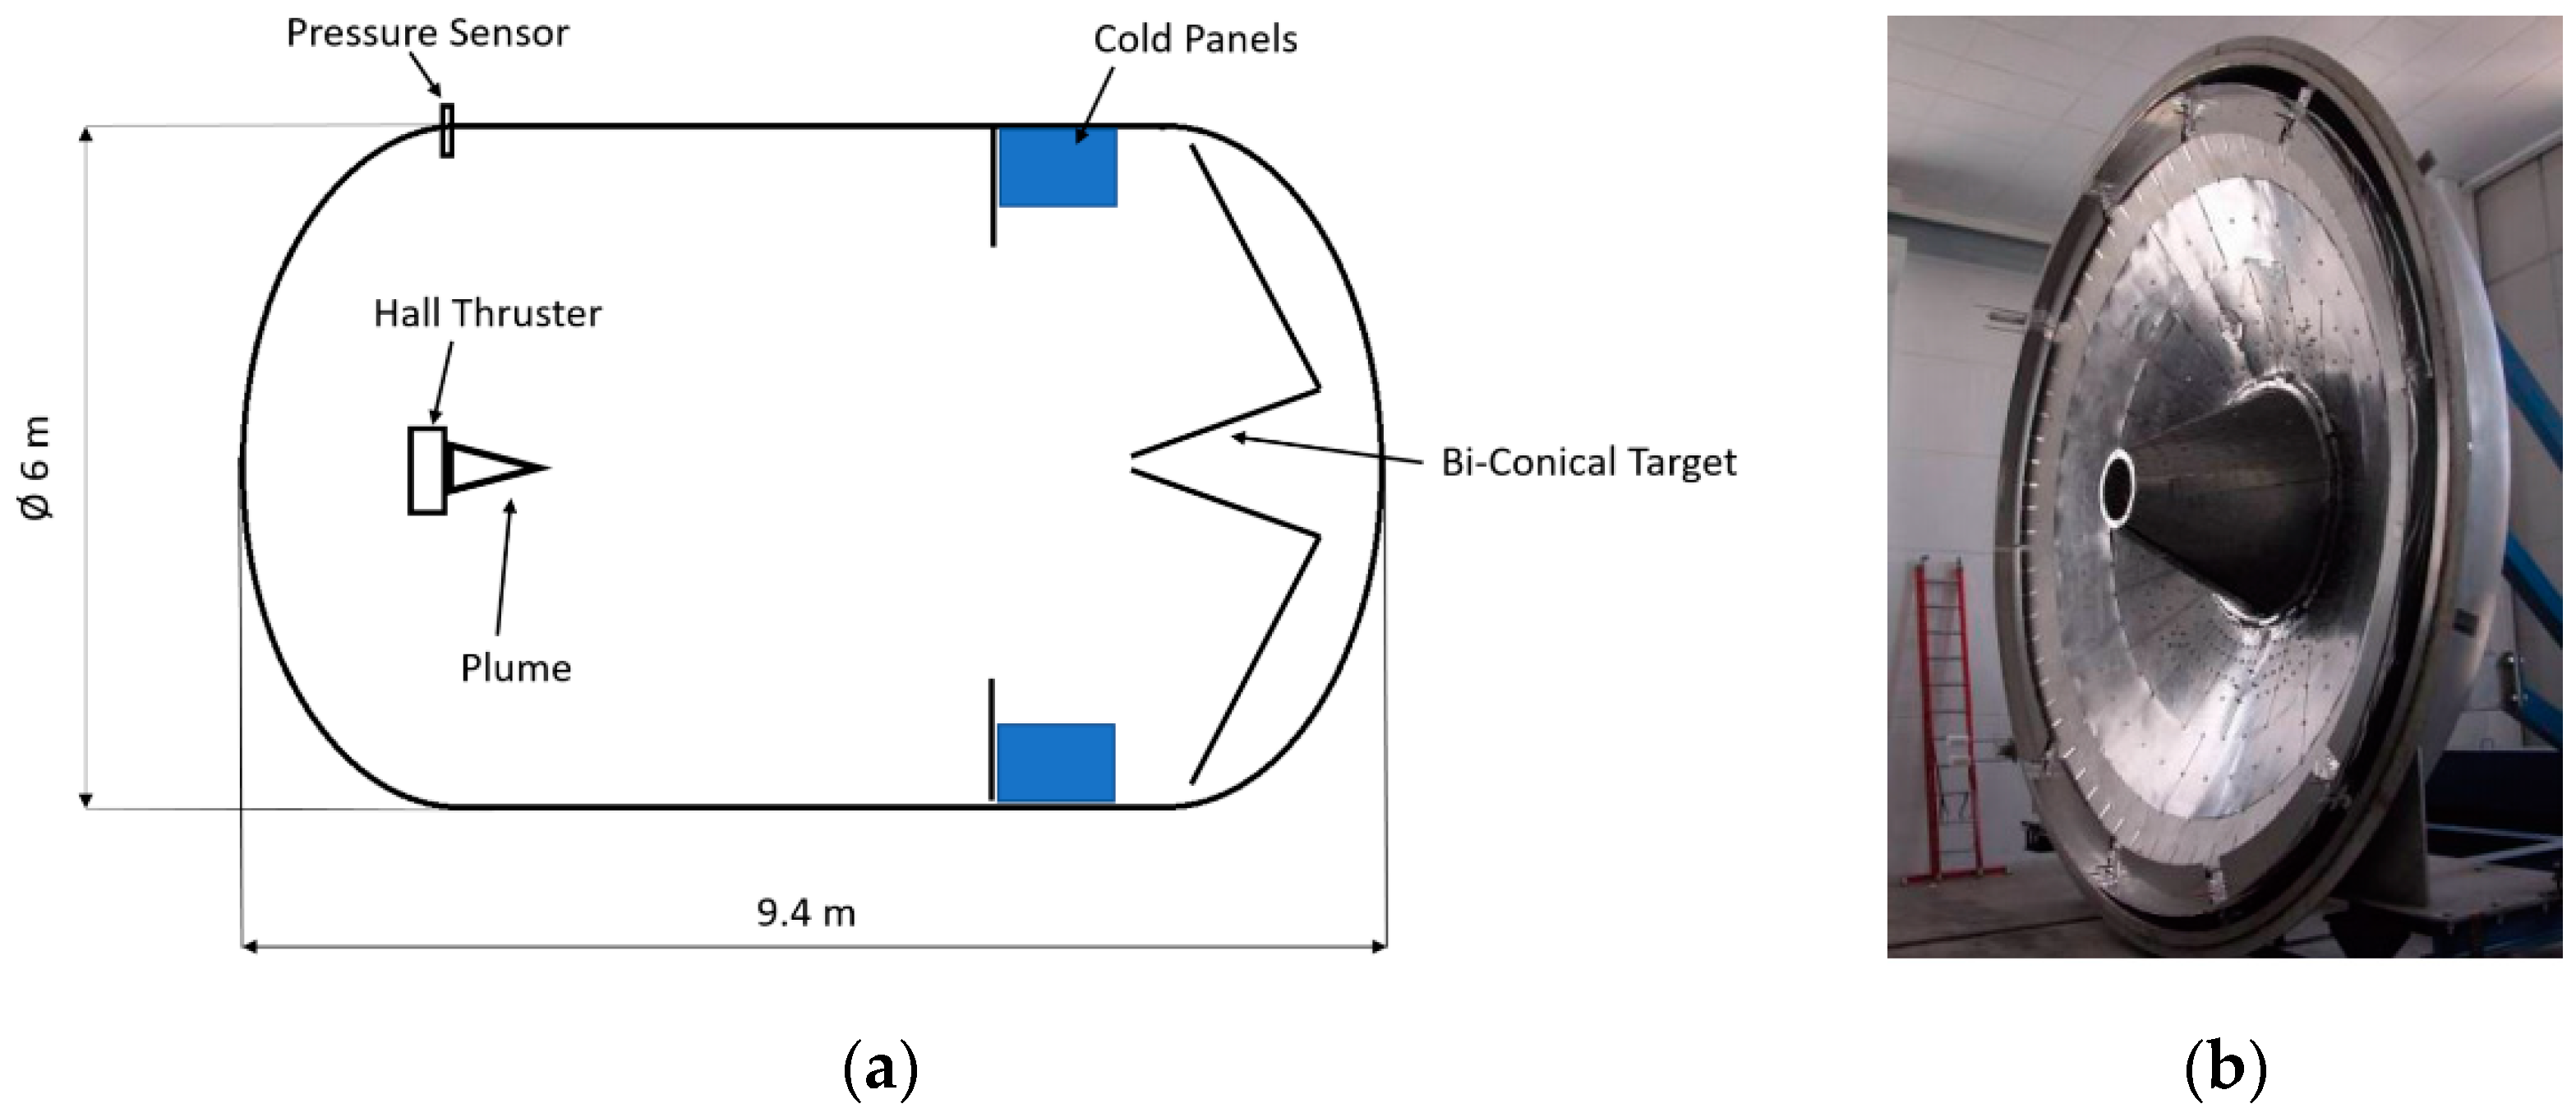
| IV10 Vacuum Chamber Characteristics | |
|---|---|
| Inner diameter | 5.47 m |
| Inner free diameter | 5.4 m |
| Length of cylindrical section | 6 m |
| Vacuum vessel total length | 9.4 m |
| Free length for beam expansion | 6.9 m |
| Internal free volume | 160 m3 |
| Total leak rate | <10−5 Pa·m3·s−1 |
| Partial pressure (O2, H2O, N2) | <10−7 mbar |
| Pump down time | 48 h |
| 250 V | 300 V | 400 V | 500 V | |
|---|---|---|---|---|
| 20 mg/s | X | |||
| 25 mg/s | X | X | X | X |
| 30 mg/s | X | X | X | X |
| 35 mg/s | X | X | X | X |
| Parameter | Value |
|---|---|
| 0.277 | |
| 0.388 | |
| 23 m2 | |
| 0.420 |
Publisher’s Note: MDPI stays neutral with regard to jurisdictional claims in published maps and institutional affiliations. |
© 2021 by the authors. Licensee MDPI, Basel, Switzerland. This article is an open access article distributed under the terms and conditions of the Creative Commons Attribution (CC BY) license (http://creativecommons.org/licenses/by/4.0/).
Share and Cite
Piragino, A.; Faraji, F.; Reza, M.; Ferrato, E.; Piraino, A.; Andreussi, T. Background Pressure Effects on the Performance of a 20 kW Magnetically Shielded Hall Thruster Operating in Various Configurations. Aerospace 2021, 8, 69. https://doi.org/10.3390/aerospace8030069
Piragino A, Faraji F, Reza M, Ferrato E, Piraino A, Andreussi T. Background Pressure Effects on the Performance of a 20 kW Magnetically Shielded Hall Thruster Operating in Various Configurations. Aerospace. 2021; 8(3):69. https://doi.org/10.3390/aerospace8030069
Chicago/Turabian StylePiragino, Antonio, Farbod Faraji, Maryam Reza, Eugenio Ferrato, Annalisa Piraino, and Tommaso Andreussi. 2021. "Background Pressure Effects on the Performance of a 20 kW Magnetically Shielded Hall Thruster Operating in Various Configurations" Aerospace 8, no. 3: 69. https://doi.org/10.3390/aerospace8030069
APA StylePiragino, A., Faraji, F., Reza, M., Ferrato, E., Piraino, A., & Andreussi, T. (2021). Background Pressure Effects on the Performance of a 20 kW Magnetically Shielded Hall Thruster Operating in Various Configurations. Aerospace, 8(3), 69. https://doi.org/10.3390/aerospace8030069