Article

Sustainable Supersonic Fuel Flow Method: An Evolution of the Boeing Fuel Flow Method for Supersonic Aircraft Using Sustainable Aviation Fuels

Department of Mechanical and Aerospace Engineering, Politecnico di Torino, 10129 Turin, Italy
*
Author to whom correspondence should be addressed.
Aerospace 2021, 8(11), 331; https://doi.org/10.3390/aerospace8110331
Submission received: 7 September 2021 / Revised: 26 October 2021 / Accepted: 3 November 2021 / Published: 5 November 2021
(This article belongs to the Special Issue Aircraft Emissions and Climate Impact)

Abstract

:
This paper discloses a new algorithm, called sustainable supersonic fuel flow method, to complement the conceptual design of future supersonic aircraft with pollutant and greenhouse gases emissions estimation. Starting from already existing algorithms currently used to assess the environmental impact of already developed and operating aircraft, the authors suggest revisions to improve the formulations, thus extending their application. Specifically, this paper has two objectives: to support the design of future supersonic aircraft and to evaluate the impact of the exploitation of more sustainable aviation fuels, with special focus on biofuels and biofuel blends, since the conceptual design stage. The core of the algorithm developed to predict in-flight emissions of a supersonic aircraft has been validated with public data of Concorde flight experiments. In addition, corrective factors accounting for the most recently developed and certified biofuels have been included in the formulation.

1. Introduction

Since the 2000s, the unprecedented growth in air travel demand of the previous decades has shaped the research activities of the aviation sector. Monitoring the effect of the COVID-19 pandemic, the most updated EUROCONTROL forecasts [1] for the post-pandemic era predict an air travel demand growth, which challenges the international aerospace community to speed up the development of breakthrough technological solutions. These solutions are primarily meant to speed up travel, thus re-introducing supersonic civil aircraft, and to dramatically reduce the environmental impact of aviation. Indeed, as a consequence of the expected growth, concerns about the impact of near- and far-future aviation on air quality and climate change are also increasing and the expectation is that the sector will be able to reconcile the increase traffic demand with a dramatic reduction of its footprint in line with the global efforts to reduce pollutant and greenhouse gas emissions. International aviation’s contribution to emissions and specifically to global carbon dioxide emissions (CO2) has come under scrutiny since the early 2000s, given the exclusion of the sector from the Kyoto Protocol’s national targets. According to [2], there has been a widespread political consensus enshrined in various agreements and declarations that a 2 °C raise in temperature represents the threshold between acceptable and dangerous climate change. It is worth remembering that, in 2019 (pre-pandemic), civil aviation accounted for ~3% of global CO2 emissions [3]; however, while other industries have already committed to reducing emissions and have identified feasible pathways, aviation’s share of anthropogenic greenhouse gas emissions is still expected to grow.
Controlling emissions of pollutant and greenhouse gases across sectors is therefore critical. As recently proved experimentally by DLR and NASA [4], contrail cirrus yields the largest single contribution to the net effective radiative forcing from aviation, followed by the contributions from aircraft CO2 and nitrogen oxides (NOx) emissions. Advances in lean-burn engine technologies and the development of sustainable, bio-based fuels for reducing soot emissions are expected to lessen the regional and global climate impact of aviation. The targeted use of sustainable low aromatic jet fuels in contrail outbreak situations, that contribute substantially to the warming by contrail cirrus, can further increase the climate benefit of sustainable aviation fuels (SAFs). Moreover, combustion of alternative fuels generally leads to enhancements in engine performance with respect to the use of conventional kerosene [5]. Reductions in pollutant emissions are expected to be mostly in soot, but also in nitrogen oxides and carbon monoxide, depending on the fuel and operating conditions. In contrast, increased emissions of unburned hydrocarbons are generally observed.
In this context, a global interest in sustainable aviation fuels (SAFs) has emerged as a reliable, alternative, renewable, and sustainable resource for a viable solution to the use of fossil fuels. SAFs are expected to play a crucial role alongside hydrogen and electrical propulsion in decarbonizing aviation. Given density limitations for batteries and hydrogen fuel storage, SAFs are vital to enable net-zero long-haul aviation particularly in the short term. They will also help enable more sustainable aviation for all large commercial aircraft in the medium term, before hydrogen and electric planes become technically and commercially available. SAFs may thus be key to meet short-term aviation sustainability targets due to their ability to scale up ahead of other technological solutions. In the longer term, they are expected to be a viable option for sustainable long-haul flights together with liquid hydrogen technologies [6]. According to the literature, the exploitation of SAFs on-board the next generation of supersonic civil aircraft is expected to have impacts on the environment on different scales, from emission indexes to air quality and climate. Jet engines using innovative SAFs ae expected to have small differences with respect to those exploiting traditional Jet-A1. Despite these moderate differences in emission indexes, SAFs still provide an environmental benefit on a life cycle basis. These emission reduction benefits vary according to the feedstock, production practice, conversion technology, logistics, and the land-use change incurred by bioenergy expansion. In some cases, a reduction in NOx has been predicted [5]. However, it must be noted that NOx emissions may impact radiative forcing both positively (via ozone mechanisms) and negatively (via methane mechanisms) [7]. In this case, seasonal variations are relevant as well as altitude variations.
In the attempt to meet the ambitious environmental goals set by the IATA for the coming years (e.g., net aviation CO2 emissions from 2020 (carbon-neutral growth), reduction in net aviation CO2 emissions of 50% by 2050 relative to 2005 levels), without jeopardizing the dream of a new generation of high-speed aircraft, it will be necessary to introduce proper algorithms to allow for pollutant and greenhouse gas emissions estimation from the conceptual design stage [8]. The most widely used method to estimate aircraft engine emissions is the so-called “P3-T3 method” [9], which is based on semiempirical correlations of emissions with the pressure and temperature at the compressor exit or combustor diffuser inlet along with the engine fuel flow. This method is widely known among engine manufacturers to predict the engine emissions throughout a trajectory on the basis of their own proprietary data. Since the early 2000s, aircraft manufacturers have been looking for alternative methods to be able to have a first estimation of the aircraft emissions along the different routes without having access to any proprietary data from the engine manufacturers (simply relying on publicly available data). It was in this context that DuBois and Paynter, from the Boeing Company, tried to solve this problem and published the fuel flow method (FFM) [10], which is now widely used by companies, research centres, and even by governmental agencies to predict the emissions per flight of any existing aircraft [11,12].
However, the attempt to combine the technological and environmental challenges of supersonic aviation from the conceptual design stage highlights two main gaps to be filled with respect to the emission estimation routines available in the literature.
Firstly, the available emission estimation methods rely on data which are publicly available from the ICAO databank as soon as the engine is certified, following the prescribed procedure which envisages the exploitation of traditional aviation fuels. To overcome this limitation and extend the method to alternative fuels, it is therefore important to collect all available information from the most recent research activity on biofuels and to understand the impact of each different type of biofuel on the aircraft emissions.
Secondly, the emission estimation routines available from present formulations in the literature are valid only up to the high-subsonic speed regime.
This paper tackles both these shortcomings, providing useful guidelines for the estimation of emission indexes for the most interesting SAFs, and extending the FFM to cover the supersonic speed regime.
After this short introduction, Section 2 provides the readers with an overview of the research activities in the field of biofuels as well as a discussion on their pollutant and greenhouse gas emission reduction potential. Then, Section 3 starts from a brief description of the FFM as available from the literature and then proposes a set of corrections needed to widen the application of the method to the supersonic speed regime. Results of the validation of the newly developed algorithm with the in-flight experimental data of a Concorde are discussed in Section 4 together with the theoretical benefits of the exploitation of SAFs for future supersonic aircraft. Finally, in Section 5 the main conclusions are drawn together with potential improvements to the methodology to further widen its application towards the hypersonic speed regime as well as the exploitation of liquid hydrogen as propellant.

2. Biofuels: Technological and Environmental Challenges for the Future Aviation Sector

Sustainable aviation fuels are widely recognised to be possible clean substitutes for fossil jet fuels. According to ATAG [13], sustainable aviation fuel is a more generic term with respect to biofuels, and it is largely preferred by the aviation sector because of the wider scope of its meaning. The term biofuel, instead, generally refers to specific SAFs produced from biological resources (plant or animal material). However, current technology allows fuel to be produced from other alternative sources, including non-biological resources; thus, the term has been adjusted to highlight the sustainable nature of these fuels.
The American Society for Testing and Materials has developed standard specifications to define kerosene-type fuels for aviation engines. ASTM D1655 presents specifications for jet-A1 fuel, setting the requirements for the fuel chemical and physical properties, but also for any additives such as antioxidants. Because of the severe quality control of fuels, any fuels derived from different sources must be completely “drop-in”. This means that the new fuel or the fuel blend is a substitute for conventional jet fuel, being completely interchangeable and compatible with conventional jet fuel when blended with it. A drop-in fuel blend does not require adaptation of the aircraft/engine fuel system or the fuel distribution network and can be used “as is” on currently flying turbine-powered aircraft [14]. Currently there are a lot of biomasses to be potentially exploited to produce different SAFs; the next steps are to examine the several possible feedstocks and conversion processes from biomass to biofuel. Currently, eight different technology pathways [14,15,16,17] to produce bio-jet fuels have been certified, together with five types of synthesised paraffinic kerosene (SPK) as blending components for conventional jet fuel to make up bio-jet fuels. Here, a complete list of the currently certified pathways are reported:
  • Fischer–Tropsch synthetic paraffinic kerosene (FT-SPK).
  • FT-SPK with aromatics (FT-SPK/A).
  • Hydroprocessed esters and fatty acids (HEFA-SPK).
  • Hydroprocessed fermented sugars to synthetic isoparaffins (HFS-SIP).
  • Alcohol-to-jet synthetic paraffinic kerosene (ATJ-SPK).
  • Catalytic hydrothermolysis synthesised kerosene (CH-SK or CHJ).
  • Hydroprocessed hydrocarbons, esters, and fatty acids paraffinic kerosene (HHC-SPK or HC-HEFA-SPK).
A fuel “production pathway” contains a sequence of stages, starting with feedstock production, followed by its pre-treatment in order to achieve the requirements of the conversion processes, and finally the conversion processes to produce aviation fuel. Table 1 summarises the main chemical–physical properties of the most common commercially available bio-fuels, compared to the traditional jet-A1.
According to ICAO [14], the potential of SAF to reduce aviation GHG emissions has been recognised by ICAO, Member States, and the aviation industry, such that SAFs are included amongst the “basket of measures” put forward to assist States in designing their action plans on CO2 emissions reduction. According to the ICAO 2016 trends assessment, a 100% substitution of traditional jet fuels with SAF could reduce 63% of the baseline CO2 emissions from international flights in 2050. This would be aviation’s most significant contribution towards achieving carbon neutral growth. When biomass is used to develop SAFs, the plants absorb CO2 for growth during photosynthesis in relatively short time scales. The carbon that is then emitted back into the atmosphere during combustion will return to the plants in a closed loop. Ideally in this scenario, no additional carbon would be injected into the biosphere as would be the case in the use of jet fuels. Therefore, even if the combustion of SAFs is expected to emit similar quantities of CO2 to the combustion of traditional jet fuels, with very similar emission indexes, an environmental benefit for SAFs is expected when looking at the total carbon footprint along an overall lifecycle (including multiple steps from the feedstock to the final use in an engine). However, as is reported in Table 2, depending on the considered biofuel and its production process, small to moderate differences in terms of emission indexes can be expected. Moreover, as is discussed in depth at the end of the next section, an additional environmental benefit will come from the difference in terms of fuel energy content, which can show important advantages when the entire flight mission is considered.

3. The Sustainable Supersonic Fuel Flow Method (S2F2)

3.1. The Original “Fuel Flow Method 2” by Boeing

The fuel flow method (FFM2) [10] was proposed by the Boeing Company at the beginning of the 2000s to predict the emission indexes in a subsonic cruise condition, without the need to get access to any engine proprietary data. Instead of using proprietary data, the method exploits information publicly released after any successful engine certification process. This dataset (ICAO Engine Emission Databank [21]) includes emission indexes and fuel flows for the four main phases of the LTO (landing and take-off) cycle, which are evaluated for well specified reference conditions at prescribed thrust levels but all at sea level condition. The FFM2 has been a breakthrough innovation, allowing for the prediction of engine emissions when operating in cruise condition. Currently, the FFM2 has been adopted by several stakeholders as a precious tool not only for the evaluation of the emissions in cruise, but also for the estimation of the overall amount of pollutants emitted by a subsonic aircraft throughout an entire reference trajectory, as well as to support the generation of 3D emission inventories and the consequent evaluation of the impact of aviation on climate change.
Unlike the FFM2, the P3T3 method determines the emission indexes knowing the temperature at the inlet of the combustion chamber (the so-called T3) in cruise conditions to look up a corresponding EI at sea level and then apply a pressure correction. The FFM2 method suggests a solution to overcome the unavailability of proprietary data (as T3) through a “fuel flow method”, i.e., an algorithm which allows for the estimation of the correlations between the fuel flow and T3 and therefore the characterisation of the engine set up and emissions (Figure 1).
The set of equations which constitutes the FFM2 starts by examining the compression process between the freestream and combustor inlet, which is based on two main assumptions: (i) the isentropic process before the combustor and (ii) T3, which is kept constant at sea level and altitude. While the latter is still acceptable for supersonic aircraft because the requirements for the combustor are the same, the former is not valid anymore when considering the shock wave characterising supersonic regime.
Moreover, the mathematical algorithm of the original method does not allow for any estimations about biofuels because the type of fuel is not included.
Modifications are therefore needed to extend the method both to the supersonic speed regime and to different types of fuel. In particular, in the next subsection, the following improvements to the original model are presented and discussed.
First, a pressure and temperature correction factor able to capture the relationship which exists between the freestream condition and the combustor inlet condition in high-speed regimes is discussed. The formal derivation of these factors is also discussed and then used to correct the emission index and fuel flow formulations.
Second, a strategy to evaluate the impact of biofuels based on their different lower heating values (LHVs) with respect to traditional aviation fuel is discussed.

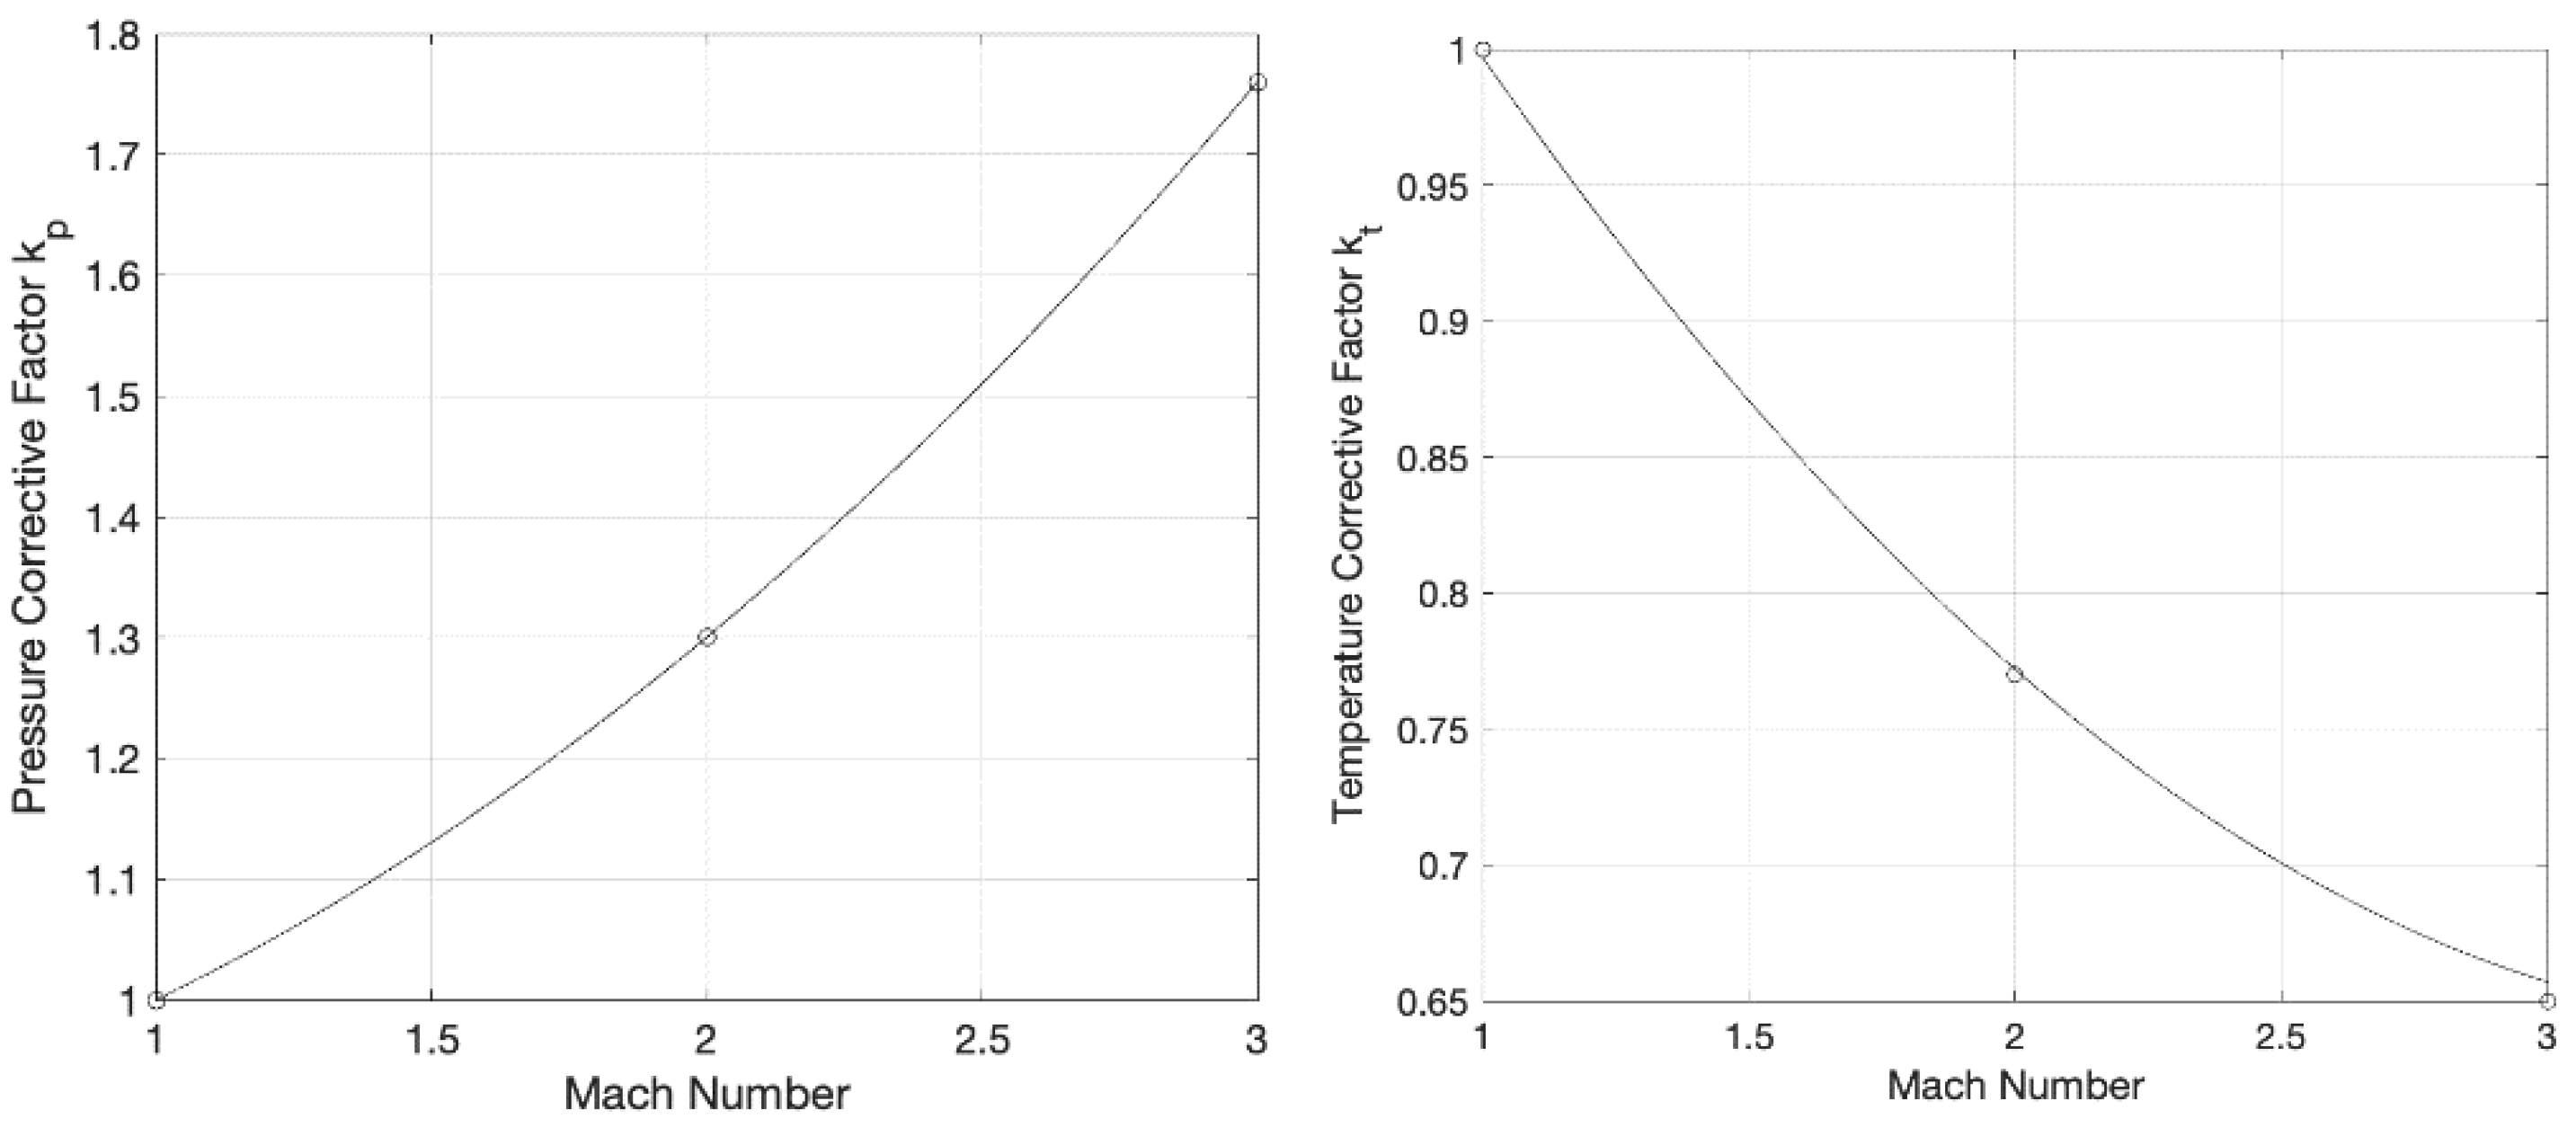
3.2. The Pressure and Temperature Correction Factors for Supersonic Aircraft

Different from the original FFM2, which perfectly fits the needs of subsonic aviation, the process between the freestream and combustor inlet cannot be considered isentropic in the supersonic case. The compression process can be split intuitively in two parts: the first part is the non-isentropic compression from the freestream (station 1) to the compressor inlet (station 2), and the second part goes from the compressor inlet (station 2) to the combustor inlet (station 3) and can be considered a classic isentropic compression. Therefore, the overall temperature rise from the freestream to the combustor inlet can be evaluated as follows:
T 3 T 1 = ( T 3 T 2 ) i s ( T 2 T 1 ) n o n   i s = (   p 3 p 2   ) γ 1 γ ( T 2 T 1 ) n o n   i s
For the sake of clarity, the famous Rolls Royce/Snecma Olympus 593, the supersonic engine which pushed the Concorde up to reaching a supersonic cruise, is here considered as practical example. Indeed, this engine was a breakthrough innovation for its complex supersonic air-intake, whose behaviour has been modelled as a combination of an oblique shockwave and a reflection shock.
Looking at the near-wall conditions (Figure 2), the reflection shock is almost a normal shock. Consequently, the authors suggest modelling the entire process with (i) a normal shock approximation and a correction factor accounting for the difference with respect to the oblique shock, (ii) the further subsonic compression before the compressor, and (iii) the air bleed between the shock and the compressor. Indeed, it is demonstrated that multiple oblique shock waves ahead of a normal shock are more efficient [16]. Therefore, this means that the pressure at the compressor inlet would be underestimated with a normal shock approximation and a correction factor is needed to achieve a higher and more realistic value. The correction factor is strictly related to the specific engine and air-intake which are considered, but it can be estimated knowing the air-intake geometry and its nominal operating conditions. For example, in the low supersonic regime, a 20 to 40% efficiency gain is typically reported in the literature [22]. For the Olympus engine, it is possible to suggest an average correction factor of about 1.3 in cruise condition. The validity of this theory has also been demonstrated considering the experimental pressure data of the Concorde engine’s air-intake, in which the flow passes from Mach 2 to Mach 0.5 during the process before entering the compressor [23]. Moreover, thanks to the wide-scope aerodynamic investigations reported in [23], a variation of the k p factor with the Mach number in the low supersonic regime has been derived. For any Mach numbers lower than 1, k p can be assumed equal to 1 because there are no positive effects coming from the inlet geometry. At Mach 2 (the Concorde cruise speed), detailed aerodynamic simulations have shown that a properly designed supersonic inlet can provide up to 30% of pressure gain, i.e., a k p factor equal to 1.3 can be assumed. At Mach = 3, the pressure gain increases up to 76%; thus, a k p factor equal to 1.76 can be assumed.
By means of these three conditions reported in the literature, a trend line for k p has been defined. Therefore, the evolution of the pressure correction can be precisely estimated as function of the freestream Mach number using the following equation:
k p = 0.08   M 1 2 + 0.06 M 1 + 0.86
Similar to the effect on pressure, the hypothesis of normal shock has an impact on the temperature estimation as well. Indeed, considering that the normal shock is more dissipative than an oblique shock, the temperature at the entrance of the compressor would be overestimated. It is therefore necessary to define a temperature corrective factor. Following the same approach used for the pressure correction factor, literature sources (in particular Anderson [22]) have been used to define a trend line to allow for the estimation of the corrective factor k t as a function of the freestream Mach number. For Mach numbers lower than 1, no corrections are required, because the inlet geometry cannot affect the temperature at the entrance of the combustor. At Mach 2, a k t = 0.77 is suggested considering that the assumption of normal shock can overestimate the T2 temperature up to 23%. At Mach = 3, the overestimation can be up to 45%, and therefore a k t = 0.65 is suggested.
By means of these conditions, a trend line for k t has been defined. Therefore, the evolution of the temperature correction can be precisely estimated as a function of the freestream Mach number using the following equation:
k t = 0.055 M 1 2 0.395 M 1 + 1.34
Pressure ( k p ) and temperature ( k t ) corrective factors variation as function of Mach number in the range Mach 1-Mach 3 are graphically reported in Figure 3. These trends are representative of the behaviour of a classical supersonic air-intake, like the one of the Concorde. In case of different air intake geometries, more adequate trends shall be considered.
Thanks to these hypotheses, it is then possible to express the pressure ratio (p2/p1) and the temperature ratio (T2/T1) between the freestream and the combustor inlet as a function of the freestream Mach number (M1), the pressure corrective factor ( k p ), and the temperature corrective factor ( k t ) as reported here:
p 2 p 1 = k p   ( 1 + 2 γ γ + 1   ( M 1 2 1 ) )
T 2 T 1 = k t [ 1 + 2 γ γ + 1 ( M 1 2 1 ) ] 2 + ( γ 1 ) M 1 2 ( γ + 1 ) M 1 2
Then, following the approach used by Boeing in defining the mathematical model behind the fuel flow method, the temperature at the inlet of the combustor ( T 3 ) can be defined as follows, where subscripts are used to indicate that the equation describes the behaviour of the engine in cruise at a certain altitude:
T 3 a l t = T 1 a l t ( p 3 a l t k p p 1 a l t ( p 2 a l t p 1 a l t ) ) γ 1 γ k t T 2 a l t T 1 a l t
Conversely, when the engine is at sea level and therefore the freestream conditions are certainly subsonic, T 3 S L can be described through an isentropic law. Then, the fuel flow method by Boeing hypothesis T 3 S L = T 3 a l t is kept, agreeing on the fact that the T 3 represents the temperature of the flow entering the combustor and is usually designed to be kept as constant as possible in order to generate a good combustion.
Finally, replacing static with total quantities and following the mathematical approach suggested by Boeing, it is possible to rewrite the emission index equations and the fuel flow equations taking into account the pressure and temperature corrective factors defined above.
E I C O a l t = E I C O S L ( p 3 S L 0 p 3 a l t 0 ) x = E I C O S L [ θ a m b 3.3 δ a m b 1.02 ( 1 k p ( p 2 a l t p 1 a l t ) ) ( k t T 2 a l t T 1 a l t ) 3.3 ] x
E I H C a l t = E I H C S L ( p 3 S L 0 p 3 a l t 0 ) x = E I H C S L [ θ a m b 3.3 δ a m b 1.02 ( 1 k p ( p 2 a l t p 1 a l t ) ) ( k t T 2 a l t T 1 a l t ) 3.3 ] x
E I N O x a l t = E I N O x S L ( p 3 a l t 0 p 3 S L 0 ) y e H = E I N O x S L [ δ a m b 1.02 θ a m b 3.3 ( k p ( p 2 a l t p 1 a l t ) ) ( 1 k t T 2 a l t T 1 a l t ) 3.3 ] y e H
w f S L = r b l e e d w f a l t θ a m b 3.8 δ a m b (   p 1 a l t k p   p 2 a l t ) ( k t T 2 a l t T 1 a l t ) 2.95 ( 1 + 0.2 M 2 )
If x and y coefficients are not available, it is assumed that x = 1 and y = 0.4 [19].
The identification of more adequate values will be tackled in detail by the authors with dedicated research activities. However, it is important to note that for un update or a validation of these exponents, a well-populated database specifically devoted to supersonic engines is fundamental.
The coefficient H represents the humidity factor and can be estimated using the formulation suggested by Boeing [10].

3.3. The Fuel-Flow Rate Correction for Sustainable Aviation Fuels

In this section, the focus moves from the high-speed regime to the exploitation of biofuels. In particular, this section aims at identifying a way to make the revised fuel flow method by PoliTO be sensible to the exploitation of fuels which can be different from the Jet-A1. According to the original method, the fuel flow correlation can be defined starting from a generic energy balance through the combustor:
η b w f L H V = ( w f + w a ) c P ( T 4 T 3 )
where ηb is the burner efficiency (−), wf is the engine fuel flow rate (kg/s), LHV is the fuel lower heating value (J/kg), wa is the engine air flow rate(kg/s), cP is the specific heat at constant pressure (J/(kg·K)), T3 is the total temperature at the combustor inlet (K), and T4 is the total temperature at the combustor exit (K).
Among all the variables of the energy balance through the combustor, the most important one is the lower heating value, which is an energetic index that expresses the fuel energy content, i.e., the amount of energy the fuel is able to release. Thus, it is easy to understand that the higher the heating value, the larger the energy released per kg of fuel and the less fuel burnt. Since the emissions directly depend on the amount of burned fuel, a minor amount of fuel involves less pollutant substances emitted. In addition, it is worth remembering that there are certification limits to the amount of SAF to be used to power the engines and a blending with traditional fuels is therefore mandatory. According to Zschocke [24], the dependence of LHV from blending can be considered linear. Indicating with z (%) the blending percentage, the energy content of the blended fuel ( L H V b l e n d   z % ) can be estimated as follows:
L H V b l e n d   z % = L H V 100 %   S A F   z + L H V k e r o s e n e ( 100 z ) 100
k b l e n d = L H V k e r o s e n e L H V b l e n d   z %
Consequently, Equations (5)–(8) can be rewritten accordingly:
w f S L = r b l e e d w f a l t k b l e n d   θ a m b 3.8 δ a m b (   p 1 a l t k   p 2 a l t ) ( T 2 a l t T 1 a l t ) 2.95 ( 1 + 0.2 M 2 )
E I C O a l t = E I C O S L [ θ a m b 3.3 δ a m b 1.02 ( 1 k p ( p 2 a l t p 1 a l t ) ) ( k t T 2 a l t T 1 a l t ) 3.3 ] x k b l e n d
E I H C a l t = E I H C S L [ θ a m b 3.3 δ a m b 1.02 ( 1 k p ( p 2 a l t p 1 a l t ) ) ( k t T 2 a l t T 1 a l t ) 3.3 ] x k b l e n d
E I N O x a l t = E I N O x S L [ δ a m b 1.02 θ a m b 3.3 ( k p ( p 2 a l t p 1 a l t ) ) ( 1 k t T 2 a l t T 1 a l t ) 3.3 ] y e H k b l e n d
For the sake of completeness, it is worth underlining that the impact of the exploitation of biofuels on the emission index equations is also somehow hidden under the reference emission indexes at sea level. Indeed, as reported in Section 2, the exploitation of biofuel can directly affect the grams of emissions per kg of fuel burnt, showing moderate differences with respect to traditional kerosene fuels.
The revised fuel flow method by PoliTO is graphically summarised in Figure 4.

4. Model Validation and Main Results (S2F2)

4.1. Model Validation with Concorde Experimental In-Flight Test Campaign Data

In order to validate the new equations reported in Section 3 and therefore the Sustainable supersonic fuel flow method (S2F2) by PoliTO, the results of a Concorde experimental in-flight test campaign were used [25]. Specifically, Table 5 report the data retrieved from the literature. The Concorde is the only supersonic passenger airplane of which a large base of data exists. It may be considered as the most representative supersonic passenger airplane not only for the large amount of available data, but also for its technical peculiarities: the cruise speed at Mach 2.02 is representative of the entire supersonic regime, analysed between Mach 1.2 and Mach 3; the maximum cruise altitude at 60,000 ft is far above the standard altitude of current subsonic airplanes; and there are many data allowing the engine air-intake to be modelled, allowing a proper validation of the new models. Table 3 and Table 4 report Concorde data used for the validation of the modified fuel flow method reported in this paper.
Starting from the available data reported in Table 5, the EI-fuel flow correlations have been graphically and mathematically identified, as shown in Figure 5.
Following the revised method proposed by PoliTO and summarised in Figure 4, the emission indexes in cruise condition for the Olympus engine were evaluated.
In addition, the EINOx value was compared to the data available from the in-flight test campaign, showing a better estimate with respect to the traditional method (see Table 5. It is important to notice that, in this case, using the same reference conditions as the original fuel flow method by Boeing, you cannot obtain meaningful EI values in cruise because the original fuel flow correlation is a reference fuel flow at sea level, which is much higher with respect to the fuel flow range reported in Figure 4.

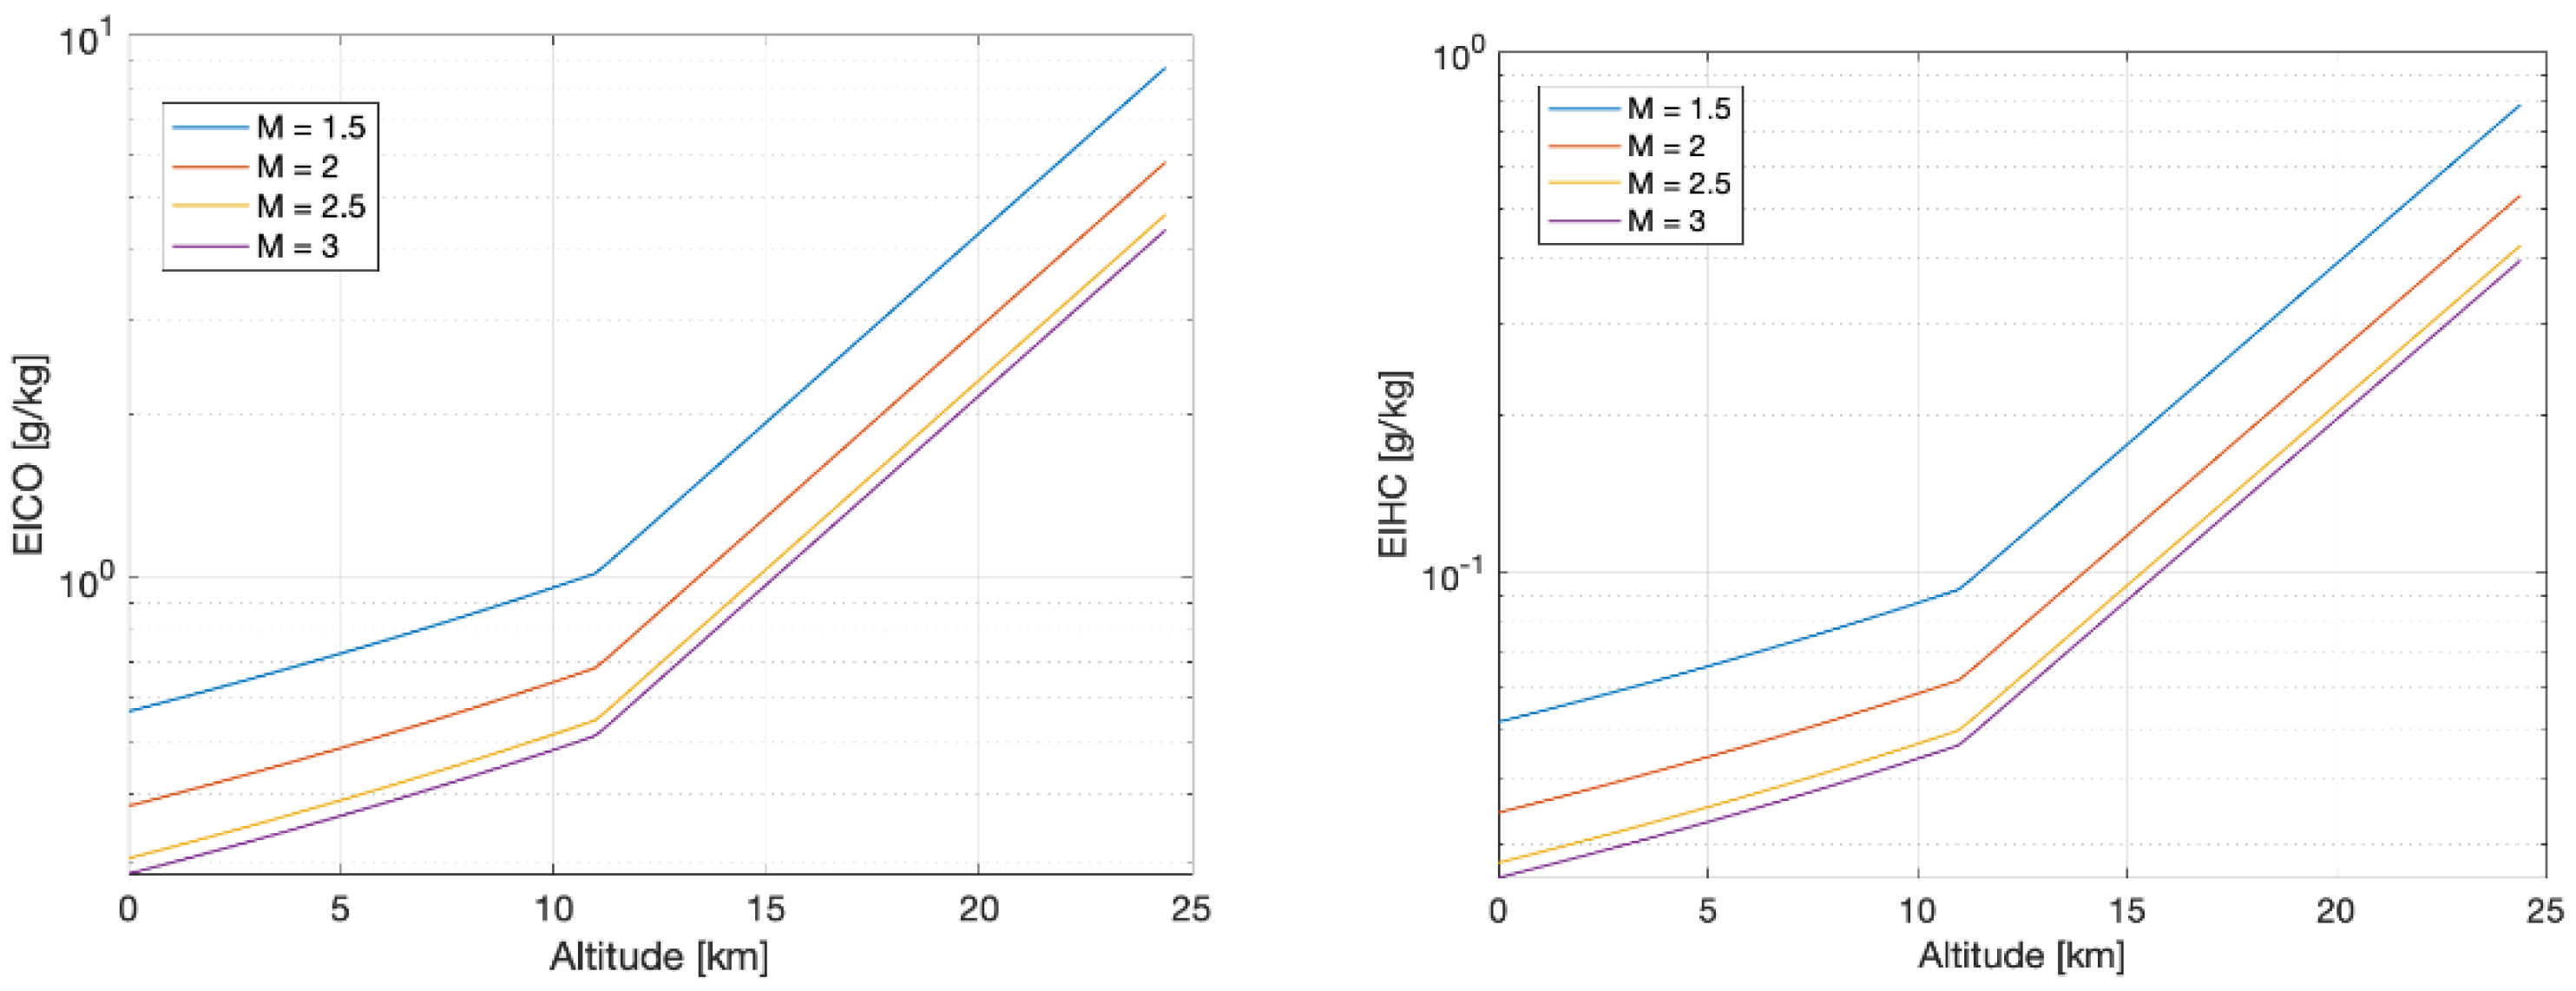
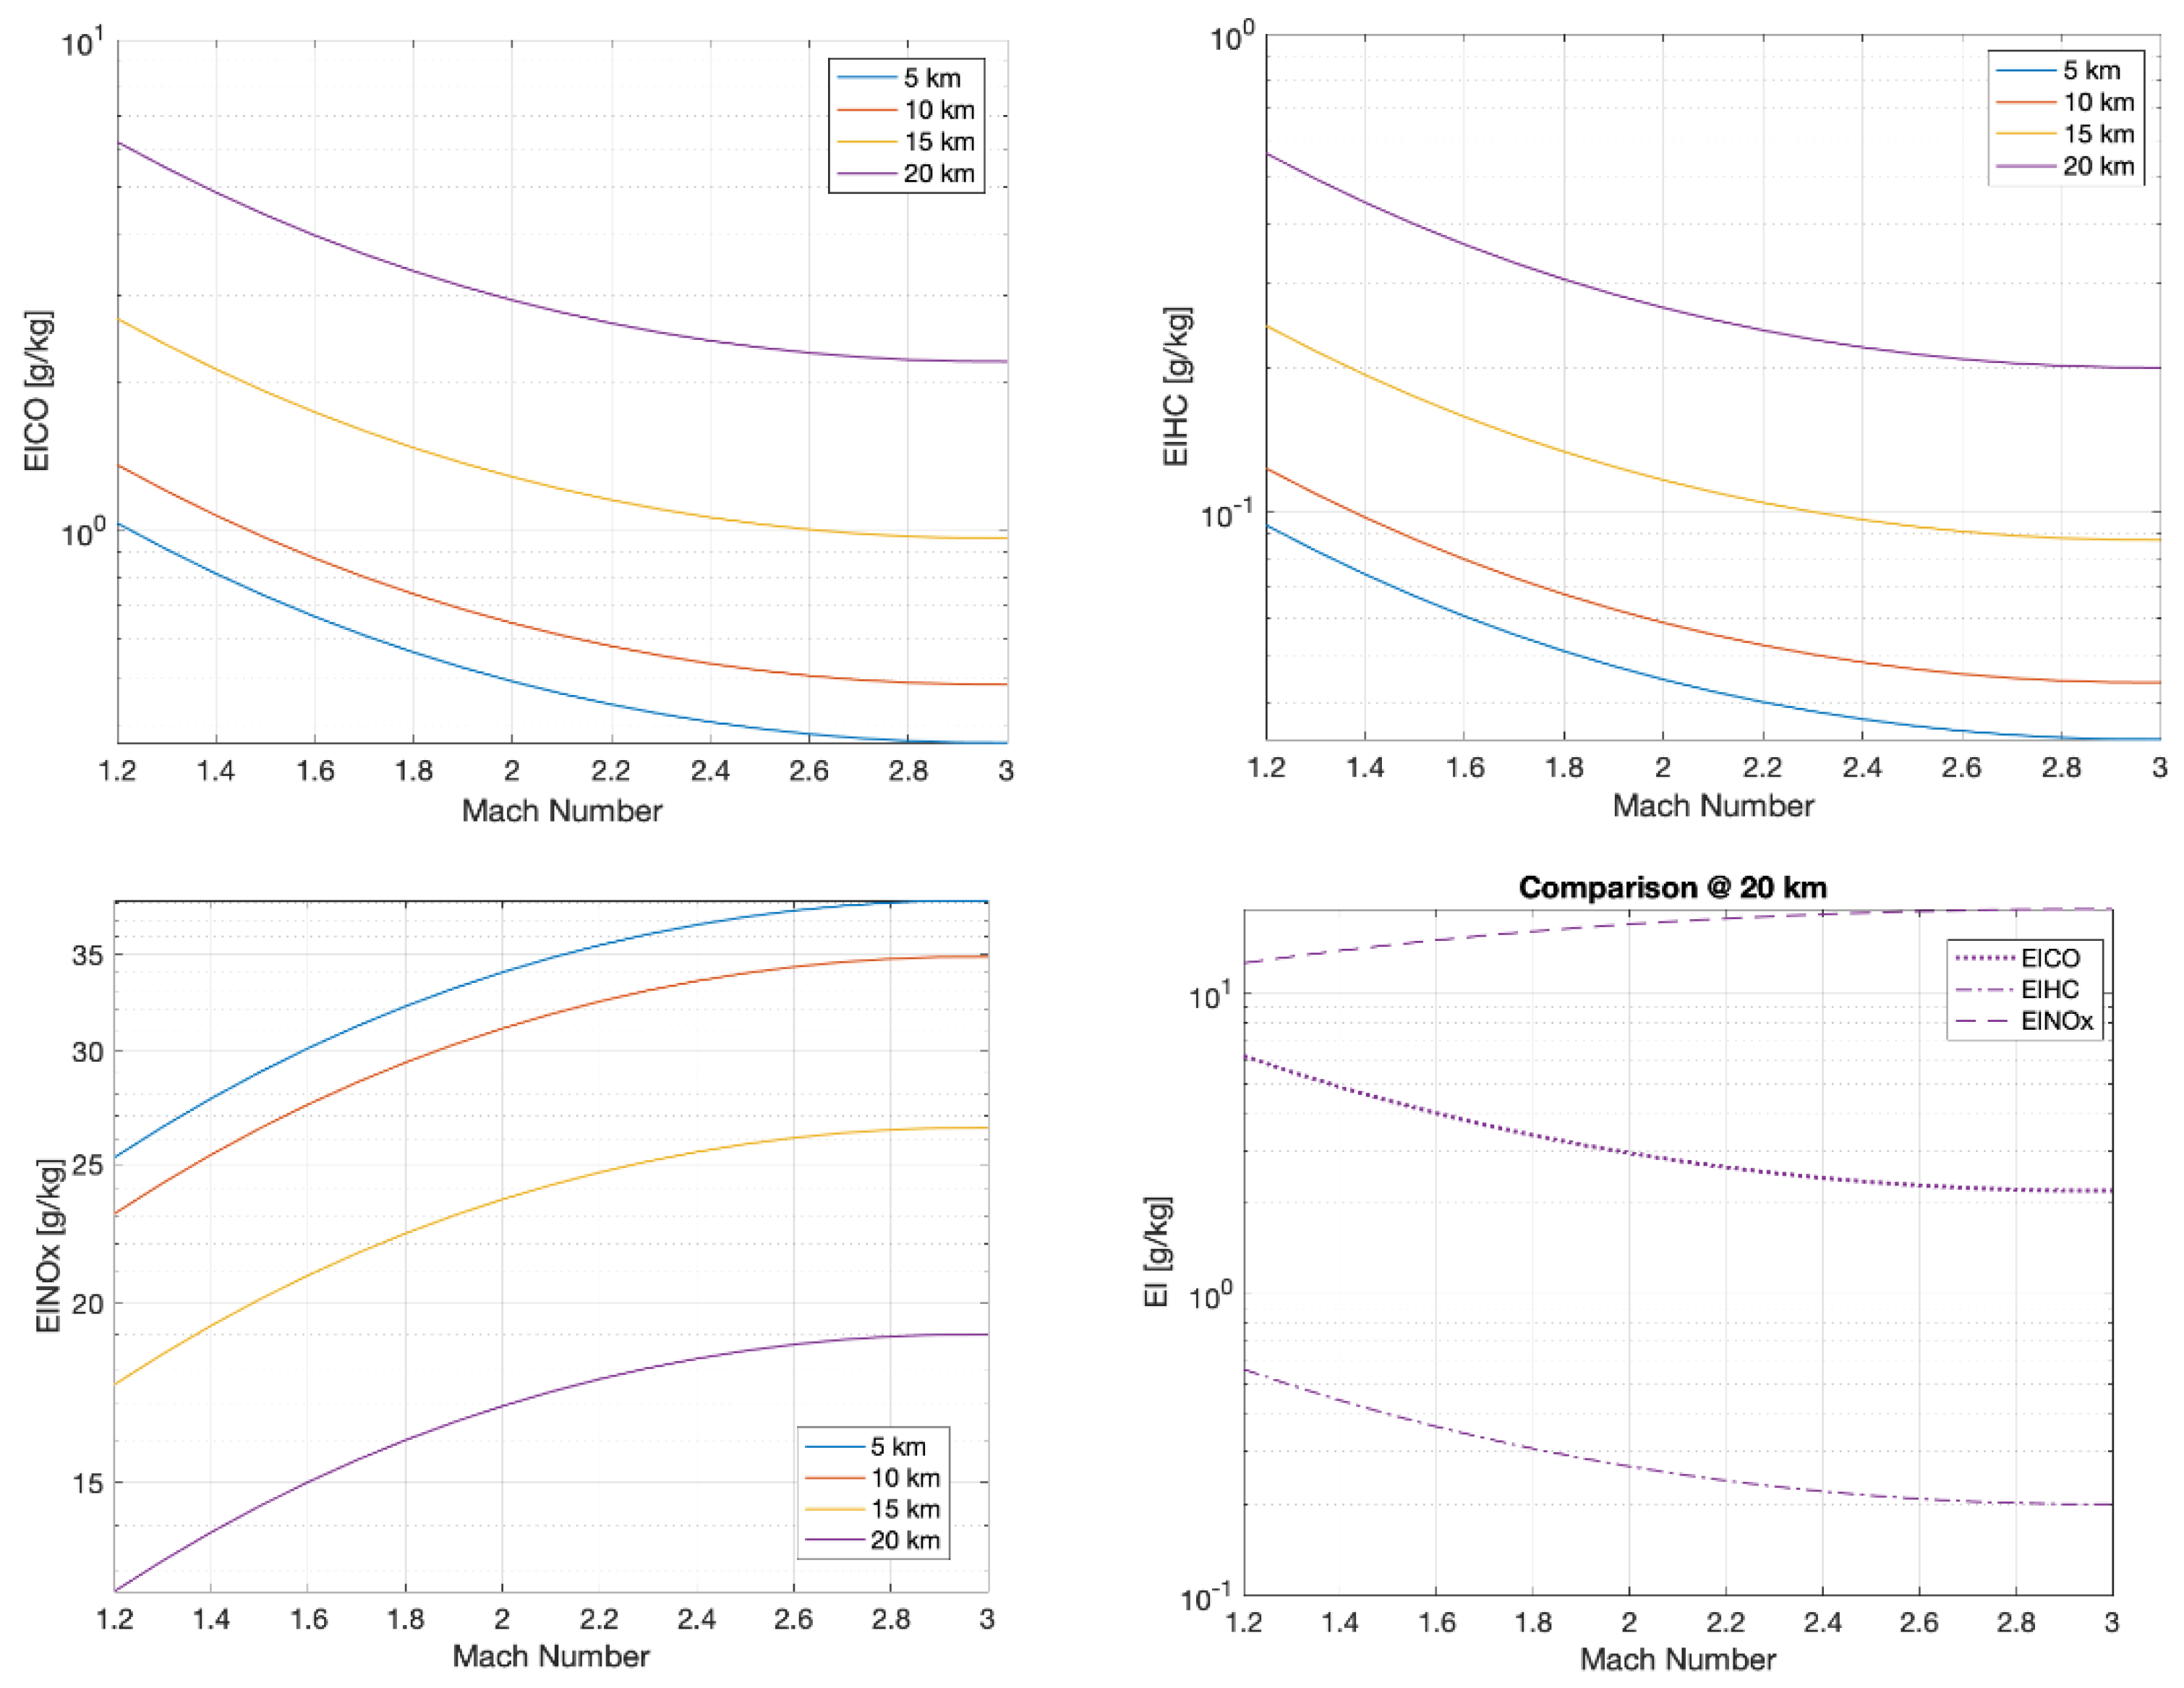
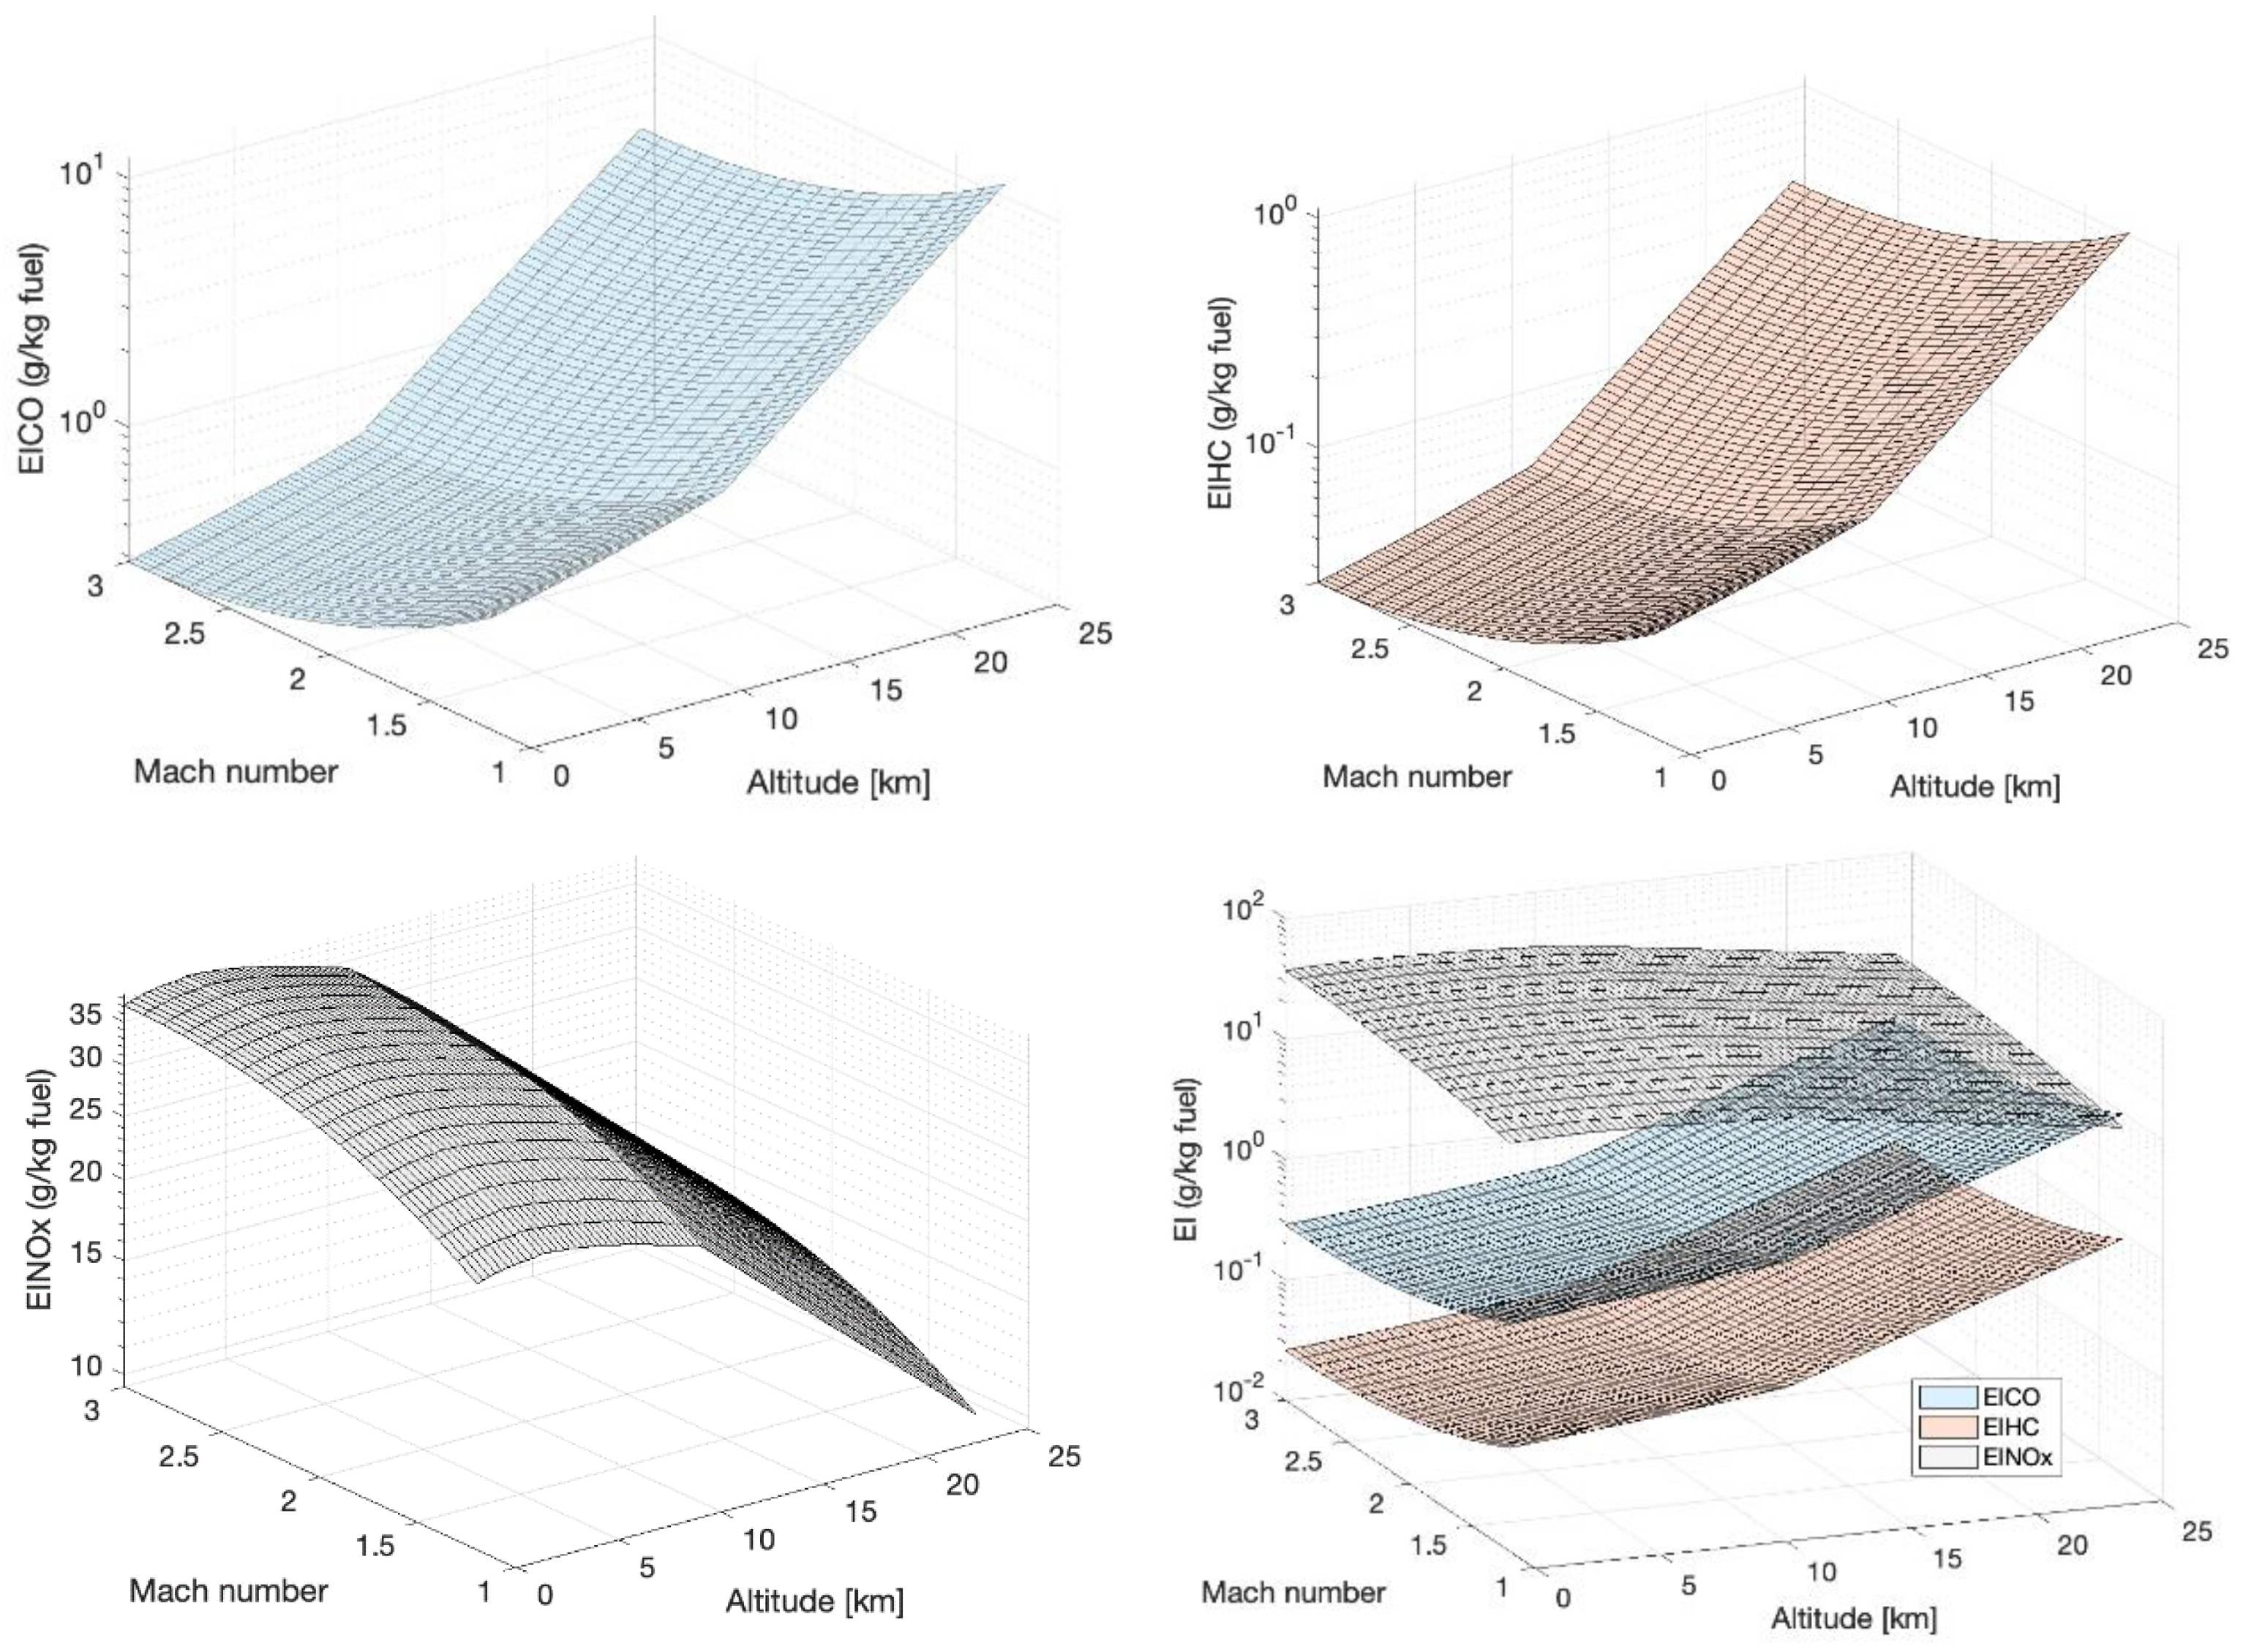
4.2. Parametric Analysis of the Impact of Cruise Conditions on Emission Indexes

This section aims at investigating the effect of different supersonic cruise conditions on emission indexes. Therefore, the model thoroughly described in the previous subsections is here investigated through a parametric analysis where the variables which describe the freestream cruise condition, i.e., the altitude, the Mach number, the temperature, and the pressure are used as parameters of the analysis.
The first set of graphical results is reported in Figure 6, where for each specific cruise Mach number, it is possible to evaluate the impact of a variation of altitude onto the three emission indexes. It is possible to notice the trend discontinuity at 11 km of altitude due to the passage from the troposphere to the lower stratosphere (or tropopause): in this atmospheric layer, the temperature stops decreasing and the model assumes it is fixed at about −56 °C. This causes a change of behaviour of the quantities because the exponential trend of the pressure becomes overwhelming. In this case, the Mach number is fixed for each trend and used as a parameter. Figure 7 shows the results of the parametric analysis carried out to verify the impact of cruise Mach number on the emission indexes. When the Mach number is higher than 3, it seems that the trend changes direction, but this is not the case, probably due to the weakness of the model for the high supersonic regime. It is therefore wise to limit the application of the model in the Mach range between 1.2 and 3. Figure 8 shows 3D plots to complement the analysis and to provide the readers with an overall perspective on the problem.

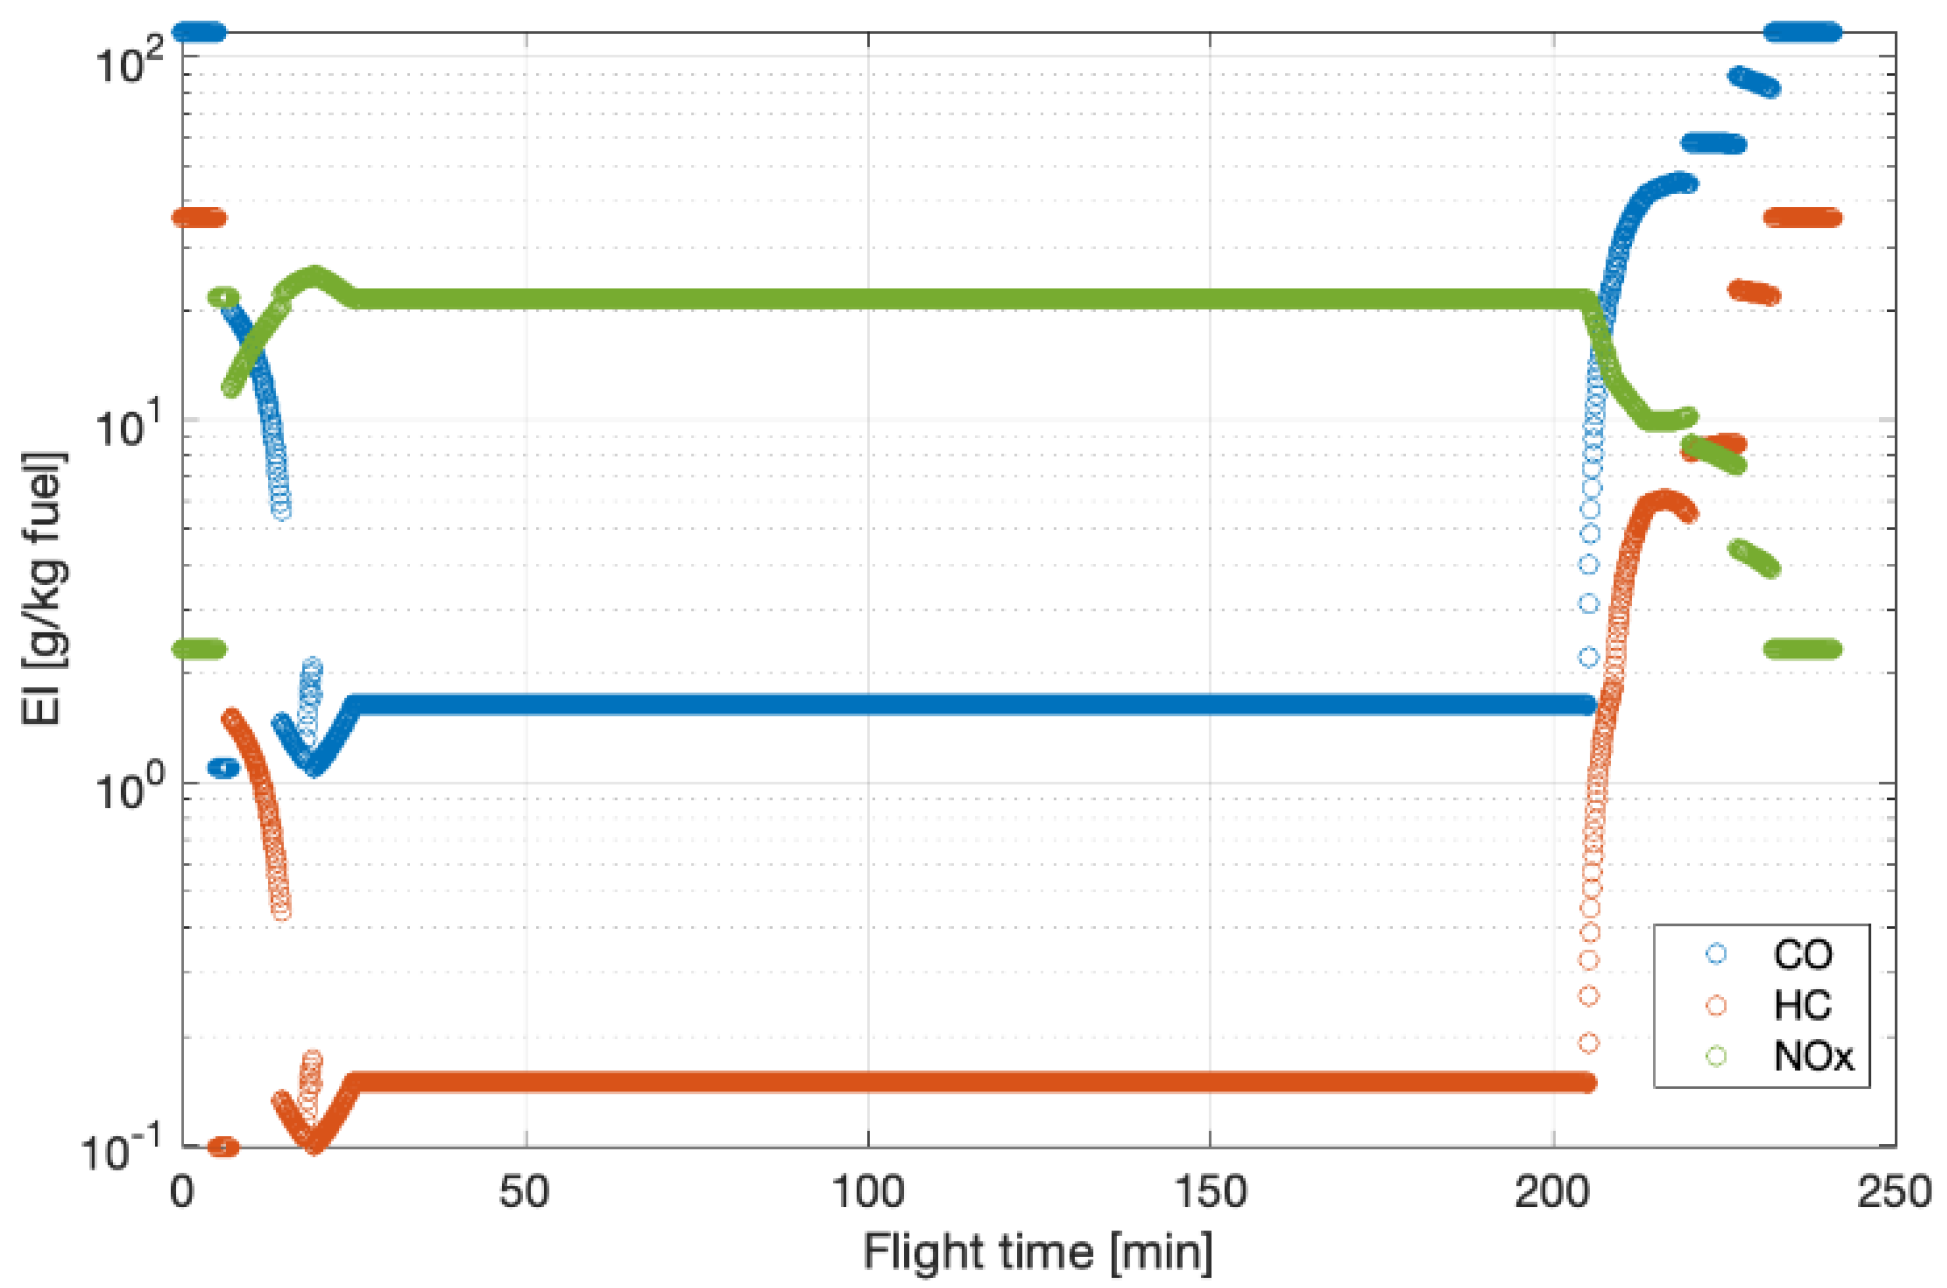
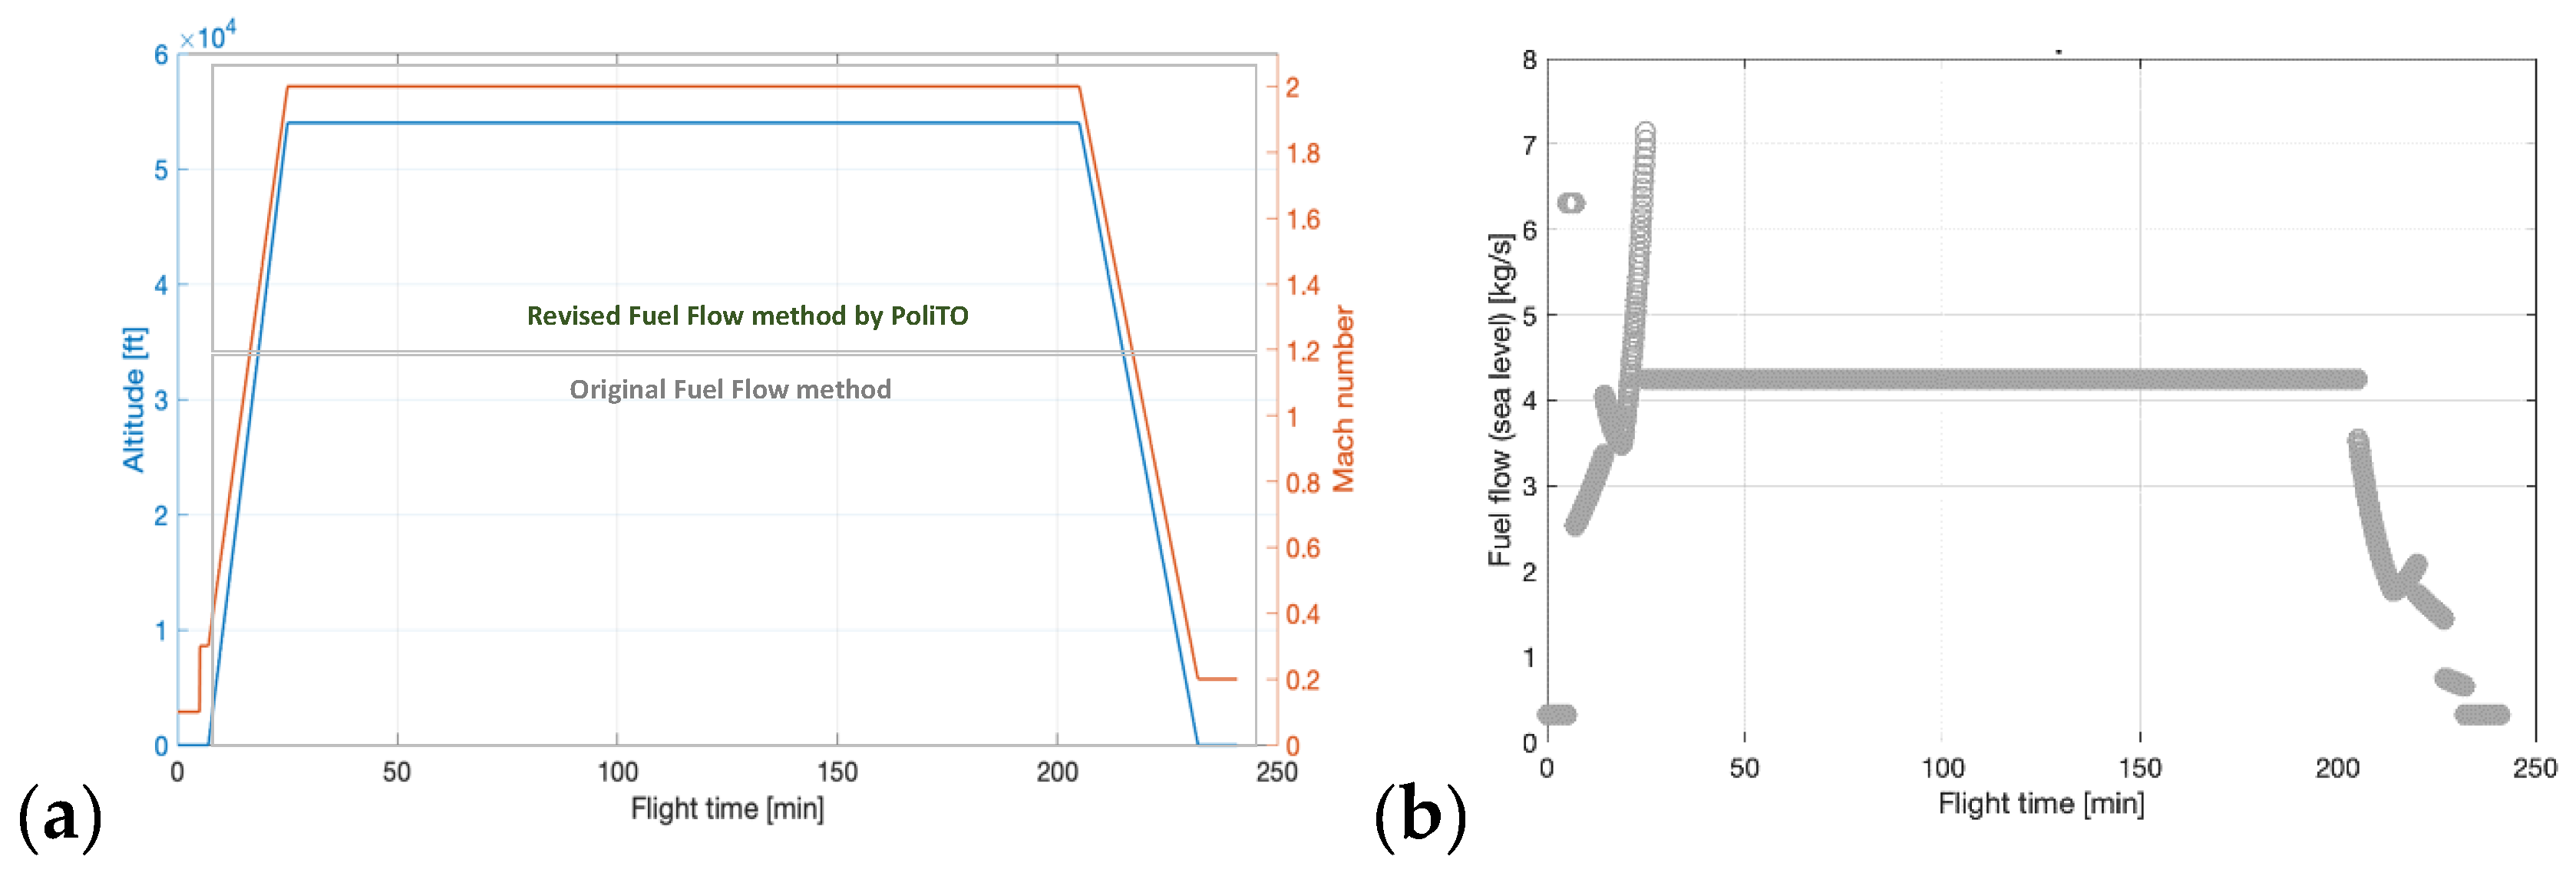
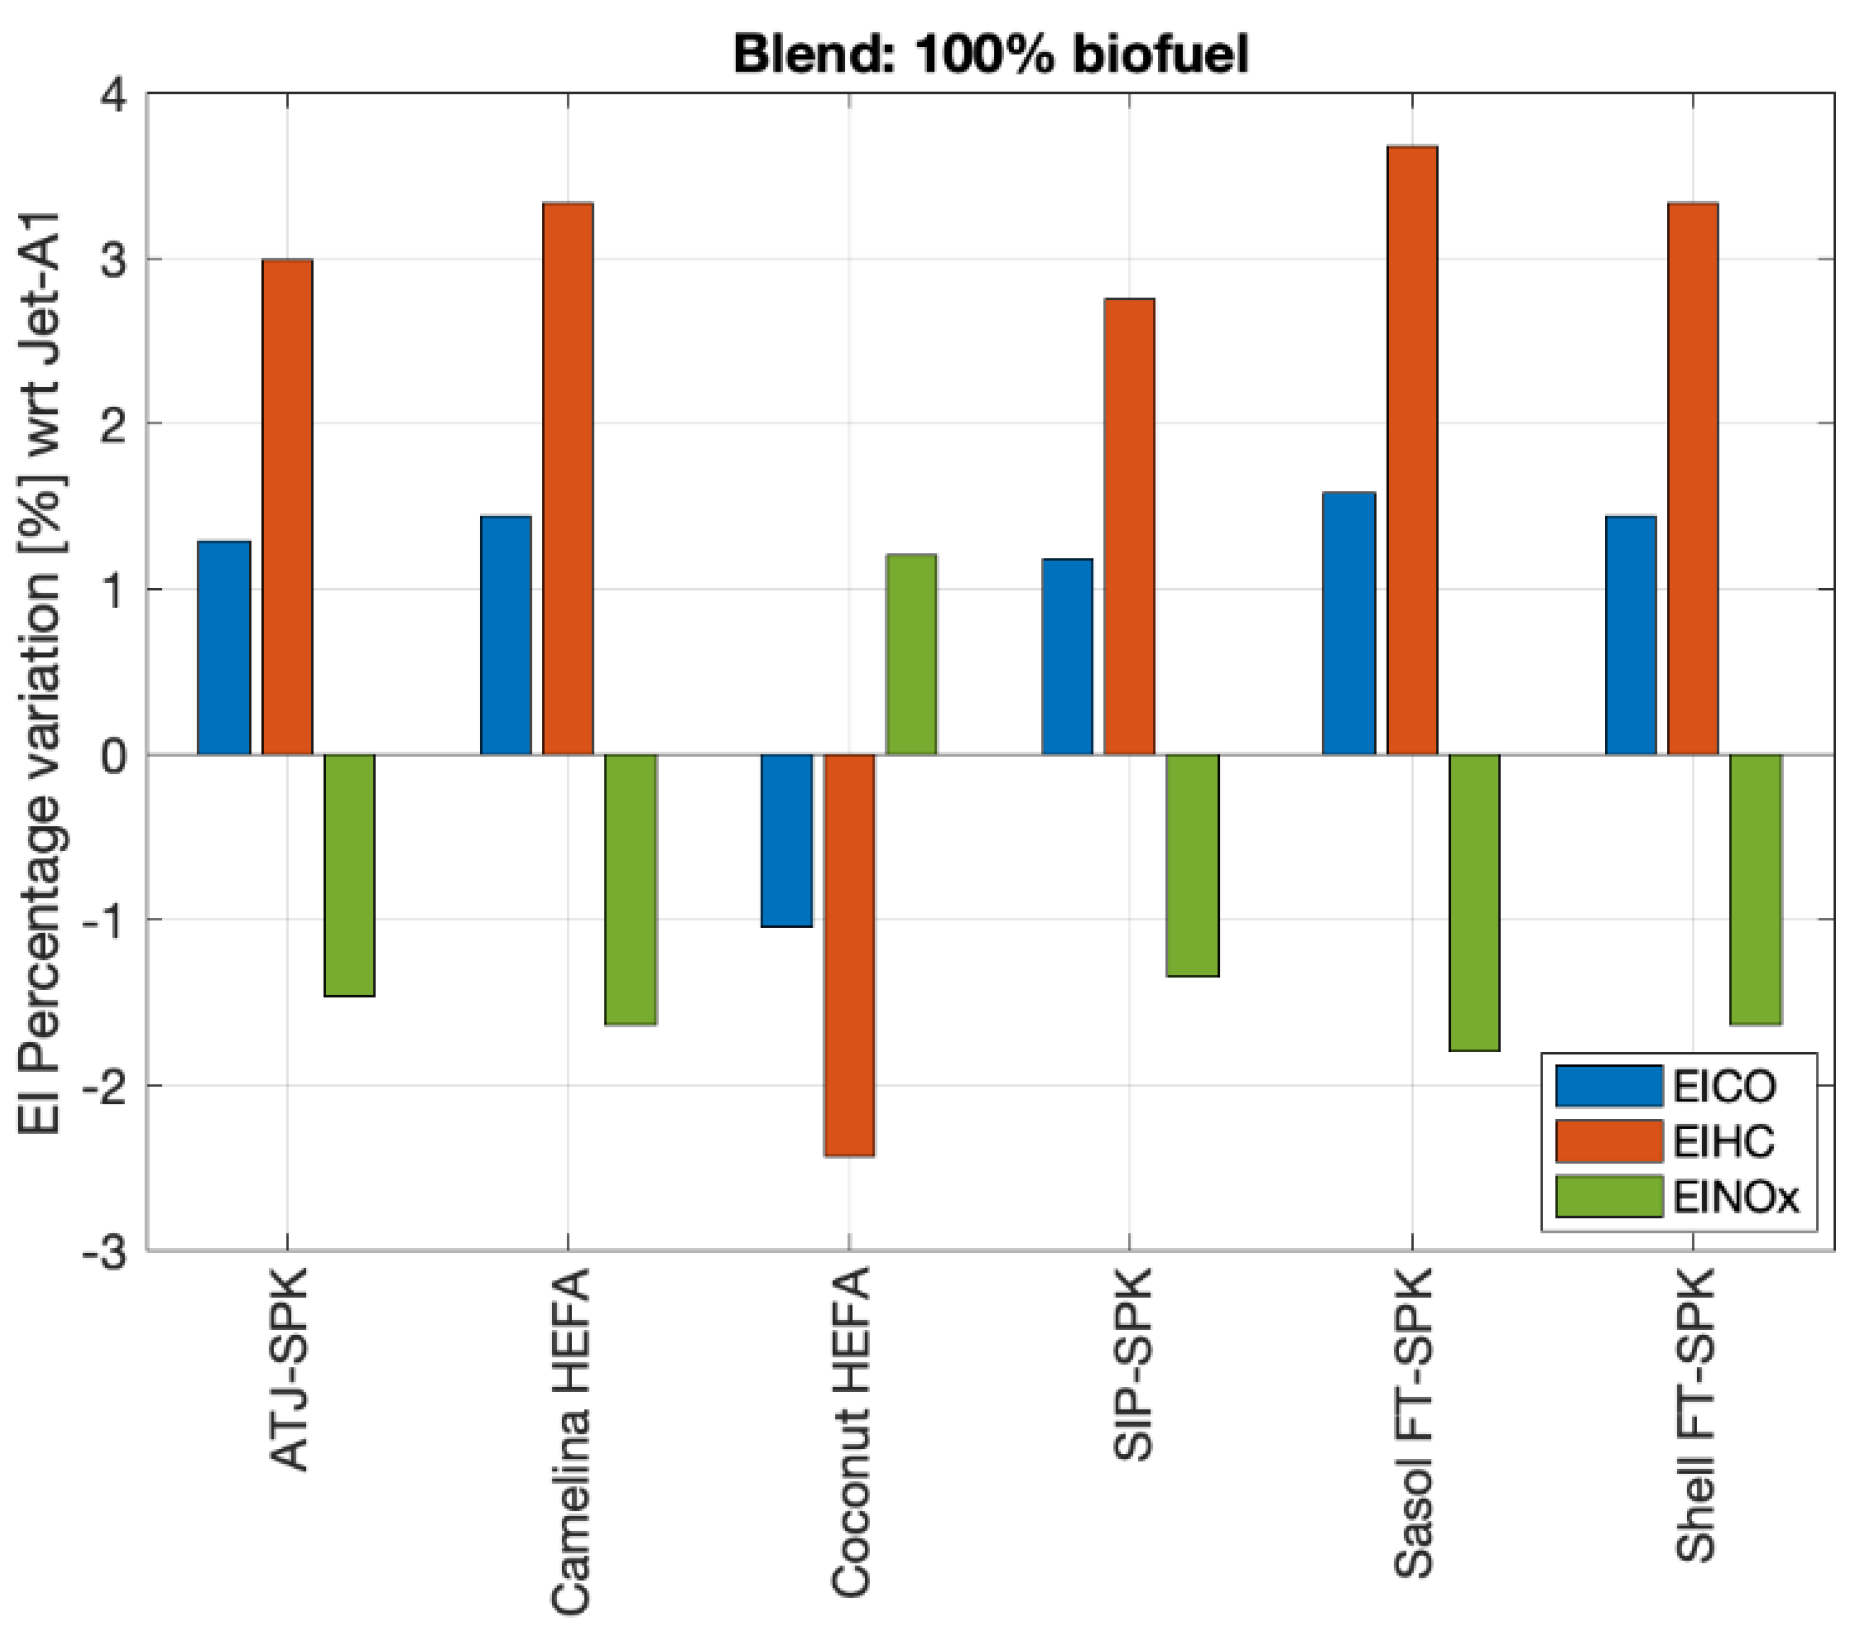
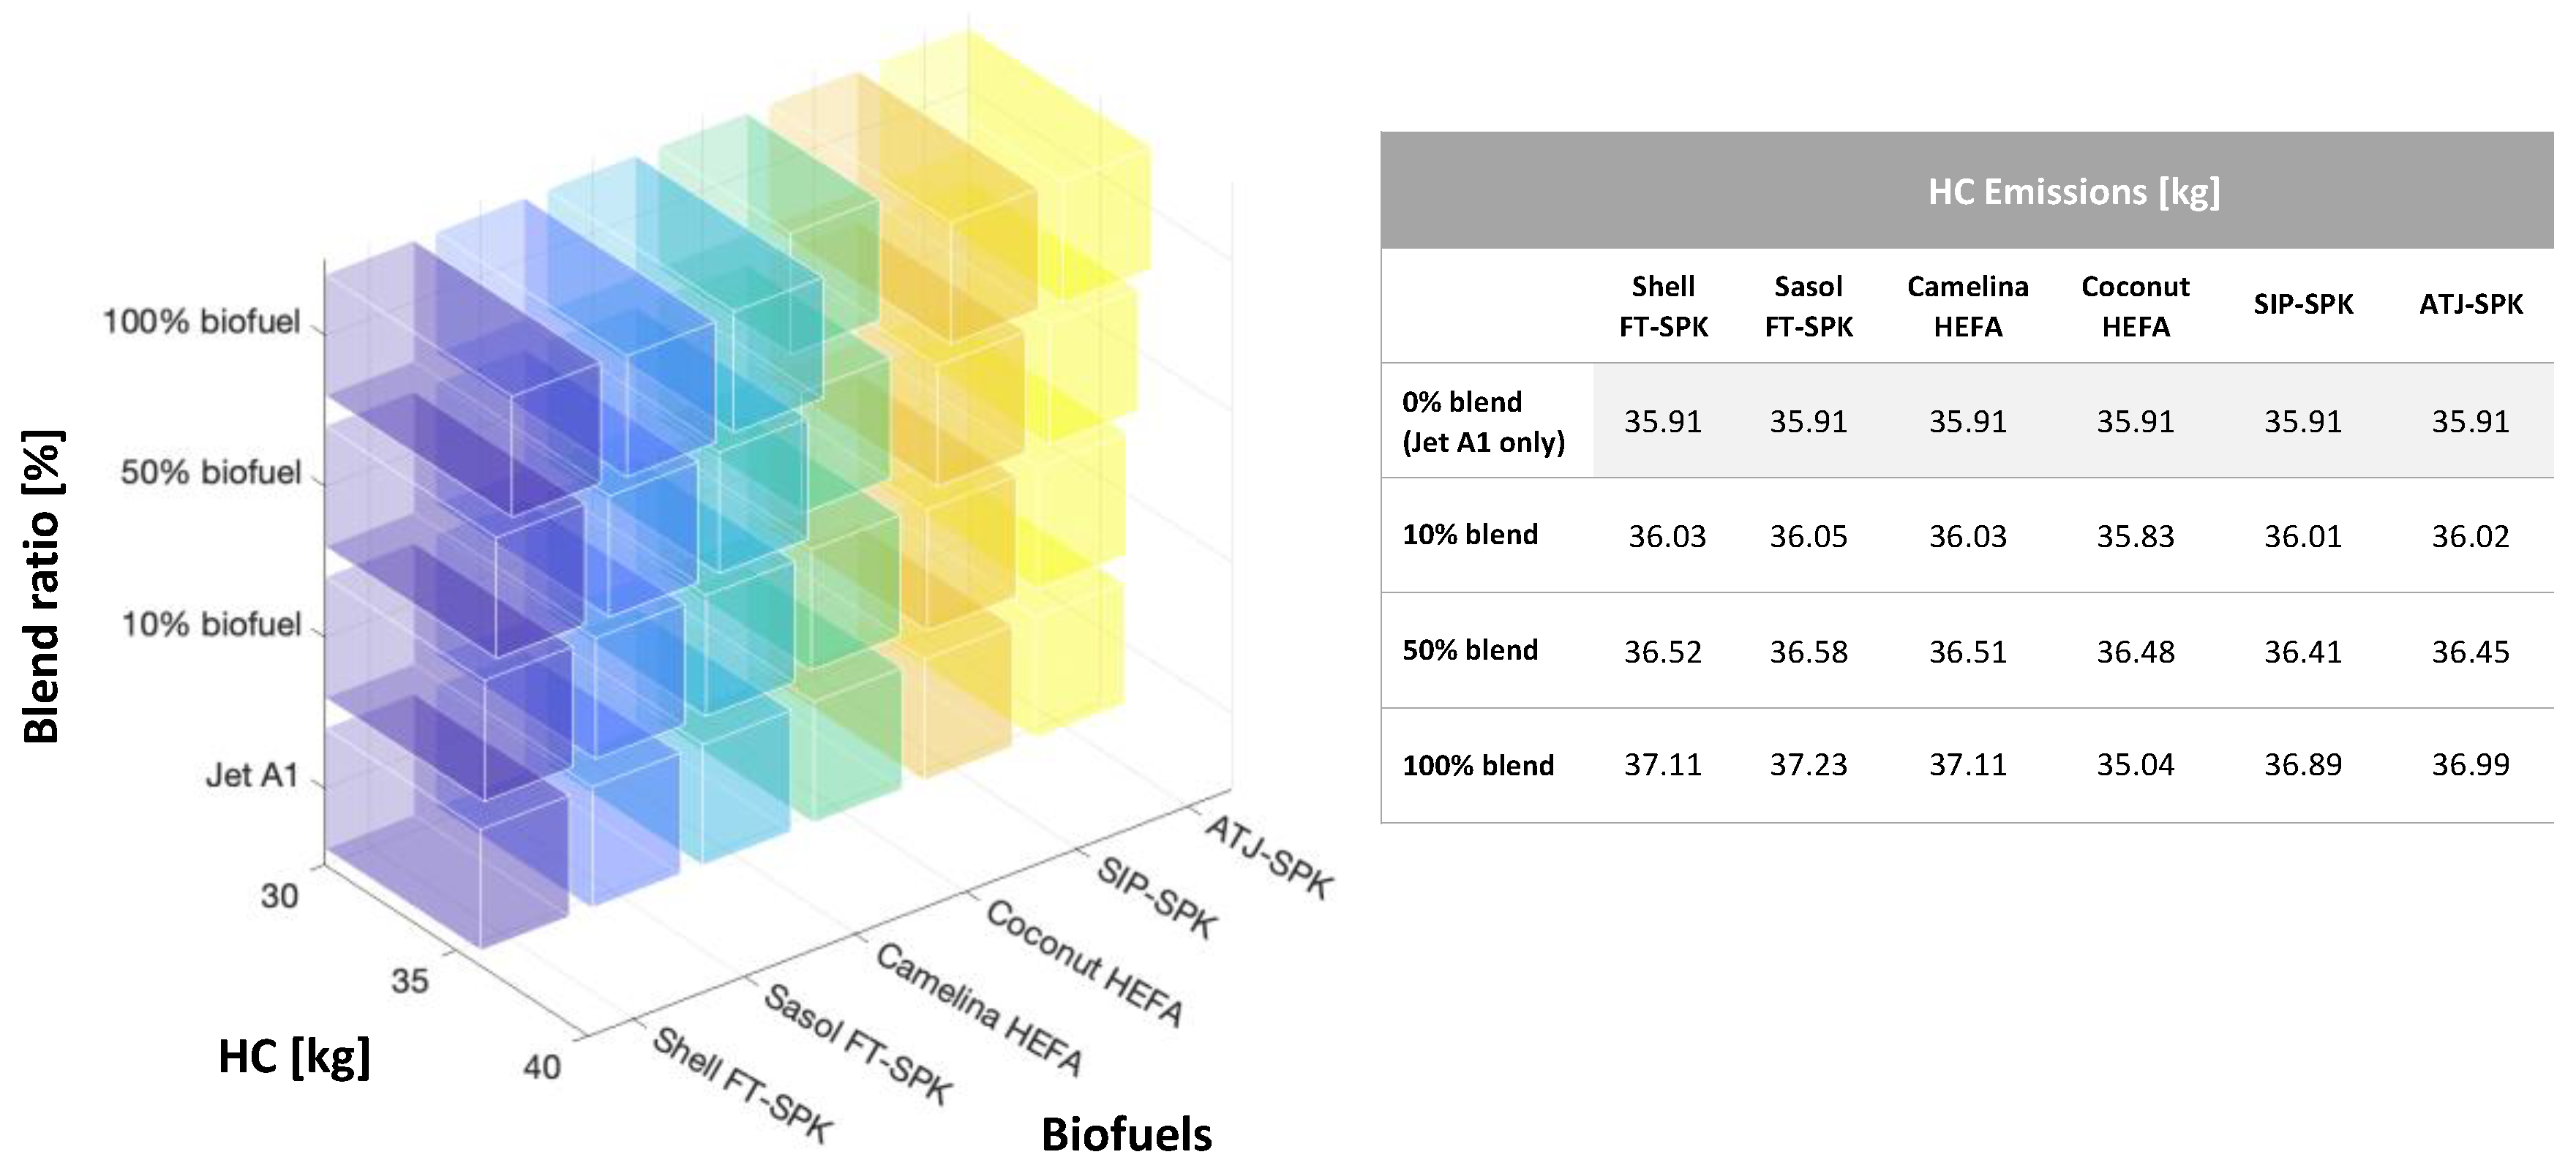
4.3. Concorde Emission Estimation throughout a Reference Trajectory

In the previous section of this paper, an in-depth investigation of the impact on emission indexes of different supersonic cruise conditions was conducted. The application of the PoliTO’s fuel flow method is now used to evaluate the emissions throughout an entire reference mission trajectory. In line with the previous sections, the Concorde is kept as reference. Figure 8 reports a graphical description of the reconstructed reference mission profile in terms of altitude and Mach number, by means of a double y-axis diagram. Considering that the LTO phases have already been analysed in depth in the previous section, for the purposes of this section, the take-off and landing phases are strongly simplified. Then, per each point of the mission profile, the original fuel flow method or the revised fuel flow method by PoliTO is applied (Figure 9a) and the reference fuel flow reported at sea level conditions is evaluated (Figure 9b). Then, benefitting from the EI-fuel flow correlation at the sea level condition reported in Figure 4, it is possible to estimate the related CO, HC, and NOx emission indexes at sea level and then, applying the proper subsonic or supersonic corrective factors, the emission indexes in-flight conditions are estimated (Figure 10). Despite the simplification to mission phases, the combination of the two methods properly predicts the behaviour of all three species. In fact, the HC and CO are expected to be higher during the low-speed mission phases, when the engine is supposed to operate far from its optimal design point. Conversely, the NOx values are expected to grow during the supersonic mission phases, when the temperature at the inlet of the combustion chamber is higher.
In addition, thanks to the modified model presented in this paper, it is possible to predict what might be the impact on these emission indexes of the exploitation of more sustainable fuels. Figure 11 reports in detail the theoretical maximum EI percentage variation due to the substitution of traditional fuel with a 100% biofuel. Positive variations represent an increment in emission indexes while negative variations are intended as beneficial for the environment. From this chart it is evident that it is not possible to minimise all emission indexes through the exploitation of a single biofuel type. A proper diversification in biofuels from different feedstocks and production processes may be highly beneficial and would increase the economic and the environmental sustainability of the entire product life cycle.
However, considering that biofuel blend ratios are currently bounded up to fix limits (as discussed in Section 2), the impact of a blend ratio from 10% to 100% is reported in Figure 12 for the three different species and for the six different biofuel families considered in this publication. Finally, Figure 13, Figure 14 and Figure 15 disclose the results of the entire mission simulation, providing graphical and numerical results of the impact of biofuel and blend ratios in terms of the overall amount of CO, HC, and NOx emitted by the Concorde at the end of its reference 4 h mission (Figure 9a).

4.4. Discussion on the Applicability of S2F2 to Future SST

The S2F2 methodology presented in this section guarantees the estimation of pollutant and greenhouse gas emissions of future supersonic aircraft, which are also expected to make extensive use of SAFs. Specifically, the S2F2 expands the applicability of the well-known Boeing fuel flow method towards higher Mach numbers and biofuels. Even though the Concorde Olympus engine has been used as an example throughout this section, it is important to underline that the validity of the methodology extends beyond the selected case study. Indeed, the Olympus engine and its peculiar integration into the Concorde airframe was used as a practical example for the derivation of pressure and temperature corrective factors to be used in the new formulation. The values derived based on the Concorde can be directly applied to future SSTs adopting similar engine technologies or engine–airframe integration strategies. In case of different aircraft configurations, such as waveriders with highly integrated propulsive subsystems, the values of the pressure and temperature corrective factors cannot be directly extrapolated from Figure 3, and new trends will be derived to be more representative of the innovative configurations and higher level of engine–airframe integration. Moreover, it is also worth noticing that, even though this section reports the application of S2F2 to only a few certified biofuels, the proposed formulation is considered applicable to any other type of jet fuel, thus representing a useful tool for the evaluation of the environmental impact of under development and future fuel technologies.

5. Conclusions

This paper disclosed an algorithm to complement the conceptual design of future sustainable supersonic civil aircraft with pollutant and greenhouse gas emissions estimation. After a thorough review of currently certified biofuels, the paper focused on the revision of the fuel flow method by Boeing to extend its applicability to supersonic engines and to the exploitation of sustainable fuels. The modified fuel flow method by PoliTO, referred to as S2F2, was proved to be able to properly estimate the pollutant emissions of the Olympus engine in cruise when equipped to the famous Concorde. Even if the Olympus engine technologies can be considered not up-to-date, the Concorde is the only SSt for which performance data as well as the results of experimental in-flight test campaigns are available. Even if the comparison of data estimation with real in-flight measurements was possible in a single datapoint only, the computed error of the modified fuel flow method by PoliTO was lower than 10%, whilst the original fuel flow method results were not applicable for freestream Mach numbers higher than Mach 1.2, considering that the reference fuel flow reported at sea level is beyond the physical limits of the engine.
Moreover, the paper reports a set of interesting parametric analyses which might be used to introduce environmental sustainability aspects into multidisciplinary optimisation processes at the conceptual design stage. Eventually, the modified fuel flow method by PoliTO proved to be very useful to understand the impact of the introduction of more sustainable aviation fuels in supersonic aviation. By flying the Concorde with the available certified biofuels, depending on the adopted blend ratio, it is possible to save up to 20 kg of NOx emissions. As an absolute value this might appear as a limited achievement, but if we consider the entire fuel life cycle, from feedstock growth up to the emission release into the atmosphere, this value represents an important result and a valuable contribution to the future of high-speed aviation. Indeed, when dealing with biofuels, it is crucial to remember that the main difference with respect to the traditional kerosene fuels consists in the emission lifecycles, which might be considered linear for traditional fuels and circular for biofuels. For example, in the case of biofuels, a huge contribution to the net CO2 emissions is given by the feedstocks at the beginning of the circular path; indeed, the CO2 absorbed by plants during the growth of the biomass is almost equal to the amount of carbon produced when the fuel is burnt. It implies the possibility of being carbon neutral over the life cycle, excluding emissions generated during production processes and distribution, giving rise to a circular phenomenon instead of a linear one. In this context, one of the most interesting future works is the analysis of the correlation of the environmental sustainability aspects with the economic sustainability, that perfectly fits the circular economy paradigm for biofuels.

Author Contributions

Conceptualization, R.F. and N.V.; methodology, R.F. and D.G.; software, D.G.; validation, D.G.; formal analysis, D.G., R.F. and N.V.; resources, N.V.; writing—original draft preparation, R.F.; writing—review and editing, N.V.; project administration, N.V. All authors have read and agreed to the published version of the manuscript.

Funding

This research received no external funding.

Institutional Review Board Statement

Not applicable.

Informed Consent Statement

Not applicable.

Conflicts of Interest

The authors declare no conflict of interest.

References

  1. Eurocontrol Forecast Update 2021–2024 European Flight Movements and Service Units—Three Scenarios for Recovery from COVID-19. Available online: https://www.eurocontrol.int/publication/eurocontrol-forecast-update-2021-2024 (accessed on 6 October 2021).
  2. Blockley, R. Green Aviation; John Wiley & Sons: Hoboken, NJ, USA, 2016. [Google Scholar]
  3. Roland Berger. Sustainable Aviation Fuels: The Best Solution to Large Sustainable Aircraft? Roland Berger: Munich, Germany, 2020. [Google Scholar]
  4. Voigt, C.; Kleine, J.; Sauer, D.; Moore, R.H.; Bräuer, T.; Le Clercq, P.; Kaufmann, S.; Scheibe, M.; Jurkat-Witschas, T.; Aigner, M.; et al. Cleaner burning aviation fuels can reduce contrail cloudiness. Commun. Earth Environ. 2021, 2, 1–10. [Google Scholar] [CrossRef]
  5. Narciso, M.; de Sousa, J.M.M. Influence of Sustainable Aviation Fuels on the Formation of Contrails and Their Properties. Energies 2021, 14, 5557. [Google Scholar] [CrossRef]
  6. Clean Sky 2 JU. Hydrogen-Powered Aviation: A Fact-Based Study of Hydrogen Technology, Economics, and Climate Impact by 2050; Clean Sky: Brussels, Belgium, 2020. [Google Scholar]
  7. Stevenson, D.S.; Doherty, R.M.; Sanderson, M.G.; Collins, W.J.; Johnson, C.E.; Derwent, R.G. Radiative forcing from aircraft NOx emissions: Mechanisms and seasonal dependence. J. Geophys. Res. Atmos. 2004, 109. [Google Scholar]
  8. Ferretto, D.; Fusaro, R.; Viola, N. Innovative Multiple Matching Charts Approach to Support the Conceptual Design of Hypersonic Vehicles. Proc. Inst. Mech. Eng. Part G J. Aerosp. Eng. 2020, 234, 1893–1912. [Google Scholar] [CrossRef]
  9. Sarli, V.J.; Eiler, D.C.; Marshall, R.L. Effects of operating variables on gaseous emissions. In Proceedings of the Air Pollution Control Association Speciality Conference on Air Pollution Measurement Accuracy As It Relates to Regulation Compliance, New Orleans, LA, USA, 26 October 1975. [Google Scholar]
  10. DuBois, D.; Paynter, G.C. Fuel Flow Method2 for Estimating Aircraft Emissions. SAE Trans. 2006, 115, 1–14. [Google Scholar]
  11. Ali, D. NOx emissions of turbofan powered unmanned aerial vehicle for complete flight cycle. Chin. J. Aeronaut. 2020, 33, 1683–1691. [Google Scholar] [CrossRef]
  12. Wang, Y.; Yin, H.; Zhang, S.; Yu, X. Multi-objective optimization of aircraft design for emission and cost reductions. Chin. J. Aeronaut. 2014, 27, 52–58. [Google Scholar] [CrossRef] [Green Version]
  13. Air Transport Action Group. Beginner’s Guide to Sustainable Aviation Fuel, 3rd ed.; Air Transport Action Group: Geneva, Switzerland, 2017. [Google Scholar]
  14. ICAO. Sustainable Aviation Fuels Guide (Transforming Global Aviation Collection); ICAO: Montreal, QC, Canada, 2017. [Google Scholar]
  15. Yang, J.; Xin, Z.; Corscadden, K.; Niu, H. An overview on performance characteristics of bio-jet fuels. Fuel 2019, 237, 916–936. [Google Scholar] [CrossRef]
  16. IRENA. Biofuels for Aviation: Technology Brief; IRENA: Abu Dhabi, United Arab Emirates, 2017. [Google Scholar]
  17. IRENA. Reaching Zero with Renewables: Biojet Fuels, International Renewable Energy Agency; IRENA: Abu Dhabi, United Arab Emirates, 2021; ISBN 978-92-9260-350-2. [Google Scholar]
  18. Przysowa, R.; Gawron, B.; Białecki, T.; Łęgowik, A.; Merkisz, J.; Jasiński, R. Performance and Emissions of a Microturbine and Turbofan Powered by Alternative Fuels. Aerospace 2021, 8, 25. [Google Scholar] [CrossRef]
  19. Gawron, B.; Białecki, T.; Janicka, A.; Suchocki, T. Combustion and Emissions Characteristics of the Turbine Engine Fueled with HEFA Blends from Different Feedstocks. Energies 2020, 13, 1277. [Google Scholar] [CrossRef] [Green Version]
  20. Braun-Unkhoff, M.; Riedel, U.; Wahl, C. About the emissions of alternative jet fuels. CEAS Aeronaut. J. 2017, 8, 167–180. [Google Scholar]
  21. ICAO. ICAO Engine Emissions Databank; ICAO: Montreal, QC, Canada, 2020. [Google Scholar]
  22. Anderson, J.D., Jr. Fundamentals of Aerodynamics; Tata McGraw-Hill Education: New York, NY, USA, 2010. [Google Scholar]
  23. AIAA Foundation Student. Let’s Re-Engine the Concorde, Design Competition Request for Proposal; AIAA: Reston, VA, USA, 2020. [Google Scholar]
  24. Zschocke, A.; Scheuermann, S.; Ortner, J. High biofuel blends in aviation (HBBA). Interim Rep. ENER C 2017, 2, 420–421. [Google Scholar]
  25. Fahey, D.W.; Keim, E.R.; Boering, K.A.; Brock, C.A.; Wilson, J.C.; Jonsson, H.H.; Chan, K.R. Emission measurements of the Concorde supersonic aircraft in the lower stratosphere. Science 1995, 270, 70–74. [Google Scholar] [CrossRef]
  26. Munt, R. Aircraft Technology Assessment: Progress in Low Emissions Engine; Standards Development and Support Branch, Emission Control Technology Division, Office of Mobile Source Air Pollution Control, Office of Air, Noise and Radiation, US Environmental Protection Agency: Washington, DC, USA, 1981. [Google Scholar]
Figure 1. Original fuel flow method by Boeing and improvements to cope with supersonic case studies and sustainable aviation fuels.
Aerospace 08 00331 g001
Figure 2. Incident and reflected oblique shocks and normal-shock approximation close to the wall.
Aerospace 08 00331 g002
Figure 3. Pressure and temperature corrective factors as function of the Mach number.
Aerospace 08 00331 g003
Figure 4. Sustainable supersonic fuel flow method (S2F2) to cope with supersonic case studies and sustainable aviation fuels.
Aerospace 08 00331 g004
Figure 5. Olympus engine emission indexes data as function of fuel flow rate (bi-logarithmic).
Aerospace 08 00331 g005
Figure 6. Emission indexes variation as function of altitude at different cruise Mach.
Aerospace 08 00331 g006aAerospace 08 00331 g006b
Figure 7. Emission indexes variation as function of cruise Mach numbers at different altitudes.
Aerospace 08 00331 g007
Figure 8. Emission indexes variation as function of cruise Mach numbers and altitude.
Aerospace 08 00331 g008
Figure 9. Reference Concorde mission (a) and reference fuel-flow values reported at sea level conditions (b).
Aerospace 08 00331 g009
Figure 10. Emission indexes of the Olympus engine evaluated all along the reference Concorde mission with the modified fuel flow method by PoliTO.
Aerospace 08 00331 g010
Figure 11. Theoretical maximum EI percentage variation due to the substitution of traditional fuel with a 100% biofuel.
Aerospace 08 00331 g011
Figure 12. EI percentage variation due to different biofuel blending ratios.
Aerospace 08 00331 g012
Figure 13. CO overall emissions along the reference Concorde mission, with the impact of different biofuels and blending ratios.
Aerospace 08 00331 g013
Figure 14. HC overall emissions along the reference Concorde mission, with the impact of different biofuels and blending ratios.
Aerospace 08 00331 g014
Figure 15. NOx overall emissions along the reference Concorde mission, with the impact of different biofuels and blending ratios.
Aerospace 08 00331 g015
Table 1. General properties of the most common bio-fuels compared with jet-A1.
FuelFreezing Point (°C)Kinematic Viscosity at −20 °C (mm2/s)Smoke Point (mm)Fuel Density at 15 °C (kg/m3)Net Heat of Combustion (MJ/kg)
Jet A1−474.2727.180443.15
Shell FT-SPK−552.64073744.1
Sasol FT-SPK<−773.8>4076244.2
Camelina HEFA<−773.3>5075144.1
Coconut HEFA−18.56.9492.775942.48
ATJ-SPK−504.79523757.144
Table 2. Differences in emission indexes (g/kg) with respect to Jet-A1.
Differences in Emission Indexes (g/kg) with Respect to Jet-A1
FuelΔ(EICO)Δ(EIHC)Δ(EINOx)
ATJ-SPK2% [18]N/A+10% to +15% [18]
HEFA−5% to −10% [15]−10% [19]+15% to +20% [20]
FT-SPK−10% [15]N/A+10% to −10% [20]
SIP-SPKN/AN/AN/A
Table 3. Concorde data.
QuantityValue
Maximum cruise altitude (ft)60,000
Cruise Mach number2.02
EINOx (54000 ft) (g/kg fuel)20.97
Fuel burnt (LTO cycle) (kg)6420
Fuel flow rate (cruise) (kg/s)1.5
Table 4. Olympus engine emissions data along the reference LTO cycle [26].
wf (kg/h)Comb. Ineff.EICO (g/kg)EIHC (g/kg)EINOx (g/kg)
Idle11400.0584118362.5
Descent23600.038082224.0
Approach45500.0201558.56.5
Climb-out91000.0059201.512.5
Take-off12,7000.00031.1022.3
Afterburner10,0000.020764.56.60
Table 5. Olympus engine emissions in cruise.
In-Flight Test CampaignNew Supersonic Emission Estimation
Value (% Error)
EINOx (@ cruise) [g/kg]20.9722.3 (+6%)
EICO (@ cruise) [g/kg]N/A1.9
EIHC (@ cruise) [g/kg]N/A0.17
Publisher’s Note: MDPI stays neutral with regard to jurisdictional claims in published maps and institutional affiliations.

