Article

Numerical Study of the Lift Enhancement Mechanism of Circulation Control in Transonic Flow

1
College of Aerospace Science and Engineering, National University of Defense Technology, Changsha 410073, China
2
Center of Strategic Assessments and Consulting, Academy of Military Sciences, Beijing 100091, China
*
Author to whom correspondence should be addressed.
Aerospace 2021, 8(11), 311; https://doi.org/10.3390/aerospace8110311
Submission received: 22 September 2021 / Revised: 14 October 2021 / Accepted: 15 October 2021 / Published: 20 October 2021
(This article belongs to the Special Issue Fluid Flow Mechanics)

Abstract

:
The lift of an aircraft can be effectively enhanced by circulation control (CC) technology at subsonic speeds, but the efficiency at transonic speeds is greatly decreased. The underlying mechanism of this phenomenon is not fully understood. In this study, Reynolds averaged Navier—Stokes simulation with k ω shear stress transport model was utilized to investigate the mechanism of lift enhancement by CC in transonic flow. For validation, the numerical CC results were compared with the NASA experimental data obtained for transonic CC airfoil. Thereafter, the RAE2822 airfoil was modified with a Coanda surface. The lift enhancement effects of CC via steady blowing with different momentum coefficients were tested at M a = 0.3 and 0.8 at α = 3 , and various fluid mechanics phenomena were investigated. The results indicate that the flow structure of the CC jet is insensitive to the incoming flow conditions because of the similarity to the local static pressure field around the trailing edge of the airfoil. Owing to the appearance of shockwaves on the airfoil surface in the transonic regime, the performance of the CC jet is restricted to the trailing edge of the airfoil. Transonic CC achieved a slight improvement in aerodynamic performance owing to a favorable shift in the shockwave pattern and accelerated flow in the separation region on the airfoil surfaces. Revealing the mechanism of lift enhancement of CC in the transonic regime can facilitate the rational design of new fluidic actuators with high activity and expand the potential applications of CC technology.

1. Introduction

Circulation control (CC) is a widely known method of augmenting the lift on a wing [1,2]. CC, as a high-lift device, was first studied in the late 1930s [3]. Later, a CC airfoil concept based on the Coanda effect was patented by Davidson in 1962 [4]. Generally, the airfoil is equipped with span-wise dual blowing slots that emit a high-momentum jet tangentially along a curved trailing edge [5,6,7]. Control of airfoil circulation (lift), both positive and negative, can be achieved by individually controlling the blowing from the upper and lower slots on the trailing edge, similar to the control surfaces of conventional aircrafts (e.g., ailerons or flaps) [8].
Previously, Englar [9] and Englar and Huson [10] suggested that a CC wing (CCW) could significantly enhance the lift. Recently, CC has been studied as an alternative control method for flapless aircrafts [11,12]. This new technology can decrease the signature by reducing the traditional moving control surfaces, which makes it essential in flight control [13,14]. For example, the ICE and SACCON unmanned aerial vehicles of NATO task group AVT-239 were built and flown to demonstrate the effectiveness of this concept [15,16].
Experimental [5,17,18] and numerical investigations [3,19,20] have been conducted in a wide range of studies on the CC mechanism to improve the effectiveness of CC. Wood and Nielsen [21] and Novak and Cornelius [22] indicated that the efficiency of a CC system could be improved by increasing the velocity of the tangentially blown jet. When a high-velocity CC jet passes over the Coanda surface, it can entrain lower-momentum fluid from local external flow near the trailing edge of the airfoil, delaying separation, shifting the stagnation points, increasing the circulation, and augmenting the lift. However, the effectiveness of CC does not increase unlimitedly with increasing momentum coefficient C μ . According to Li and Qin [1] and Cornelius and Lucius [23], the increment in lift will decrease as C μ increases to a certain extent due to CC jet detachment, which is called “ C μ -stall”. CC jet detachment mainly results from an adverse pressure gradient as it moves along the trailing edge circumference.
In addition, previous scholars [24,25] have found that the effectiveness of CC could be strongly influenced by the incoming flow. These researchers demonstrated that CC can enhance the lift at transonic speeds, but it is less effective than at subsonic speeds. Therefore, less attention has been paid to CC in the transonic regime. In the 1980s, researchers mainly focused on the CC of helicopter rotor blade applications at transonic speeds [25,26,27]. Recently, researchers have focused on parametric evaluation [28] and optimization [29] of the CC airfoil to improve the transonic performance. Forster et al. [26] demonstrated the feasibility of RANS with the k ω SST turbulence model for the simulation of CC in the transonic regime. Milholen et al. [30] highlighted the drawbacks of transonic CC when researching the fundamental aerodynamics subsonic/transonic-modular active control (FAST-MAC). The experiments on FAST-MAC conducted in their study were considered unique, as they evaluated CC strategies at transonic speeds. However, the physical mechanism of CC at transonic freestream speeds has rarely been discussed.
The aim of this study was to compare the behaviors of CC in transonic flow to those in subsonic flow to improve understanding of the mechanism of lift enhancement by CC in high-speed flows. The effect of free incoming flow on the effectiveness of CC was studied in detail via a numerical method. Rather than optimizing the geometries and configurations of Coanda devices intuitively to improve the transonic performance, careful attention was paid to identifying the cause of the reduced effectiveness of CC in transonic flow. Our findings provide novel insights into the role of the CC system in transonic freeflow. A favorable shift in the shockwave pattern and accelerated flow in the separation region on the airfoil surface by CC resulted in lift enhancement in transonic flow. These findings may provide a new direction for research into CC technology. However, CC for lift enhancement purposes could not be made to operate on configurations flying at practical (at least transonic) flight speeds. Understanding the inferior performance of CC operating in transonic incoming flow will facilitate the rational design of CC systems for practical applications, although further studies remain necessary.
To achieve the aim of this study, two types of RAE2822 airfoil with CC under the freestream conditions of M a = 0.3 and 0.8 at α = 3 were examined for comparison of the flow phenomenon. The remainder of this paper is organized as follows. Firstly, the numerical methods are elucidated in Section 2 and validated by comparison to CCW experimental data in Section 3. In Section 4, the change in the behavior of the CC jet from subsonic to transonic speeds is examined, including the pressure coefficient distribution on the Coanda surface, wave structure, and entrainment characteristics of the CC jet. Thereafter, the interactions of the CC jet with external flow around the RAE2822 airfoil are analyzed to provide further insight into the mechanism of lift enhancement by CC in transonic flow in Section 5.

2. Numerical Methods

The numerical approach utilized in this study is based on the finite-volume method, in which the computational fluid dynamics (CFD) code provides complete mesh flexibility. The steady and compressible Reynolds averaged Navier–Stokes (RANS) equations were used to predict CC under subsonic and transonic conditions. The gravitational and external body forces were ignored. For spatial discretization, the second-order upwind scheme was utilized to determine the convection, pressure, and viscous terms. The flux type was discretized by Roe-averaged flux difference splitting. The second-order upwind scheme with the min–mod limiter was used to determine the state-variable interpolations on the cell faces. Time integration was performed by using the lower-upper symmetric Gauss–Seidel (LU-SGS) schemes. The working fluid was set to the ideal gas. The viscosity coefficient μ was calculated by Sutherland’s law. The k ω SST turbulence model was that used in [31].

3. Validation of Trailing-Edge CC

The aerodynamic performance of the CCW obtained by using the numerical method was validated by comparison with the experimental data obtained by Alexander et al. in 2005 [24]. The elliptical airfoil of the wing is shown in Figure 1. The camber of the airfoil was 0.75% chord, and the thickness was 6% chord. The trailing edge of the airfoil was modified as a 2.98:1 elliptical Coanda surface with a slot height to chord ratio of 0.12%. The experimental model configuration is shown in Figure 2a. The span of the wing model is two chord lengths, with an end plate of one chord length in diameter to minimize the finite span effect. The diameter of the end plate was enlarged to 1.1 chord lengths in this study to enable the structured blocks to wrap around the leading edge of the airfoil. The geometric model difference can be ignored, as confirmed by the CFD validation study of Forster and Steijl [26]. A circular splitter plate with a diameter of six chord lengths was included in the configuration to ensure more accurate solutions, because similar studies [26,32] of the CCW configuration suggested that modeling of the viscous wall of the splitter plate was necessary for more accurate solutions.
A grid refinement study was performed based on the results obtained by Li and Qin [1] and Forster et al. [29]. The baseline grid setting involved 221 cells on the airfoil, as shown in Figure 2b, 121 cells on the Coanda surface, 149 cells in the wall-normal direction, and 221 cells over the span of the airfoil [1]. Accordingly, the medium grid and fine grid were, respectively, 1.5 and 2 times the number of baseline grids. The numbers of fine grids for the models without and with blowing were approximately 23 × 10 6 and 24 × 10 6 , respectively. The distance of the first grid point near the wall in all computational cases was held constant to maintain y + O ( 1 ) .
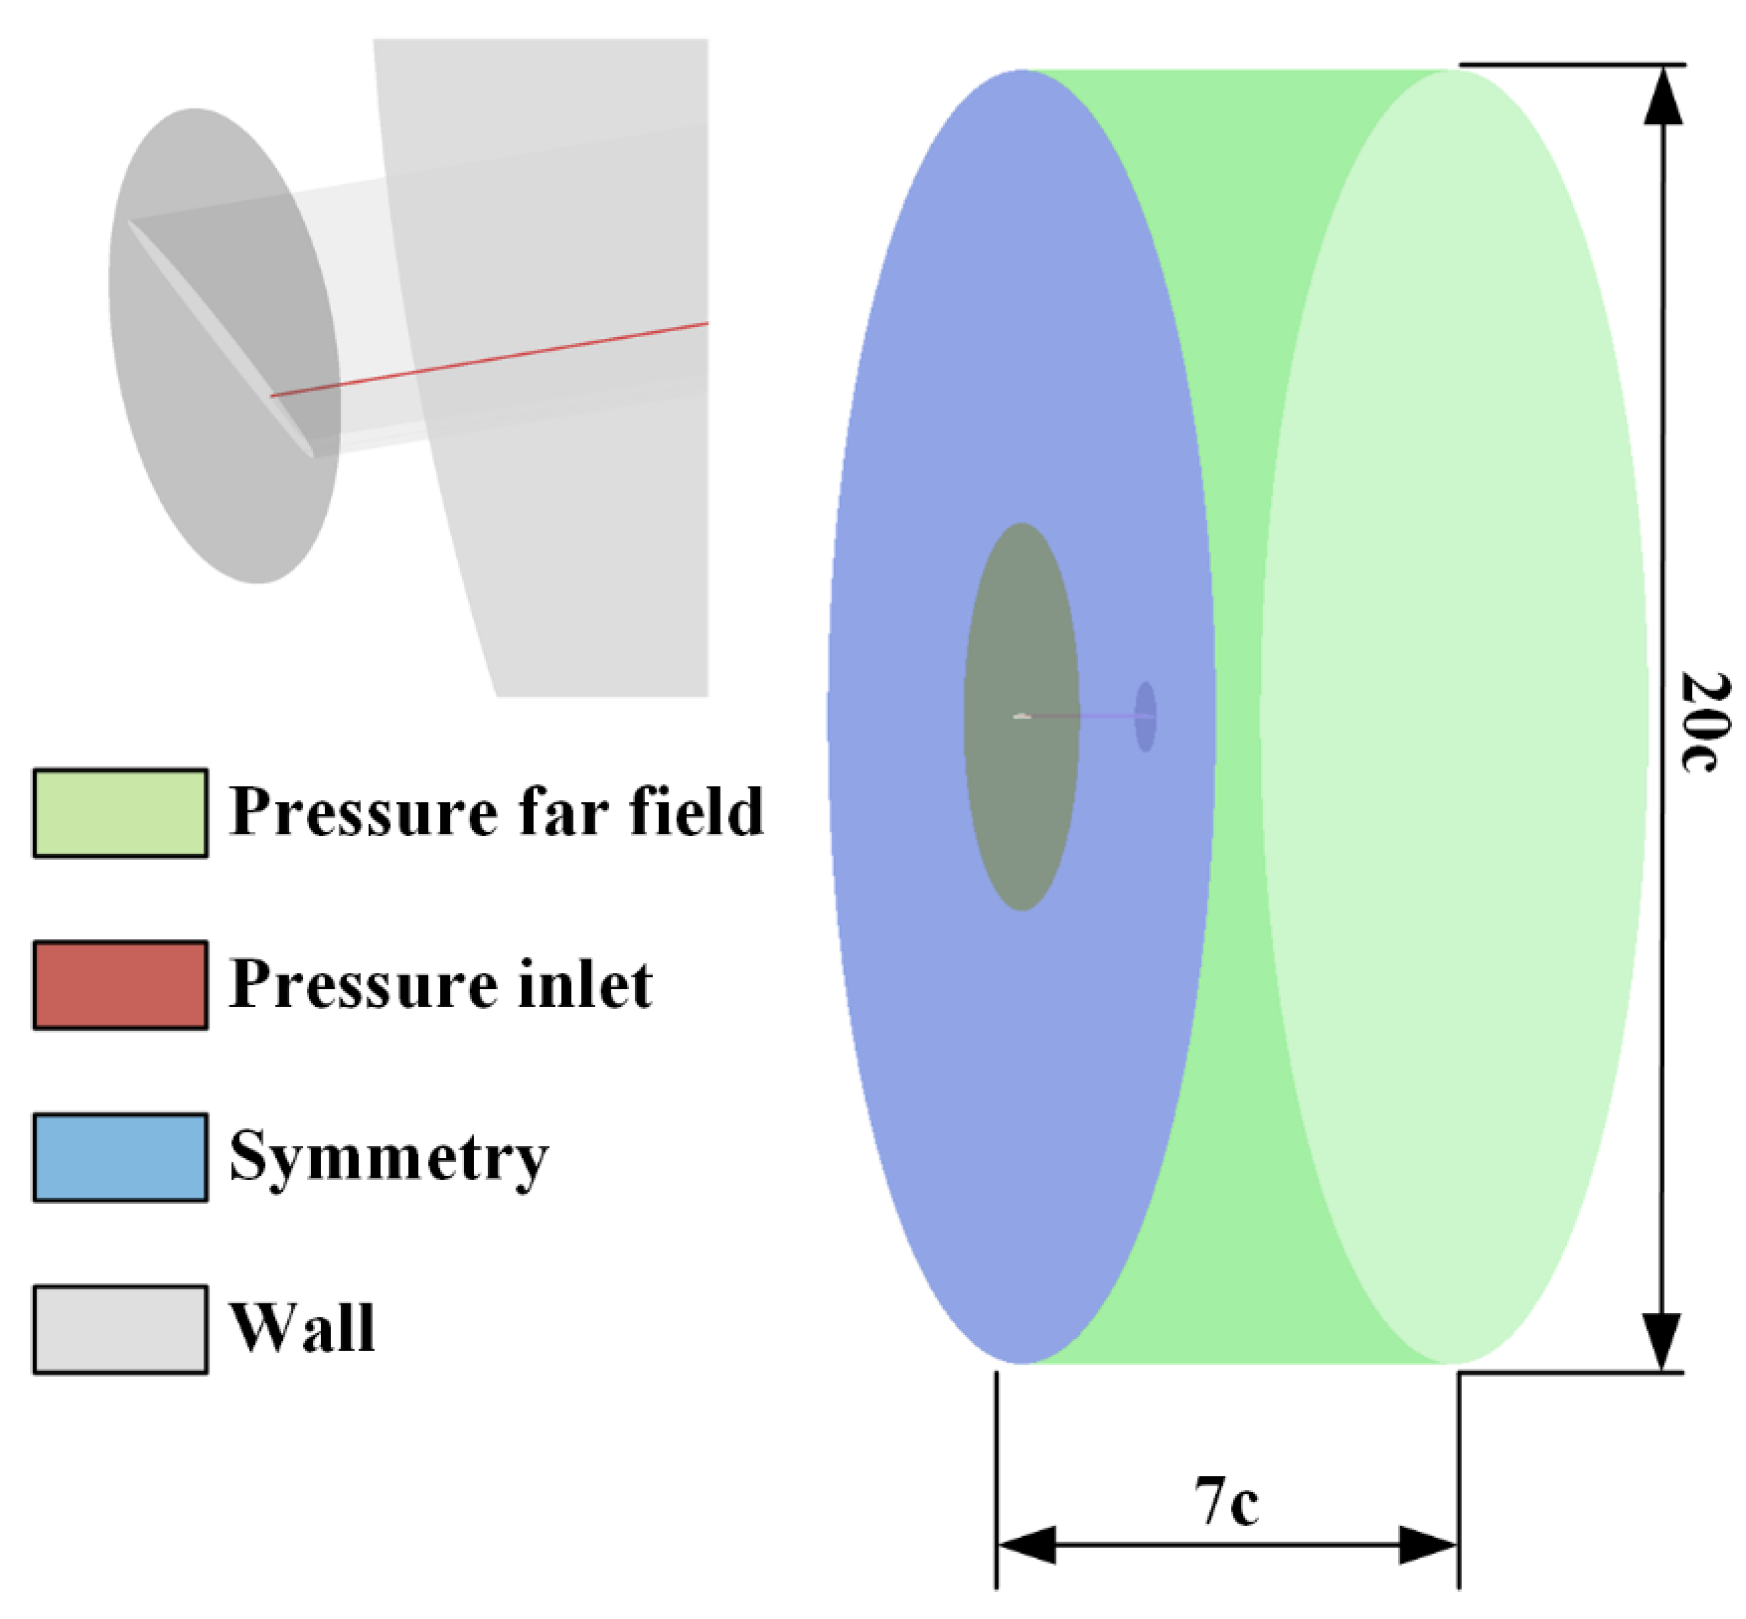
The computational domain was surrounded by four types of boundary conditions: viscous walls, pressure far field, symmetry, and pressure inlet conditions, as shown in Figure 3. The cylindrical pressure far-field surface was located 10 chord lengths away from the center of the airfoil in the radial direction and 7 chord lengths from the splitter plate in the span-wise direction. The subsonic freestream flow conditions were set to M a = 0.3 , α = 3 , and R e c = 1.0 × 10 6 , and the transonic freestream flow conditions were set to M a = 0.8 , α = 3 , and R e c = 2.0 × 10 6 . The Reynolds number based on the freestream flow velocity U and chord lengths c of the modified airfoil was expressed as R e = ρ U c / μ .
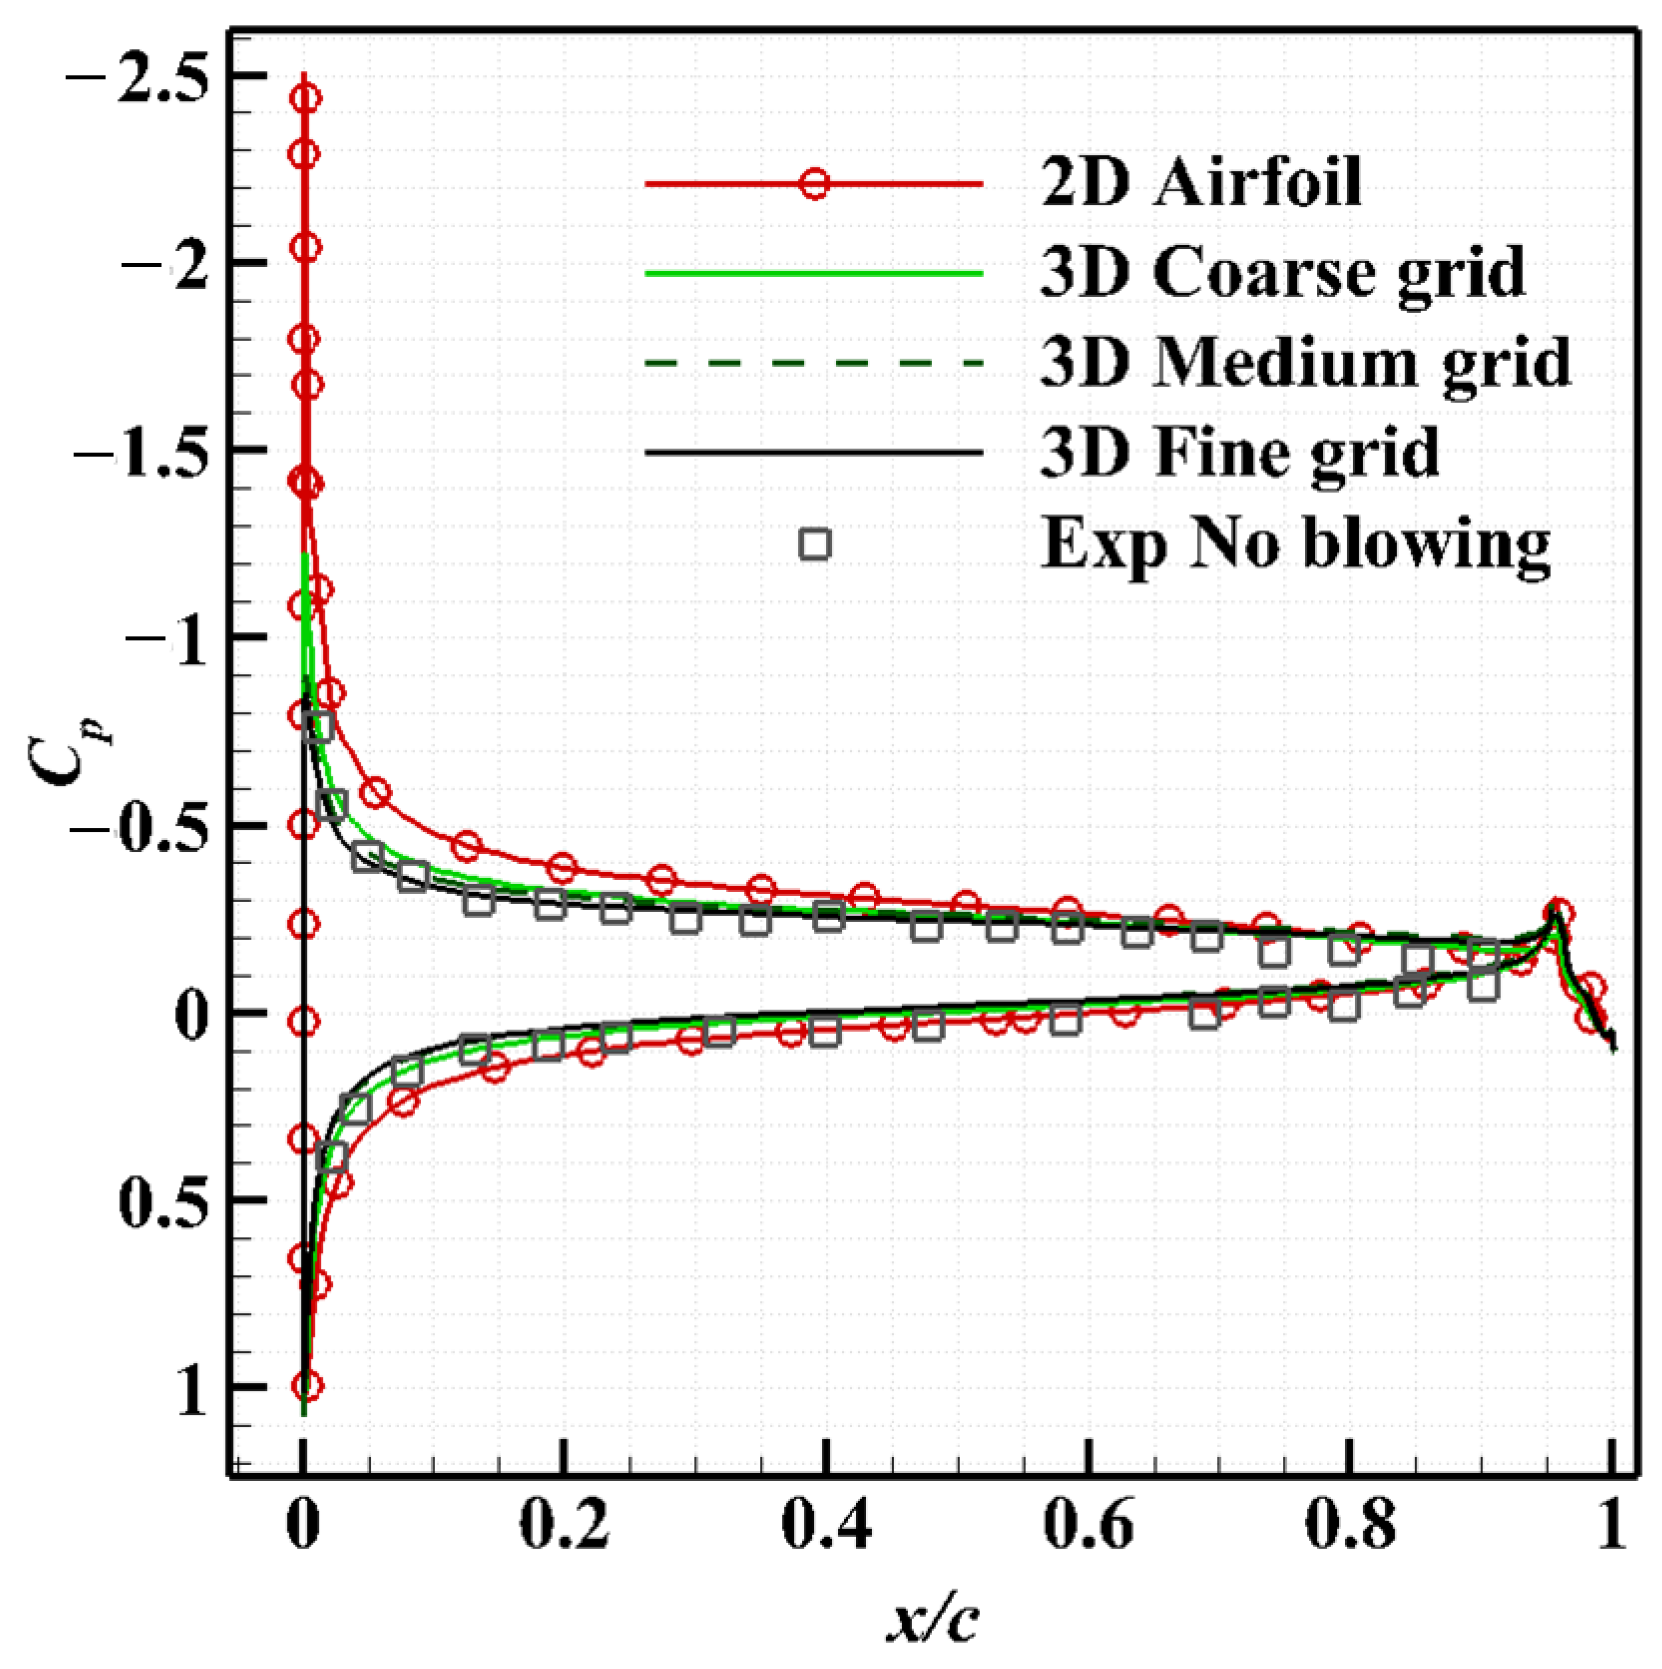
The experimental and computational results for the surface pressure coefficients of the midspan wing section at M a = 0.3 without blowing are compared in Figure 4. The three grid sets for the 3D model agree well with the experimental data. In addition, the medium and fine meshes coincide well with each other. Although the computational results for the leading edge of the coarse mesh are slightly higher than those for the other two mesh resolutions, the differences in the mesh influence could be neglected. Because the current numerical and coarse grid settings could effectively simulate the flow around the CCW model, the coarse grid scheme was selected for subsequent analysis and comparison, resulting in only a slight decrease in computational accuracy. The computational results of the 2D airfoil are also shown in Figure 4. The value of static pressure coefficient C p of the 2D airfoil shows large discrepancies from the experimental data, indicating that the tunnel wall boundary conditions significantly affect the leading-edge surface pressure distribution. The 3D effects of the wing model are also reported along with the computational [1] and experimental results [5].
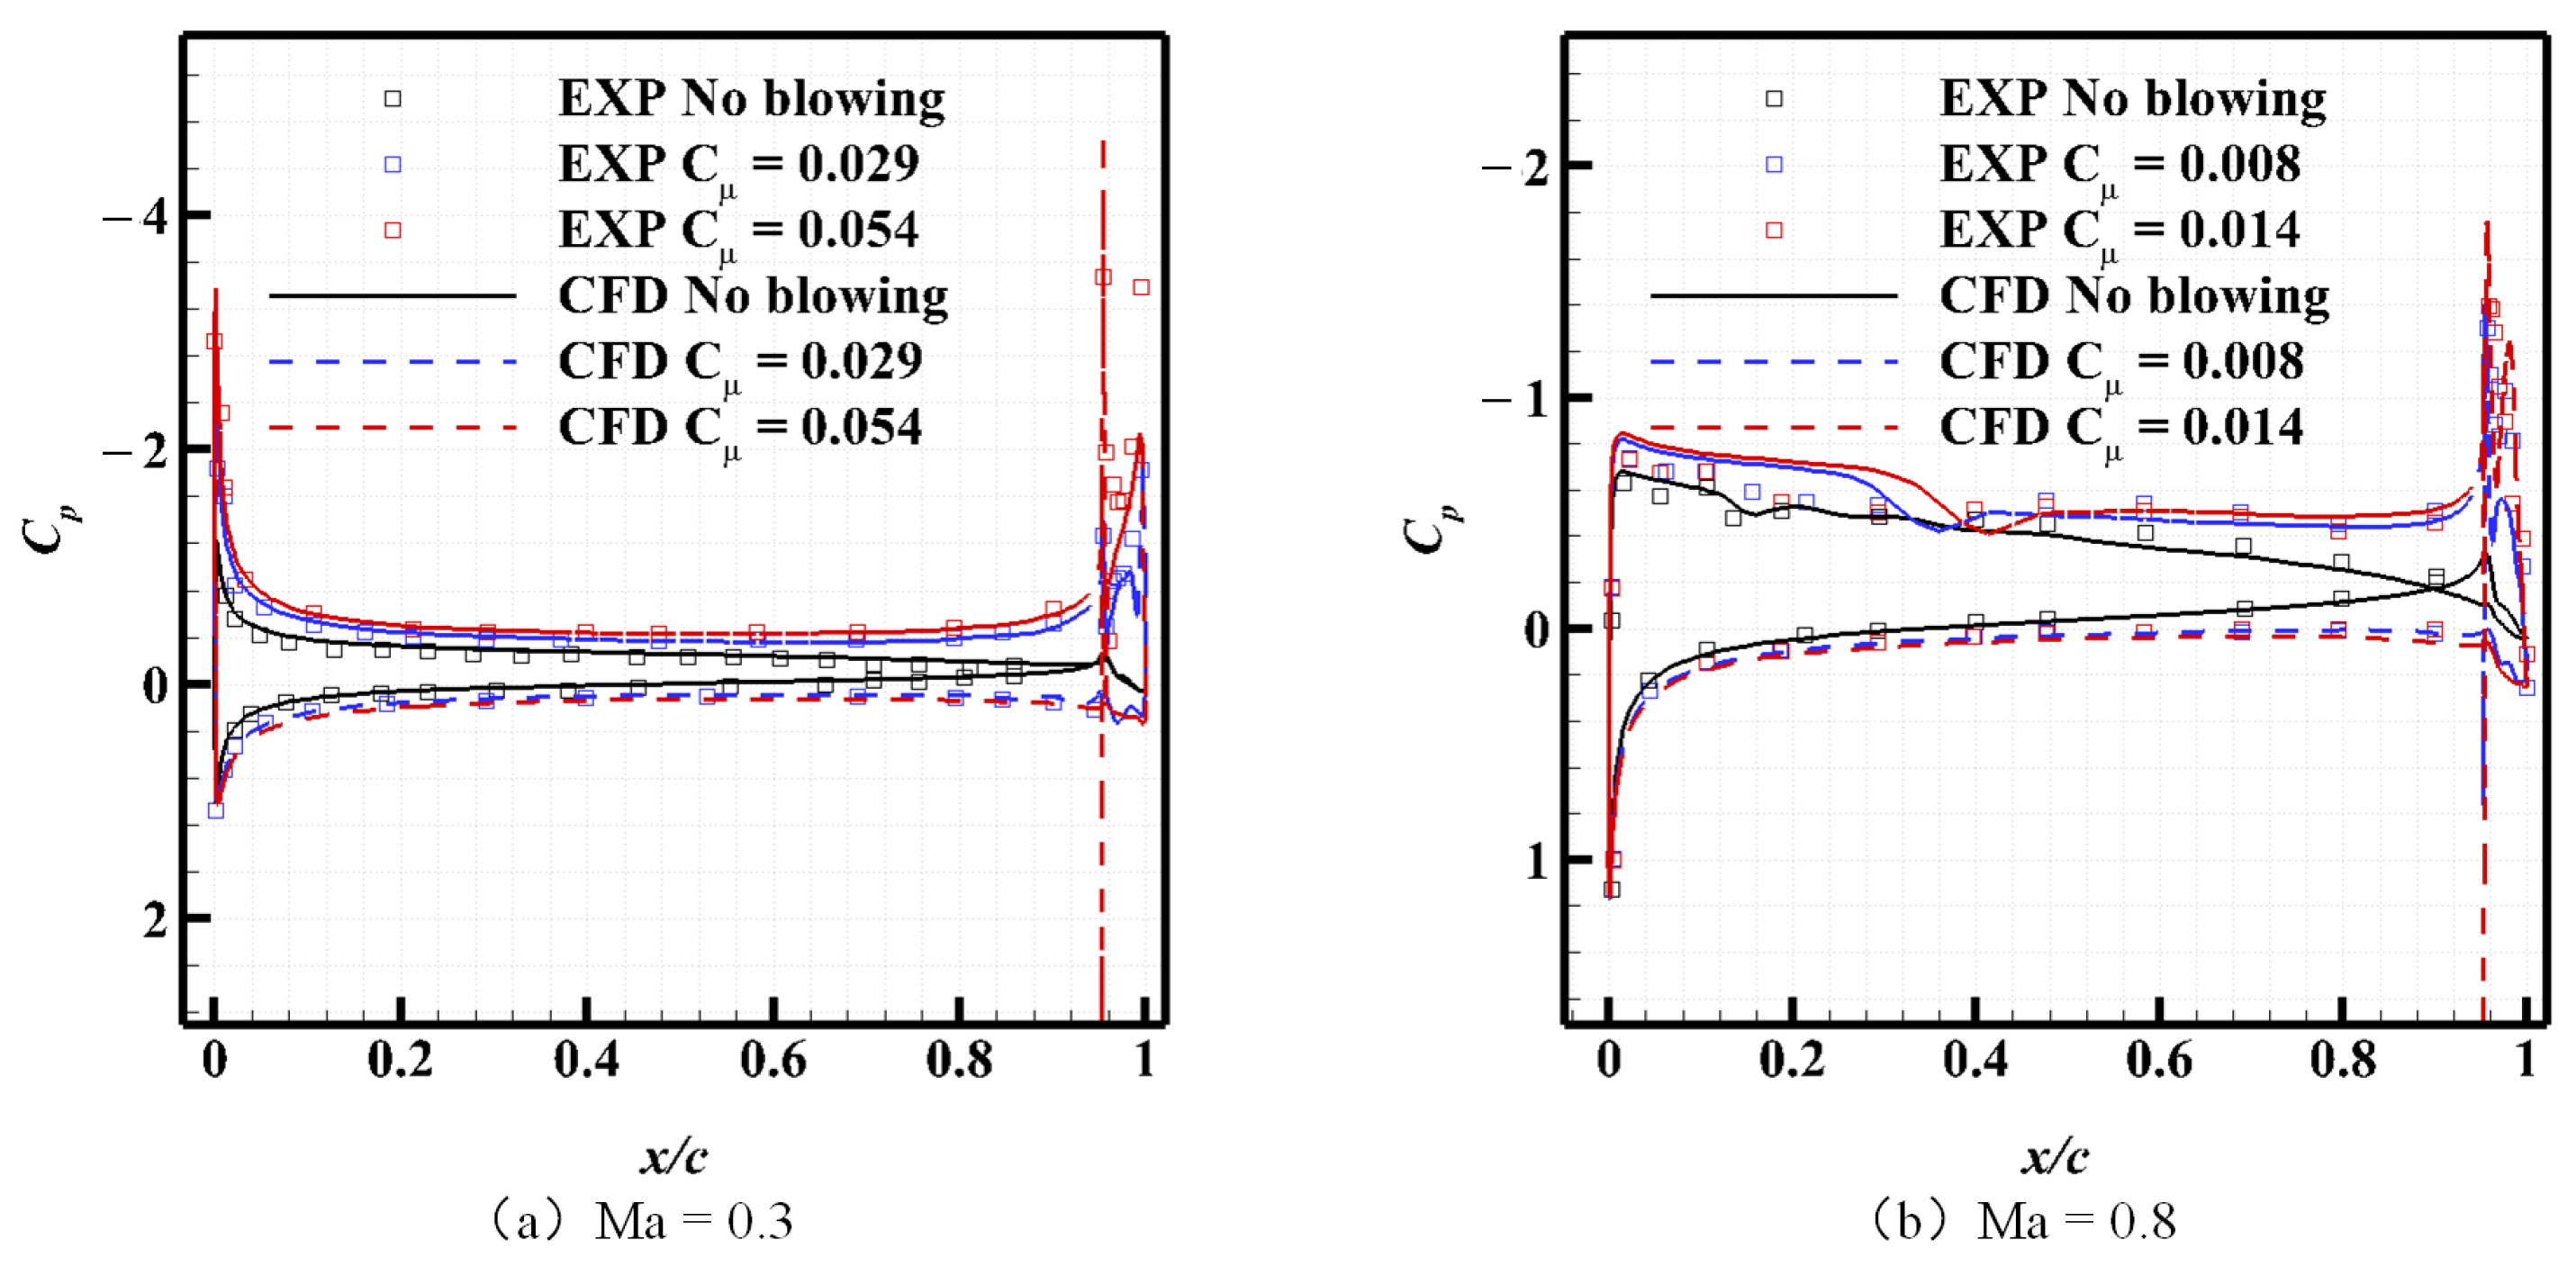
The experimental [24] and computational results for C p on the midspan wing section in the case of upper slot blowing are compared in Figure 5. For M a = 0.3 (Figure 5a), there is satisfactory agreement between the measured and CFD results. The cases without blowing and with momentum coefficient C μ 0.029 agree well with the experimental results. There are subtle differences between the CFD and experimental results on the Coanda surface at high C μ 0.054 , but the results correctly capture the peak pressure at the leading edge of the airfoil. The differences may have resulted from the complex fluid phenomena (e.g., SBLI [26]) occurring on the Coanda surface at high C μ , which cannot be captured well by the coarse grid. C μ is defined as Equation (1):
C μ = m ˙ U jet q A ,
where m ˙ is the mass flow rate through the slot exit; A is the wing surface area; q is the freestream dynamic pressure. Based on the assumption [1] that the jet flow expands out of the slot isentropically to reach the freestream static pressure p , we can obtain the jet velocity U jet from Equation (2):
U jet = 2 γ γ 1 R T 0 1 p p 0 , plenum γ 1 γ ,
where p 0 , plenum is the total plenum pressure and T 0 is the total temperature at the pressure inlet; γ is the specific heats ratio.
For M a = 0.8 , the pressure coefficients in the cases of no blowing and upper slot blowing for C μ 0.008 and C μ 0.014 were compared with the experimental data, as shown in Figure 5b. The results indicate a systematic error between the CFD and the experimental results. The pressure coefficients on the leading edge of the upper airfoil surface are over-predicted by the present numerical methods for the cases with and without blowing. This systemic error was also observed by Foster and Steijl [26] and Li and Qin [1] while studying the numerical pressure coefficients of transonic CC. No clear cause of the systemic error was determined, but the present numerical method is considered to capture the pressure coefficients with the relevant flow physics. It is believed that the present numerical method can provide the pressure coefficients with reasonable accuracy.
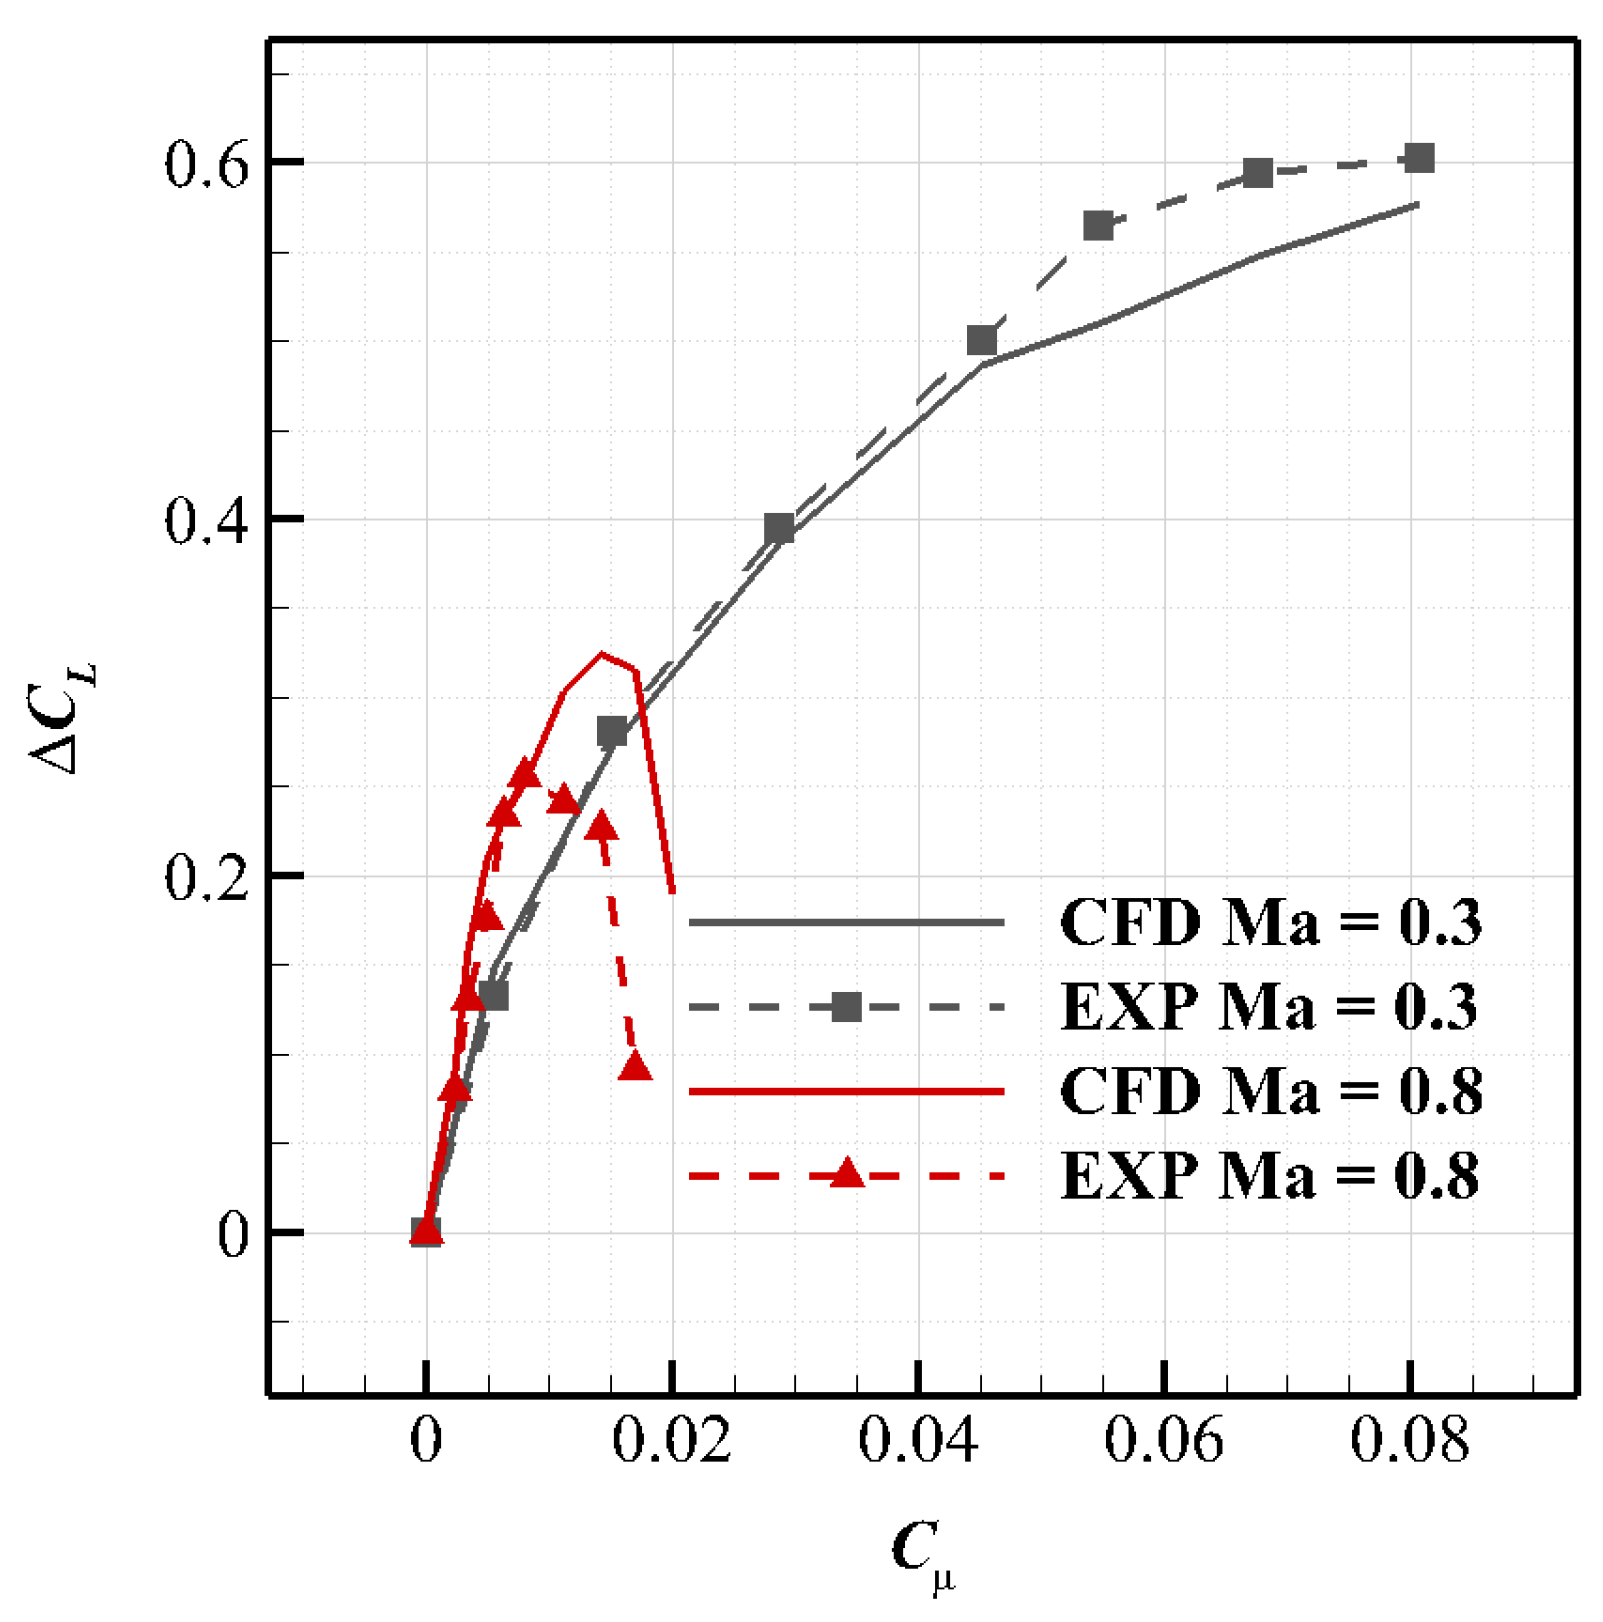
Figure 6 compares the changes in the lift coefficient with increasing momentum coefficient between the experimental data and the present CFD results. For both Mach numbers, the trend of lift augmentation with increasing C μ is captured by the numerical method, which indicates that the numerical results can reveal the flow physics of CC in the subsonic and transonic regimes. However, in the high C μ range, the CFD approach over-predicted the lift augmentation in the transonic regime, but underestimated the value in the subsonic regime. Similar results were presented in [1,29], and the precise reasons were complex and inconclusive. In general, the comparisons show satisfactory agreement between the experimental data and CFD results for the aerodynamic performance of CCW in the subsonic and transonic regimes over a wide range of Coanda jet blowing, which indicates that the method can achieve acceptable numerical accuracy.

4. Flow Physics of CC Jet in Transonic and Subsonic Incoming Flows

4.1. Numerical Model Setup of the RAE2822 Airfoil with CC

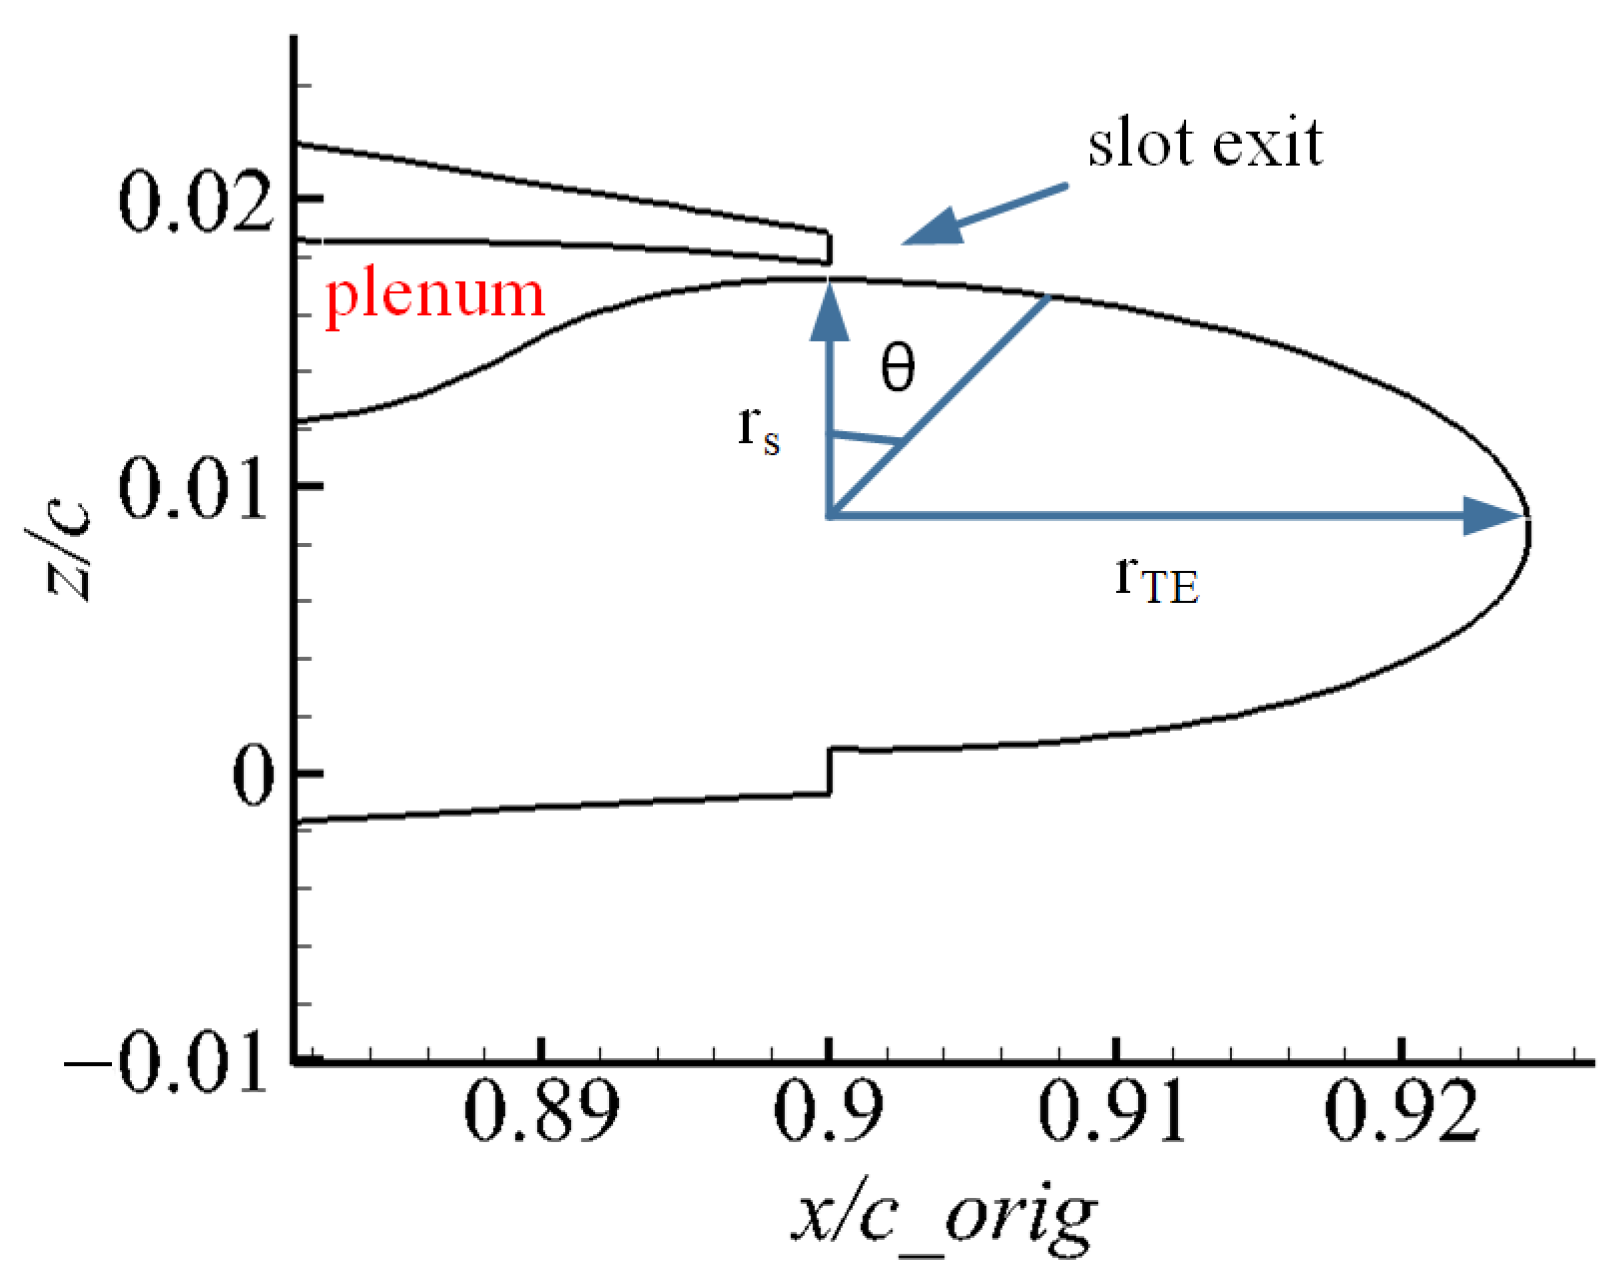
The RAE2822 airfoil was used here to investigate the mechanism of the reduced CC capability at transonic speed. The airfoil was truncated at x / c o r i g = 0.943 to include a trailing-edge Coanda surface. c o r i g denotes the chord length of the airfoil before truncation. Figure 7 shows the trailing edge of the modified airfoil. In this study, the parameters of the Coanda surface were chosen based on the geometry of the trailing edge illustrated in Section 3. The elliptical trailing edge with a length r T E to height r s ratio of 2.98:1 was added to the airfoil, θ is the Coanda surface termination angle and a slot height to chord ratio of 0.05% was selected (as illustrated in Figure 8).
The boundary conditions are the same as in the CCW case in Section 3. The total pressure of the plenum inlet flow p 0 , p l e n u m was determined based on the static pressure of the freestream p and the nozzle pressure ratio (NPR): p 0 , p l e n u m = p × N P R . The total temperature T 0 of the nozzle inlet flow was 300 K. In this study, the NPR was fixed, and the C μ was calculated a posteriori by integrating the solution along the slot exit. The NPR and corresponding C μ values are listed in Table 1. The freestream speeds were obtained at M a = 0.3 , α = 3 , R e c = 1.0 × 10 6 and M a = 0.8 , α = 3 , R e c = 2.0 × 10 6 . The freestream temperature T was 300 K. The turbulence intensity of the freestream was set to 5 % , and the turbulent viscosity ratio was 10. The no-slip wall boundary condition was applied to the airfoil surface, Coanda surface, and plenum surfaces.
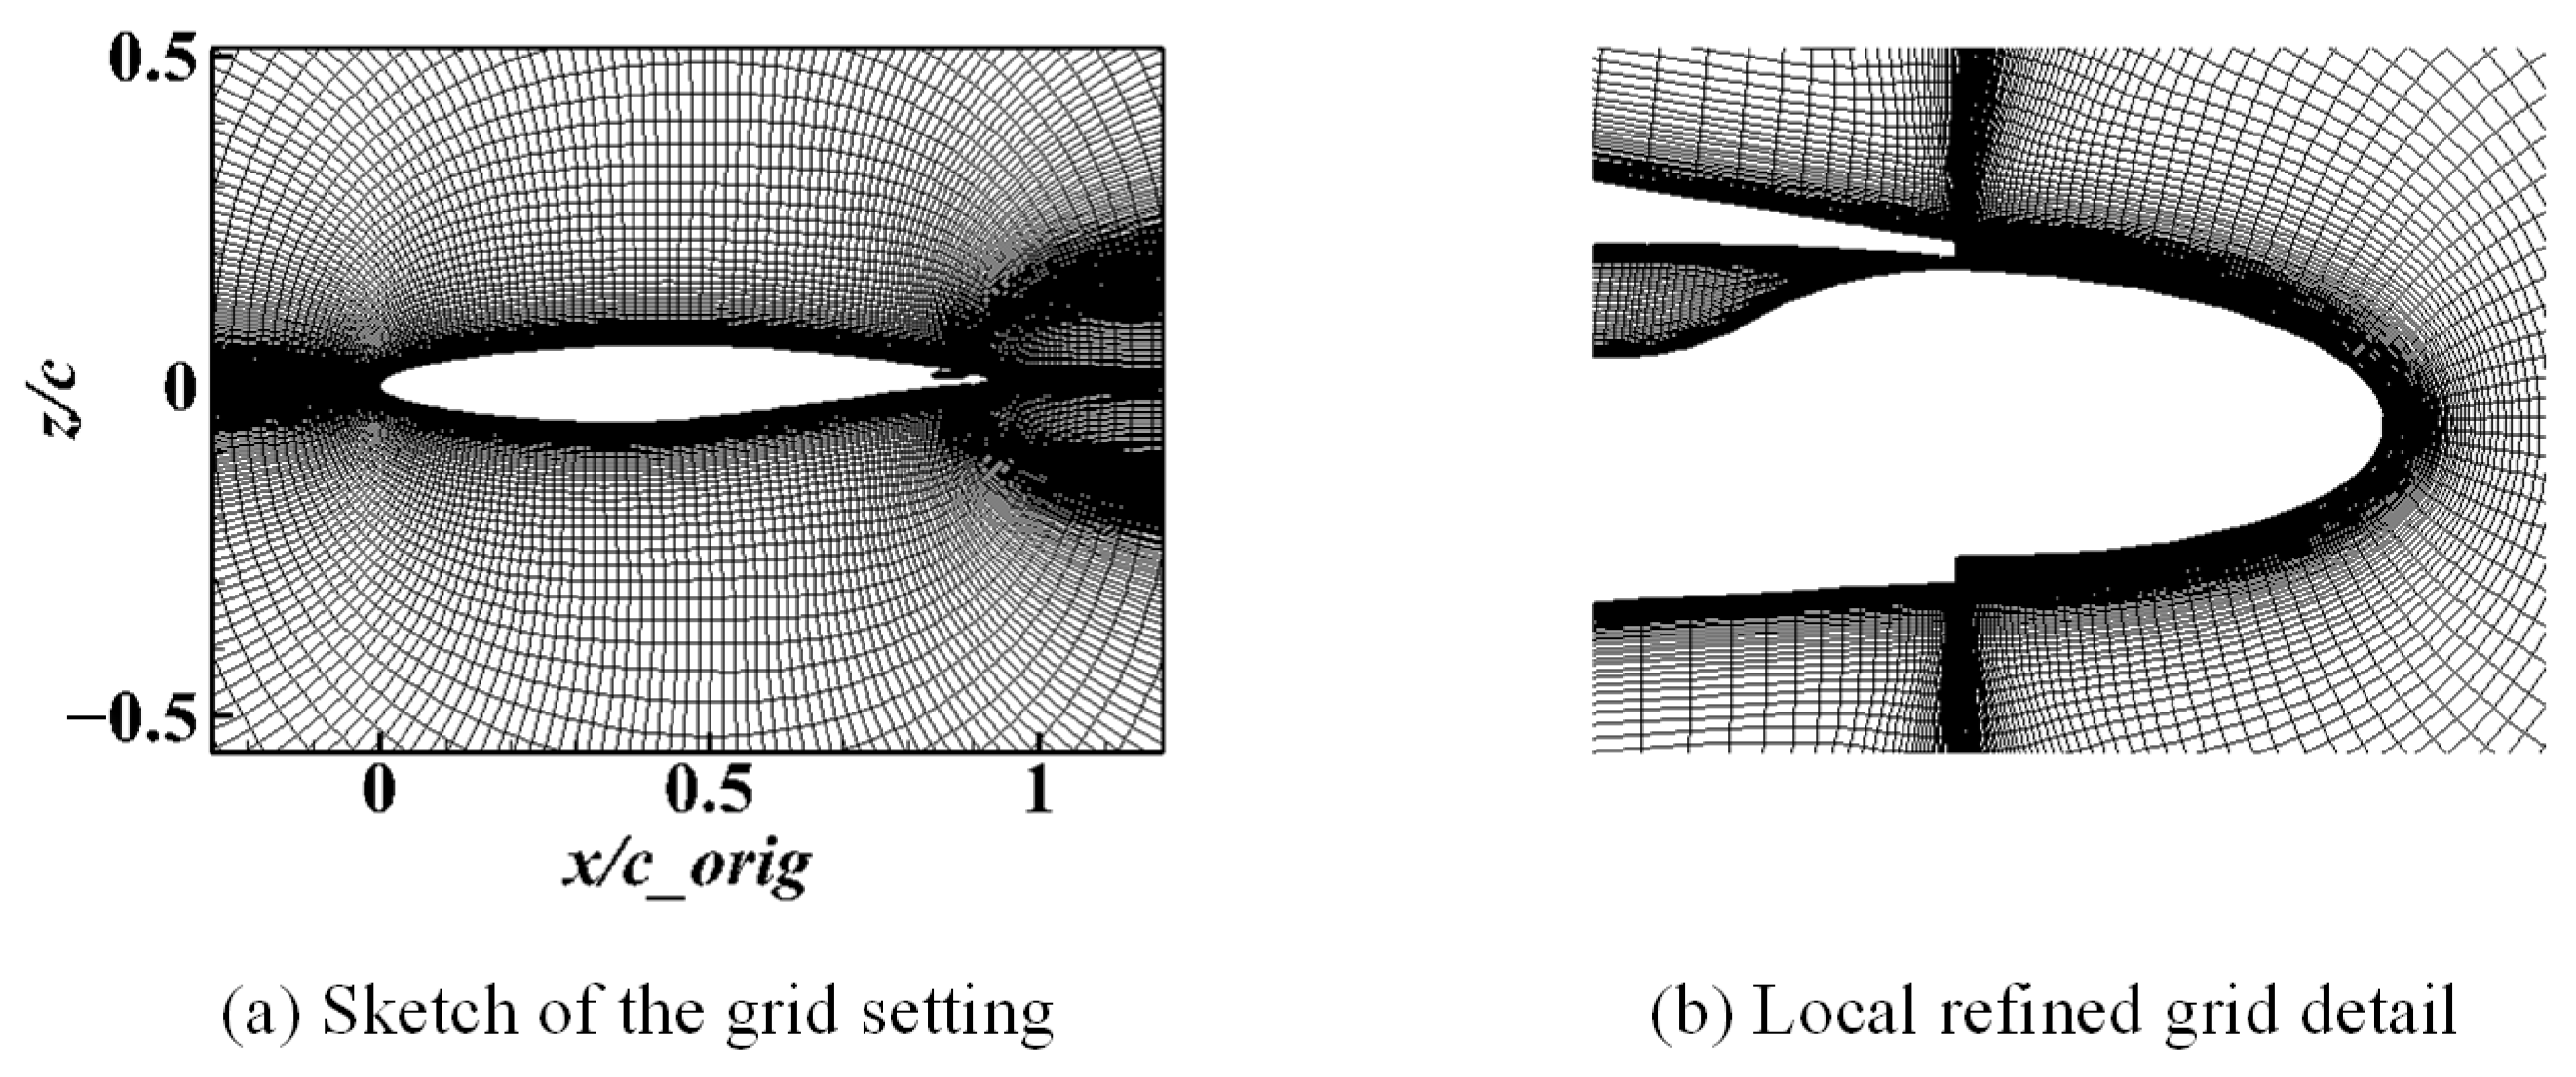
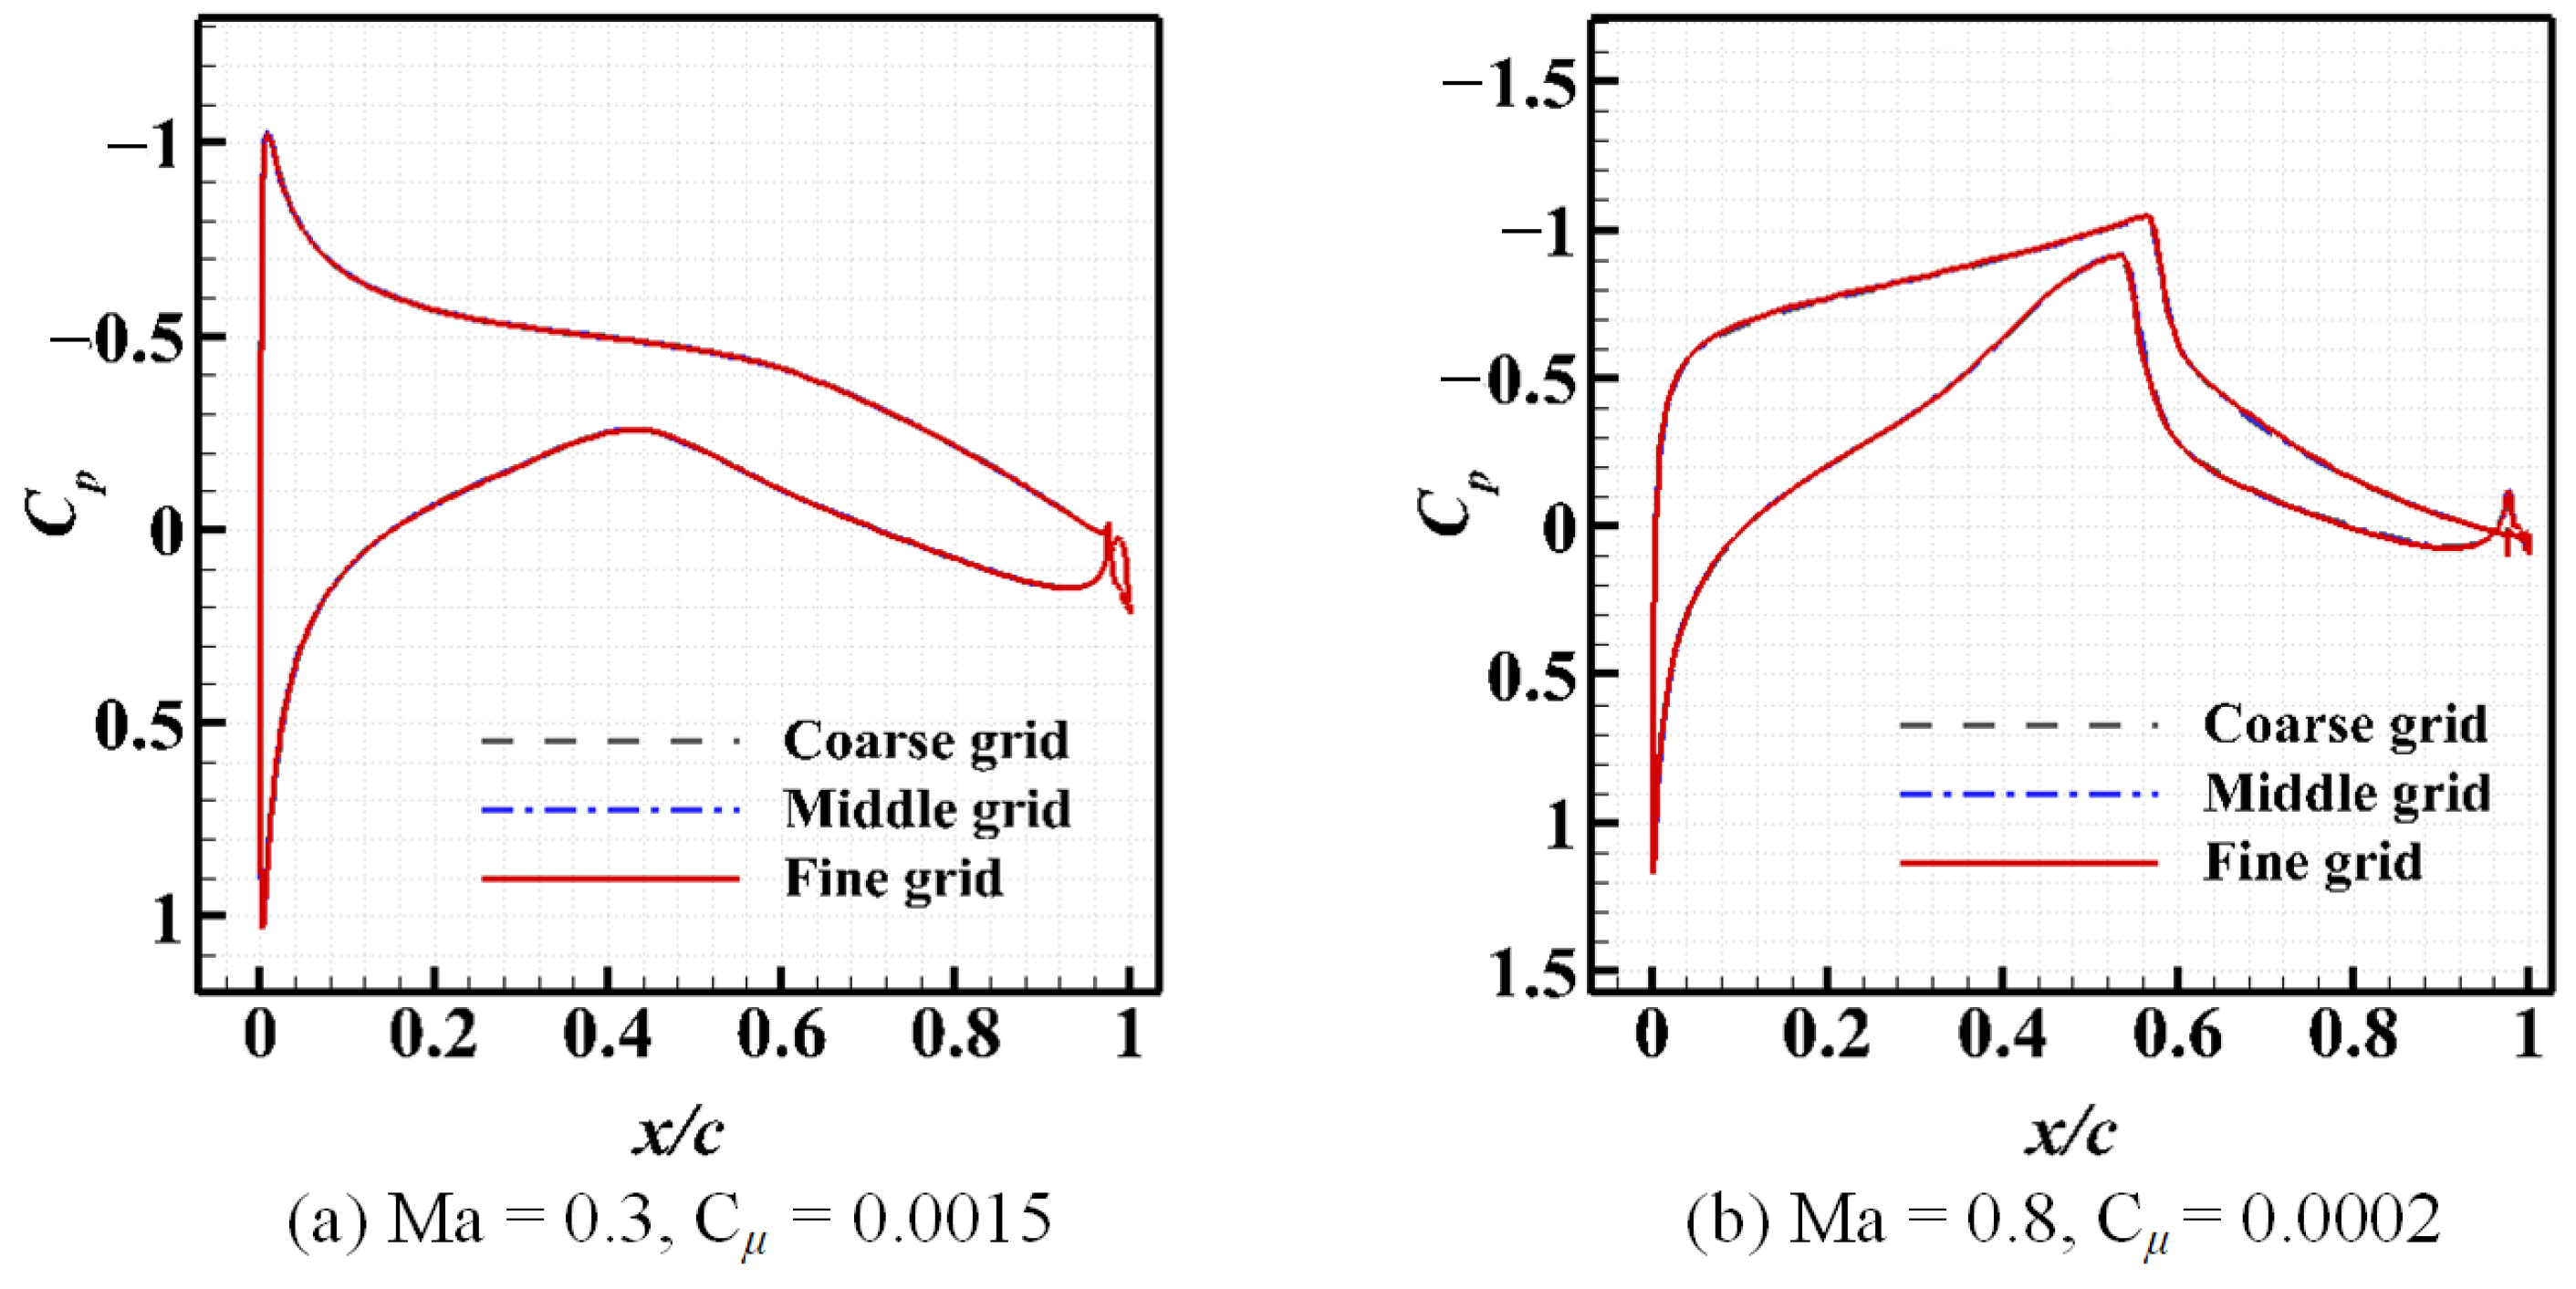
Grid independence analysis was conducted based on the node distributions of the wing with elliptic airfoil in Section 3; the number of grid points was 7.3 × 10 4 (coarse), 10.9 × 10 4 (medium), and 14.6 × 10 4 (fine). During the refinement, the distance of the first grid point from a solid wall was held constant to maintain y + O ( 1 ) . The computational mesh is shown in Figure 9. The pressure distributions on the airfoil surface for the different grids at M a = 0.3 and M a = 0.8 with the blowing momentum coefficients of 0.0015 and 0.0002, respectively, are presented in Figure 10. The results demonstrate that the grid has little influence on the cases of subsonic flow and transonic flow. Because the interaction of the CC jet with the external flow near the trailing edge is very complex, the fine grid scheme was selected for the subsequent analysis to capture the flow characteristics.
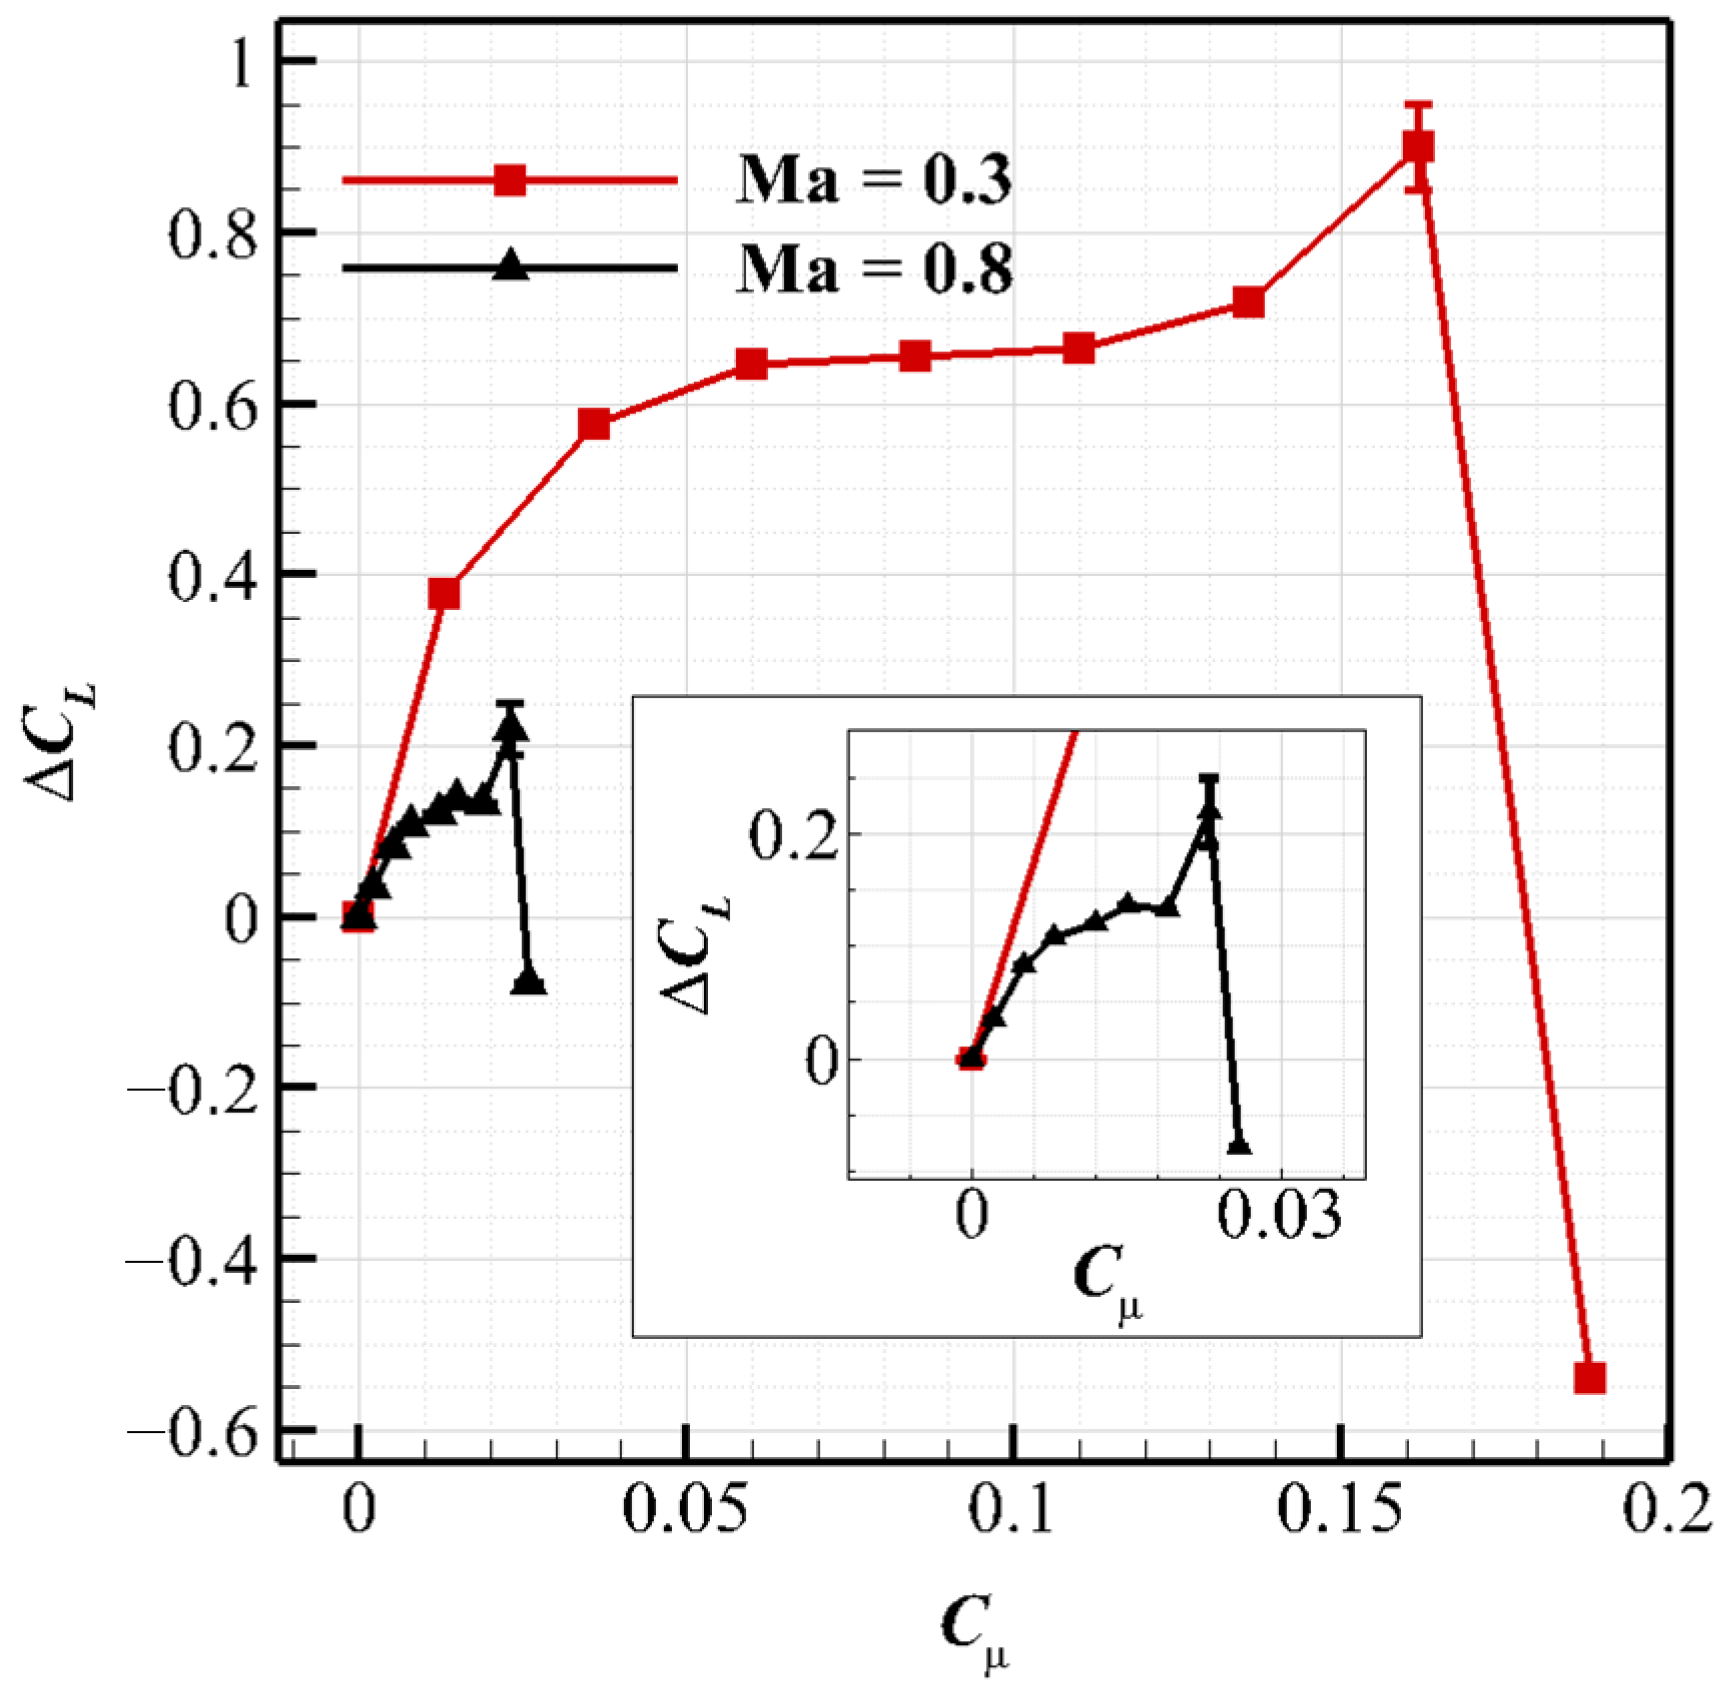
We examined the load control effects of CC for the RAE2822 airfoil under the freestream conditions of M a = 0.3 and 0.8 at α = 3 . The lift coefficient augmentation under a range of blowing momentum coefficients is shown in Figure 11. The maximum augmentation in the lift coefficient reaches 0.89 at M a = 0.3 , whereas this value is only 0.21 when the freestream conditions are M a = 0.8 . The load control capability of CC at transonic speeds is much lower than that at subsonic speeds, which was also observed by Alexander et al. [24].
Furthermore, the effectiveness of CC is limited under both incoming flow conditions. The augmentation of the lift coefficient increases to the maximum value and starts to oscillate, then decreases dramatically, which indicates the occurrence of “ C μ -stall”. Figure 11 also shows the standard deviation in the case of oscillations. The “ C μ -stall” point occurs at approximately C μ = 0.1619 and 0.0228 for M a = 0.3 and 0.8, respectively. In summary, the load control capability of CC is limited under both sets of incoming flow conditions, and the effectiveness of CC at transonic speeds is very low when compared with that at subsonic speeds.

4.2. CC Jet Behaviors at M a = 0.3 and 0.8

The reduced CC capacity under transonic speeds may be attributed to the effect of the local external flow on the CC jet behavior. A previous report [23] noted that the external flow adjacent to the shear layer of the CC jet reduced the local static pressure p, effectively increasing the nozzle pressure ratio and promoting the expansion of the CC jet, and ultimately altering the CC jet flow behavior. To quantify the effect of the local external flow on the CC jet behavior, we define the effective nozzle pressure ratio as N P R e = p 0 , p l e n u m / p , which is the ratio of the total pressure in the plenum to the local static pressure. Because N P R e = p 0 , p l u n e m / p × p / p = N P R × p / p , the amplification coefficient ε was used as a measure of the effect of the local external flow on the CC jet expansion, which is defined as Equation (3):
ε = p p .
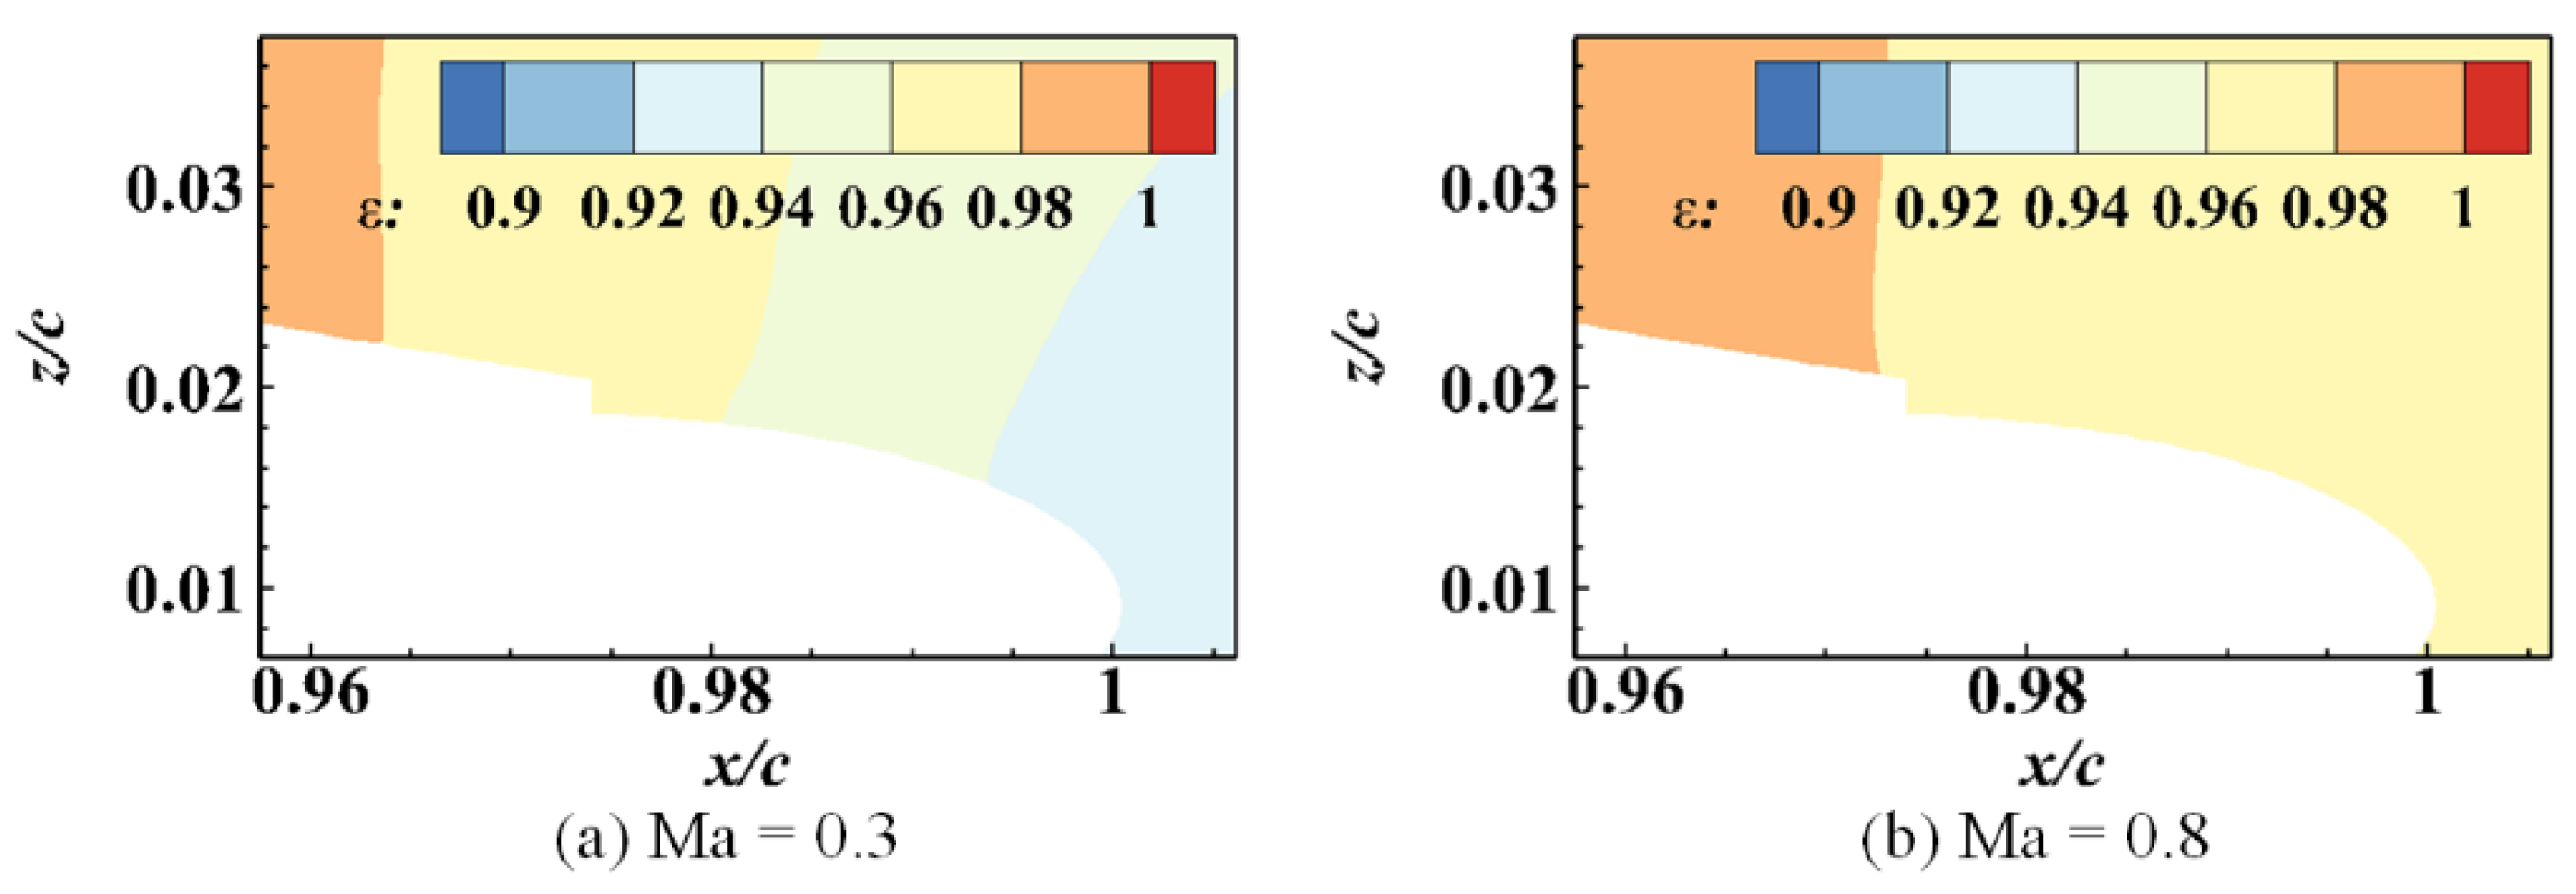
Here, the amplification effect of the external flow at the trailing edge is discussed and compared for the two cases of incoming flow. The freestream condition is M a = 0.3 and M a = 0.8 at α = 3 . The ε contours of the baseline case are presented in Figure 12. The ε range is 0.92–0.98 for M a = 0.3 and 0.96–0.98 for M a = 0.8 . The pressure recovers to a value slightly above at the trailing edge for both Mach numbers owing to skin friction drag and flow separation. There is only a slight difference in the amplification effect between these two incoming flows. Consequently, the effect of the local external flow on the CC jet behavior is almost negligible.
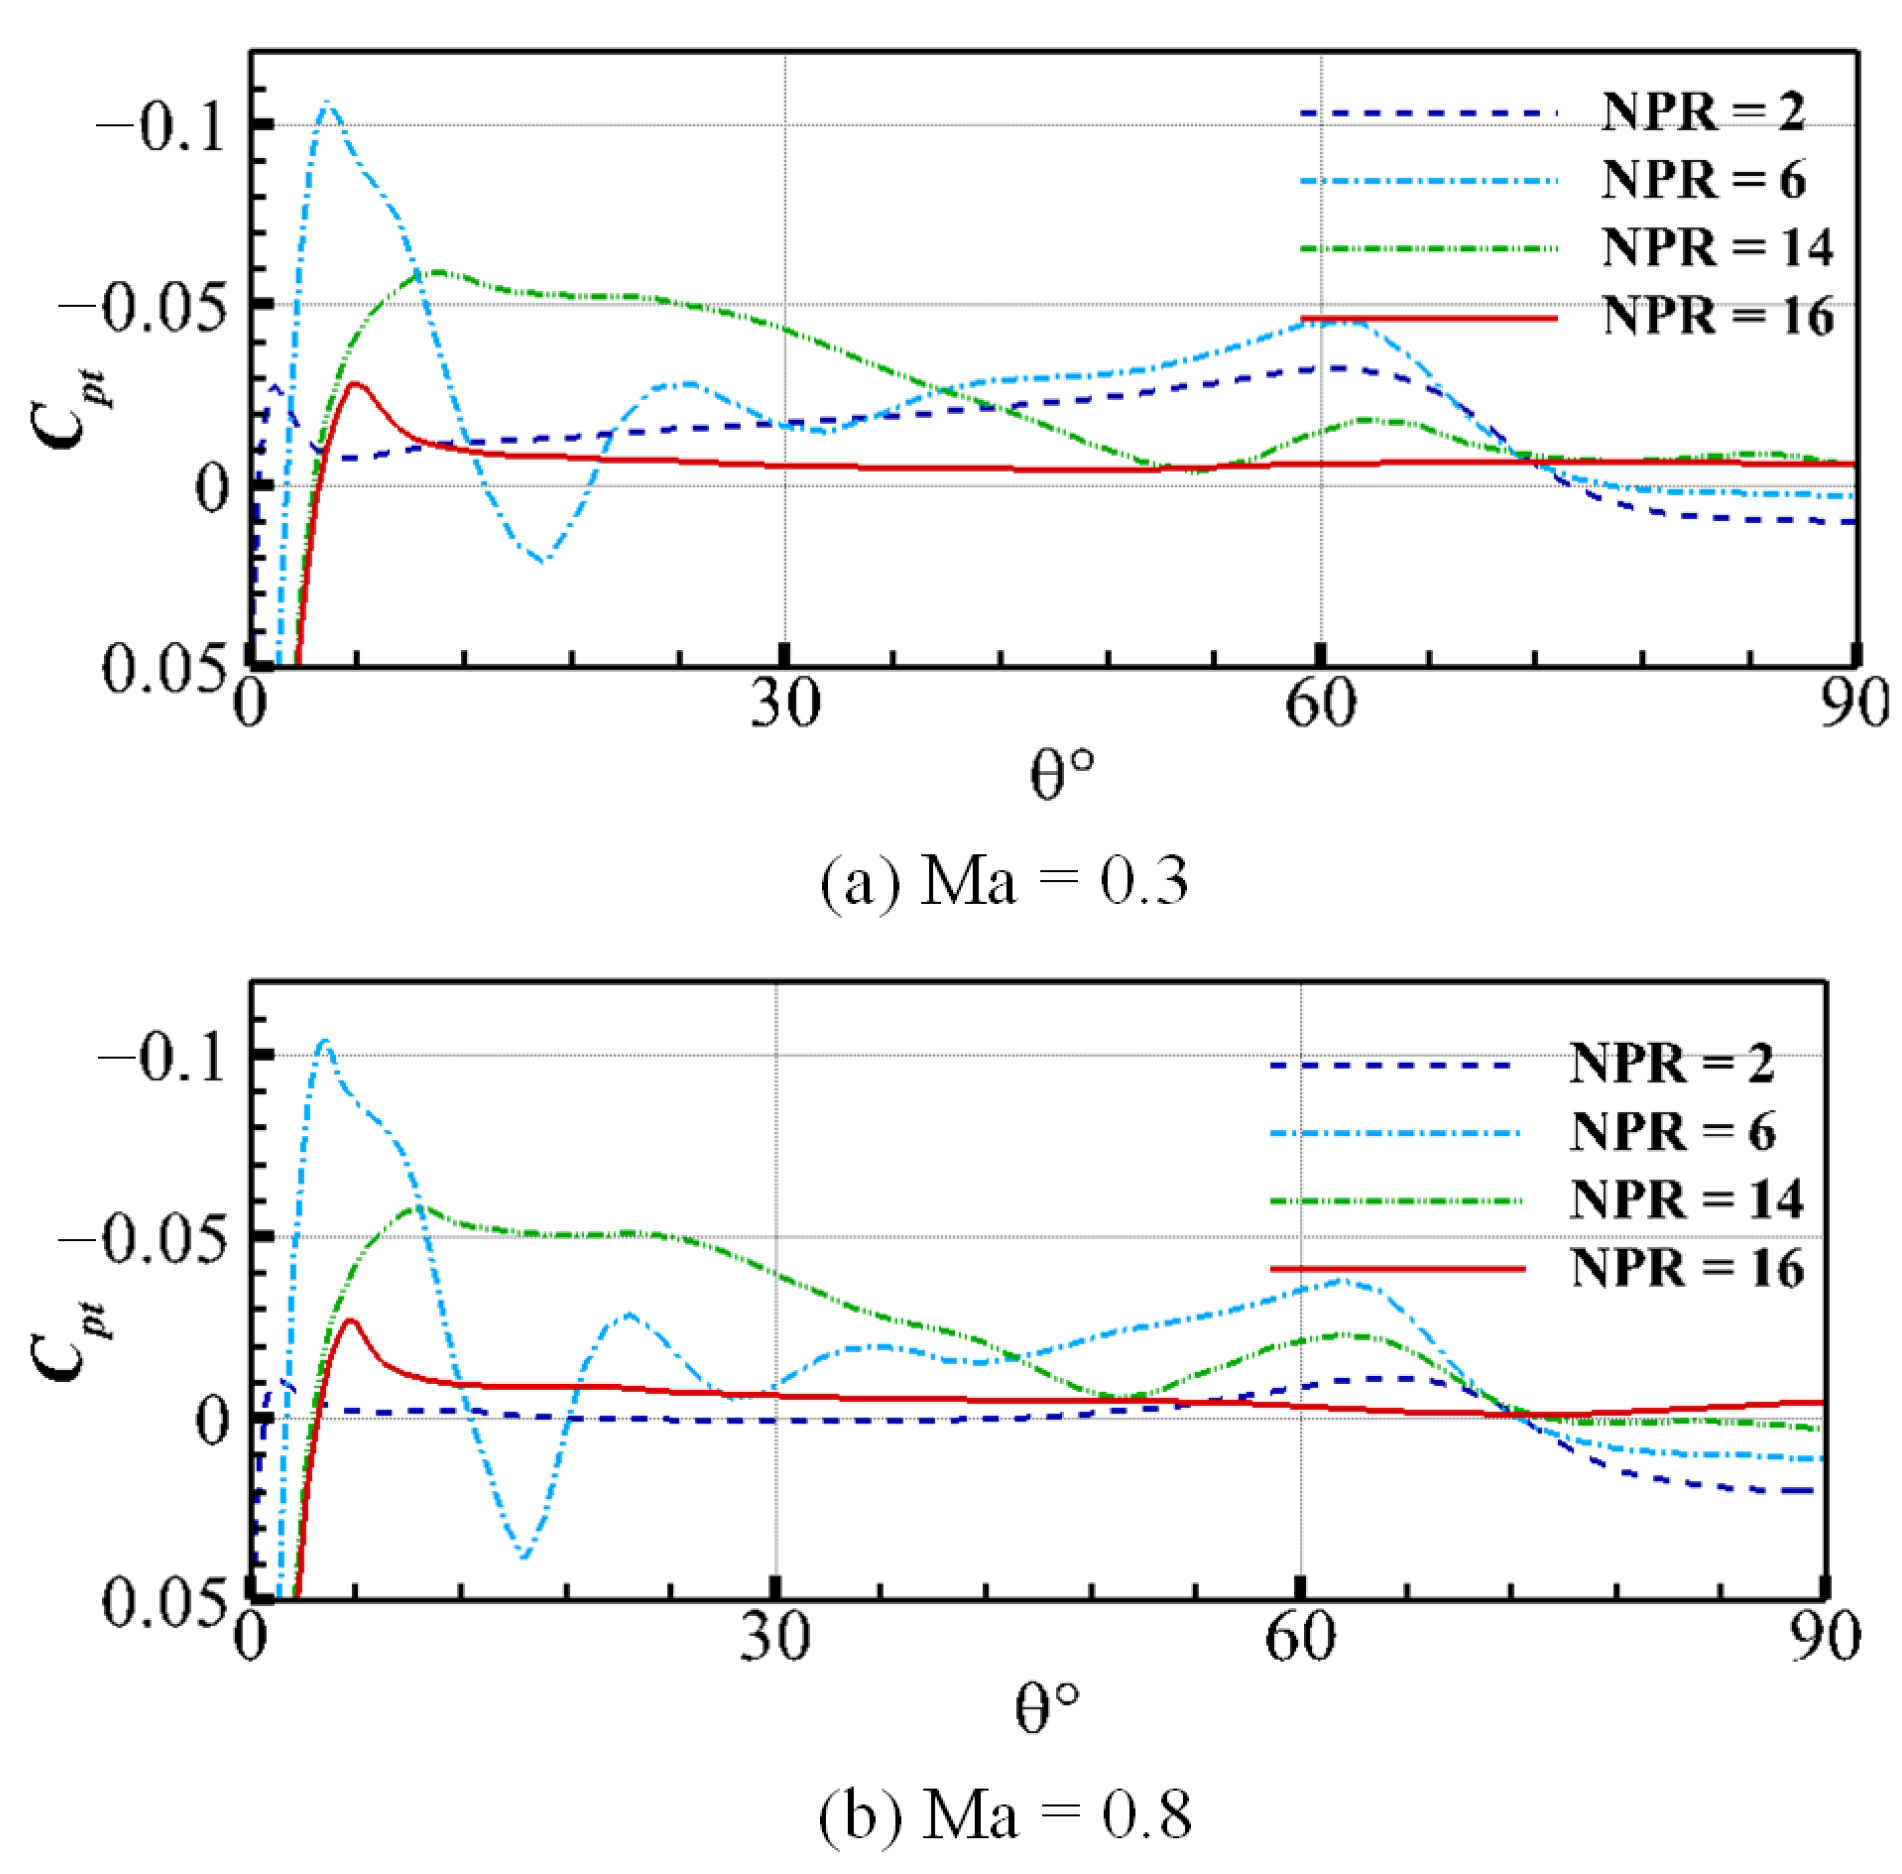
A similar variation in C p t along the upper Coanda wall reflects the characteristics of the under-expanded CC jet in both freestreams, which further supports the above conclusion. The surface pressure coefficient C p t is defined as C p t = ( p s p 0 , p l e n u m ) / p 0 , p l e n u m . The variable p s denotes the surface static pressure distribution. Figure 13 shows the C p t distributions on the Coanda surface for M a = 0.3 and M a = 0.8 . For the same NPR values, only a slight discrepancy in the distribution is found between M a = 0.3 and M a = 0.8 , which indicates that the CC jet features are very similar for both incoming flows for the same NPR.
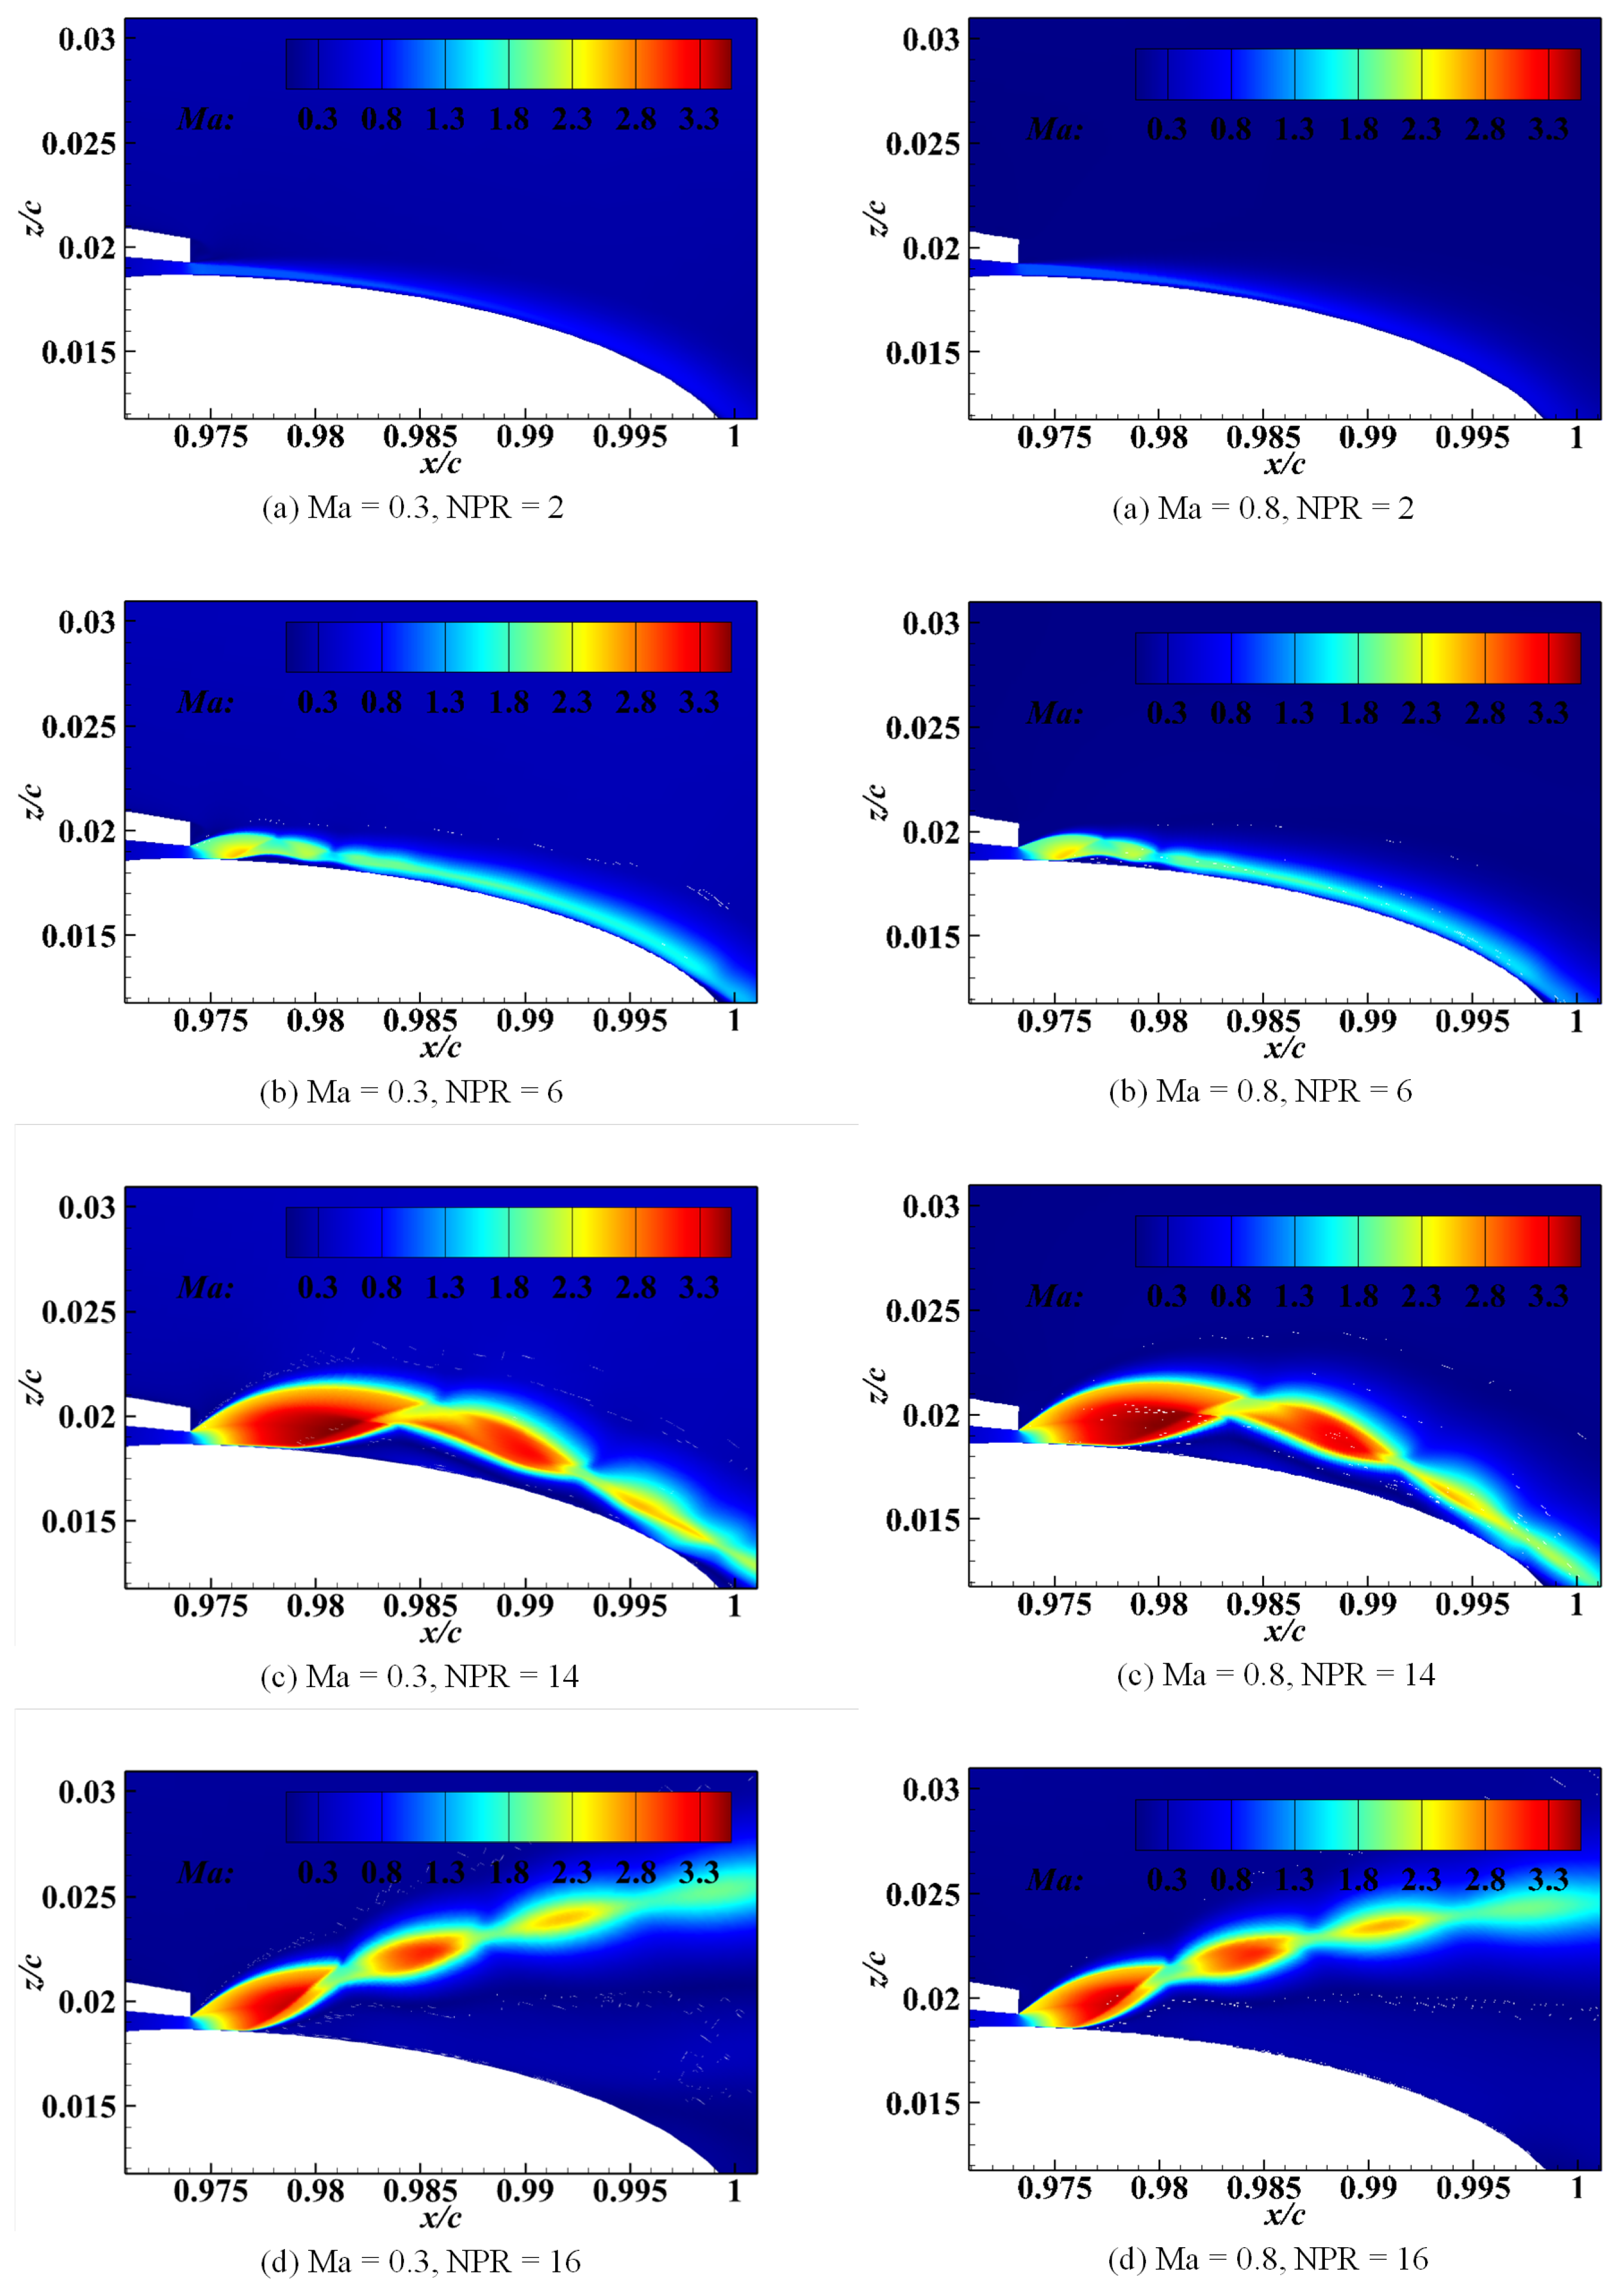
However, the NPRs significantly influence the C p t distribution in both incoming flows, which is reflected in the changes in the CC jet behavior. The Ma contours around the upper trailing-edge surface are shown in Figure 14 to visualize the CC jet behavior. At a moderate blowing pressure with N P R = 2 (Figure 14a), the wave structure is smooth and regular, implying a fully attached boundary layer all along the Coanda surface. Remarkable growth in the oscillation magnitude can be observed at N P R = 6 (Figure 14b). The strong adverse pressure gradient regions in the first two troughs indicate separation. After each separation, there are favorable pressure gradient regions, indicating reattachment. At the critical N P R = 14 (Figure 14c), the first two separated troughs merge, and a small trough follows and extends to the end of the Coanda surface, which indicates that the attachment has become weak. Finally, at N P R = 16 (Figure 14d), the jet flow is vectored from the surface, as the extension of the region of local separation beyond the edge of the Coanda surface allows air at atmospheric pressure to be drawn into the separation bubble. Hence, the boundary-layer control of the CC jet fails.

4.3. Flow Field Structure at NPRs of 14 and 16

4.3.1. Shock Structures

The numerical schlieren (density gradient), which provides an ideal initial inspection of the wave structure along the Coanda surface, was used to obtain the results for both freestream Mach numbers, as presented in Figure 15. The density gradient is defined as, d s = c 1 · e x p ( ( c 2 · ( ρ ρ m i n ) / ( ρ m a x ρ m i n ) ) , where c1 and c2 are constants, as in the studies by Wu and Martin [33] and Tong et al. [34]. The flow fields for all cases show large expansion fans at the nozzle exit. At N P R = 14 , the SBLI generated by the Coanda surface are presented downstream from the expansion fan in the flow field, as shown in Figure 15a,b. Furthermore, the reflected shockwave appears at the onset of the separation bubble owing to the adverse pressure gradient. At N P R = 16 , the flow expansion is terminated by the oblique shock downstream, as shown in Figure 15c,d. The shock structures of the CC jet in the transonic incoming flow are similar to those of the subsonic incoming flow under the same NPR conditions.

4.3.2. Shear Layer Development

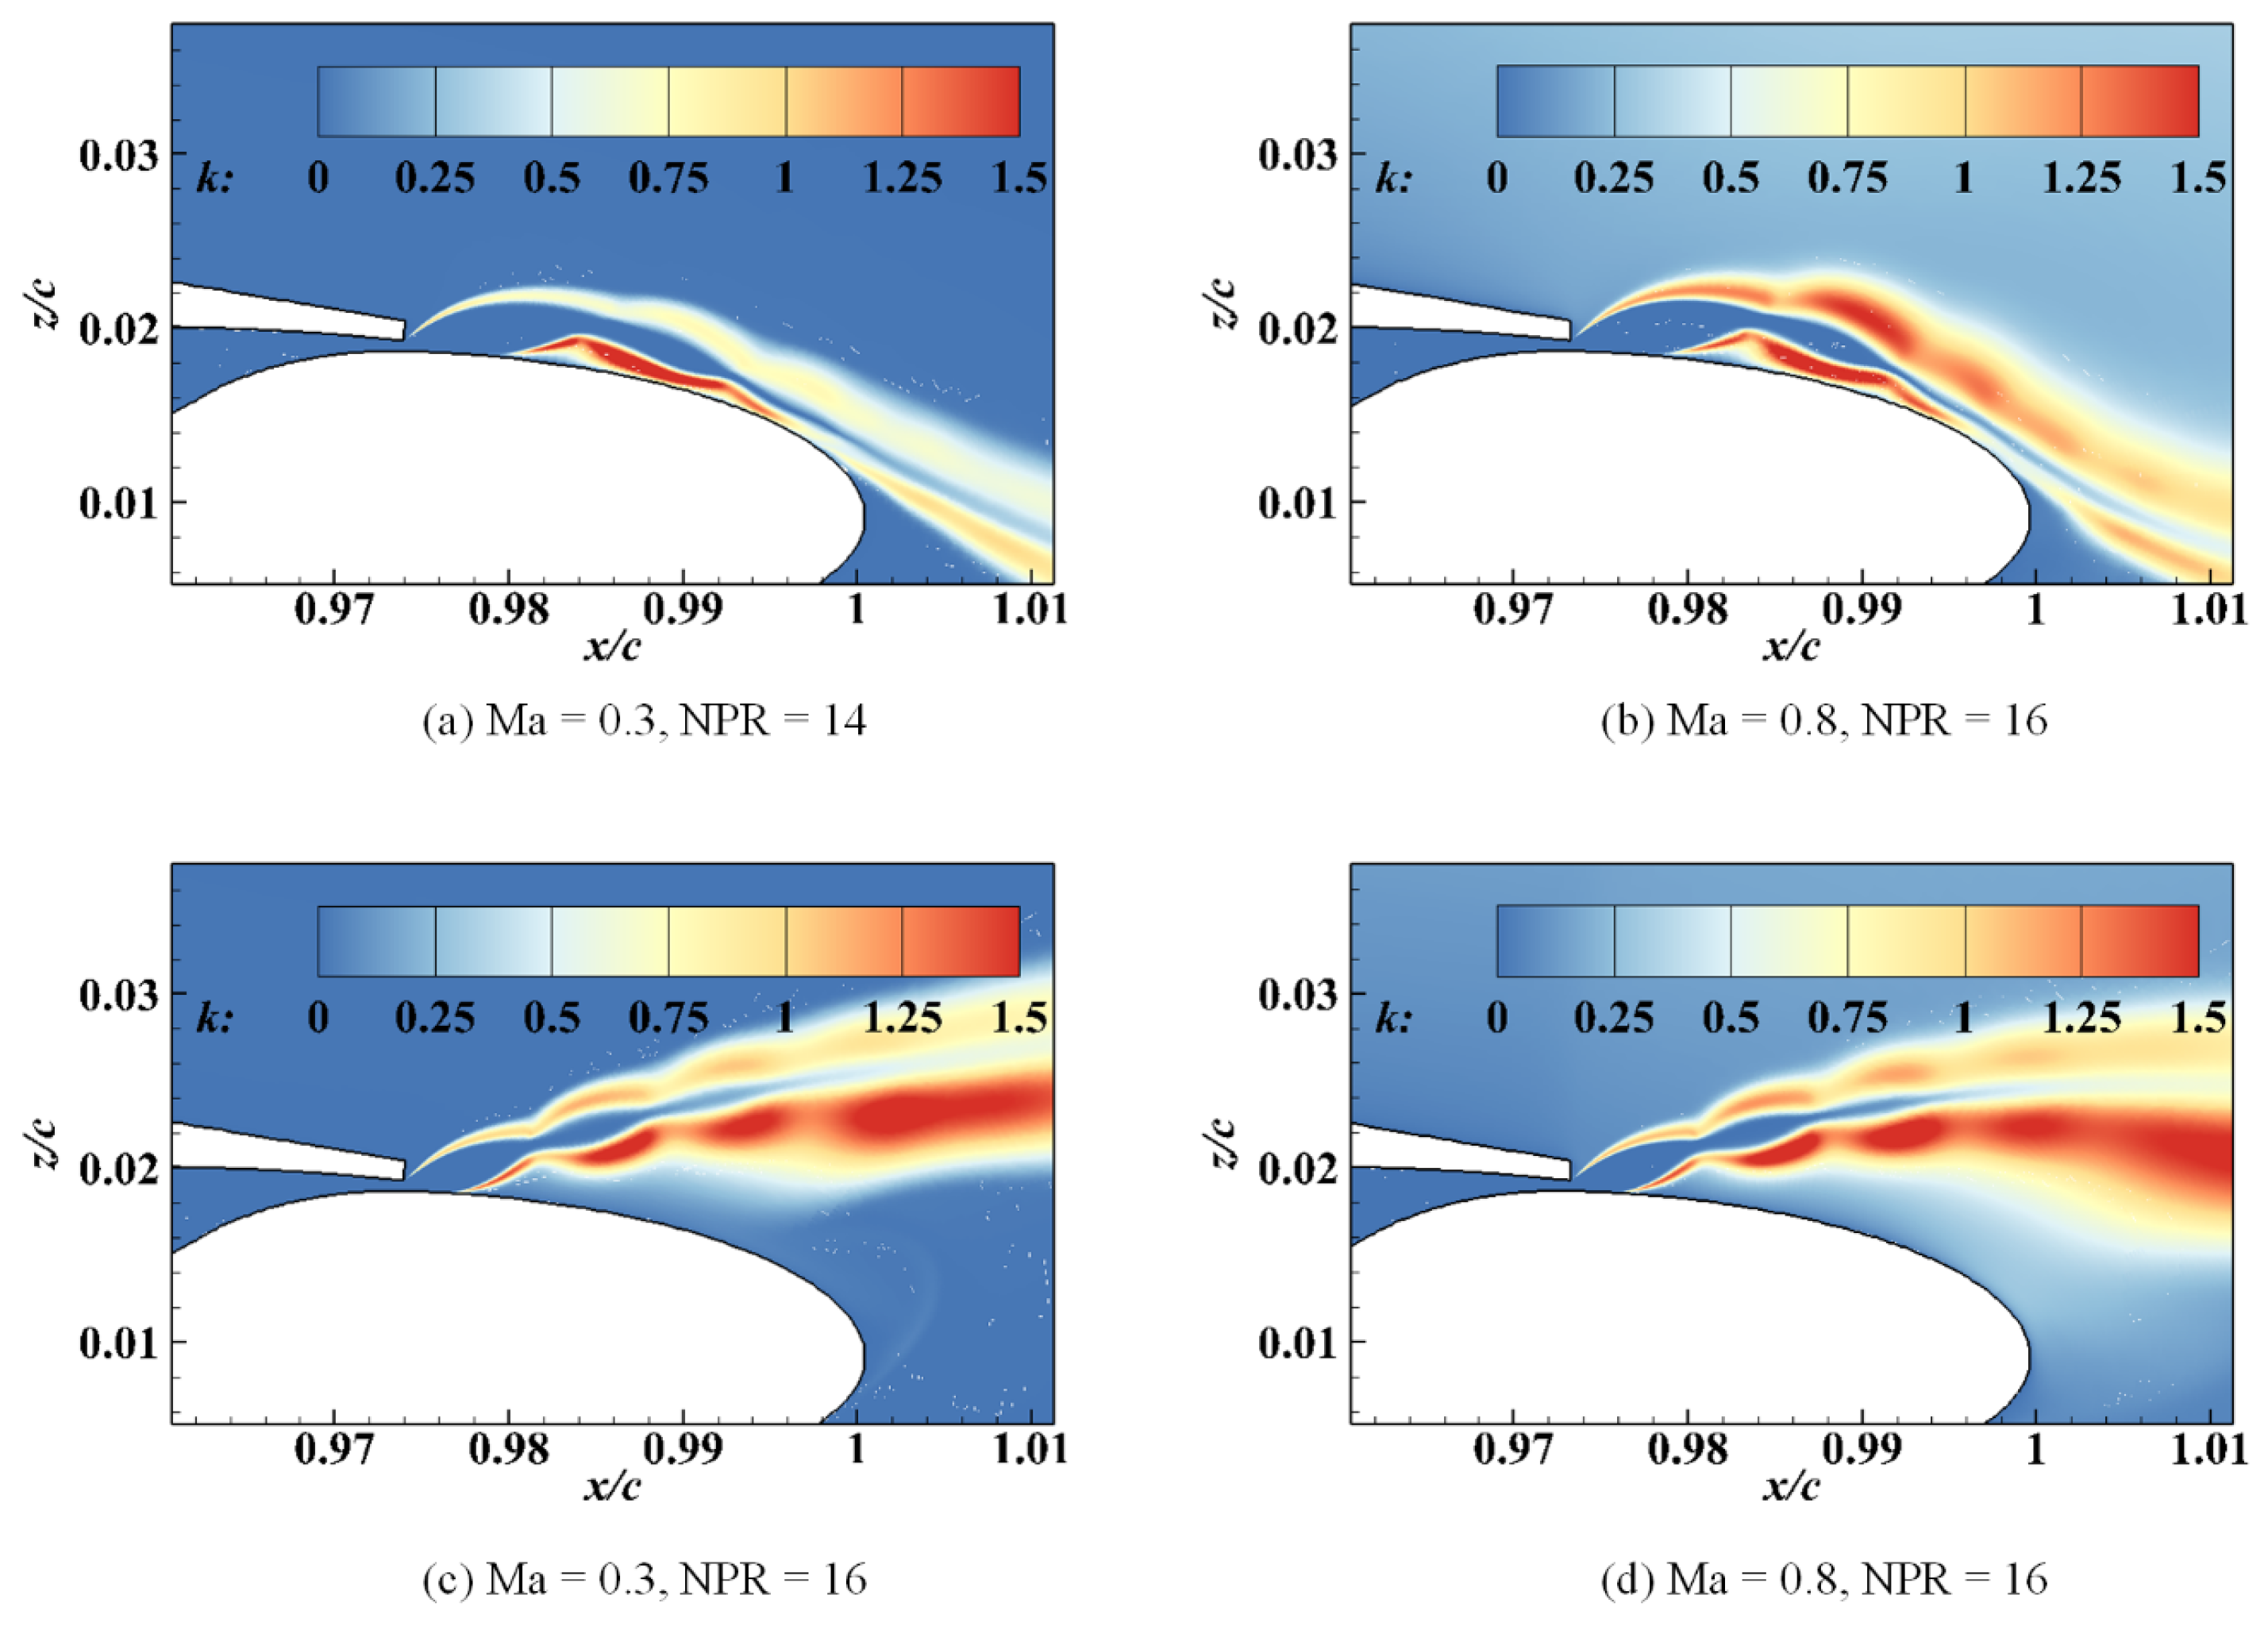
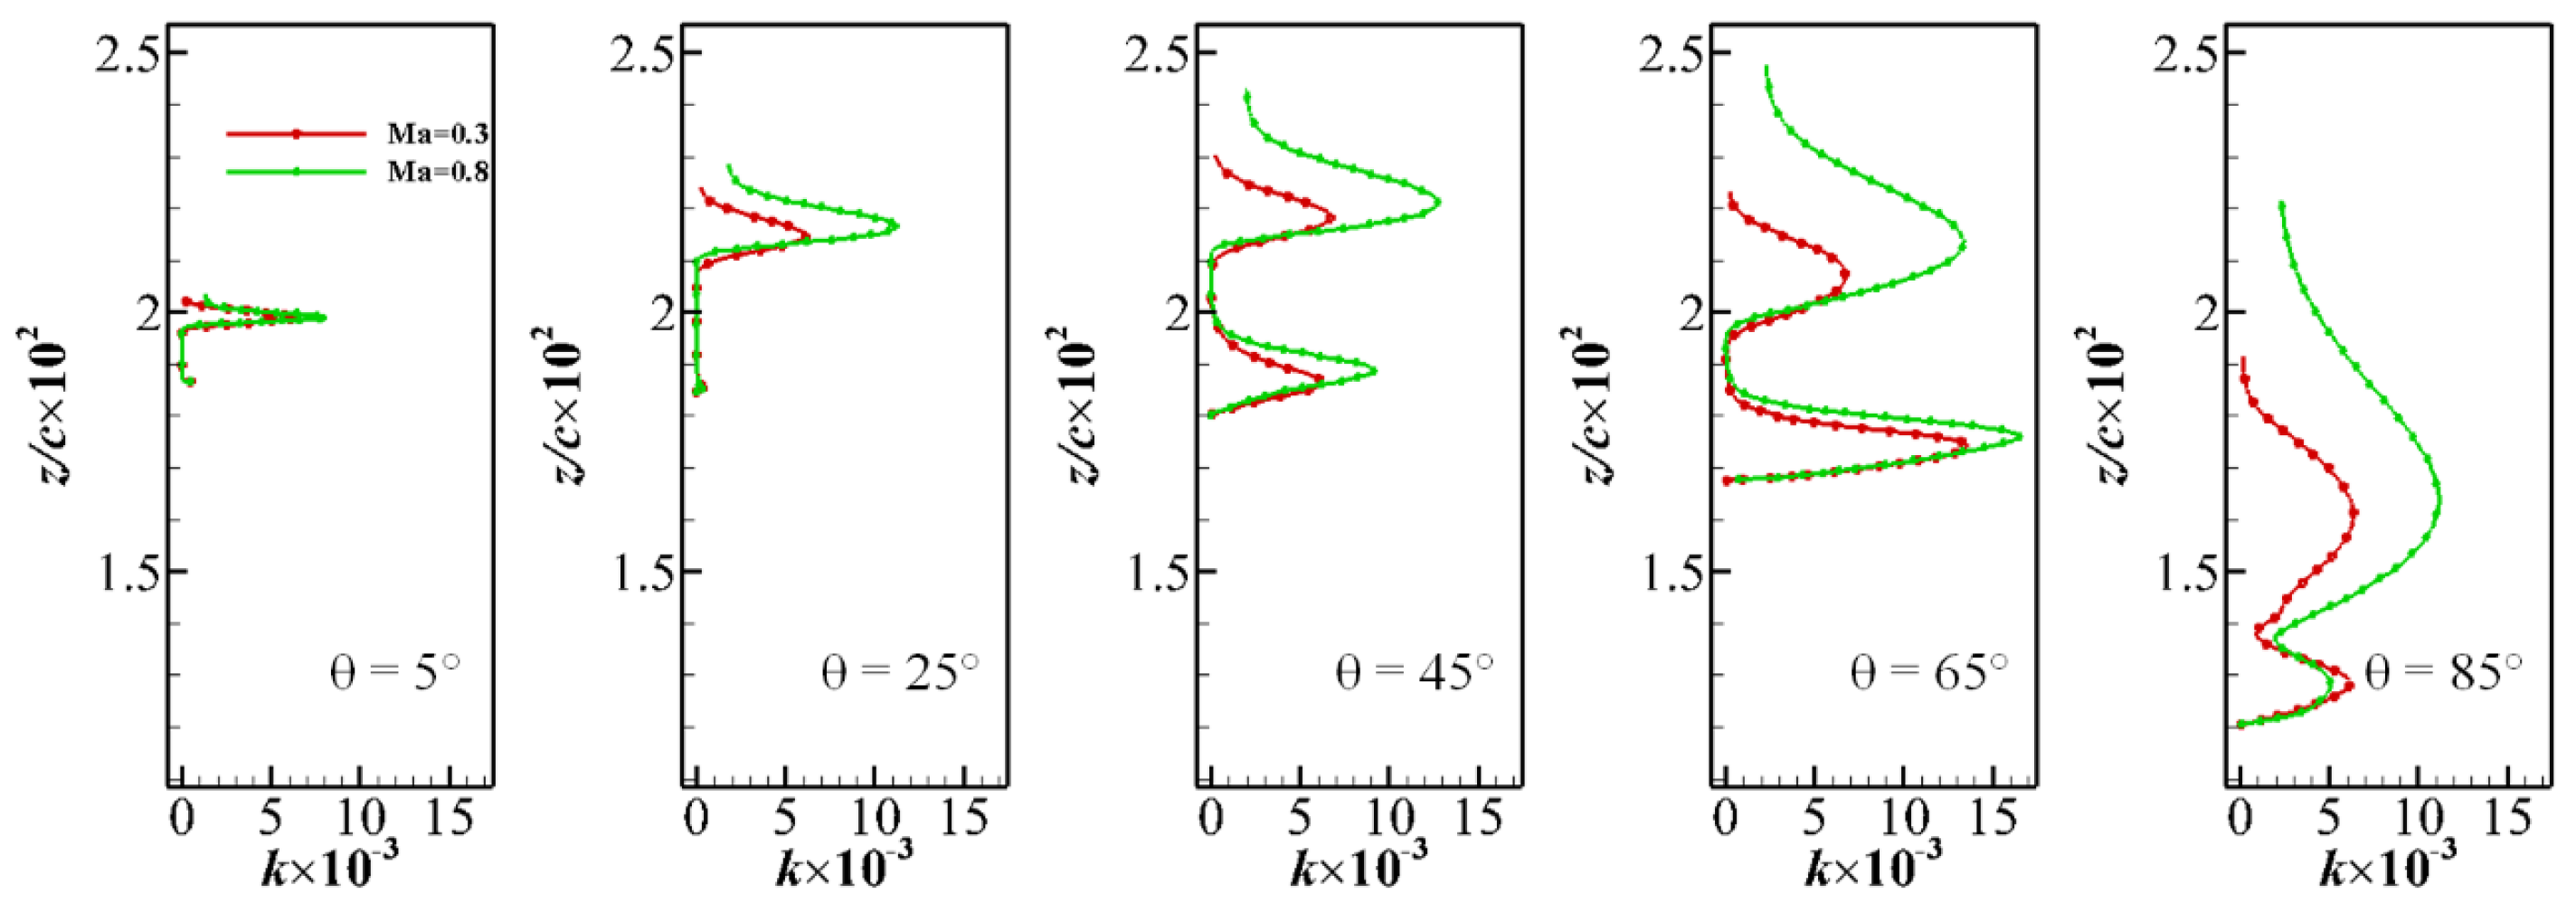
The entrainment characteristics around the CC jet near the trailing edge can be accurately represented and examined through flow quantities, such as the turbulent kinetic energy (TKE), k = 0.5 ( u x u x ¯ + u z u z ¯ ) [35]. Fortunately, the TKE is evaluated during the solution process when the SST RANS model is used and is explicitly available as an output variable. Figure 16 reveals the influence of In addition, the details of the TKE for N P R = 14 at five specific stations are illustrated in Figure 17. The results suggest that the cases corresponding to M a = 0.8 possess slightly better entrainment characteristics than those corresponding to M a = 0.3 .
Based on the above analysis, various fluid mechanic phenomena are presented, including shock waves, expansion fans, boundary layers, shock/boundary-layer interactions, flow separation, and entrainment. The flow behavior of the CC jet at M a = 0.8 shows a high degree of similarity with that at M a = 0.3 . The entrainment characteristics at M a = 0.8 is better than that at M a = 0.3 . The results indicate that the load control capability of CC at transonic speeds should be comparable or even superior to that at subsonic speeds; however, the effectiveness of the CC jet remarkably decreases at transonic speeds, for reasons that will be detailed later.

5. Mechanisms of Lift Augmentation in Transonic Flow

5.1. Mechanism of Lift Augmentation for Subsonic Freestream

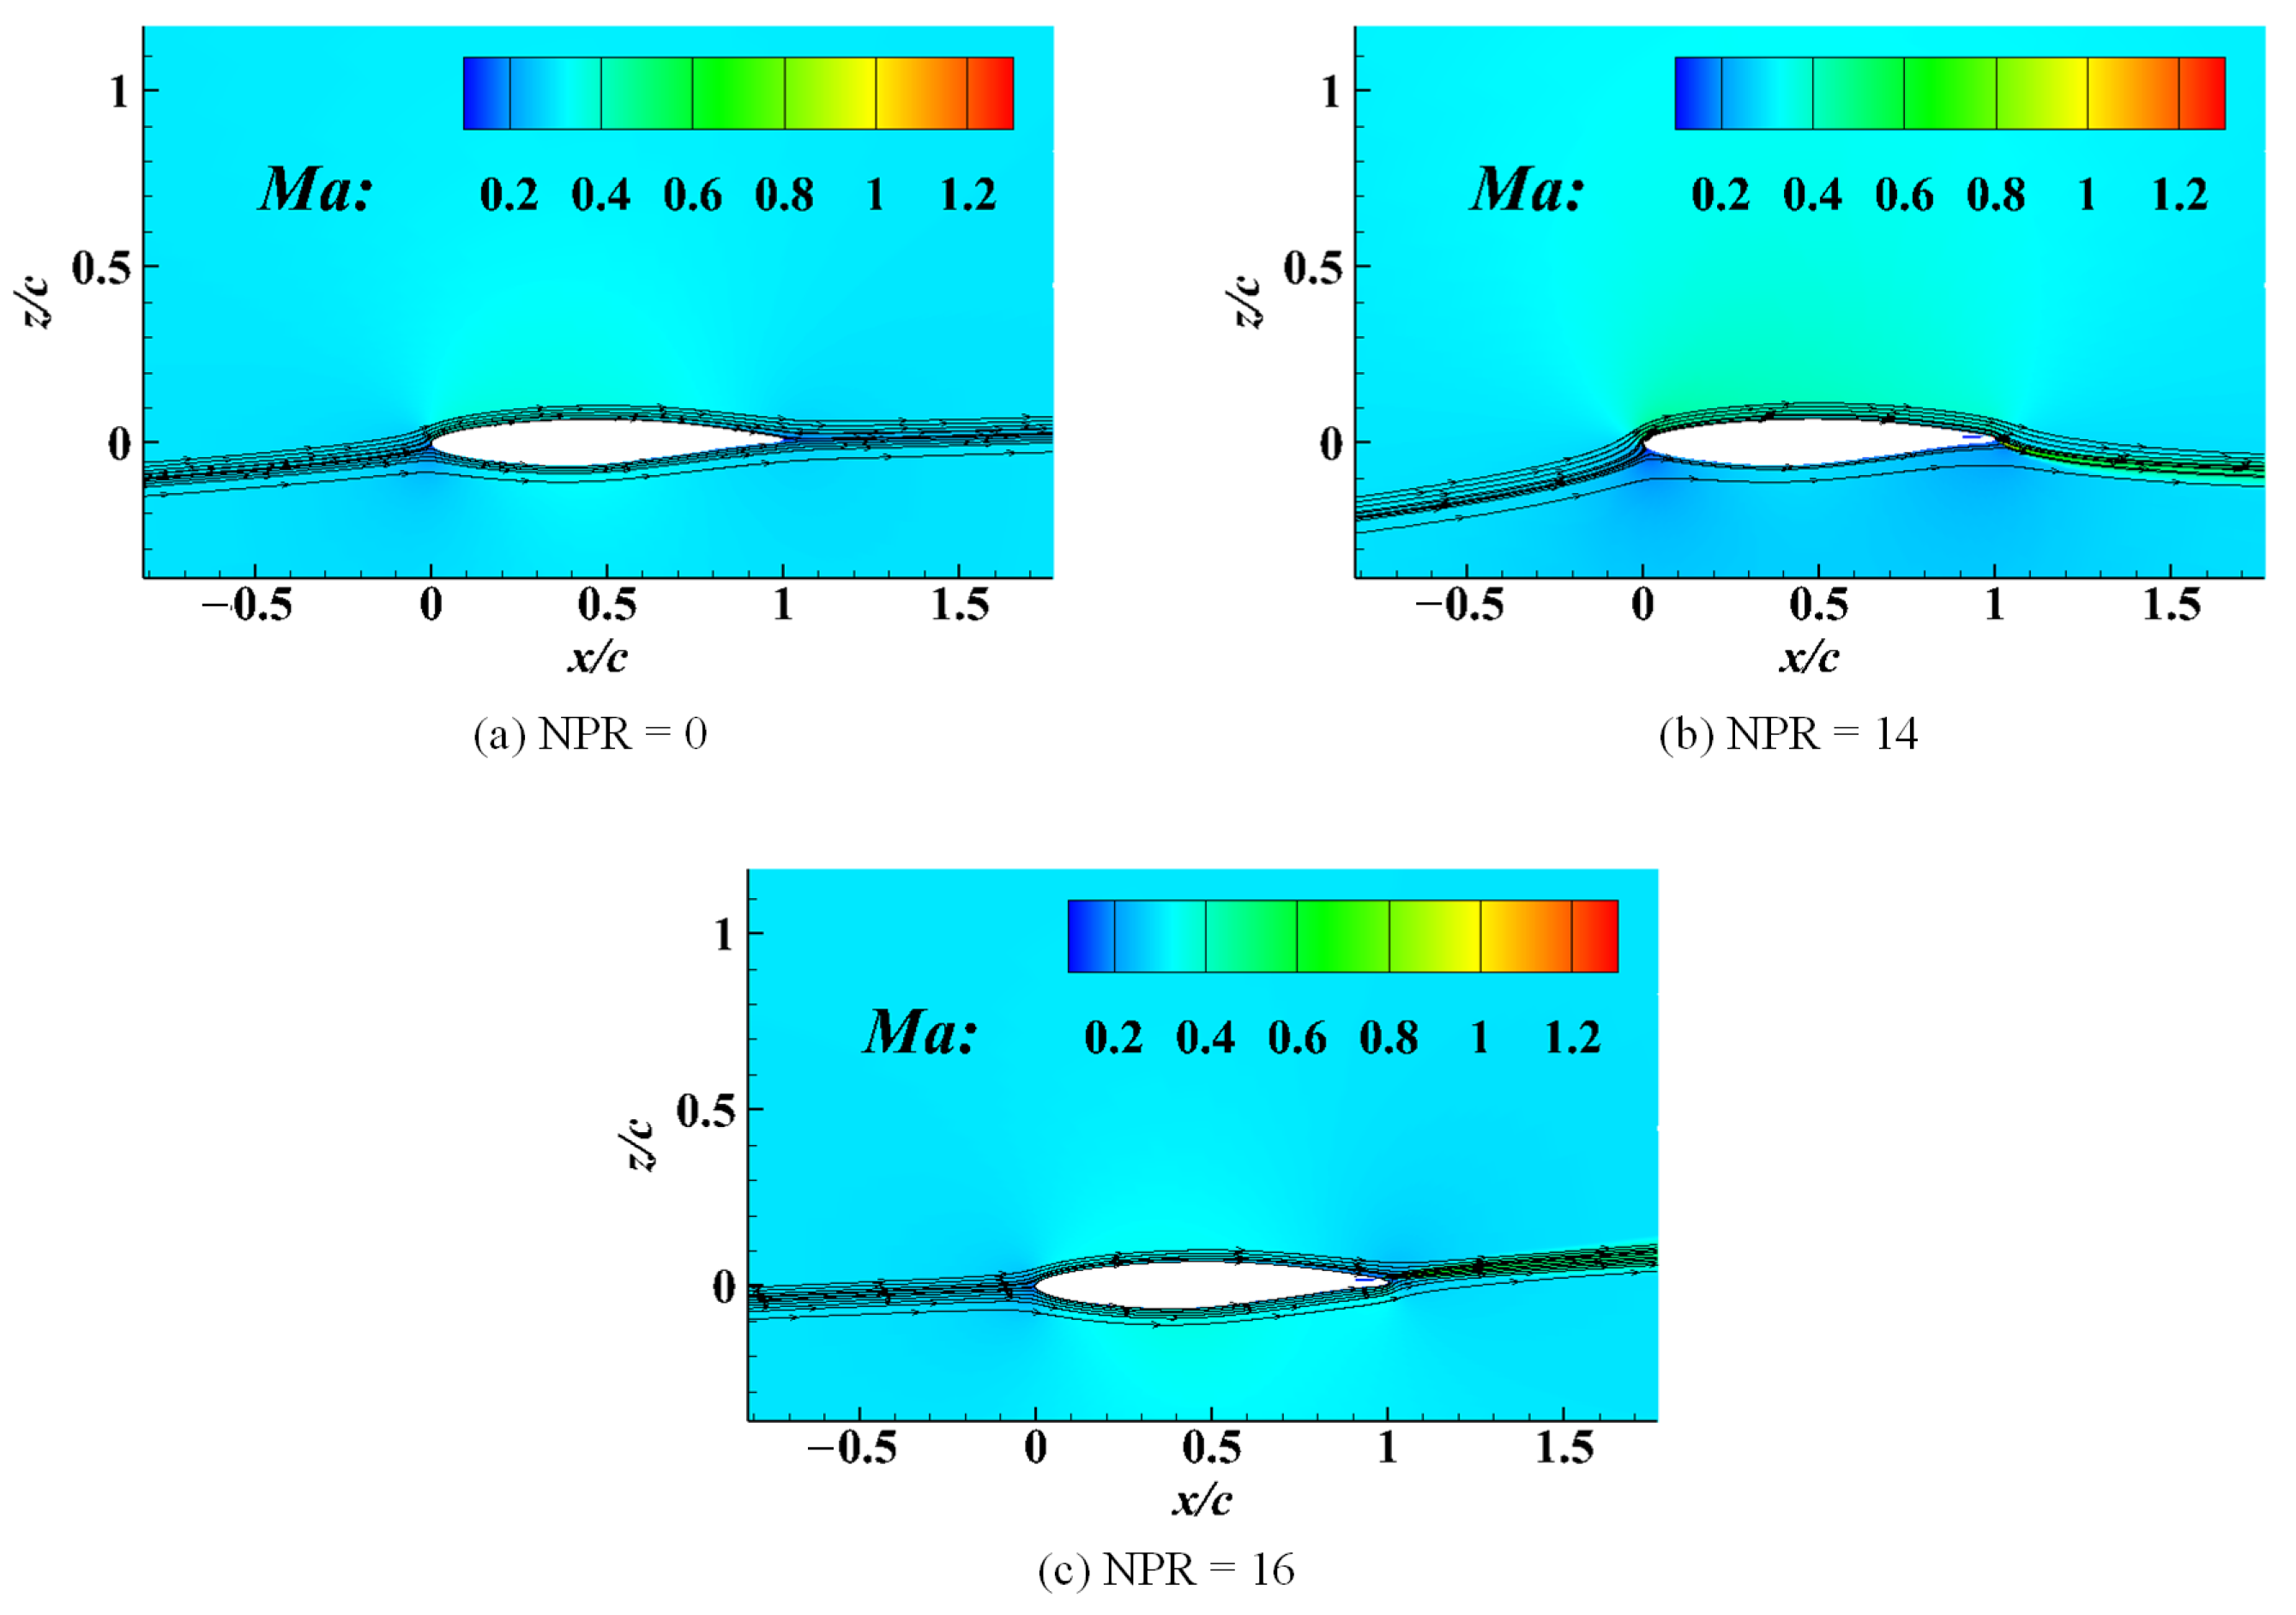
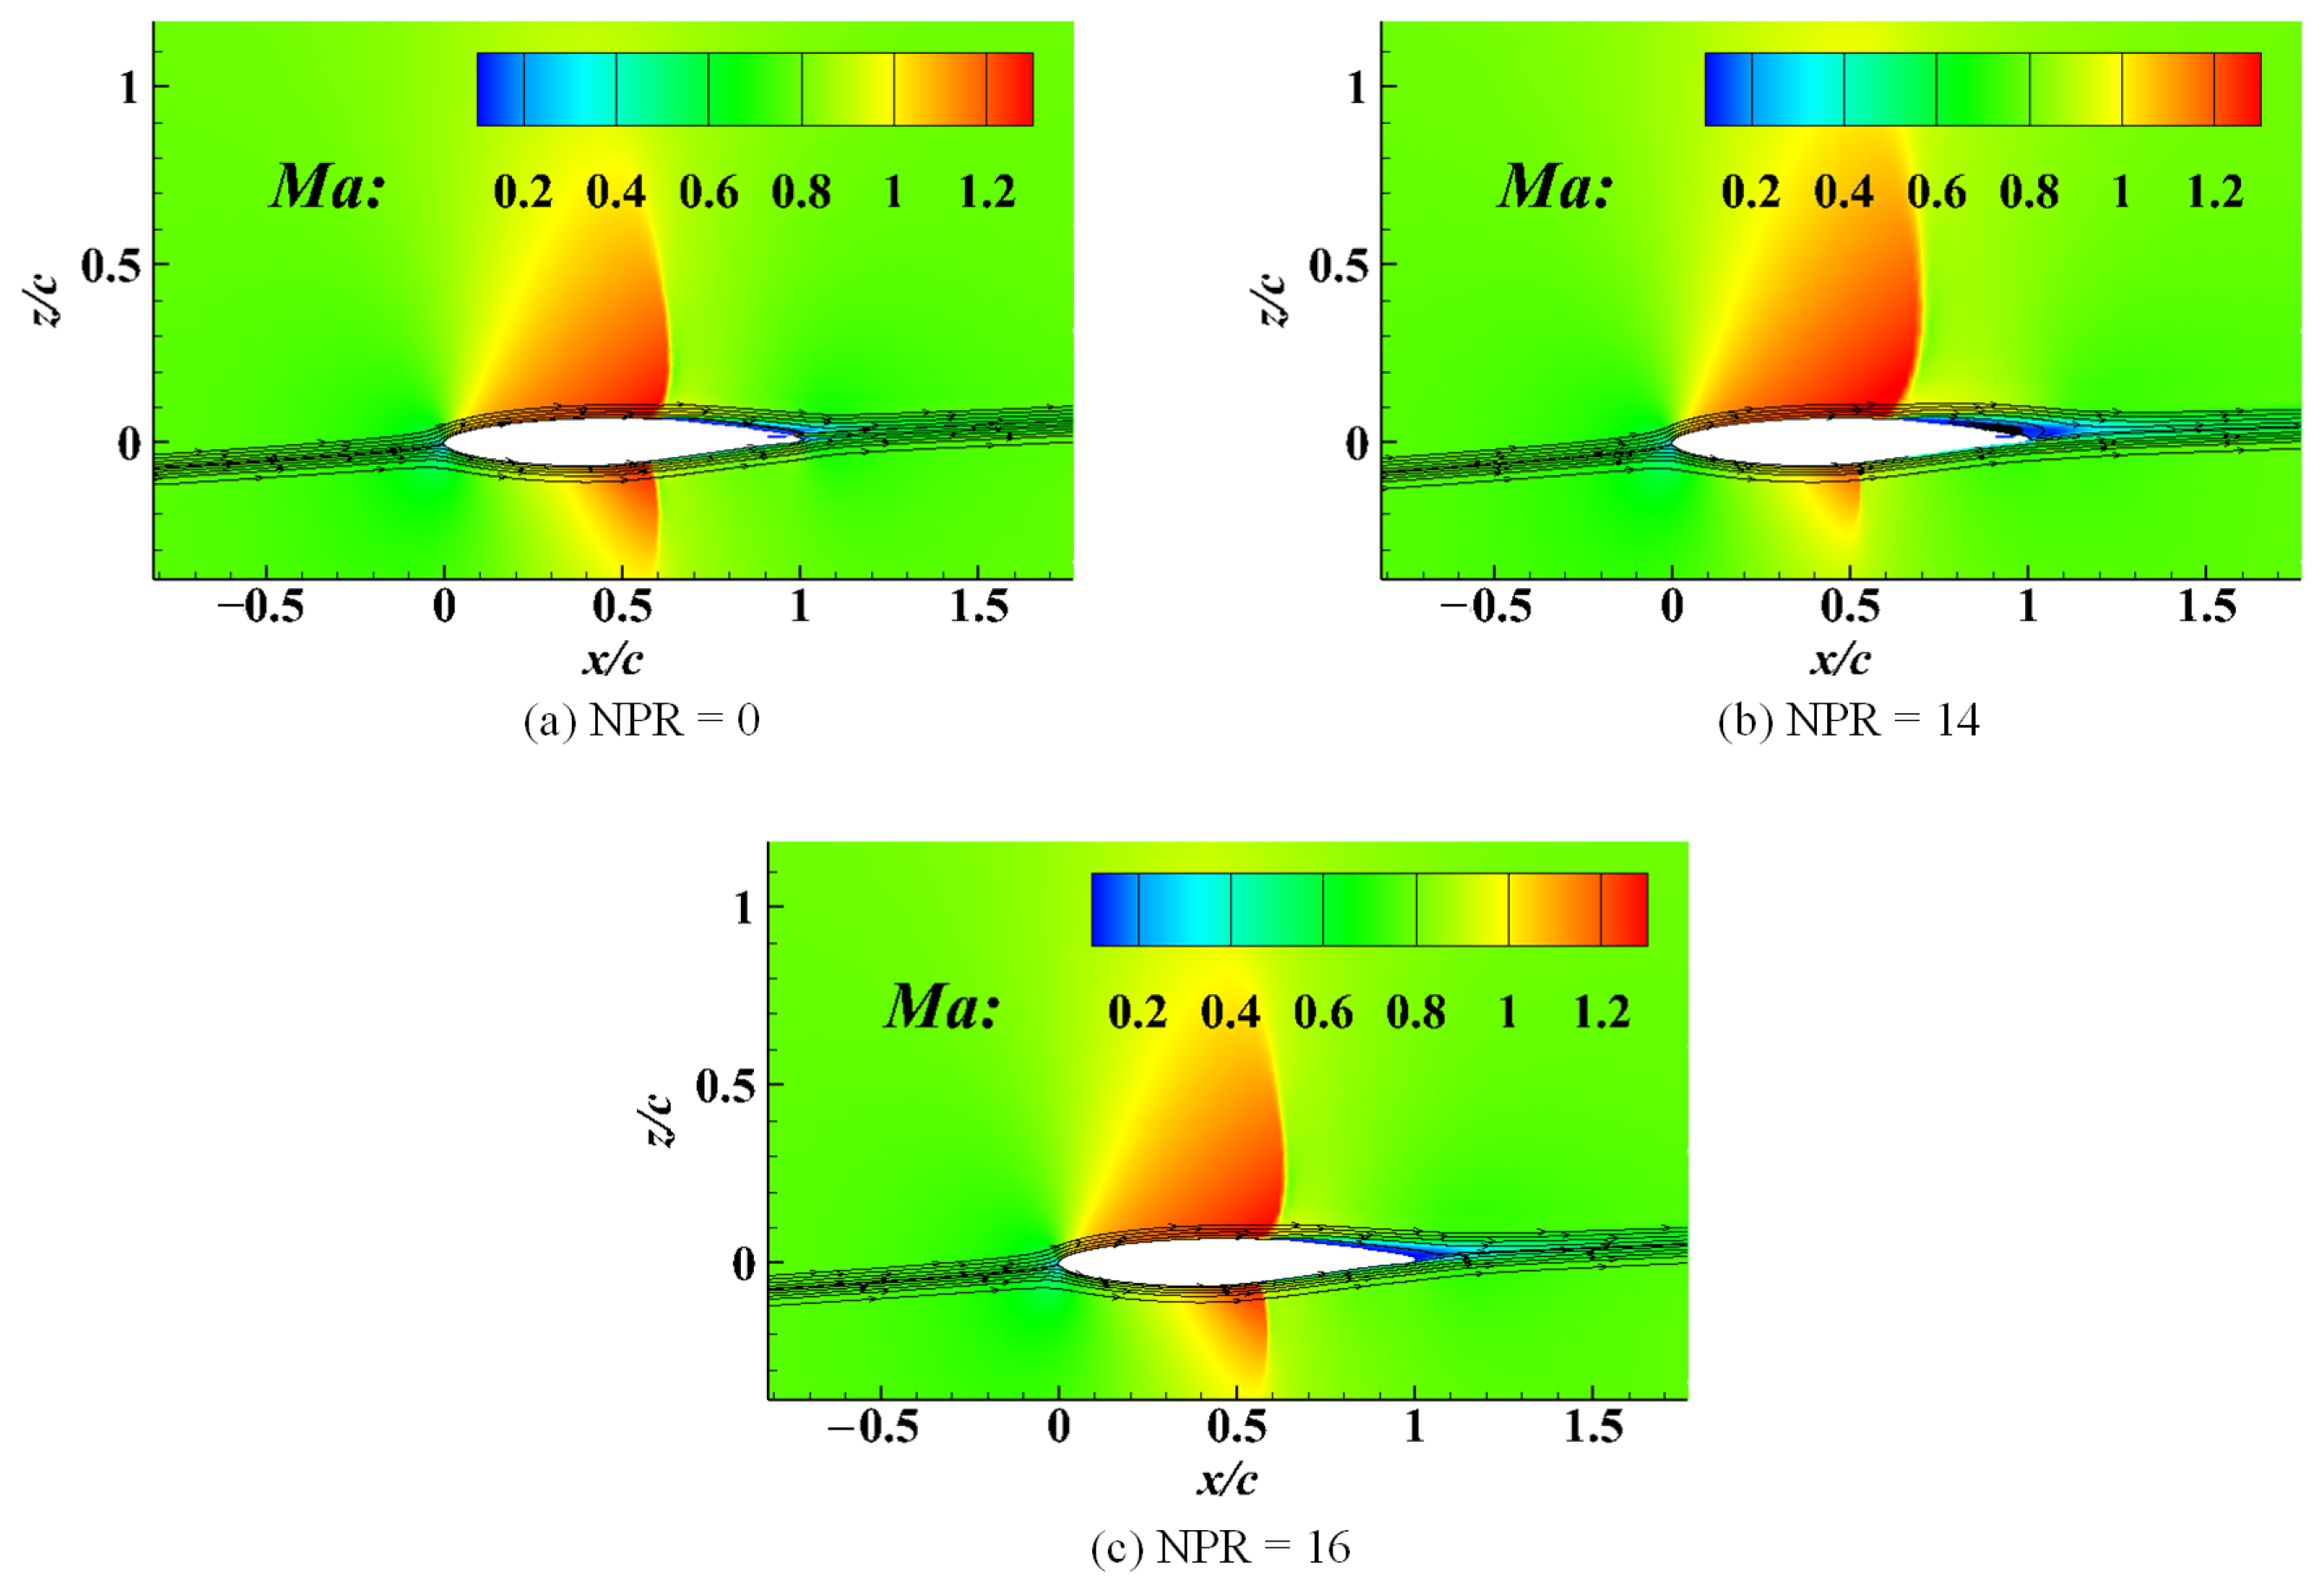
The mechanism of lift augmentation for the CC jet in subsonic flow is discussed in this section. The global view of the effects of CC on the mean flow streamlines for M a = 0.3 is presented in Figure 18. The mean flow streamlines around the leading and trailing edges of the baseline model are almost parallel to the freestream ( α = 3 ) (Figure 18a). Owing to blowing at NPR = 14 over the upper Coanda surface, the streamlines at the trailing edge of the airfoil are significantly entrained downward by the CC jet. Moreover, the streamlines at the leading edge of the airfoil are deflected downward, increasing the angle of attack. The mean streamlines are concave-down due to the CC jet (Figure 18b). In contrast, when the CC jet at NPR = 16 detaches from the upper Coanda surface, the mean streamline is concave-up (see Figure 18c).
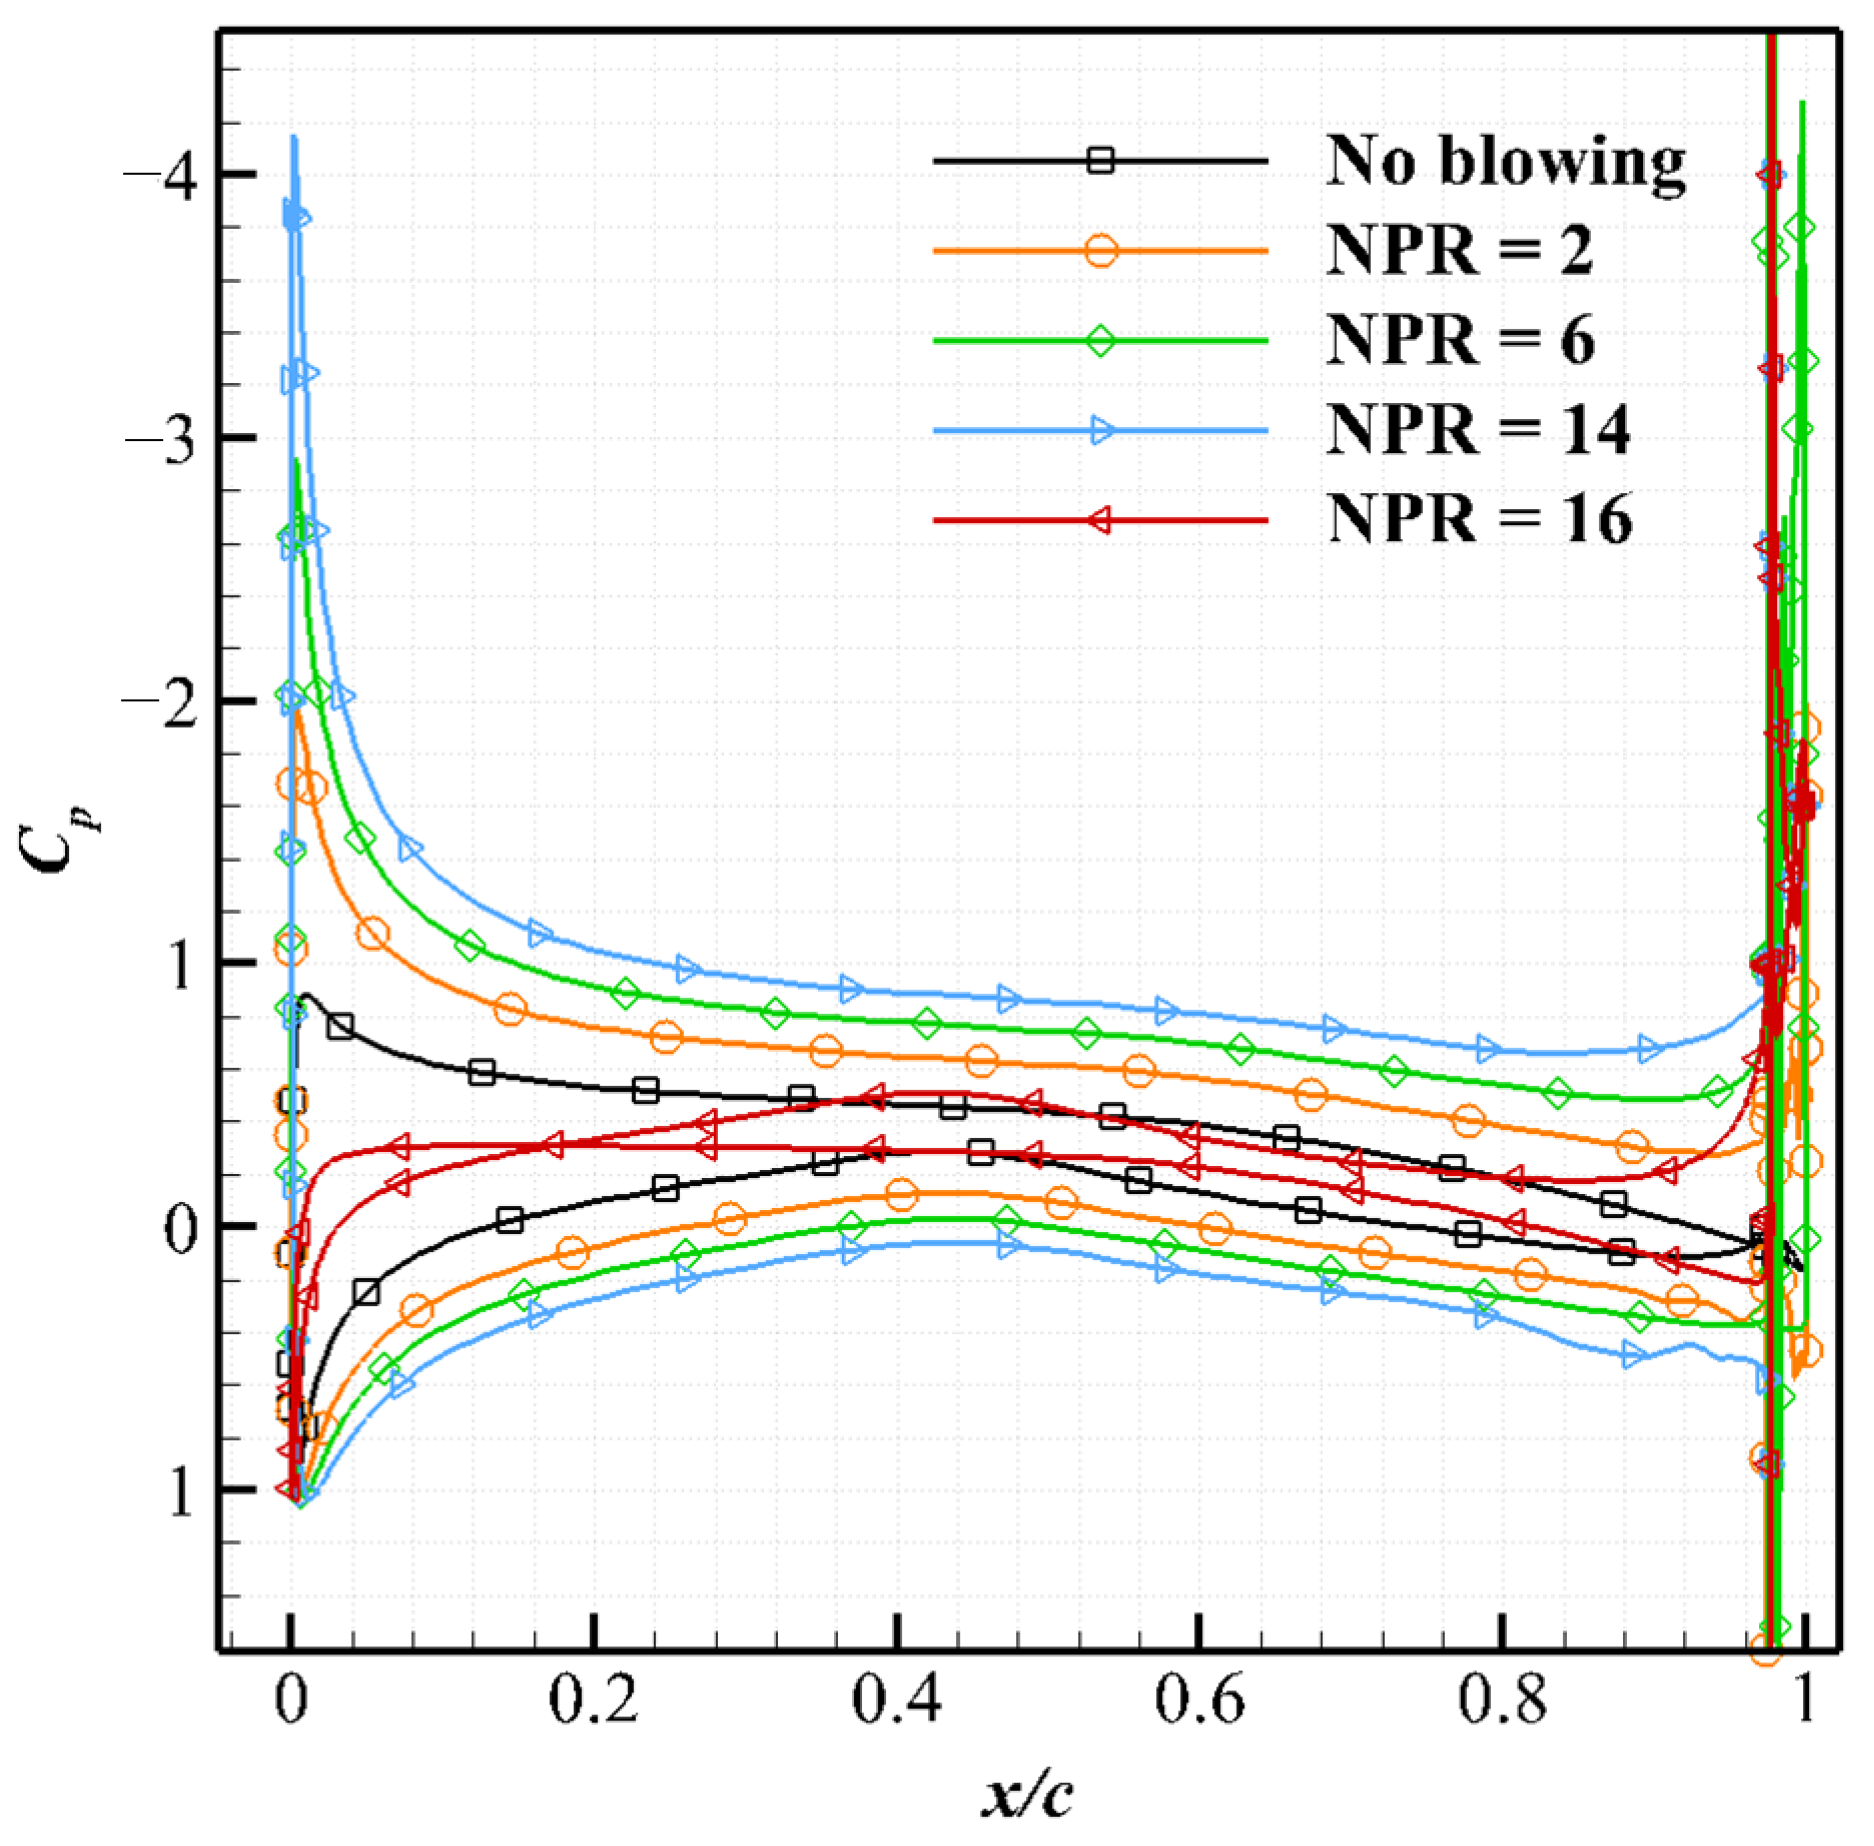
The CC jet at NPR = 14 increases the flow velocity near the upper surface, but decreases it near the lower surface. Consequently, the pressure coefficients along the entire surface of the airfoil are changed owing to differences in the flow velocity near the airfoil surface, especially in the leading-edge region, as shown in Figure 19. The detached CC jet at N P R = 16 has the opposite effects on the velocity field around the airfoil, resulting in reduced lift.
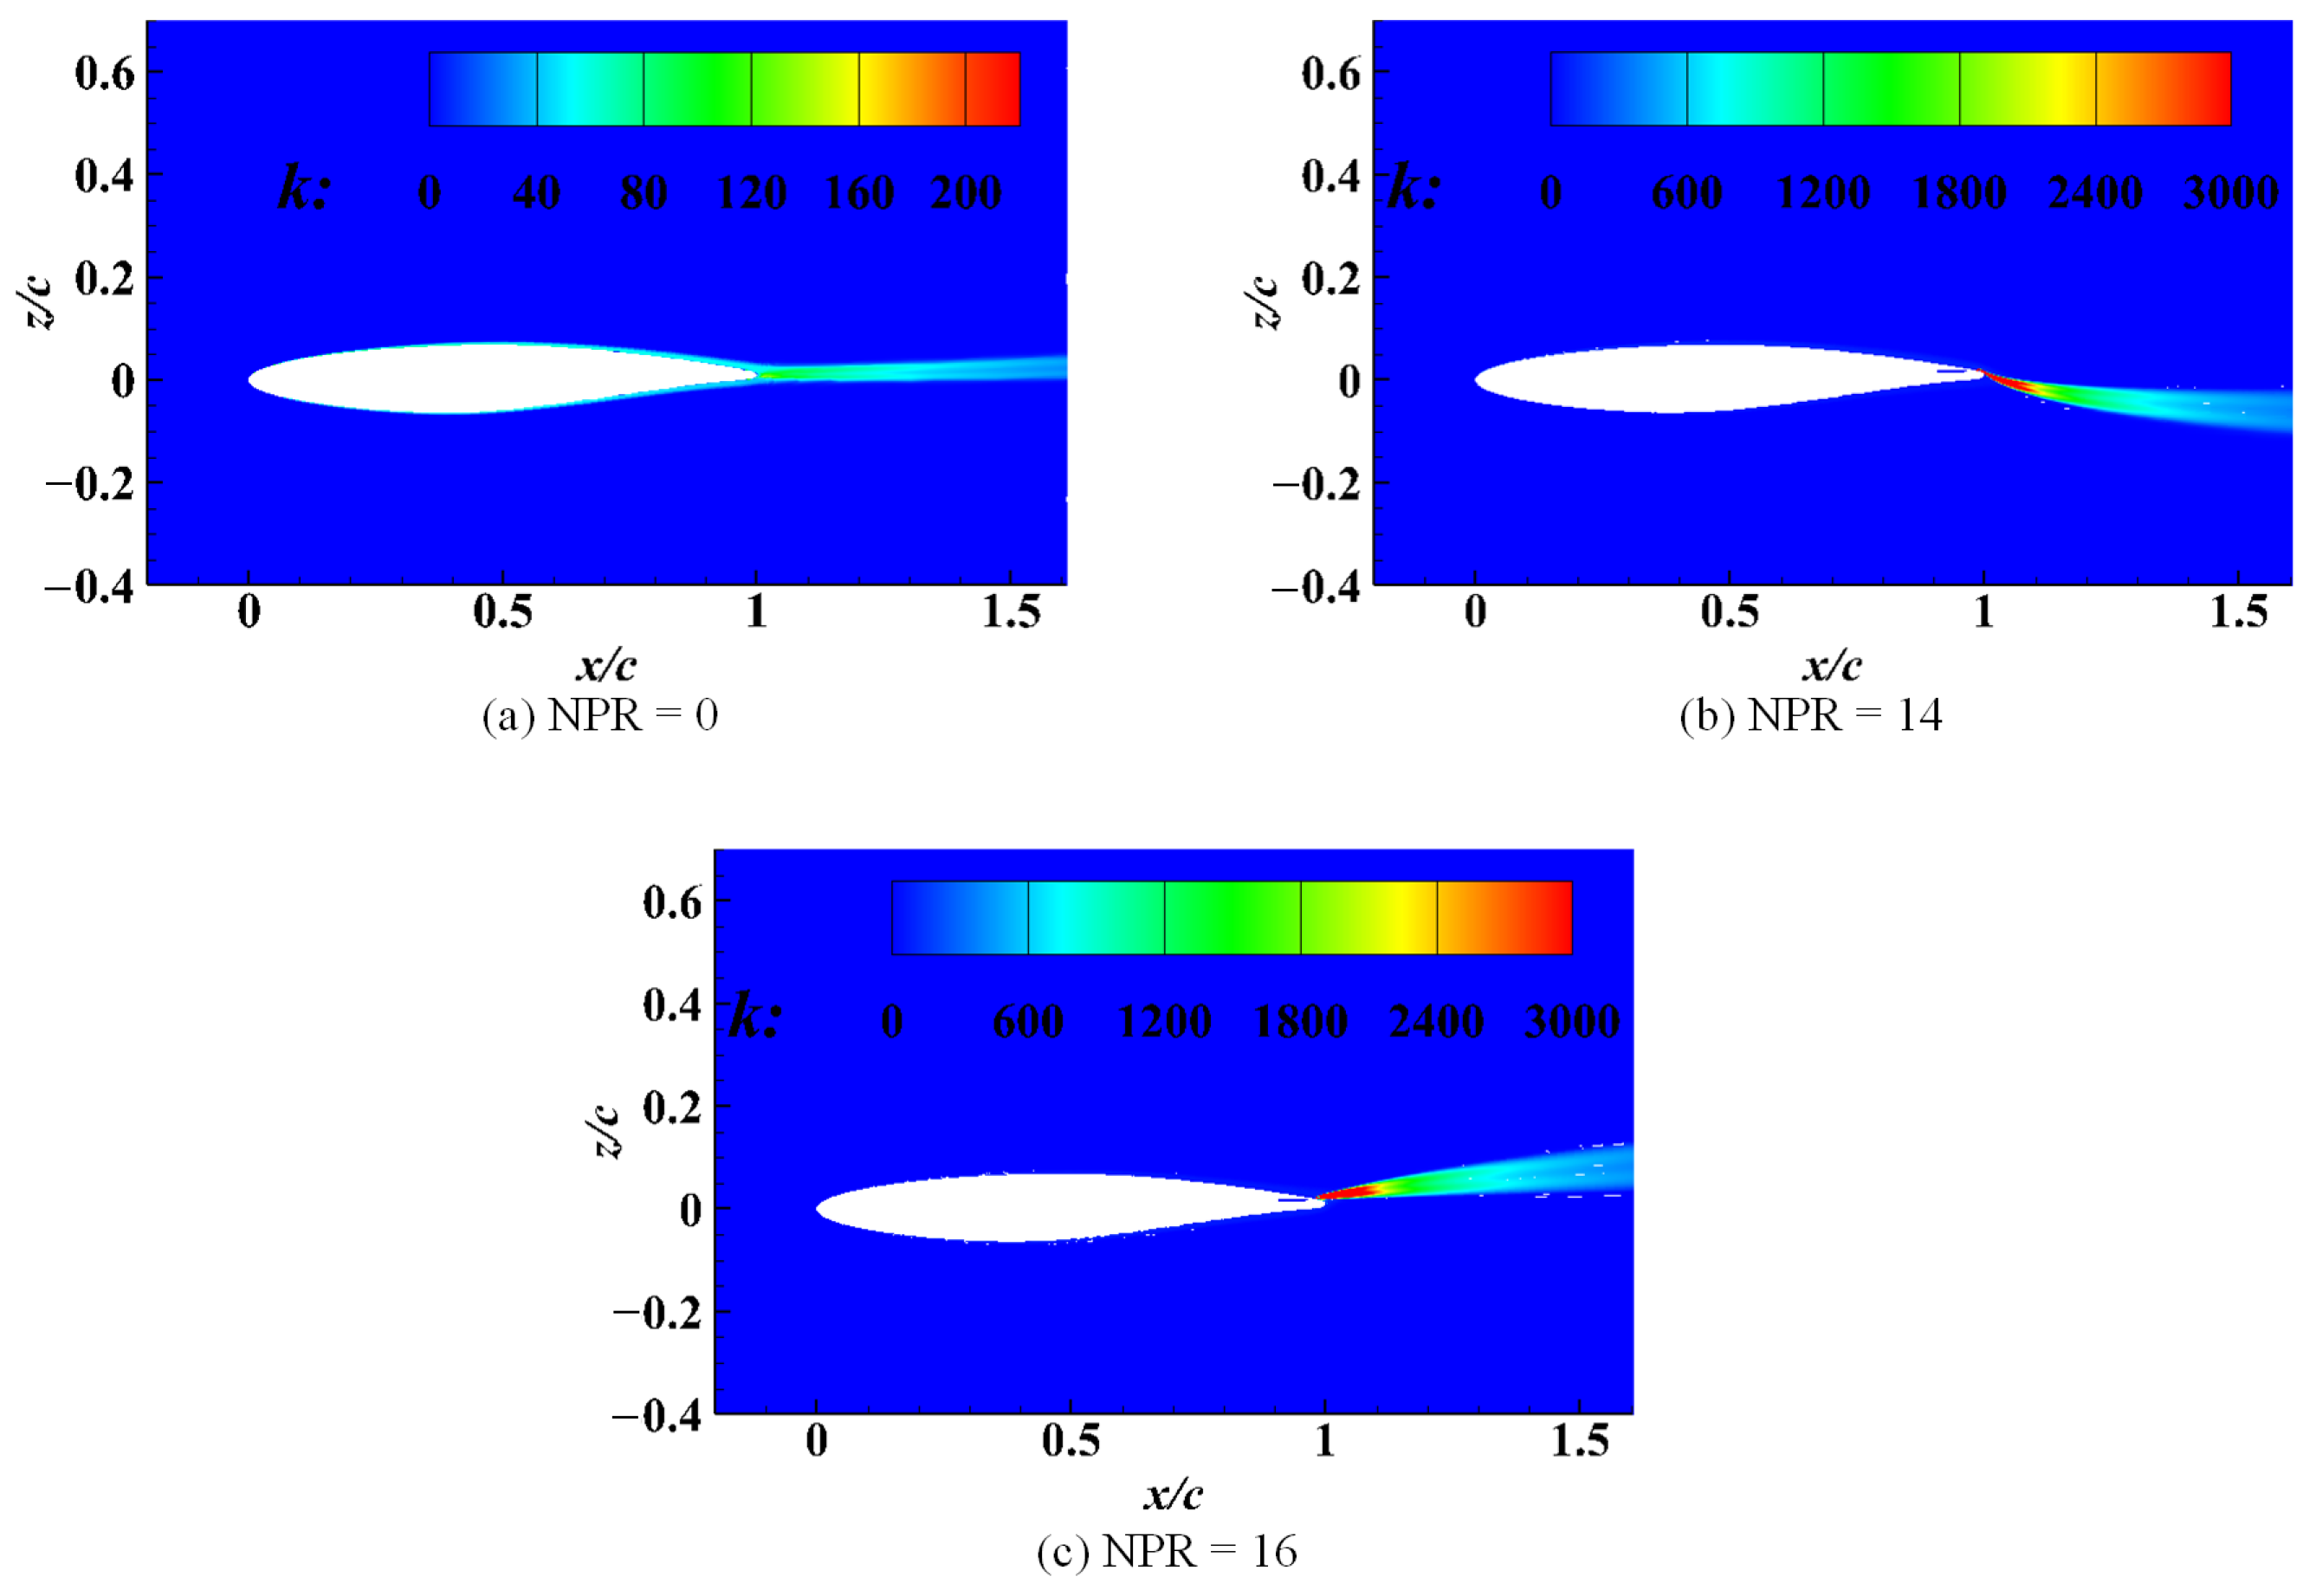
The entrainment characteristics for M a = 0.3 around the airfoil are illustrated in Figure 20. The locations of increased TKE are consistent with the deflected mean flow streamlines resulting from the CC jet. These results indicate that the acceleration of the flow field around the airfoil is associated with the momentum injection effects of the CC jet.

5.2. Mechanism of Lift Augmentation for Transonic Freestream

Unlike in the case with M a = 0.3 , curving streamlines caused by the CC jet are not found in the transonic incoming flow, as shown in Figure 21. However, the CC jet causes a shift in the supersonic region around the airfoil. Shockwave pattern variation was also observed by Milholen et al. [36]. The C p distribution on the airfoil with M a = 0.8 at α = 3 is illustrated in Figure 22 to analyze the effect of the CC jet on the flow field. With increasing NPR, a significant increase in the pressure difference between the upper and lower airfoil surfaces occurs around the rear region of the airfoil. However, the pressure coefficient before the terminating shock wave remains almost unchanged.
Moreover, the CC jet affects the positions of both upper and lower shocks on the airfoil. The upper shock wave moves from 0.564c to 0.588c, resulting in the extension of the supersonic region of the upper surface and enhanced strength of the upper shock wave. The position of the lower shock wave moves forward from 0.540c to 0.499c, resulting in the recession of the supersonic zone of the lower surface. In addition, the strength of the lower shock wave is decreased. The CC jet in the transonic incoming flow can accelerate the flow around the trailing edge of the airfoil and modify the shock around the airfoil, which is the main lift enhancement mechanism of CC in transonic flow.
The mode of action of the CC jet in the transonic regime differs from that in the subsonic regime. These differences are attributable to the presence of shock on the upper surface of the airfoil. When the flow becomes supersonic near the airfoil surface, the disturbances in the CC jet cannot advance upstream from the terminating shock wave. Hence, the CC actuation on the airfoil no longer affects the external flow at the leading edge and cannot continue to entrain the flow to follow the CC jet; consequently, the pressure coefficient on the leading edge of the airfoil is unaffected. In the subsonic regime, the pressure change spreads over the rest of the airfoil more evenly, significantly increasing the effectiveness of the CC device.
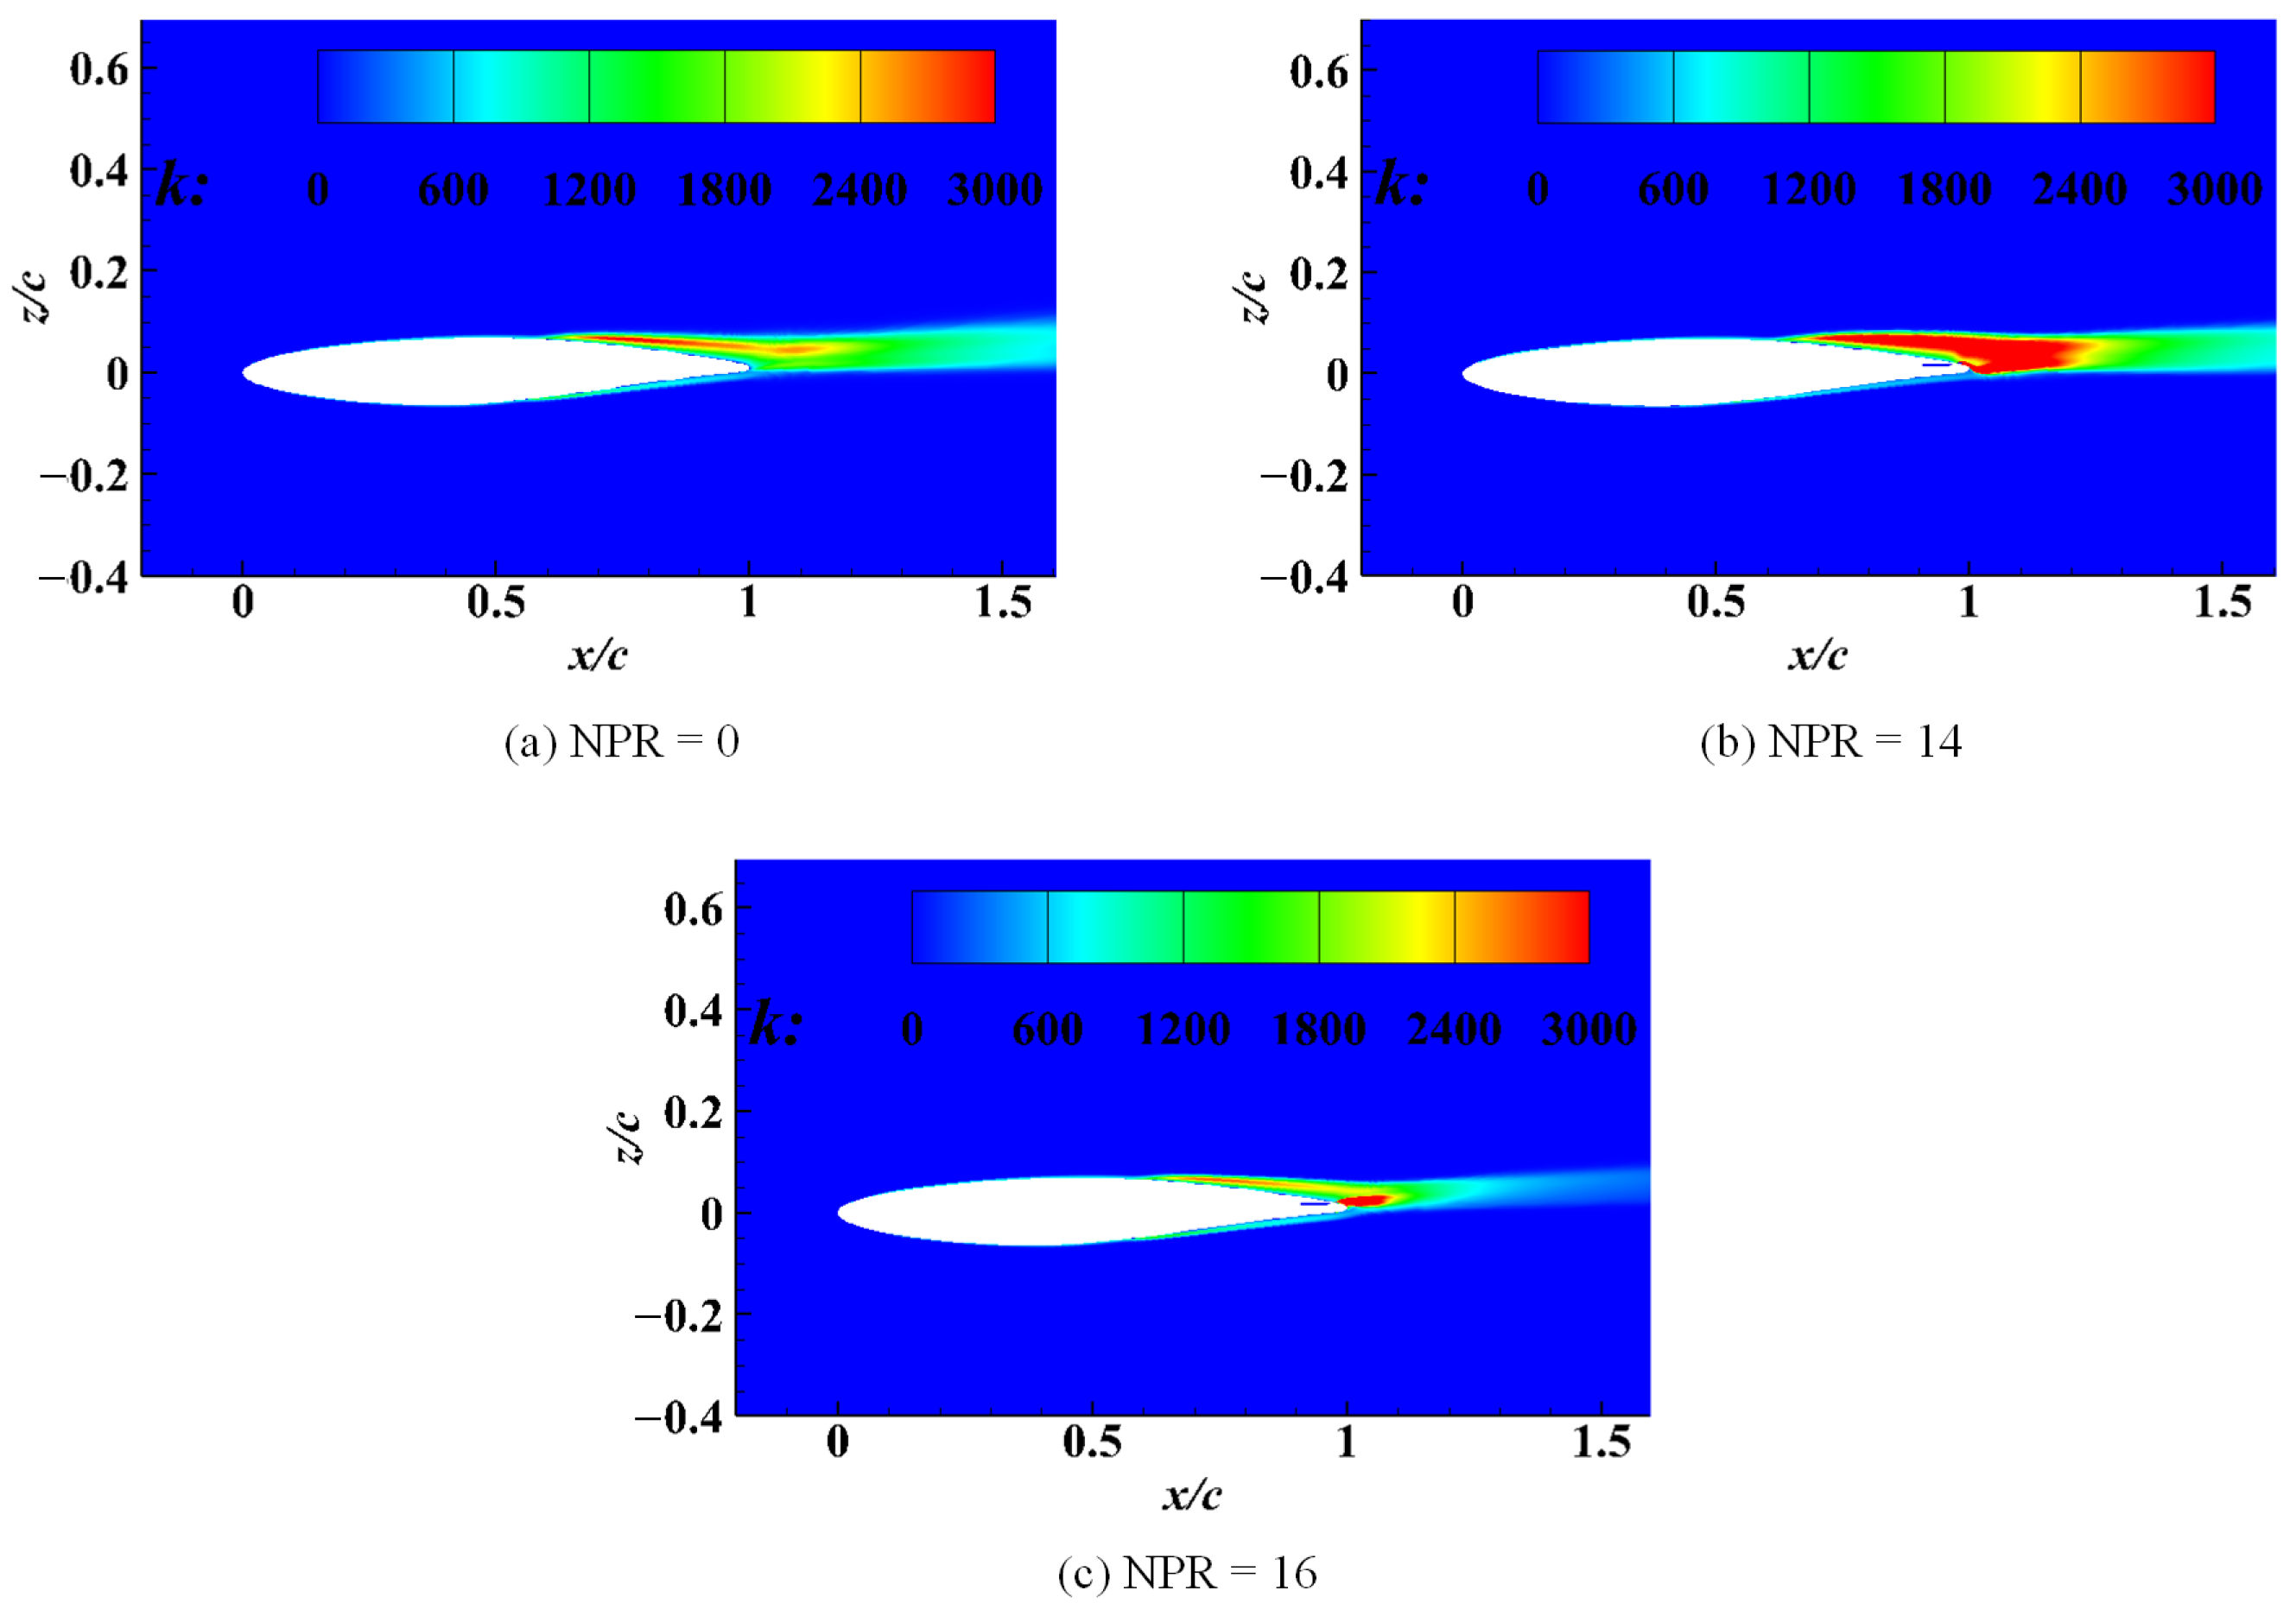
The CC jet in the incoming transonic flow affects the flow in its vicinity, which leads to a significant pressure decrease around the trailing edge. The low-pressure region of the trailing edge is mainly attributed to the local acceleration by the downstream CC jet. The mean turbulence quantities provide further insight into the flow field. The entrainment characteristics at M a = 0.8 around the airfoil are illustrated in Figure 23. A high-level TKE at the rear region of the baseline airfoil, resulting from severe flow separation downstream of the shocks, is presented in Figure 23a. At N P R = 14 , an increase in the TKE is observed in the separation region, which coincides well with pressure decrease at the trailing edge (Figure 23b). The results indicate that additional momentum offered by the CC jet re-energizes and accelerates the flow in the separation region, which eventually induces an increase in the lift coefficient. This result is consistent with the findings by Itsariyapinyo and Sharma [3] and Milholen et al. [36]. At N P R = 16 , the TKE values in the separation region are decreased when compared with the baseline (Figure 23c). These decreases may result from the flow velocity inhibition effects of the detached CC jet, which explains the aerodynamic performance degradation.

6. Conclusions

The effectiveness of CC in the transonic regime is less than that in the subsonic regime. To identify the reason for this phenomenon, the lift enhancement mechanisms related to CC in transonic flow were numerically investigated. Firstly, the CFD results were compared against the experimental data to validate the CC. The RAE2822 airfoil with the modified trailing edge was selected for the investigation of freestreams with M a = 0.3 and 0.8 at α = 3 . The flow fields generated by a series of CC jets at the trailing edge of the airfoil were compared, and the results were analyzed. The following conclusions can be drawn. The pressure coefficient on the Coanda surface and flow-field structures of the CC jet in transonic flow, including the shock structures and entrainment characteristics, are very similar to those observed in subsonic flow, emphasizing the insensitivity of the CC jet to the freestream Mach number. The insensitivity is mainly due to the similarity in the static pressure field of the trailing edge of the RAE2822 airfoil.
A shockwave on the upper surface of the airfoil is the main reason for the decreased lift enhancement by CC in the transonic regime. In this regime, the CC jet disturbances cannot propagate upstream from the shockwave, limiting its performance to the trailing edge of the airfoil. In contrast, the disturbances created by the CC jet in the subsonic regime spread more evenly throughout the airfoil. Nevertheless, the CC jet can still enhance the lift in the transonic regime by positively altering the shockwave pattern on the airfoil surfaces and accelerating the flow in the separation region by promoting momentum transfer. The lift enhancement mechanism of CC in the transonic regime was elucidated, facilitating the expansion of the utilization of this technology. Reducing the transonic drag on the aircraft may constitute a new direction for research. Furthermore, by understanding the mechanism of lift enhancement of CC in transonic regime, new fluidic actuators with high activity can be rationally designed, although it seems unlikely that CC will perform better as a high-lift technique in a transonic regime due to the different lift enhancement mechanisms. However, our subject was just a representative supercritical airfoil, and further studies remain necessary.

Author Contributions

Conceptualization, Y.C., Z.H. and Z.G.; methodology, Y.C.; validation, Y.C. and S.S.; writing—original draft preparation, Y.C., X.D., Z.G. and B.X.; writing—review and editing, Y.C. and B.X.; visualization, Y.C.; supervision, X.D. and Z.G.; funding acquisition, X.D. All authors have read and agreed to the published version of the manuscript.

Funding

This research was funded by the National Natural Science Foundation of China, grant number 52172410 and 61903369.

Conflicts of Interest

The funders had no role in the design of the study; in the collection, analyses, or interpretation of data; in the writing of the manuscript, or in the decision to publish the results.

Abbreviations

The following abbreviations are used in this manuscript:
AVTapplied vehicle technology
NPRnozzle pressure ratio
SBLIshock boundary layer interactions

References

  1. Li, Y.; Qin, N. Airfoil gust load alleviation by circulation control. Aerosp. Sci. Technol. 2020, 98, 105622. [Google Scholar] [CrossRef]
  2. Traub, L.W.; Biegner, M. Experimental evaluation of a self-contained circulation-control wing. J. Aircr. 2013, 50, 764–777. [Google Scholar] [CrossRef]
  3. Itsariyapinyo, P.; Sharma, R.N. Large eddy simulation of a NACA0015 circulation control airfoil using synthetic jets. Aerosp. Sci. Technol. 2018, 82–83, 545–556. [Google Scholar] [CrossRef] [Green Version]
  4. Davidson, I.M. Aerofoil Boundary Layer Control Systems. U.S. Patent. Office Patent Number US3062483 A, 6 November 1962. [Google Scholar]
  5. Wetzel, D.A.; Griffin, J.; Cattafesta, L.N. Experiments on an elliptic circulation control aerofoil. J. Fluid Mech. 2013, 730, 99–144. [Google Scholar] [CrossRef]
  6. Ganesh, N.; Arunvinthan, S.; Pillai, S.N. Effect of surface blowing on aerodynamic characteristics of tubercled straight wing. Chin. J. Aeronaut. 2019, 32, 1111–1120. [Google Scholar] [CrossRef]
  7. Pugliese, A.; Englar, R. Title of Presentation. In Proceedings of the Aircraft Systems and Technology Meeting, New York, NY, USA, 20–22 August 1979. [Google Scholar]
  8. Warsop, C.; Crowther, W.J. Fluidic flow control effectors for flight control. AIAA J. 2018, 56, 3808–3824. [Google Scholar] [CrossRef]
  9. Englar, R.J. Circulation control for high lift and drag generation on STOL aircraft. J. Aircr. 1975, 12, 457–463. [Google Scholar] [CrossRef]
  10. Englar, R.J.; Huson, G.G. Development of advanced circulation control wing high-lift airfoils. J. Aircr. 1984, 21, 476–483. [Google Scholar] [CrossRef]
  11. Crowther, W.J.; Wilde, P.I.A.; Gill, K.; Michie, S.M. Towards integrated design of fluidic flight controls for a flapless aircraft. Aeronaut. J. 2009, 113, 699–713. [Google Scholar] [CrossRef]
  12. Cook, M.V.; Buonanno, A.; Erbslöh, S.D. A circulation control actuator for flapless flight control. Aeronaut. J. 2008, 112, 483–489. [Google Scholar] [CrossRef]
  13. L<i>o</i>¨chert, P.; Huber, K.C.; Ghoreyshi, M.; Allen, J. Control device effectiveness studies of a 53 swept flying wing configuration. Experimental, computational, and modeling considerations. Aerosp. Sci. Technol. 2019, 93, 105319. [Google Scholar]
  14. Warsop, C.; Crowther, W.; Forster, M. NATO AVT-239 Task Group: Supercritical Coanda based circulation control and fluidic thrust vectoring. In Proceedings of the AIAA Scitech 2019 Forum, San Diego, CA, USA, 7–11 January 2019. [Google Scholar]
  15. Williams, D.R.; Seidel, J.; Osteroos, R.; McLaughlin, T.E. NATO AVT-239 Task Group: Flight control derivatives using active flow control effectors on the ICE/SACCON UAS Model. In Proceedings of the AIAA Scitech 2019 Forum, San Diego, CA, USA, 7–11 January 2019. [Google Scholar]
  16. Miller, D.N. NATO AVT-239 Task Group: Trade study approach toward assessing prospects of active flow control on a future UAS. In Proceedings of the AIAA Scitech 2019 Forum, San Diego, CA, USA, 7–11 January 2019. [Google Scholar]
  17. Novak, C.; Cornelius, K.; Roads, R. Experimental investigations of the circular wall jet on a circulation control airfoil. In Proceedings of the 25th AIAA Aerospace Sciences Meeting, Reno, NV, USA, 24–26 March 1987. [Google Scholar]
  18. Ahmed, R.I.; Abu Talib, A.R.; Mohd Rafie, A.S.; Djojodihardjo, H. Aerodynamics and flight mechanics of MAV based on Coandă effect. Aerosp. Sci. Technol. 2017, 62, 136–147. [Google Scholar] [CrossRef]
  19. Min, B.-Y.; Lee, W.; Englar, R.; Sankar, L.N. Numerical investigation of circulation control airfoils. J. Aircr. 2009, 46, 1403–1410. [Google Scholar] [CrossRef]
  20. Keller, D.; Rudnik, R. Numerical investigation of engine effects on a transport aircraft with circulation control. J. Aircr. 2015, 52, 421–438. [Google Scholar] [CrossRef]
  21. Novak, N.; Nielsen, J. Circulation control airfoils—Past, present, future. In Proceedings of the 23rd Aerospace Sciences Meeting, Reno, NV, USA, 14–17 January 1985. [Google Scholar]
  22. Novak, C.; Cornelius, K. An LDV investigation of a circulation control airfoil flowfield. In Proceedings of the 24th Aerospace Sciences Meeting, Reno, NV, USA, 6–9 January 1986. [Google Scholar]
  23. Cornelius, K.C.; Lucius, G.A. Physics of Coanda jet detachment at high-pressure ratio. J. Aircr. 1994, 31, 591–596. [Google Scholar] [CrossRef]
  24. NTRS—NASA Technical Reports Server. Available online: https://ntrs.nasa.gov/api/citations/20050165090/downloads/20050165090.pdf (accessed on 7 September 2013).
  25. Wood, N.; Conlon, J. The performance of a circulation control airfoil at transonic speeds. In Proceedings of the 21st Aerospace Sciences Meeting, Reno, NV, USA, 10–13 January 1983. [Google Scholar]
  26. Forster, M.; Steijl, R. Numerical simulation of transonic circulation control. In Proceedings of the 53rd AIAA Aerospace Sciences Meeting, Kissimmee, FL, USA, 5–9 January 2015. [Google Scholar]
  27. Abramson, J.; Rogers, E.O. High-speed characteristics of circulation control airfoils. In Proceedings of the 21st Aerospace Sciences Meeting, Reno, NV, USA, 10–13 January 1983. [Google Scholar]
  28. Schlecht, R.; Anders, S. Parametric evaluation of thin, transonic circulation-control airfoils. In Proceedings of the 45th AIAA Aerospace Sciences Meeting and Exhibit, Reno, NV, USA, 8–11 January 2007. [Google Scholar]
  29. Forster, M.; Biava, M.; Steijl, R. Multipoint optimisation of Coanda surfaces for transonic circulation control using the adjoint method. In Proceedings of the 8th AIAA Flow Control Conference, Washington, DC, USA, 13–17 June 2016. [Google Scholar]
  30. Milholen, W.E.; Jones, G.S.; Chan, D.T.; Goodliff, S.; Anders, S.; Pack Melton, L.G.; Carter, M.B.; Allan, B.G.; Capone, F. Enhancements to the FAST-MAC circulation control model and recent high-Reynolds number testing in the National Transonic Facility. In Proceedings of the 31st AIAA Applied Aerodynamics Conference, San Diego, CA, USA, 24–27 June 2013. [Google Scholar]
  31. Rumsey, C.L.; Nishino, T. Numerical study comparing RANS and LES approaches on a circulation control airfoil. Int. J. Heat Fluid Flow 2011, 32, 847–864. [Google Scholar] [CrossRef] [Green Version]
  32. Cruz, J.; Anders, S. Assessment of an unstructured-grid method for predicting aerodynamic performance of jet flaps. In Proceedings of the 24th AIAA Applied Aerodynamics Conference, San Francisco, CA, USA, 5–8 June 2006. [Google Scholar]
  33. Wu, M.; Martin, M.P. Direct numerical simulation of supersonic turbulent boundary layer over a compression ramp. AIAA J. 2007, 45, 879–889. [Google Scholar] [CrossRef]
  34. Tong, F.; Li, X.; Yuan, X.; Yu, C. DIncident shock wave and supersonic turbulent boundarylayer interactions near an expansion corner. Comput. Fluids 2020, 198, 104385. [Google Scholar] [CrossRef]
  35. Zang, B.; Vevek, U.S.; Lim, H.; Wei, X.; New, T.H. An assessment of OpenFOAM solver on RANS simulations of round supersonic free jets. J. Comput. Sci. 2018, 28, 18–31. [Google Scholar] [CrossRef]
  36. Milholen, W.; Jones, G.; Chan, D. High-Reynolds number circulation control testing in the National Transonic Facility (invited). In Proceedings of the 50th AIAA Aerospace Sciences Meeting including the New Horizons Forum and Aerospace Exposition, Nashville, TN, USA, 9–12 January 2012. [Google Scholar]
Figure 1. Elliptical airfoil with Coanda surface.
Aerospace 08 00311 g001
Figure 2. Experimental model configuration of CCW and structured grid around the splitter plate.
Aerospace 08 00311 g002
Figure 3. Computational domain of CCW.
Aerospace 08 00311 g003
Figure 4. Comparison of C p on the midspan wing section of the unblown case ( M a = 0.3 , α = 3 ). Computational domain of CCW.
Aerospace 08 00311 g004
Figure 5. Comparisons of pressure coefficients under upper slot blowing ( M a = 0.3 and 0.8 at α = 3 ). The results for the case without slot blowing are also depicted.
Aerospace 08 00311 g005
Figure 6. Comparisons of changes in the lift coefficient ( Δ C L = C L C μ 0 C L C μ = 0 ) due to variation in C μ with upper slot blowing for M a = 0.3 and 0.8 at α = 3 .
Aerospace 08 00311 g006
Figure 7. RAE2822 airfoil with Coanda surface.
Aerospace 08 00311 g007
Figure 8. Trailing edge of the RAE2822 airfoil.
Aerospace 08 00311 g008
Figure 9. Medium mesh around the trailing edge for RAE2822 with Coanda surface ( M a = 0.3 at α = 3 ).
Aerospace 08 00311 g009
Figure 10. Influence of grid resolution for M a = 0.3 and 0.8 at α = 3 .
Aerospace 08 00311 g010
Figure 11. Lift coefficient augmentation for a range of momentum coefficients under steady conditions.
Aerospace 08 00311 g011
Figure 12. Amplification coefficient contours of the baseline model.
Aerospace 08 00311 g012
Figure 13. Pressure coefficient C p t on the Coanda surface for M a = 0.3 and 0.8 at various NPRs.
Aerospace 08 00311 g013
Figure 14. Mach number contours for M a = 0.3 (left column) and M a = 0.8 (right column) with α = 3 to characterize the jet behavior of a supersonic CC jet with increasing NPR (a) upon attachment to the reaction surface, (b) upon the formation of separation bubbles, (c) just before separation, and (d) upon full separation.
Aerospace 08 00311 g014
Figure 15. Density gradient fields of the jet along the Coanda surface.
Aerospace 08 00311 g015
Figure 16. Growth of the jet shear layers based on k × 10,000.
Aerospace 08 00311 g016
Figure 17. Turbulent kinetic energy at specific locations for N P R = 14 .
Aerospace 08 00311 g017
Figure 18. Effects of the CC jet on streamline shapes with increasing NPR for M a = 0.3 , α = 3 .
Aerospace 08 00311 g018
Figure 19. Comparison of pressure coefficients due to changes in NPR ( M a = 0.3 ).
Aerospace 08 00311 g019
Figure 20. Entrainment characteristics with increasing NPR ( M a = 0.3 ).
Aerospace 08 00311 g020
Figure 21. Effects of the CC jet on the streamline shapes with increasing NPR for M a = 0.8 at α = 3 .
Aerospace 08 00311 g021
Figure 22. Comparison of pressure coefficients due to changes in NPR ( M a = 0.8 ).
Aerospace 08 00311 g022
Figure 23. Entrainment characteristics with increase in NPR ( M a = 0.8 ).
Aerospace 08 00311 g023
Table 1. Correspondence between NPR and C μ .
NPR C μ
Ma = 0.3 Ma = 0.8
1.10.00150.0002
20.01300.0018
40.03590.0050
60.05980.0084
80.08460.0119
100.11000.0154
120.13570.0191
140.16190.0228
160.18820.0265
Publisher’s Note: MDPI stays neutral with regard to jurisdictional claims in published maps and institutional affiliations.