Article

Analytical and FEM Analyses of High-Speed Impact Behaviour of Al 2024 Alloy

by
Navya Gara
1,2,
Velmurugan Ramachandran
2 and
Jayaganthan Rengaswamy
1,*
1
Department of Engineering Design, IIT Madras, Chennai 600036, India
2
Department of Aerospace Engineering, IIT Madras, Chennai 600036, India
*
Author to whom correspondence should be addressed.
Aerospace 2021, 8(10), 281; https://doi.org/10.3390/aerospace8100281
Submission received: 30 June 2021 / Revised: 16 September 2021 / Accepted: 21 September 2021 / Published: 30 September 2021

Abstract

:
The present work investigates the impact behaviour of Al 2024-T3 alloy using FEM analysis performed through LS DYNA software. Johnson–Cookvisco-plastic model is used to study the ballistic impact resistance of target Al alloy impacted by a rigid steel cylindrical projectile. The tensile properties of Al 2024-T3 alloy reported in the literature are used to estimate the J.C. model parameters. Impact velocities within a range of 50 m/s–900 m/s of the projectile were triggered onto Al alloy target thicknesses in the range of 3.18 mm–6.35 mm. To understand the accuracy of the FEM model, an analytical model proposed by Chen et al. for blunt-nosed projectiles on the ductile targets was used to compare with the obtained residual velocities from FEM simulations. It was observed that the ballistic limit velocities have led to the highest energy absorption behaviour of the Al 2024-T3 alloy for an impact velocity of 183 m/s and a 6.35 mm target thickness. The ballistic limit velocities have increased from 97 m/s to 183 m/s for the considered thickness range of 3.18 mm–6.35 mm. The impact failure was observed to have a petalling formation with two petals for thinner targets, while a full-fledged plugging with no petal formation for the 4.00 mm and 6.35 mm target thicknesses was observed.

1. Introduction

The Al 2024 alloy is widely used in aerospace structural applications due to its high specific strength, fracture toughness, fatigue resistance, and thermal shock resistance [1]. Aerospace components such as aircraft wings, wing tension members, fuselage components, etc., require a high stiffness, fatigue resistance and surface finish which can be achieved using this alloy [2,3]. The mechanical behaviour of Al 2024 alloy is further improved by precipitate formation via solution treatment followed by ageing [4]. The precipitates undergo different transformations, such as the evolution of the Guinier–Preston–Bagaryatsky (GPB) zone, S″ and S′, that accounts for the strengthening mechanisms [5,6]. The GPB, S″ and S′ precipitates formed prior to the S phase contribute to the strength, while the S phase precipitate formation results in a decrease in strength of the Al 2024 alloy [7]. Thus, the imposed heat treatment on the alloy should strike a balance between the strength and ductility of the Al alloy. The fundamental mechanisms governing high-speed impact behaviour need to be thoroughly explored to protect the aerospace structures fabricated using Al 2024 alloy against impacts from birds, ballistics or falling debris. When a collision impact occurs, a momentum transfer between the bodies in contact takes place. This further accompanies the energy transfer between the bodies, occurring as a result of the fundamental mass–energy relation. The energy absorption behaviour of a material, in turn, depends on the failure patterns, and their mechanisms are significant for potential aerospace structural applications [8,9,10].
The Al 2024-T3 alloy undergoes plastic deformation during impact, leading to changes in the micro-structural morphologies accompanying the typical stress–strain curve. The influence of strains, strain rates and the temperature effects results in large deformations, heating, and other failure mechanisms when the Al alloy is subjected to impact loading. Additionally, the strain rate sensitivity of the material undergoing impact also affects the energy absorption characteristics [11,12]. In addition, adiabatic thermal expansion, frictional force, or viscous drag at the interface of the target and projectile results in the plastic deformation failure of the target material, and should be considered under impact load [13]. The parameters, such as the residual velocity of the projectile and the energy absorption characteristics of the target material, can be obtained upon removal of material in the form of ejected particles after the high-speed impact of projectile. The mechanisms such as spalling, petalling and plugging of target materials during impact loading are the major contributing factors to understand the ballistic limit of projectile and energy absorption characteristics of structures [14].
P. K. Jena et al. [15] studied the influence of a blunt steel projectile with diameters of 7.62 mm and 12.75 mm on the target thickness 80 mm of different aluminium alloys. They reported that, for the considered projectile diameters and for the impact velocity of 840 m/s, the petalling type of failure was predominant in the Al 2024 alloy. Perfect petalling was observed in the 7.62 mm-diameter projectile case, while a perforation with incomplete petals was observed with 12.7 mm. The anisotropic property of the Al 2024 alloy was studied by Seidt at al. [16], by subjecting the target to an impact velocity range of 190 m/s to 299 m/s. It was reported in their work that the anisotropic effect of the material plays a more crucial role in the thinner plates than the thicker plates (12.37 mm). Vuyust et al. [17] investigated the effect of varying the projectile shapes of spherical and cubical on the Al 2024 alloy target thickness of 3.175 mm for an impact velocity of 325 m/s. They reported that impact failure in the case of the spherical projectile was found to take the form of radial cracks, whereas, for the cubical projectile, the target underwent triangular plugs with petal formation. Dubey et al. [18,19] have studied the impact behaviour on 1 mm-thick cryo-rolled Al 6082-T6 alloy samples with 50% to 80% thickness reductions for an impact velocity range of 50 m/s–250 m/s with a conical-nose-shaped projectile. They reported that a 75% reduction in thickness predicted the highest ballistic limit of 81.88 m/s, while 66.66% gave the lowest value of 70.8 m/s. Maximum energy absorption was observed to be for 66.66% thickness reductions for the considered impact velocity range. Nirmal et al. [20] have investigated the impact behaviour on additively manufactured AlSi10Mg for 3 mm and 6 mm target thicknesses with hemispherical and blunt projectiles in an impact velocity range of 220 m/s–500 m/s. It was reported in their study that plugging was predominant with blunt projectiles, while a combination of plugging with petalling was observed in case of hemispherical projectiles. The ballistic limit velocities were higher for hemispherical projectiles than for blunt projectiles.
The ballistic response of the Al 2024-T3 alloy with a steel rigid projectile for low strain rates was investigated by Senthil et al. [21]. They reported that, with increasing thickness, the failure in the target was observed to vary from petalling in thinner targets to plugging in thicker targets. The number of petals slowly decreased from thinner to thicker targets for the target thicknesses ranging from 1.27 mm to 12.68 mm. Shamchi et al. [22] have reviewed the behaviour of Al clad on the Al 2024–T3 alloy with strain rate ranging from 10−3/s to 1150/s in the temperature range of 24 °C to 250 °C. They reported that the ultimate strength remains unchanged up to 100 °C, while the ultimate strength for 250 °C has led to a 15.9% reduction in dynamic tension tests. Y. Kim [23] reported a strain-rate-dependent flow curve for Al 2024 alloys for the strain rates of 0.02/s, 2/s and 10/s at 250 °C and found that stress values increased with the increase in strain rate. However, the influence of temperature at 50 °C, 250 °C, and 450 °C was found to be insignificant on the deformation of the Al alloy. They also reported that the stress values decreased as the temperature increased.
The analytical models for ballistic impact and expansion cavity models are primarily dependent on the law of conservation for mass and momentum [24,25,26]. Chen et al. [27,28] have investigated the impact of the blunt-nosed projectile on different ductile metallic materials. They demonstrated this with analytic solutions for ballistic impact with the ejection of cylindrical shear plug. They accounted the plate bending, membrane stretching and local indentation in the target by considering the dynamic cavity model. Walker et al. [29] have studied the ballistic performance of metallic targets with a long, deformable rod. The velocity gradient and the stress profile proposed by them were found to be radial, with a decreasing trend away from the interface of the projectile and target. The estimation of the deceleration by considering the nested elastic plastic regions is most accepted expanding cavity model. Forrestal et al. [30,31] have analysed the penetration depth on Al 6061 alloy targets using rigid, long rods with an ogive nose. They developed closed-form penetration depth equations with different nose shapes for an impact velocity range of 0.4 m/s to 1.4 km/s.
Furthermore, with the advances in computational engineering, finite element modelling offers a remarkable insight into physical phenomena. An analytical understanding of the realistic problems from the graphical output with the given input parameters is still a key focus area of research in impact engineering [32,33]. This could be aided by performing ballistic numerical simulations for probable combinations of inputs, such as material properties, boundary conditions, contact at the interface, element size and type used, etc., that would affect the key parameters such as instantaneous stress, residual velocity of projectile, energy absorption characteristics of the target, failure mechanisms involved by the target, etc., which result from ballistic impact simulations. The accuracy of material property data has a huge influence on the deformation characteristics of the materials under impact load [34,35].
Previous studies have extensively investigated the impact behaviour of the Al 2024-T3 alloy for low impact velocities [21] of up to 305 m/s. In reality, the impact velocities could be higher in space due to the insignificant air drag and other frictional forces. The literature available on ballistic response of the Al 2024 alloy is scarce. Hence, it is essential to understand the impact behaviour of Al alloy under higher strain rates conditions.
The present study is focused to understand influence of the strain, strain rate and the thermal softening effect, using Johnson–Cook plasticity model (J.C. model), on the various target material thicknesses when it is subjected to different impact velocities of projectile. Materials parameters and damage parameters in J.C. model were estimated using the tensile properties and fracture toughness of Al 2024-T3 alloys reported in the literature [
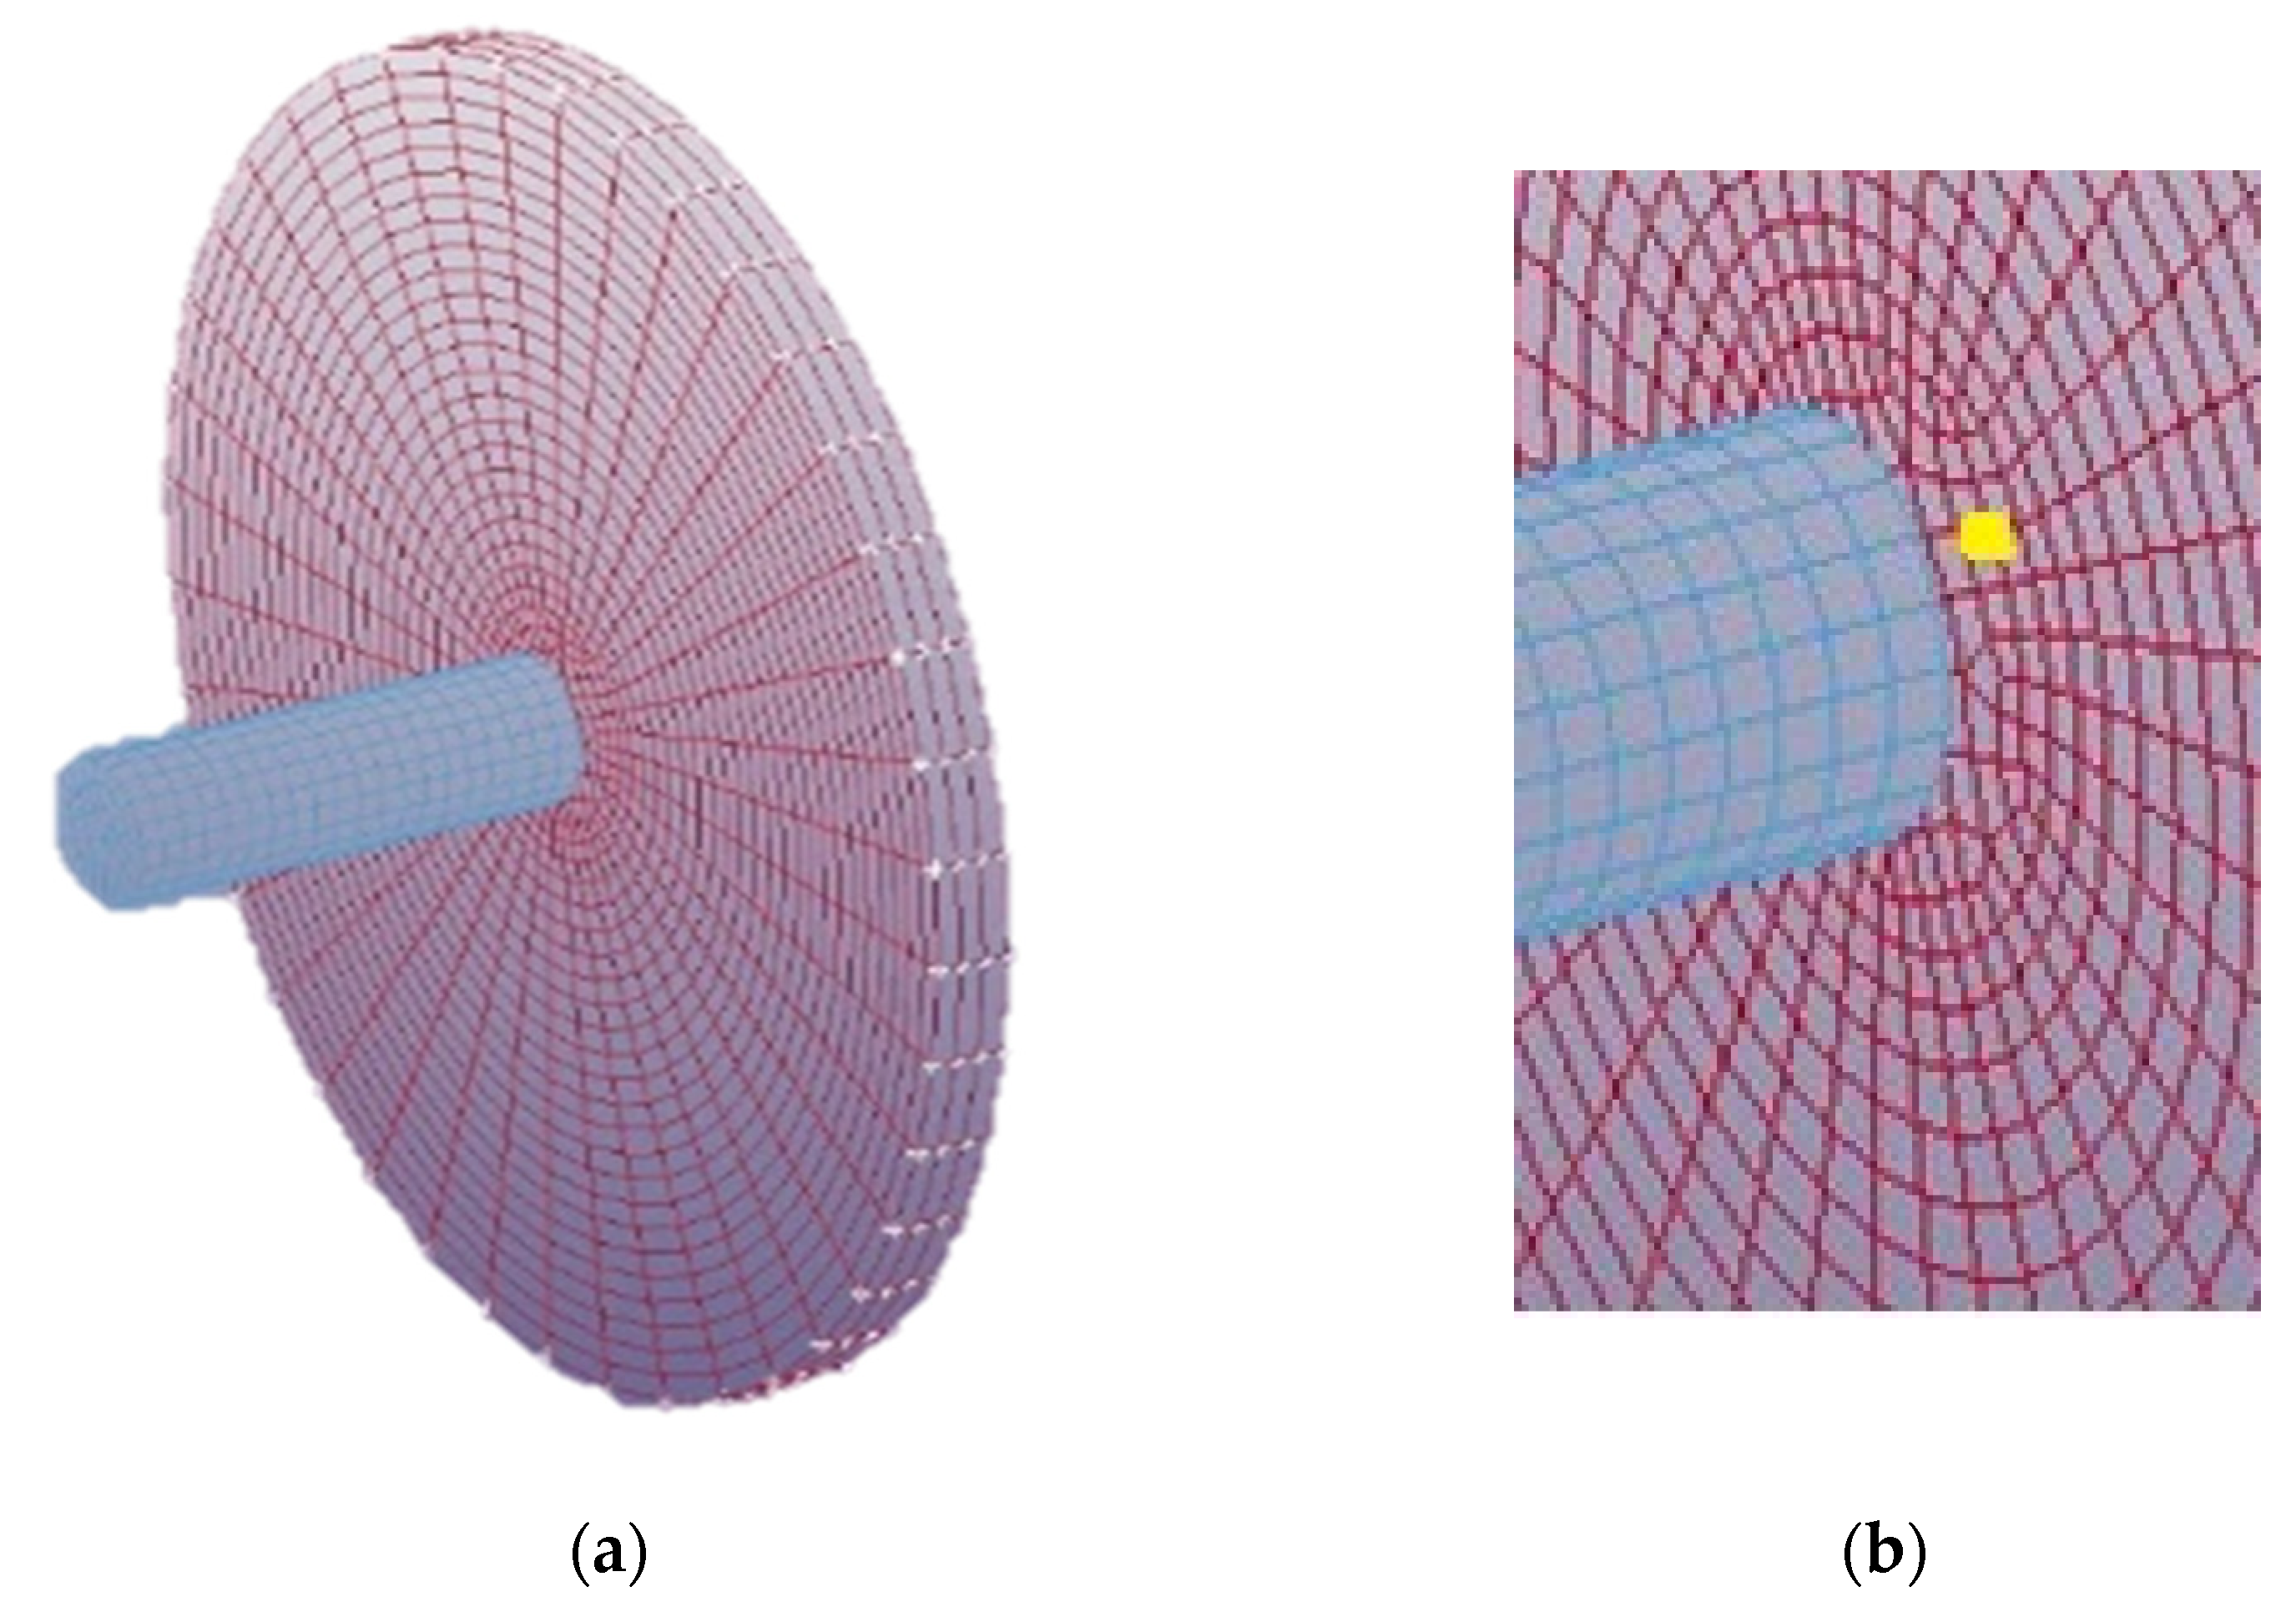
2]. These parameters were subsequently used to perform impact simulation using LS DYNA software. The simulation deals with failure in the target (Al 2024-T3 alloy) adopting complete element erosion of the target elements. The target is a disc-shaped geometry, whereas the steel projectile is a cylindrical geometry with blunt nose shape. An eroding surface-to-surface contact is implemented between the target and projectile. The projectile is triggered on to the target with a velocity range of 50 m/s–900 m/s (strain rate in the order of 7895/s). Hexahedral elements are adopted for both target and projectile. The energy absorption characteristics of target and the corresponding residual velocities of projectile for the different target thicknesses varying from 3.15 mm, 4.00 mm and 6.35 mm are studied. The residual velocities of the projectile thus obtained from the simulation studies have been verified and validated with the well-established mathematical model proposed by Chen et al. [27,28] for a range of 50 m/s–900 m/s. The methods such as meshing, solver settings and material settings have been finalised/confirmed only after the state variables such as residual velocity ballistic limit velocity were found to be in agreement with the results obtained from the well-established analytical model. Additionally, the model has been compared and validated with the previously reported experimental results pertaining to Al 2024 –T3 alloy in the velocity range of 50 m/s–305 m/s for the considered target thicknesses. So, it can be inferred that the simulation model would be in conformance with the experimental results. Additionally, it can be considered as a substitute for experimental studies, as the modelling studies can be implemented easily for any structure with different boundary conditions and for different velocities and loads without significant effort.

2. Constitutive Modelling

The accuracy of the Finite Element model depends primarily on the choice of the constitutive models adopted to arrive at the best design and quality parameters. The constitutive model for the projectile impact on target material is a complex phenomenon and hence it is necessary to consider the maximum fit parametric (strain, strain rate, temperature, time) model along with inelastic effect of the target when it is subjected to impact load. To account for the plastic deformation effects, modified Johnson–Cook model is preferred. Among the 276 material models available in LS DYNA, 60 models are related to various materials constitutive behaviour [36]. The modified Johnson–Cook model is used as it accommodates the strain, strain rate effects and temperature influence on the ductile target material undergoing impact. In ballistic impact, target is expected to undergo plastic deformations and, therefore, the MAT_107 Modified_Johnson_Cook Model is considered in the present study.

2.1. Modified Johnson–Cook Model

The large-scale deformation behaviour of metallic material behaviour under high strains, high strain rates and temperature is essential to establish their flow curve and failure mechanisms under impact load. The elementary relation of J.C. model is exhaustive in nature with the incorporation of above parameters [37]. The stress as a function of strains, strain rate and temperature constitute the material constants such as A, B, C, n and m as given in Equation (1).
σ ( ε p l , ε ˙ p l , T * ) = [ A + B ( ε p l ) n ] [ 1 + C l n ( ε ˙ p l ε ˙ 0 ) ] [ 1 T * m ]
where   σ ( ε p l , ε ˙ p l , T * )   is equivalent stress, ‘A’ is the yield stress of the material (MPa), ‘B’ is a strain hardening constant (MPa), ‘C’ is the strain rate strengthening coefficient, ‘n’ is the strain hardening coefficient, ‘m’ is thermal softening coefficient and   T * = T T 0 T m e l t T 0 and T 0 T     T m e l t with T * as homologous temperature, T m e l t as melting temperature, T 0 as reference temperature, T is temperature at which experiment is carried out. The reference strain rate ε ˙ 0 is taken as 1/s.
When the material is subjected to plastic deformation, the material tends to fracture after attaining ultimate strength. Fracture leads to breakage of materials apart and it becomes predominant when the material is subjected to dynamic loading. The damage for the individual element is computed and a cumulative damage as given in [38] is expressed in Equation (2).
D =   Δ ε ϵ f  
where Δ ε is the incremental plastic strain and ϵ f is the strain to fracture for a particular strain rate, temperature, pressure and equivalent stress.
The general expression for the fracture strain is given by Equation (3).
ϵ f   = [ D 1 + D 2 exp D 3 ( σ m σ e q ) ] [ 1 + D 4 l n ( ε ˙ p l ε ˙ 0 ) ] [ 1 + D 5 T * ]
where σm is the mean stress and σeq is the equivalent stress. D1 to D3 are related to tension, D4 is related to effect of strain rate and D5 is for the effect of temperature.

2.2. Determination of Johnson–Cook Material Parameters

In the Section 2.2 and Section 2.3, the performed simulation studies used to obtain the J.C. material and damage parameters are described.

2.2.1. Determination of Parameter B and n

Tensile test simulations were carried out with the known Engineering stress–strain graphs obtained from the experiments as reported by Lesuer et al. [2] for Al 2024-T3 alloy. The methodology to determine the parameters of the Johnson–Cook Model is followed, as reported in the literature [39]. The tensile true stress–strain values thus calculated, as shown in Table 1, are used to estimate the Johnson–Cook material and damage parameters. To evaluate the parameters B and n, plastic stress–strain values are plotted, and a linear regression technique is implemented using MATLAB.
The shape and dimensions of the specimen for carrying out tensile testing have been obtained from N. K. Gupta et al. [33]. The simulation study was carried out at a room temperature of 298K and reference strain rate of 1/s based on stress–strain plot reported in the literature [2]. The density of the material is 2710 kg/m3, Poisson’s ratio is 0.33 and the Elasticity modulus is 71 GPa. With the known yield stress value—A = 265 MPa, B and n parameters are estimated. Neglecting the strain rate and temperature effect, the J.C. model Equation (1) has been reduced to Equation (4).
  σ e q = A + B ε n  
Rearranging the terms and considering the logarithm on both sides, the equation is as follows:
  l n ( σ e q A ) = l n   B + n   l n   ε  
The equivalent plastic stresses and strains hence obtained are depicted in Figure 2, with ln( σ e q − A) on Y-axis and ln( ε ) on X-axis. The data obtained, thus, are curve-fit through linear regression to obtain a correlation coefficient (R2) of 0.988. Equation (6) is the expression resulted from the regression.
  l n ( σ A ) = 0.34 ln ( ε ) + 6.056  
With the slope as the parameter ‘n’ and from the intercept, B can be estimated as n = 0.34 and B = 426.66 MPa, as shown in Figure 1.

2.2.2. Determination of Parameter C

To estimate the parameter ‘C’, Al 2024-T3 alloy simulations were made for 10/s, 1/s and 0.1/s. The 1/s experimental data that has been obtained from literature [2] is utilized to obtain data for higher strain rates simulation on LS DYNA software. On the basis of the expression with strain rate as a function of velocity and the gauge length S t r a i n R a t e ( ε ) ˙ = δ l ( c h a n g e i n l e n g t h ) l e n g t h o f s p e c i m e n t i m e = V e l o c i t y l e n g t h o f s p e c i m e n , the velocity has been varied to achieve higher strain rates.
Thus, the J.C. Model Equation (1) is modified as:
σ ( ε p l , ε ˙ p l , T * ) = [ A + B ( ε p l ) n ] [ 1 + C l n ( ε ˙ p l ε ˙ 0 ) ]  
Rearranging the terms, Equation (7) can be rewritten as:
σ [ A + B ( ε p l ) n ] = [ 1 + C l n ( ε ˙ p l ε ˙ 0 ) ]  
The plastic stress–strains are plotted for the various strain rates considered and a linear regression curve was plotted and found the C value to be 0.016, as shown in Figure 2.
Further, for higher strain rates, SHPB simulation tests were performed with the incident, transmission and striker bars made of steel. The incident and transmission bars were 1500 mm in length with 16 mm diameter, as shown in Figure 3. The size of the specimen considered was 0.2 mm length with 10 mm diameter with slenderness ratio (length/diameter) maintained between 0.5 and 0.8.The velocity of the striker bar was maintained at 11.1 m/s [40].
The calculated true stress–strain values were utilized from [41], as shown in Table 2, for strain rates in the order of 2220/s and 4500/s, as input into the simulations.
It was observed a very minor change in the slope for the data points obtained drawn between σ [ A + B ( ε p l ) n ] v/s ln( ε ˙ ) of 0.00197. It is in tandem with the data reported in the literature [42], that Al 2024 alloy has shown very slight influence of strain rates for the same temperature considered.

2.2.3. Determination of Parameter m

For determining the parameter m related to different temperatures, the stress–strain curves of Al 2024-T3 alloy at Room temperature, 150 °C, 250 °C and 350 °C are considered. These tests as reported by Coskun et al. [43] were carried out in the quasi-static regime. The stress–strain curves were converted as true stress–strain curves and are fed to LS DYNA software to initiate the plasticity of the material for the temperatures considered. Equation (1) is rearranged ignoring the strain rate effect as given in Equation (9). Thus, a plot between   l n ( T * ) and l n [ 1 σ e q [ A + B ( ε p l ) n ] ]   is made to obtain the value of m.
σ e q = [ A + B ( ε p l ) n ] [ 1 T m ]  
σ e q [ A + B ( ε p l ) n ] = [ 1 T m ]
Rearranging Equation (10) and taking natural logarithm on both sides, we obtain:
m   l n ( T * ) = l n [ 1 σ e q [ A + B ( ε p l ) n ] ]  
Substituting the values of A, B and n in Equation (11), we obtain ‘m’. Thus, the value of m obtained is 1, by calculating the slope of Equation (11).This could be inferred from Figure 4.

2.3. Determination of Johnson–Cook Damage Parameters

2.3.1. Determination of Parameters D1, D2 and D3

The stress state developed on the material due to fracture is primarily assessed using stress triaxiality. To estimate the damage parameters, notched specimen of different radii is modelled and simulated for the study in LS DYNA software. The literature suggests that there are notch radii and thickness areas on the specimen. The specimen was subjected to the ductile damage failure in LS DYNA, with the values depicted in Table 1 as inputs. Three specimens were considered with varied notch radii of 2.00 mm, 3.00 mm and 4.00 mm along with the un-notched specimen. The fracture strain is obtained from the simulations carried out on tensile stress–strain of the un-notched specimen.
An empirical relation was formulated by Bao and Coworker to evaluate the stress triaxiality knowing the thickness of notched area, t and radius of notch, R [44].
η = 1 3 + 2 l n ( 1 + t R )
Fracture strain(εf) = 0.074, stress triaxiality = 0.33 and strain rate = 1/s are considered for analysis. Thus, by plotting equivalent plastic strain (PEEQ) with respect to each triaxiality ratio, and drawing a nonlinear regression curve, we obtained D1, D2 and D3 parameters by ignoring the strain rate and temperature effect of Equation (3).
The nonlinear regression was of the form [ D 1 + D 2 exp D 3 ( σ m σ e q ) ], by obtaining the coefficients, the damage parameters are obtained, as shown in Figure 5.
Thus, D1 = 0.013, D2 = 0.013 and D3 = −1.5.

2.3.2. Determination of Parameters D4

D4 parameter is corresponding to the strain rate effect of the specimen. A dynamic specimen of 35 mm length is considered with true stress–strain data at the 1/s strain rate. The simulations were carried out for different strain rates such as 10/s, 50/s and 100/s. A linear regression curve was drawn between ϵ f [ D 1 + D 2 exp D 3 ( σ m σ e q ) ] and the logarithm of strain rates to obtain the slope as parameter D4. All the simulations inputs were considered at 298 K.
Here, the Y intercept in Equation (13) is considered as 1 to obtain the linear equation form.
ϵ f [ D 1 + D 2 exp D 3 ( σ m σ e q ) ] = 1 + D 4 l n ( ε ˙ * )    
Thus, D4 = 0.011 is obtained by carrying out a linear regression at various strain rates, as shown in Figure 6.

2.3.3. Determination of Parameters D5

This parameter is with respect to temperature of the notched specimens considered. The basic Equation (14) turns to Equation (15).
ϵ f = [ D 1 + D 2 exp D 3 ( σ m σ e q ) ] [ 1 + D 4 l n ( ε ˙ p l ε ˙ 0 ) ] [ 1 + D 5 T * ]  
and
( 1 ϵ f [ D 1 + D 2 exp D 3 ( σ m σ e q ) ] ) T * = D 5
The finite element simulations were carried out for different temperatures of 423 K, 523 K and 623 K. The T * values were 0.21, 0.378 and 0.546 for the corresponding temperatures of 423 K, 523 K and 623 K. With the calculated damage parameters (D1, D2 and D3) and T * , in Equation (15), D5 was found to be negligible and, thus, was considered as 0.
All the obtained J.C. Material and damage parameters are tabulated, as shown in Table 3.

3. Numerical Simulation of Impact

The three-dimensional modelling of Impact behaviour of Al 2024-T3 alloy was carried out in LS DYNA software. The model consisted of a steel blunt projectile with 12.7 mm diameter and a length of 40.25 mm. It was considered as rigid with a total mass of 39.5 gms as projectile density is much higher than the target density. Hence, MAT_ RIGID from the LS DYNA Keyword Manual was accounted for rigidity of the projectile. Al 2024-T3 alloy with a circular disc of diameter 114 mm was considered as target. Several simulations were carried out by varying thickness of the target ranging from 3.18 mm to 6.35 mm in order to understand the influence of thickness on the residual velocity, energy absorption characteristics. Additional simulations were performed by varying the parameters such as m, n and C of the J.C. model in order to understand their influence on the impact phenomenon. MAT_107 Modified_Johnson_Cook Model from LS DYNA keyword manager was considered to account for the large deformations of target. The material properties of the target and projectile are shown in Table 4.
As an impact is expected with the projectile striking the target, a contact is established between the steel projectile and Al alloy target. As the projectile nose is blunt, a ‘Eroding_Surface_ To _Surface’ contact is considered from the keyword manual of LS DYNA with deformable target as master and rigid projectile as slave. The boundaries of the target are fixed at the periphery. The projectile which is a rigid body was allocated variable velocities in the range 50 m/s–900 m/s in order to ensure the momentum and energy transfer occurs from the projectile to target.
A structured mesh was constructed with higher density at the centre of target and gradually grown towards periphery of the target, as shown in Figure 7a. The higher mesh density placed at the centre of the target is to capture the stresses effectively at the region of contact and impact. However, the mesh density reduces towards the boundaries as the propagation of the impact wave is expected to be damped towards the boundary. This was observed in the simulations as well. Material failure depicting plugging, petalling, and spalling was incorporated by using the complete element erosion feature of the software.
Hexahedral elements were chosen for both projectile and target as a uniform distribution in the plate from the centre to boundary was desired. The density of the mesh has been finalized after performing mesh independent study by monitoring the Von Mises stress at the point depicted in Figure 7b for varied mesh densities. The monitoring point was considered 1 mm away from the area of deformation. A mesh size of approximately 0.01 mm at the impact region of the target is found to be optimal, as shown in Figure 8.
A Summary of computational details used for each of finite element model with reference to their thicknesses is provided in Table 5.

4. Analytical Model

The penetration of the blunt projectile into Al 2024 alloy target would result in the cylindrical cavity. Chen et al. [27,28] has shown a systematic analysis of the shear plugging of ductile metallic targets with a blunt projectile. They utilized the rigid plastic analysis by considering the effects of bending, shear and plate stretching. Dynamic cavity model was reported for representing the penetration of the target.
A blunt projectile of mass ‘M’ and diameter ‘d’ was triggered on to a circular ductile target of thickness ‘H’ and diameter ‘D’.σy and ρ are yield stress and density of the target material parameters, respectively. The analysis is based on the fact that the formation of circular plug occurs at the centre. The ejection of the plug is due to the total compressive force on the projectile being converted to the plastic shear force on the target face. The dimensionless constants with respect to the thickness, χ and mass, η at the interface of the projectile and target are depicted as in Equations (16) and (17):
χ = H d
and
η = ρ π d 2 H 4 M
The ballistic velocity, VBL and the residual velocity, Vr are calculated from Equations (18)–(20):
  V B L = 2 2 χ ( 1 + η ) ( η + ϑ ) 3 σ y ρ
and
V r = ϑ V i + η V i 2 V B L 2 ( 1 + η ) ( η + ν )
where Vi is the Impact velocity of the projectile and υ is a dimensionless parameter in relation to plate thickness and diameter.
ϑ = { 3 ( 1 3 χ ) ( 1 + η ) 2 ( 2 ξ d 1 ) ( ξ d + 1 )   ,   χ 1 < χ < 1 3 [ ( D d ) 2 1 ( D d + 1 ) 2 + 2 ] 3 ( 1 3 χ ) ( 1 + η ) 2 ( D / d 1 ) ( D d + 2 )   ,   1 3 [ ( D d ) 2 1 ( D d + 1 ) 2 + 2 ] χ < 1 3 }
with ξ as a bending hinge in the shear zone.
The assumptions in this model and those considered in our study such as the rigid steel projectile, a cylindrical nose projectile striking a ductile metallic target with the formation of cylindrical cavity formation forms the coherency in considering this analytical model. Thus, the study was further implemented in a mathematical tool, MATLAB, for the calculations for various thicknesses considered and for different impact velocities chosen. The obtained residual velocities from the analytical model are compared to that obtained from simulations.

5. Results and Discussion

Three thicknesses for the target, 3.18 mm, 4.00 mm and 6.35 mm, were considered during impact simulation. Impact velocities for the range 50 m/s–900 m/s were implemented with an incremental step of 50 m/s. The residual velocity of the projectile is considered for evaluating energy transfer from projectile to the target material. This residual velocity is calculated based on the velocity with which the projectile would leave the target surface after impact. The ballistic limit is also found for a particular range of velocities and their corresponding thicknesses, so that the projectile either rebounds or penetrates without complete perforation.
For 3.18 mm-thick target, it was impacted with impact velocity range 50 m/s–900 m/s. The projectile was found to cease its motion through the target at a ballistic limit velocity of 87.30 m/s. The difference between the impact velocity and residual velocity was found to increase from 900 m/s to 87.30 m/s. This is because of the less momentum transfer due to the lesser contact duration at higher impact velocities. Thus, at lower velocities, especially the ballistic limit velocity has the highest velocity difference. However, the literature [41] reported a ballistic limit velocity of 88 m/s for the experimental studies performed. The residual velocity obtained through simulations for an impact velocity of 305 m/s deviates by 2.1% with respect to the residual velocity of 287.56 m/s obtained from experiments as reported by [45]. However, the relative percentage difference has reduced to 0.79% in the case of ballistic limit velocity. It can be inferred that there is a good agreement between the simulations and reported experimental results.
However, the minor deviations in the residual velocities as mentioned above may be due to the yaw angle that developed after the ejection of projectile, air friction and surface of the plate in contact during the experiments, which are not accounted for in simulations.
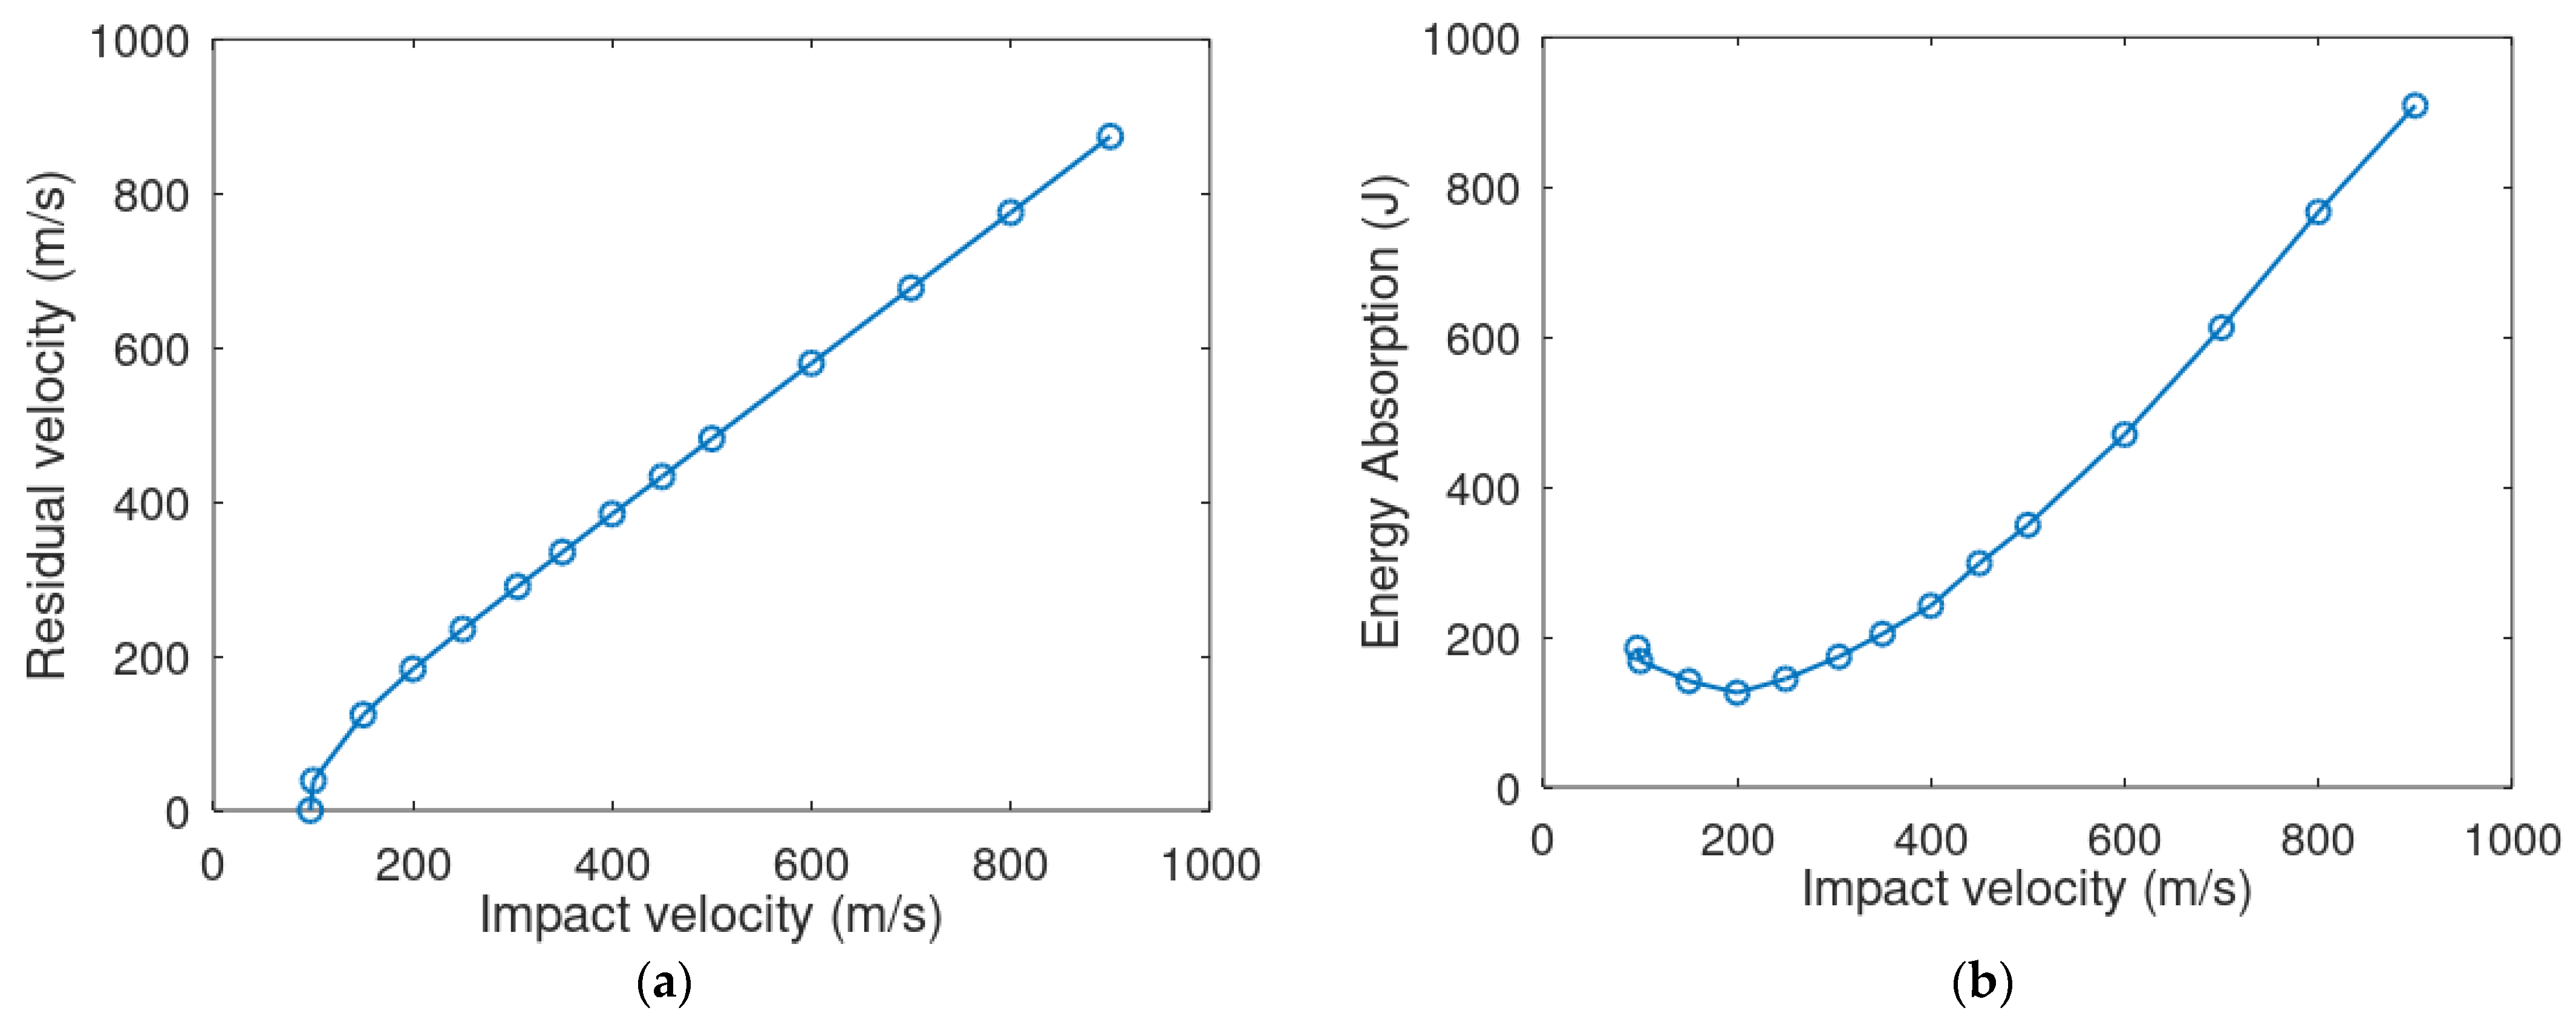
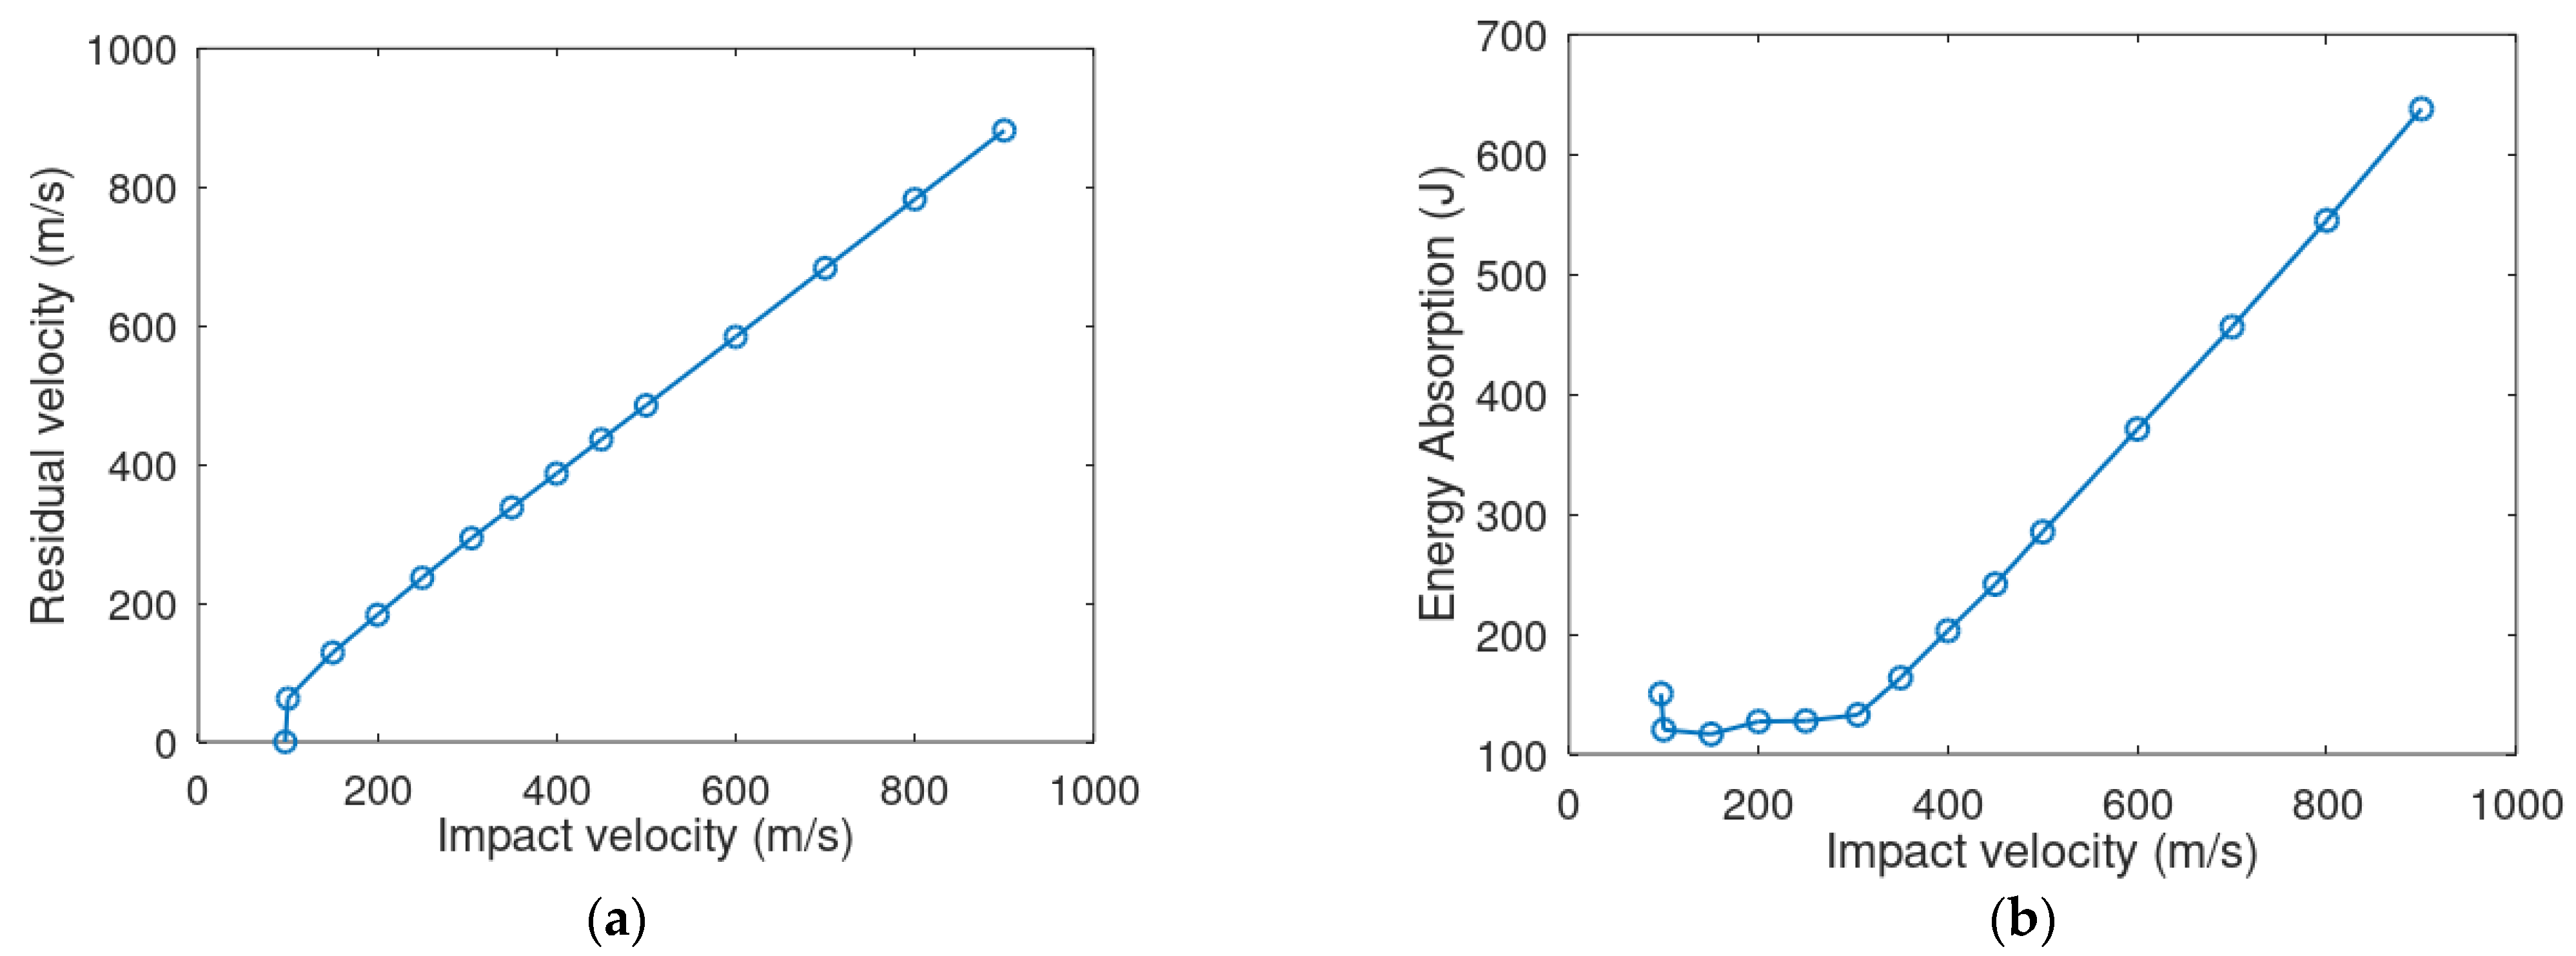
Figure 9a shows the residual velocity versus impact velocity for 3.18 mm target thickness. It was observed that with increase in the impact velocity, the residual velocity has also increased. This could be due to the less energy loss from the projectile to the target. Furthermore, the loss in energy is higher at lower impact velocities. This is due to the fact that more energy is lost from projectile to overcome the resistance offered from the target. Figure 9b shows the energy absorption versus impact velocity for 3.18 mm target thickness. The energy absorption was observed to be highest at the ballistic limit up to a velocity of 350 m/s. This is because of the impact velocity is less and the contact duration is more enabling for the target to resist further. However, with further increase in impact velocity, the Energy absorption was observed to increase linearly. This could be due to the idealizations made in the simulations such as not accounting the thermal effects, neglecting erosion of the projectile, energy unaccounted during the shearing between target and projectile and vibrational energy loss.
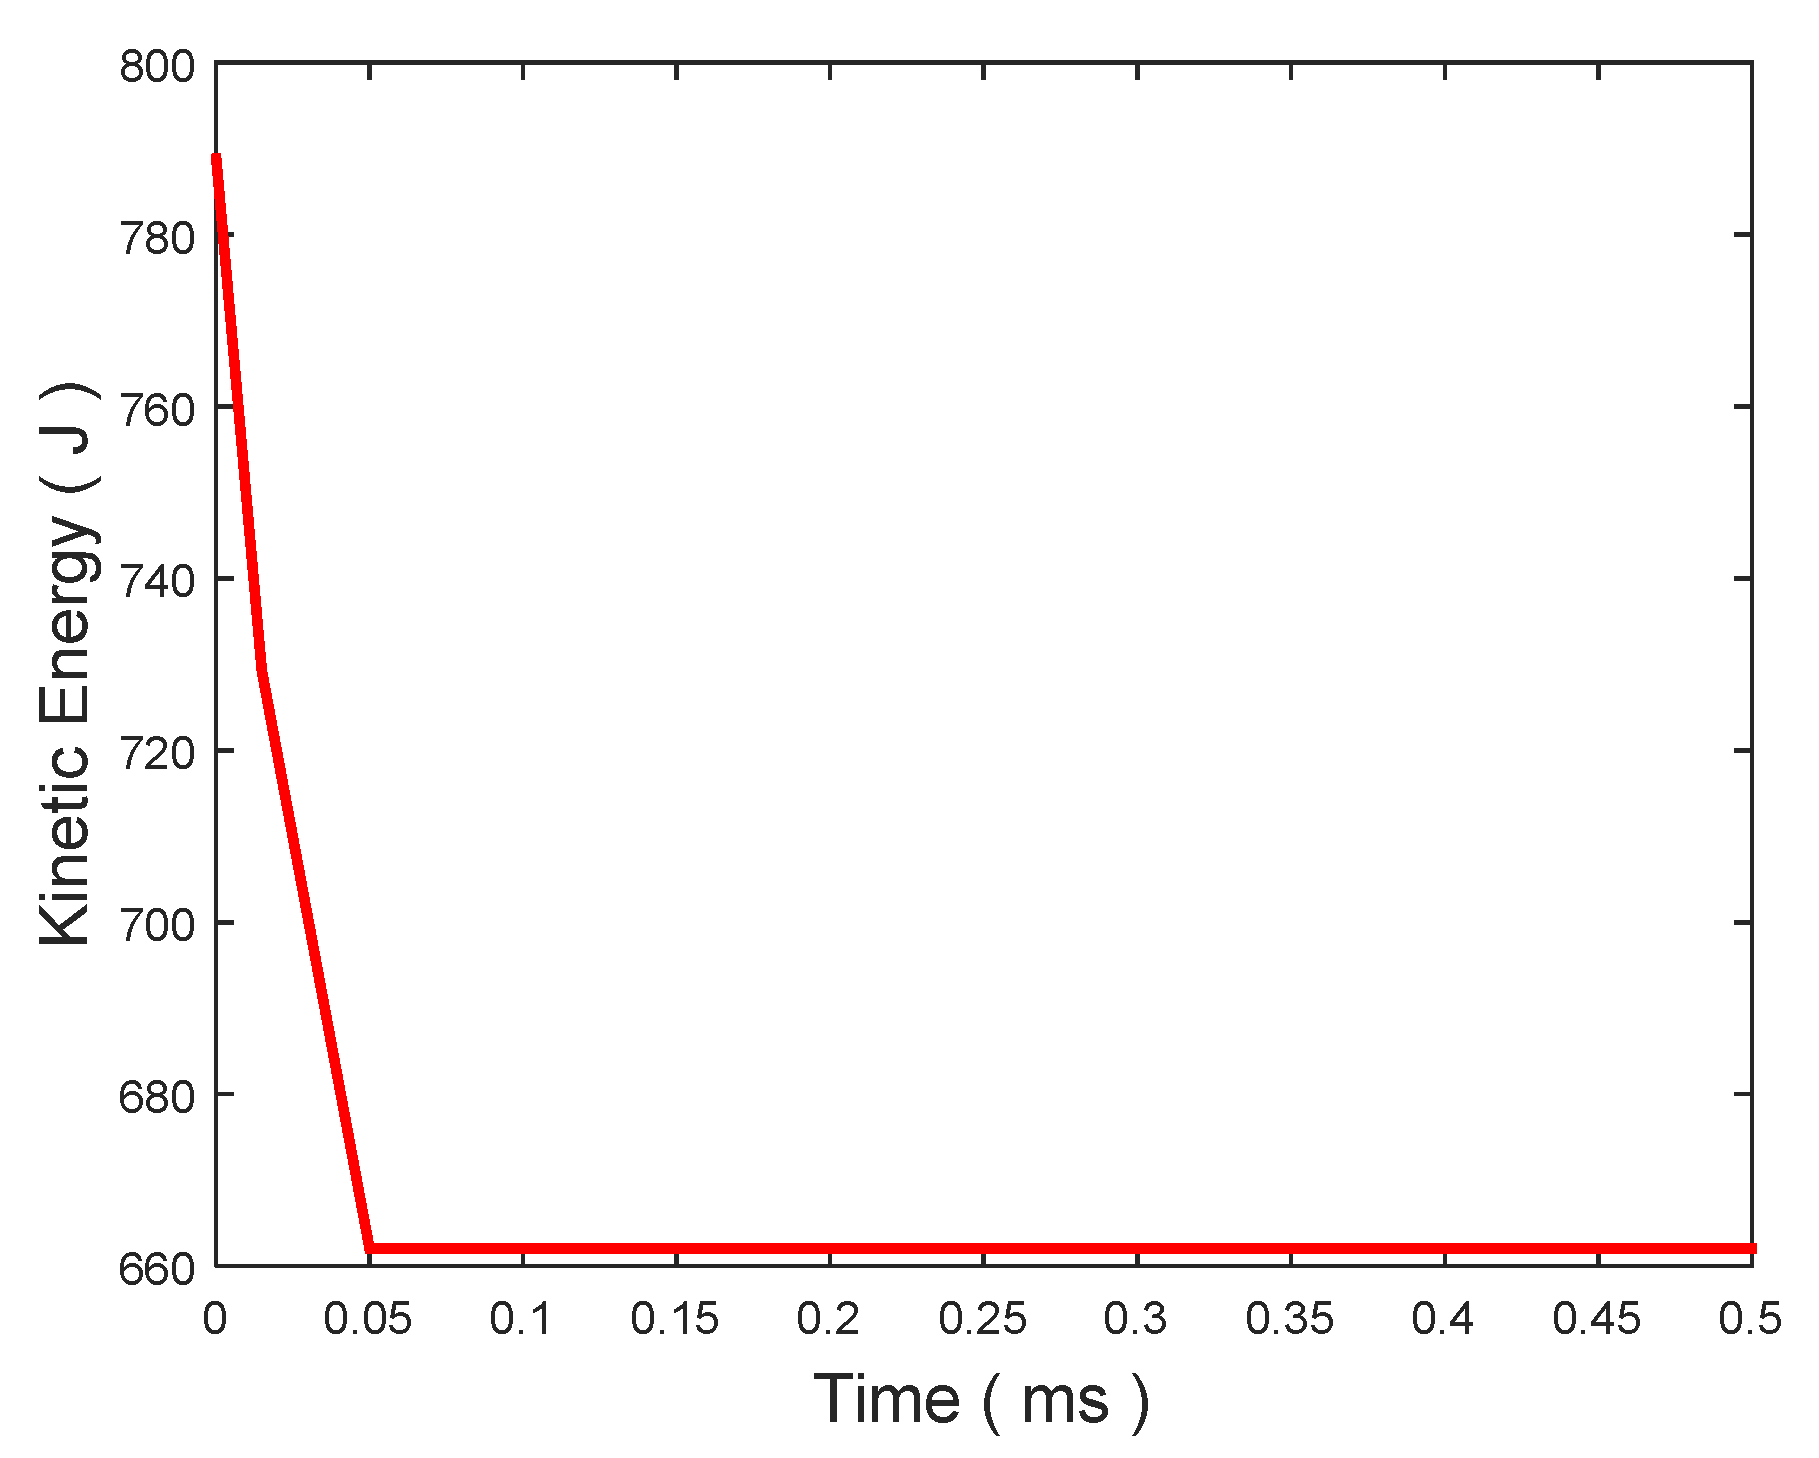
It can be observed from Figure 10 that for the impact velocity of 200 m/s, the initial energy developed is 789.36 J. However, after the impact, a constant energy of 662.07 J is recorded with a 127.29 J energy being absorbed by the target. The same energy is obtained from the fundamental energy transfer relation as shown in Equation (21).
Energy   Absorption = 1 2 m ( v I 2 v R 2 )
where E = Energy absorbed by target; m = Mass of the projectile; VI = Impact Velocity; VR = Residual Velocity
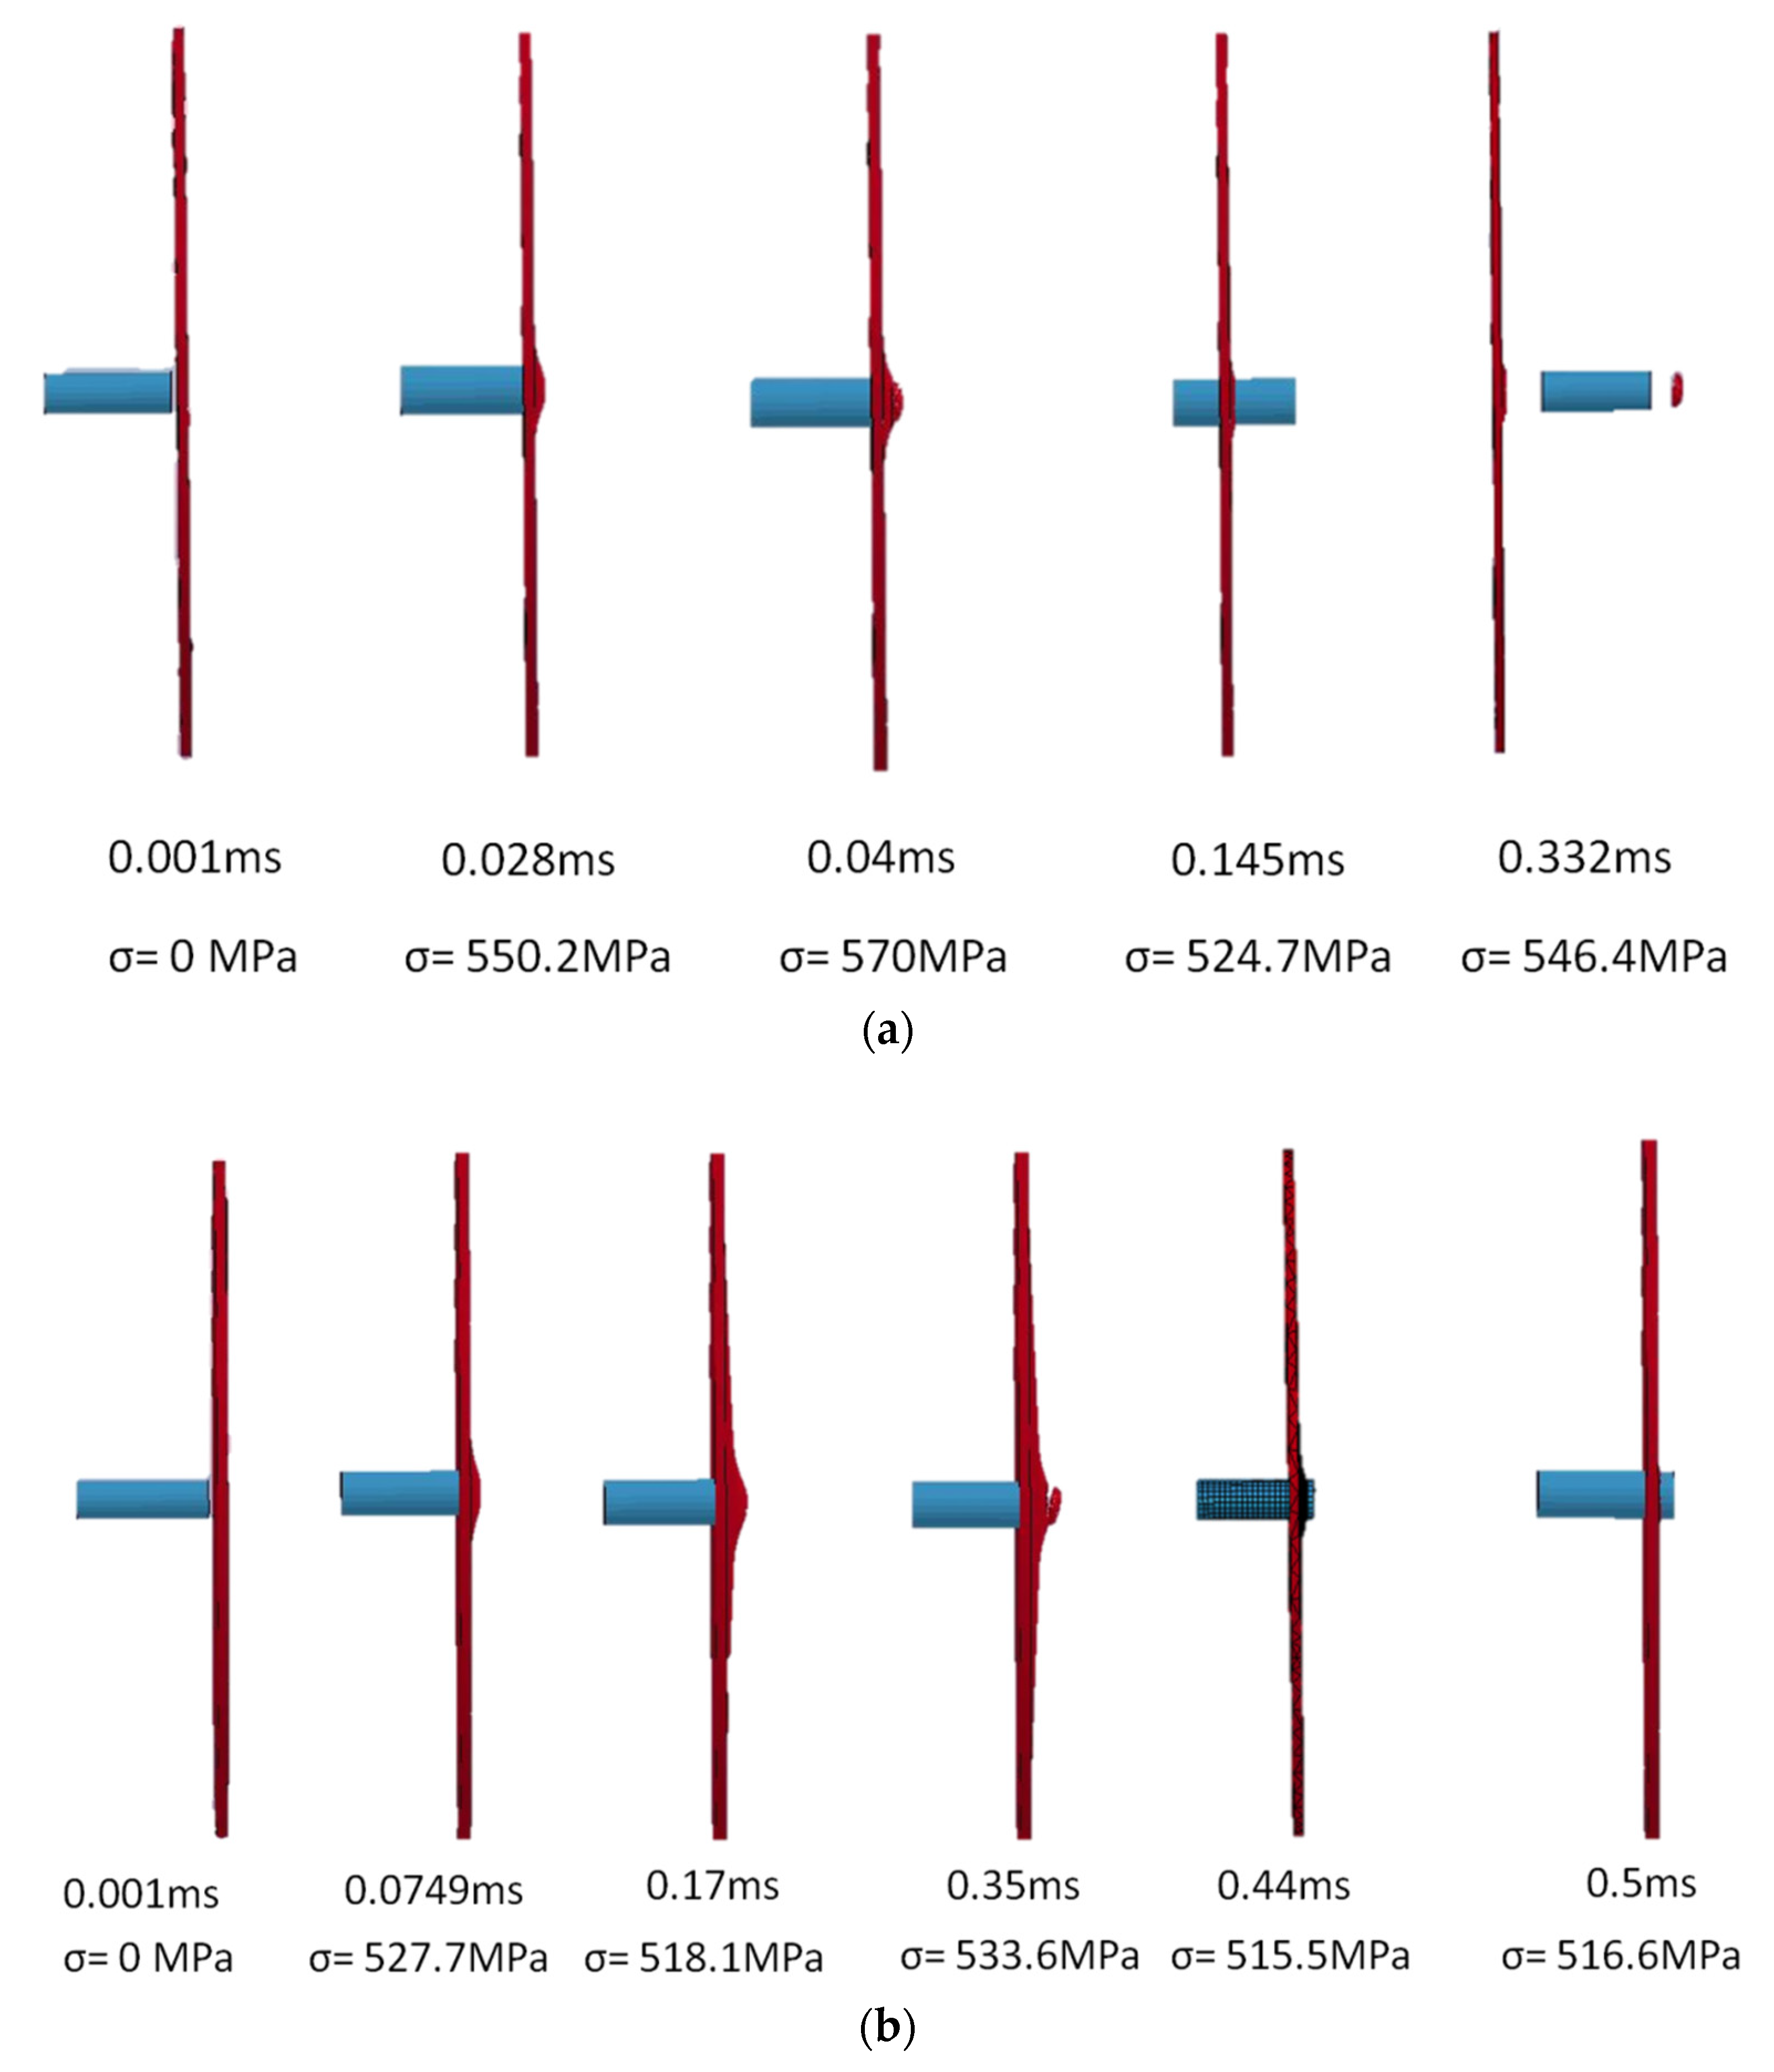
The penetration profile of the target with an impact velocity of 200 m/s of projectile for different time steps with stress values are shown in Figure 11. The projectile leaves the target with a residual velocity of 183.17 m/s. The target was observed to undergo a nominal bulging equivalent to the diameter of the projectile. A coning was formed on the plug cross section of the projectile. There was no petalling found at the interface of target and projectile during the contact. From Figure 11a, it can be observed that the stress value of 550.2 MPa is developed at an immediate time of 0.028 milliseconds and further increased to 570 MPa at 0.04 milliseconds. With further increase in time at 0.145 milliseconds, the stress has decreased to 524.7 MPa as there is no extra energy required for the hole enlargement or in overcoming the elastic stress. Further at 0.332 milliseconds and beyond, an average constant stress of 546.4 MPa is obtained probably due to settlement of the target material after a plastic flow stress.
For a ballistic velocity of 87.3 m/s, an initial small bulging in the target material is noticed, as shown in Figure 11b. With further increment in time, a small coning is initiated with a stress of 518.1 MPa. At the time of coning, the highest stress of 533.6 MPa at a time of 0.35 milliseconds was recorded, probably due to the plug formation and, thus, tearing due to the high tension created at the rear side of the target. With a further increment in the simulation time, at 0.44 milliseconds, a decreased stress of 515.5 MPa was attained due to the relaxation in the material, as no extra energy was required in tampering the target material with the release of plug from the rest of material. With any further increase in time, the projectile did not move further and, thus, penetrated. The stress almost remained constant at 515 MPa, implying the material is purely relaxed with some permanent deformation in the target material. The residual velocity for the impact velocity of 87.3 m/s was observed to be −1.92 m/s—almost clogged, thus, it was considered to be the ballistic limit.
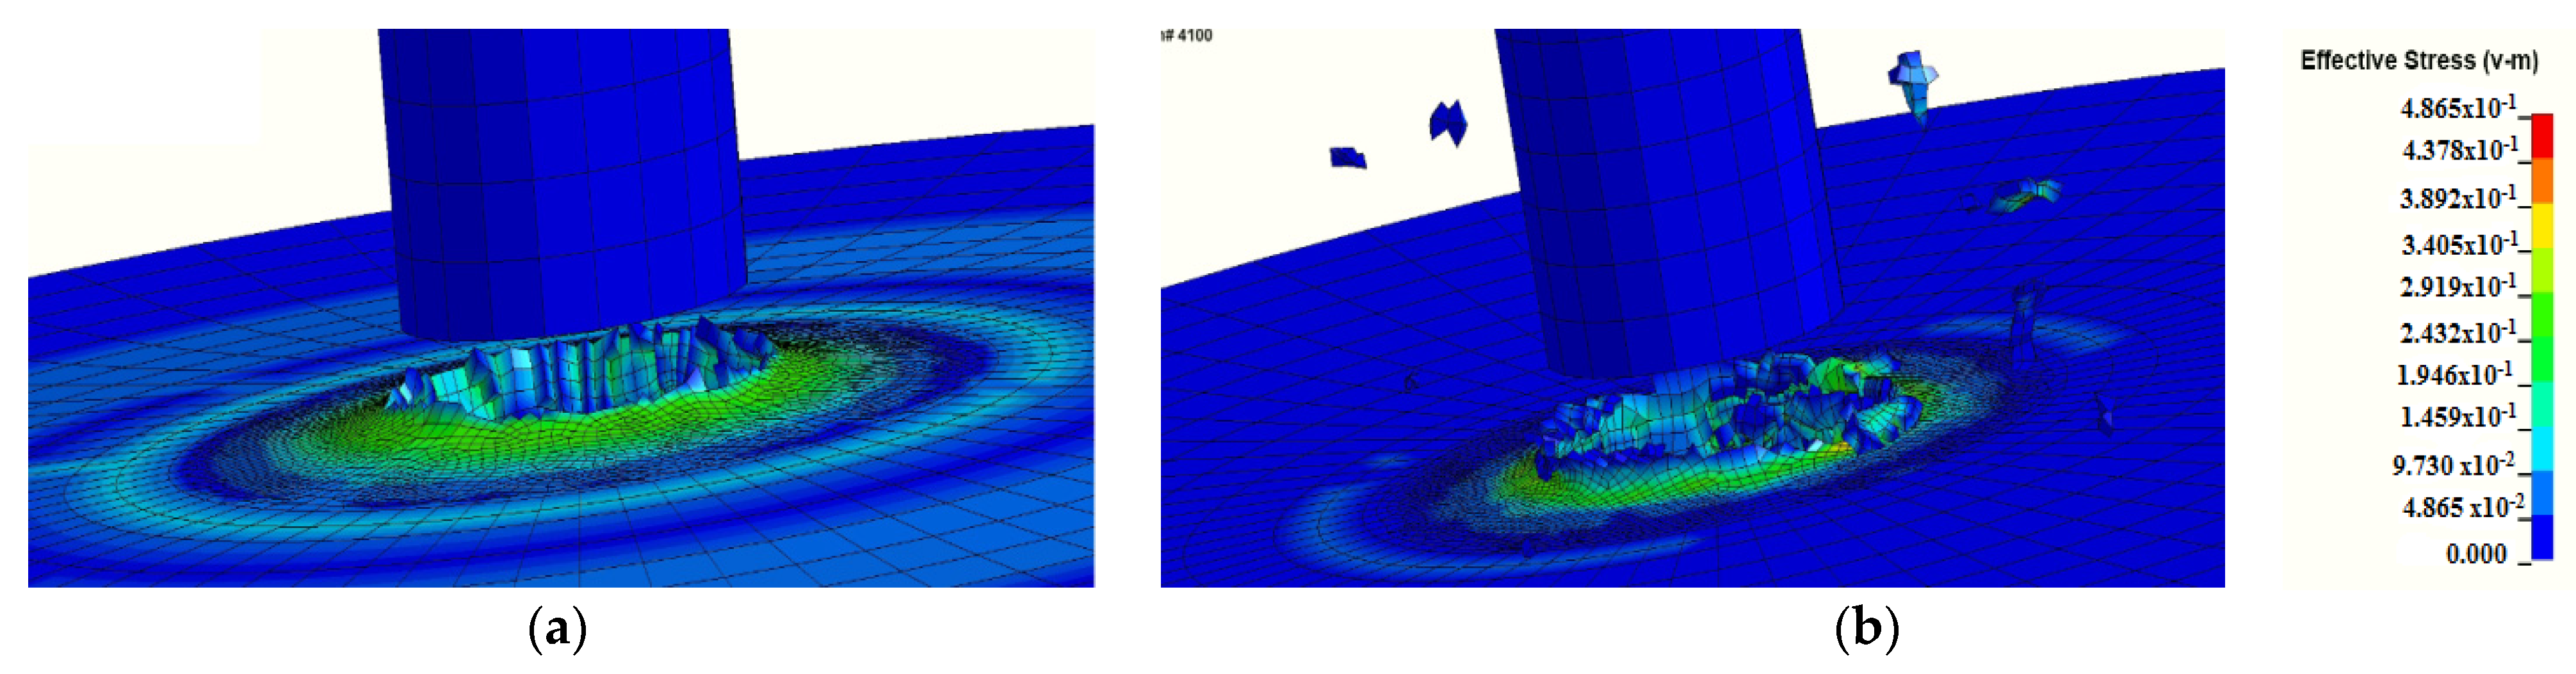
A stress fringe plot of the complete ejection of the projectile implementing the complete element removal with pure plugging kind of failure at the periphery of the impact region is shown in Figure 12a. However, there was no prominent coning, but ejection of tiny target particles was observed, as shown in Figure 12b, where the target is impacted by projectile with 900 m/s.
For 4.00 mm- and 6.35 mm-thick targets, a similar trend was observed, namely, that with an increase in impact velocities, residual velocities also increased, due to the minimal amount of momentum transfer from the projectile to the target. For a target thickness of 6.35 mm and an impact velocity of 305 m/s, a residual velocity of 277.6 m/s was obtained through simulations, while a value of 265.37 m/s was obtained in the experiments, as reported in [45]. Table 6 shows the impact velocities triggered along with the corresponding residual velocities for all the considered target thicknesses.
From Table 6, it can be observed that the higher velocities have higher residual velocities for all target thicknesses. This is because the impact velocity is independent of the same amount of energy that is transferred from the projectile to the target. However, with an increase in target thickness for a particular impact velocity, the residual velocity is comparatively lower for thicker targets than the thinner ones. This is due to coning and resistance due to the material at various levels within the thick target thickness. Thus, it can be inferred that thicker targets attempt to resist the projectile more than the thinner targets.
The difference in residual velocities for a particular impact velocity is increasing with increase in target thickness. This may be due to the fact that the deformation in the lower velocity range is global with the formation of the ductile hole growth and its interference with the surrounding material. However, this is low with localized failures in high impact velocity range resulting in high residual velocities.
A very good agreement was observed between the analytically obtained residual velocities and the FEM simulations for the considered range of impact velocities and for various target thicknesses. Table 5 shows the comparison of the residual velocities for the corresponding impact velocities obtained from analytical and FEM simulations for a representative target thickness of 3.18 mm. The slight variations for the impact velocities less than 200 m/s that were observed could be attributed to the higher contact duration between projectile and the target at lower velocities. The frictional coefficient considered in the simulations resulted in the frictional deceleration which was not considered in the analytical model. This has probably led to the prediction of slightly higher residual velocities in the analytical model.
From Table 7, the energy absorption however has decreased with increase in impact velocity and is found to be highest for the ballistic limit. The energy transferred from the projectile to target was observed to be less due to the less contact duration. Further, at lower impact velocity projectile that would face a higher resistance from the target material and also frictional effects become predominant enough to deteriorate the velocity of projectile. During this time, the target tries to capture the maximum amount of energy and, thus, the ballistic limit velocity has the highest energy absorption capacity up to 350 m/s. This can be verified from the elementary energy transfer formula of the impact as given in Equation (21).
Figure 13a shows for a 4.00 mm target thickness, the increase in impact velocity increases the residual velocity due to less contact duration at the target and the projectile interface. For a 4.00 mm target thickness, the highest energy absorption at a ballistic limit of 97 m/s was observed with 185.63 J up to an impact velocity of 350 m/s, while the minimum energy absorption was at 200 m/s impact velocity with 125.86 J, as shown in Figure 13b. With a further increase in impact velocities, as already stated, idealizations in simulations resulted in higher energy absorption values.
For a representative impact velocity of 200 m/s on a 4.00 mm target thickness, at the point of contact between the projectile and target, a bulging was observed with a diameter higher than that of the projectile. With further increase in time, a coning was noticed which is lesser than the contact area diameter and partial material is ready to tear from the rest of target. This is the point where, the target material attains the highest stress, leading to the projectile with a higher energy to penetrate and move forward. There was no petalling found at the interface of the target and the projectile. With a further increment in time, there was no further hole enlargement required along with frictional effects to overcome and, finally, projectile leaves the target with a residual velocity of 183.36 m/s. A constant stress was observed due to the settlement of the target once the projectile leaves it.
For a ballistic velocity of 97 m/s on a target thickness of 4.00 mm, an initial disturbance in the form of vibration could be noticed at almost three-quarters of the diameter as it was subjected to bending. This could be due to the low velocity with which the projectile hits the target, and providing the material time to propagate the waves until the fixed ends. With the further increment in time, the target material tries to fail and, thus, a plug is removed with a pinching action. At this point, the target would undergo maximum stress to overcome the applied energy from projectile. With any further increment in time, a cycle of vibrations was observed with no movement of the projectile in to target.
A significant amount of bending was observed, irrespective of the projectile impact velocity triggered on the target thickness of 6.35 mm. Bulging was also noticed. However, the plug is same diameter as that of projectile in 200 m/s with no plug formation in the ballistic limit velocity of 183.5 m/s.
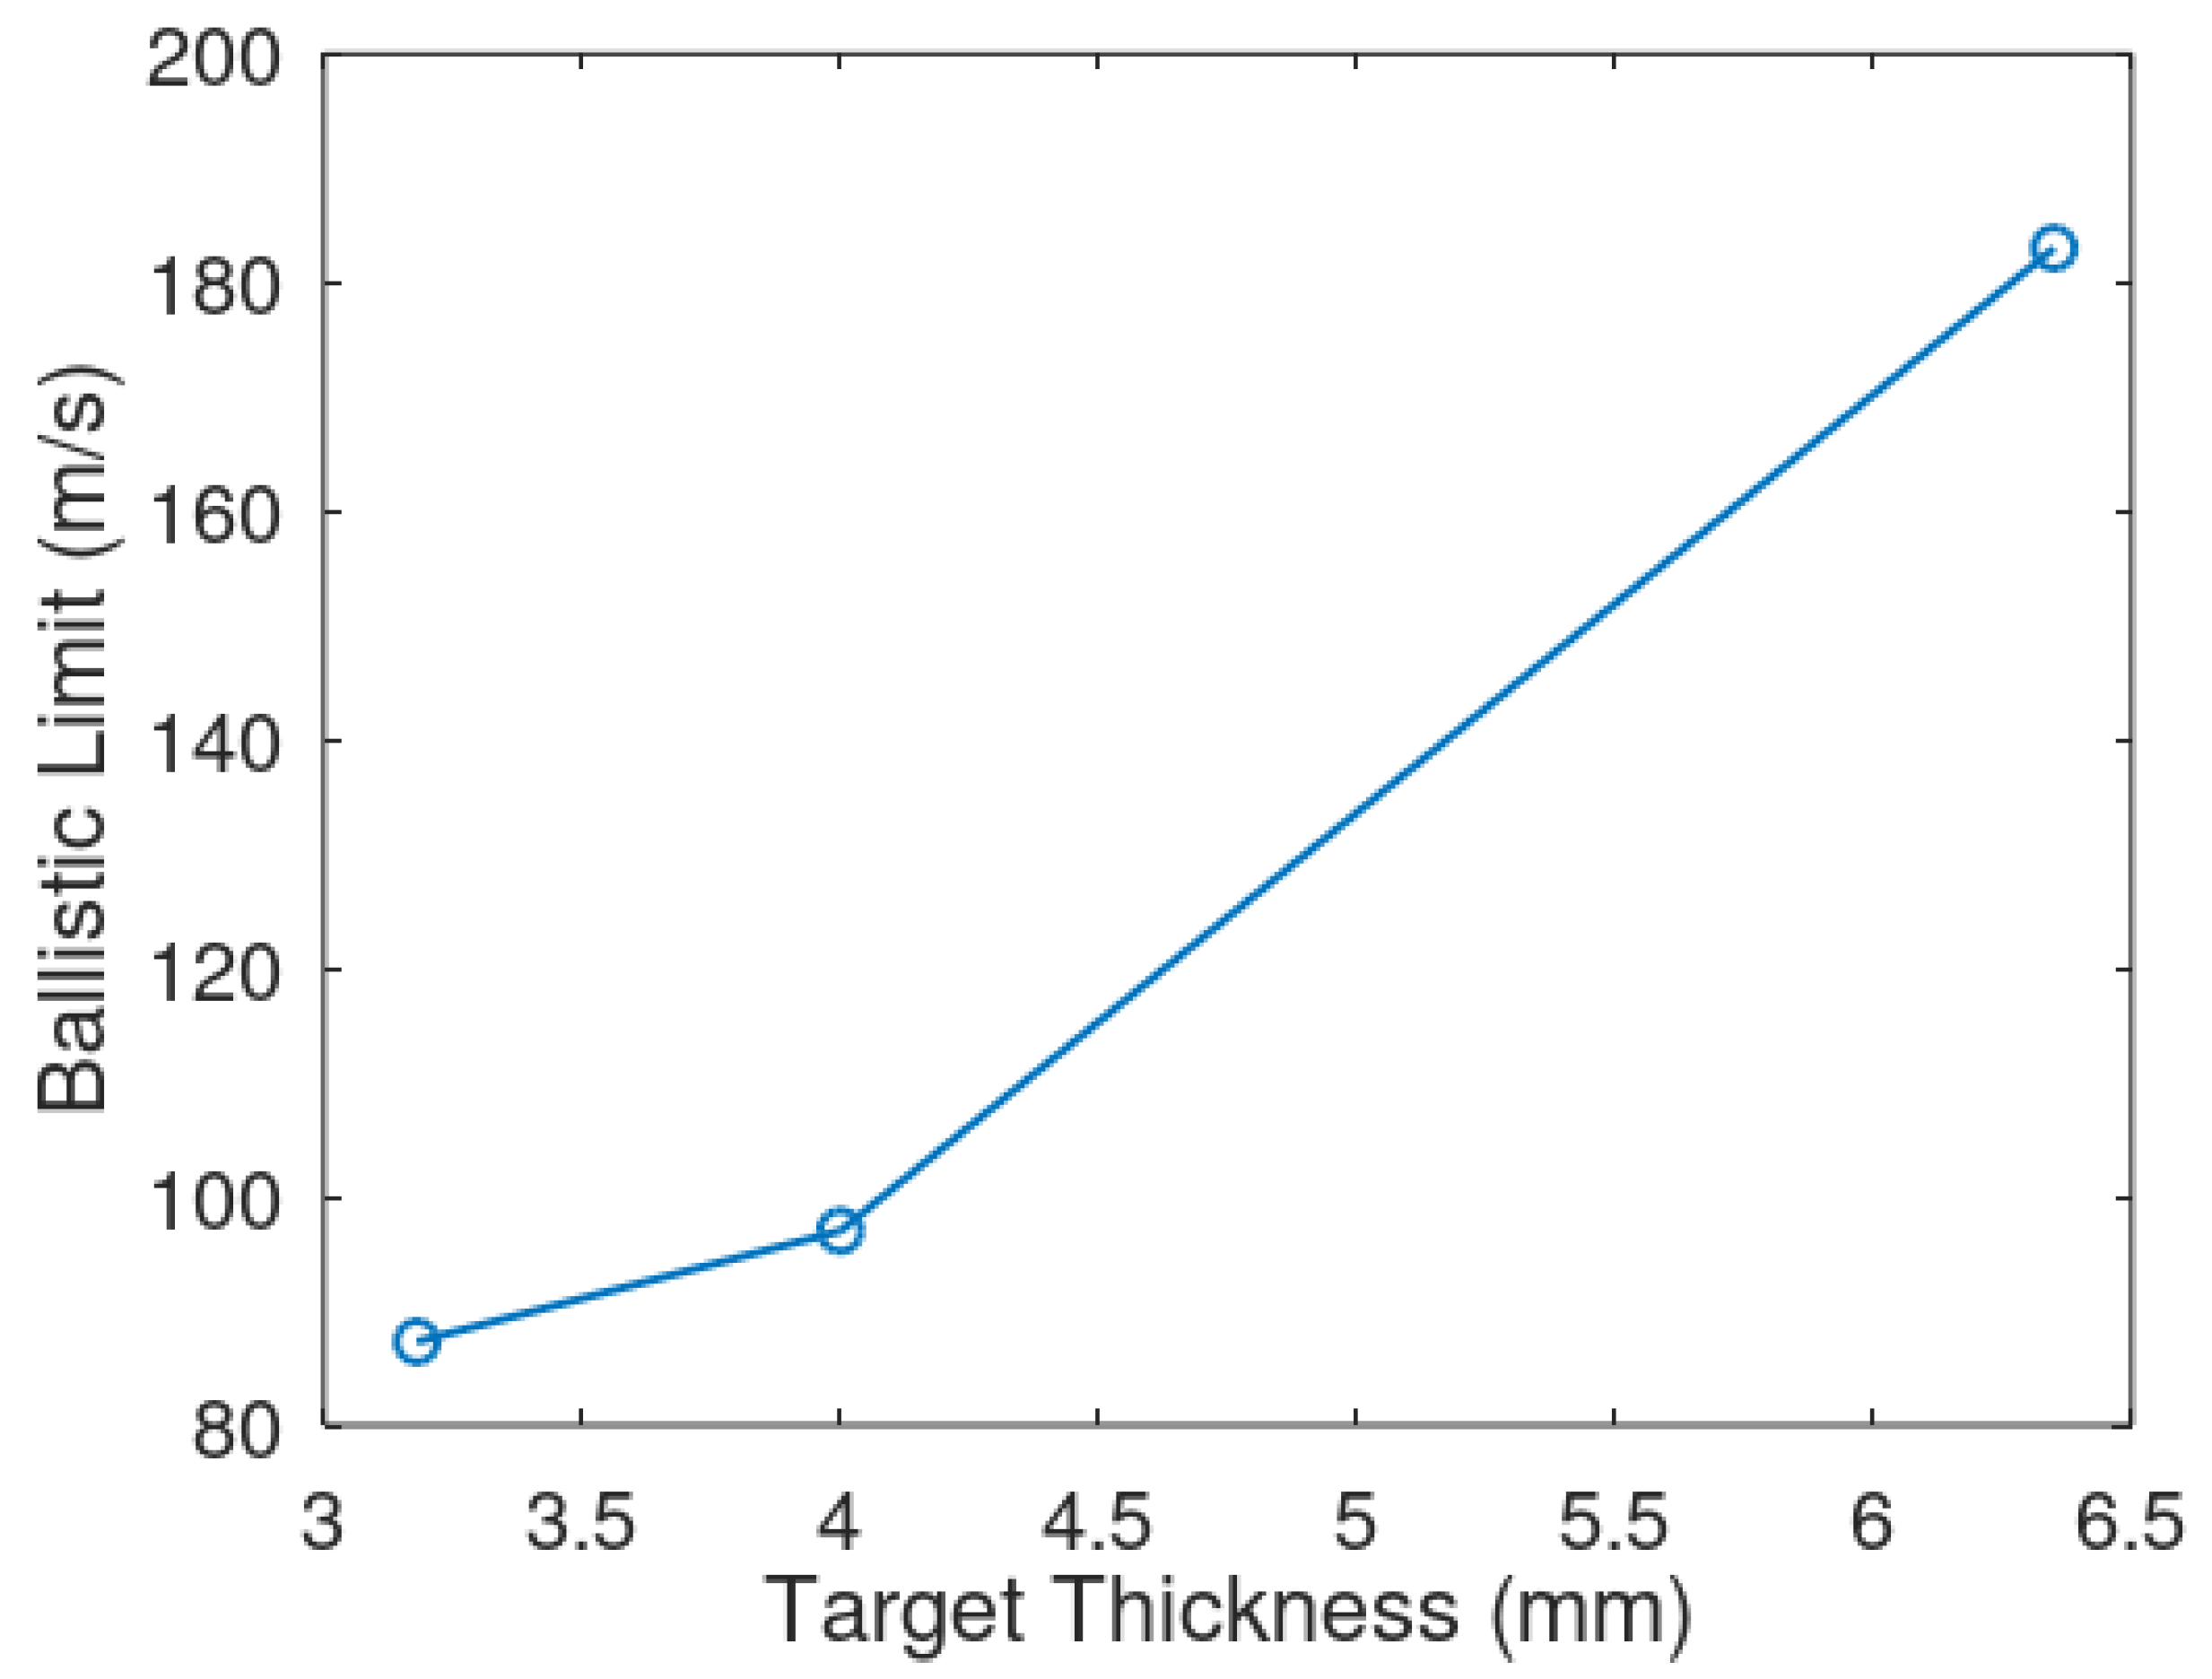
From Figure 14, it can be observed that the ballistic limit velocity keeps decreasing with the decrease in thickness. This is because the energy lost through thickness is higher for thicker targets.

6. Conclusions

Finite element simulations were performed to understand the influence of Al 2024-T3 alloy target thicknesses and the impact velocity of projectile on a ballistic limit and energy absorption characteristics of a projectile and target, respectively, upon subjecting the target to impact load using blunt projectile. Johnson–Cook material and damage parameters are estimated and are found to be in tandem with the experimental curve fitting of parameters.
The residual velocity of the projectile was obtained by capturing the velocity of the projectile shortly after perforating the target thickness. The residual velocity has increased with the increase in impact velocity, but decreased with the increase in target thickness. Petals were formed for the thinner plate of 3.18 mm, while no petals were observed for the 4.00 mm and 6.35 mm target thicknesses. It was observed that, with increasing target thicknesses from 3.18 mm to 6.35 mm, the residual velocities have reduced from 183.17 m/s to 154.37 m/s for an impact velocity of 200 m/s, which is in tandem with the literature. Furthermore, we observed that tiny particles were ejected, unlike for the lower velocities where coning and plugging were more evident.
The ballistic limit velocity was noted when there was no further movement in the projectile through the target thickness. The ballistic limits for the 6.35 mm and 3.18 mm Al 2024-T3 alloy targets were found to be 183 m/s and 87.3 m/s, respectively. For all the target thicknesses considered, the projectile has penetrated partially at the ballistic limit.
The analytical model proposed by Chen et al. was used to compare the LS DYNA simulation results on residual velocities, and a perfect agreement was observed for the considered impact velocity range and for all thicknesses of target considered. The model has good conformance with the analytical models and experimental results reported in the literature.

Author Contributions

Conceptualization, J.R.; data curation, V.R.; formal analysis, V.R.; investigation, N.G.; software, N.G.; supervision, V.R. and J.R.; writing—original draft preparation, N.G.; writing—review and editing, J.R. All authors have read and agreed to the published version of the manuscript.

Funding

This research received no external funding.

Institutional Review Board Statement

Not applicable.

Informed Consent Statement

Not applicable.

Data Availability Statement

The raw/processed data required to reproduce these findings cannot be shared at this time as the data also form part of ongoing study.

Conflicts of Interest

The authors declare no conflict of interest.

References

  1. Campbell, F.C. Manufacturing Technology for Aerospace Structural Materials; Butterworth-Heinemann Publication, Imprint of Elsevier Publications: New York, NY, USA, 2006. [Google Scholar]
  2. Lesuer, D.R. Experimental Investigations of Material Models for Ti-6Al-4V Titanium and 2024-T3 Aluminum: Final Report; Report No.—DOT/FAA/AR-00/25 20591; Office of Aviation Research: Washington, DC, USA, 2000. [Google Scholar]
  3. Seidt, J.; Gilat, A. Plastic deformation of 2024-T351 aluminum plate over a wide range of loading conditions. Int. J. Solids Struct. 2013, 10, 1781–1790. [Google Scholar] [CrossRef]
  4. Styles, M.J.; Hutchinson, C.R.; Chen, Y.; Deschamps, A.; Bastow, T.J. The coexistence of two S (Al2CuMg) phases in Al–Cu–Mg alloys. Acta Mater. 2012, 60, 6940–6951. [Google Scholar] [CrossRef]
  5. Novelo-Peralta, O.; Figueroa, I.A.; Lara-Rodríguez, G. New evidence on the nature of the metals S″-phase on Al–Cu–Mg alloys. Mater. Chem. Phys. 2011, 130, 431–436. [Google Scholar] [CrossRef]
  6. Kovarik, L.; Mills, M.J. An initio analysis of Guinier-Preston-Bagaryatsky zone nucleation in Al-Cu-Mgalloys. Acta Mater. 2012, 60, 3861–3872. [Google Scholar] [CrossRef]
  7. Buchheit, R.G.; Grant, R.P.; Hlava, P.F.; McKenzie, B.; Zender, G.L. Local dissolution phenomena associated with S phase (Al2CuMg) particles in aluminum alloy 2024-T3. J. Electro Chem. Soc. 1997, 144, 2621–2628. [Google Scholar] [CrossRef]
  8. Lindholm, U. Some experiments with the split hopkinson pressure bar. J. Mech. Phys. Solids 1964, 12, 317. [Google Scholar] [CrossRef]
  9. Zhou, Z.; Wu, G.; Jiang, L.; Li, R.; Xu, Z. Analysis of morphology and microstructure of B4C/2024Al composites after 7.62 mm ballistic impact. Mater. Des. 2014, 63, 658–663. [Google Scholar]
  10. Odeshi, A.G.; Tiamiyu, A.A.; Das, D.; Katwal, N.; Oguocha, I.N.A.; Khan, A.K. High strain-rate deformation of T8-tempered, cryo-rolled and ultra fne grained AA 2099 aluminium alloy. Mater. Sci. Eng. A 2019, 754, 602–612. [Google Scholar] [CrossRef]
  11. Holt, D.L.; Babcock, S.G. The strain-rate dependence of the flow stress in some aluminium alloys. Trans. ASM 1967, 60, 152. [Google Scholar]
  12. Wang, Y.; Chen, X.; Xiao, X.; Vershinin, V.V.; Ge, R.; Li, D.S. Effect of Lode angle incorporation into a fracture criterion in predicting the ballistic resistance of 2024-T351 aluminum alloy plates struck by cylindrical projectiles with different nose shapes. Int. J. Impact Eng. 2020, 139, 103498. [Google Scholar] [CrossRef]
  13. Chen, W.W. Experimental Methods for Characterizing Dynamic Response of Soft Materials. J. Dyn. Behav. Mater. 2016, 2, 2–14. [Google Scholar] [CrossRef]
  14. Rajendran, A.M.; Bless, S.J. High Strain Rate Material Behaviour; A Technical Report, Final Report; University of Daiton: Daiton, OH, USA, 1985. [Google Scholar]
  15. Jena, P.K.; Savio, S.G.; Kumar, K.S.; Madhu, V.; Mandal, R.K.; Singh, A.K. An experimental study on the deformation behavior of Aluminium amour plates impacted by two different non-deformable projectiles. Procedia Eng. 2017, 173, 222–229. [Google Scholar] [CrossRef]
  16. Seidt, J.D.; Pereira, J.M.; Gilat, A.; Revilock, D.M.; Nandwana, K. Ballistic impact of anisotropic 2024 aluminum sheet and plate. Int. J. Impact Eng. 2013, 62, 27–34. [Google Scholar]
  17. De Vuyst, T.; Vignjevic, R.; Albero, A.A.; Hughes, K.; Campbell, J.C.; Djordjevic, N. A Study of the Ballistic Limit of AL2024-T351 Sheets Impacted by Spherical and Cubical Compact Projectiles. Eng. Trans. 2016, 64, 351–366. [Google Scholar]
  18. Dubey, R.; Jayaganthan, R.; Ruan, D.; Velmurugan, R. Behavior of Thermo-Mechanically Processed AA 6082 Aluminium Alloy Impacted by Conical Projectiles. J. Dyn. Behav. Mater. 2020, 7, 48–59. [Google Scholar] [CrossRef]
  19. Dubey, R.; Rakesh, S.; Velmurugan, R.; Jayaganthan, R. Highspeed impact behaviour of thermo-mechanically processed AA 6082–T6 thin plates. Mater. Today Proc. 2018, 5, 17203–17212. [Google Scholar] [CrossRef]
  20. Nirmal, R.R.; Patnaik, B.S.V.; Jayaganthan, R. FEM Simulation of High Speed Impact Behaviour of Additively Manufactured AlSi10Mg Alloy. J. Dyn. Behav. Mater. 2021, 1–16. [Google Scholar] [CrossRef]
  21. Senthil, K.; Arindam, B.; Iqbal, M.; Gupta, N. Ballistic Response of 2024 Aluminium Plates Against Blunt Nose Projectiles. Procedia Eng. 2017, 173, 363–368. [Google Scholar] [CrossRef]
  22. Shamchi, S.P.; de Melo, F.J.Q.; Tavares, P.J.; Moreira, P.M. Thermomechanical characterization of Alclad AL2024-T3 aluminum alloy using split Hopkinson tension bar. Mech. Mater. 2019, 139, 103–198. [Google Scholar] [CrossRef]
  23. Kim, Y. Simulating the Mechanical Behavior of AL2024-T3 with Different Strain Rate and Temperature; Final project; Brown University: Providence, RI, USA, 2017. [Google Scholar]
  24. Wen, H.M.; Jones, N. Low-velocity perforation of punch-impact-loaded metal plates. J. Press. Vessel Technol. 1996, 118, 181–187. [Google Scholar] [CrossRef]
  25. Bai, Y.L.; Johnson, W. Plugging: Physical understanding and energy absorption. Met. Technol. 1982, 9, 182–190. [Google Scholar] [CrossRef]
  26. Ravid, M.; Bodner, S.R. Dynamic perforation of visco-plastic plates by rigid projectiles. Int. J. Impact Eng. 1983, 21, 577–591. [Google Scholar]
  27. Chen, X.W.; Yang, Y.B.; Lu, Z.H.; Chen, Y.Z. Perforation of Metallic Plates Struck by a Blunt Projectile with a Soft Nose. Int. J. Impact Eng. 2008, 35, 549–558. [Google Scholar] [CrossRef]
  28. Chen, X.W.; Zhou, X.Q.; Li, X.L. On Perforation of Ductile Metallic Plates by Blunt Rigid Projectile. Eur. Mech. A 2009, 28, 273–283. [Google Scholar] [CrossRef]
  29. Walker, J.M. A Time-Dependent Model for Long-Rod Penetration. Int. J. Impact Eng. 1995, 16, 19–48. [Google Scholar] [CrossRef]
  30. Forrestal, M.J.; Okajima, K.; Luk, V.K. Penetration of 6061-T651 Aluminum Targets with Rigid Long Rods. J. Appl. Mech. 1988, 55, 755. [Google Scholar] [CrossRef]
  31. Forrestal, M.J.; Luk, V.K. Dynamic Spherical Cavity- Expansion in a Compressible Elastic-Plastic Solid. J. Appl. Mech. 1988, 55, 275. [Google Scholar] [CrossRef]
  32. Gupta, N.K.; Iqbal, M.A.; Sekhon, G.S. Effect of projectile nose shape, impact velocity and target thickness on deformation behavior of aluminum plates. Int. J. Solids Struct. 2007, 44, 3411–3439. [Google Scholar] [CrossRef] [Green Version]
  33. Gupta, N.K.; Iqbal, M.A.; Sekhon, G.S. Experimental and numerical studies on the behavior of thin aluminum plates subjected to impact by blunt- and hemispherical-nosed projectiles. Int. J. Impact Eng. 2006, 32, 1921–1944. [Google Scholar] [CrossRef]
  34. Song, B.; Sanborn, B. A Modified Johnson–Cook Model for Dynamic Response of Metals with an Explicit Strain- and Strain-Rate-Dependent Adiabatic Thermosoftening Effect. J. Dyn. Behav. Mater. 2019, 5, 212–220. [Google Scholar] [CrossRef]
  35. Børvik, T.; Clausen, A.H.; Eriksson, M.; Berstad, T.; Hopperstad, O.S.; Langseth, M. Experimental and Numerical study on the performance of AA6005-T6 panels. Int. J. Impact Eng. 2005, 32, 35–64. [Google Scholar] [CrossRef]
  36. Holquest, J. LS DYNA User Manual, Livermore software, Vol I and Vol II; ANSYS: Pittsburgh, PA, USA, 2007. [Google Scholar]
  37. Johnson, G.R. Cook, Fracture Characteristics of Three Metals Subjected To Various Strains, Strain Rates, Temperatures And Pressures. Eng. Fract. Mech. 1985, 21, 31–48. [Google Scholar] [CrossRef]
  38. Johnson, G.R. Materials characterization for computations involving severe dynamic loading. In Proceedings of the Army Symposium on Solid Mechanics, Watertown, MA, USA, 29 September 1980; pp. 62–67. [Google Scholar]
  39. Mohanraj, M.; Jung, D.W. Johnson-Cook Material and Failure Model Parameters Estimation of AISI-1045 Medium Carbon Steel for Metal Forming Applications. Mater. J. 2019, 12, 609. [Google Scholar] [CrossRef] [Green Version]
  40. Yang, F.; Ma, H.; Jing, L.; Zhao, L.; Wang, Z. Dynamic compressive and splitting tensile tests on mortar using split Hopkinson pressure bar technique. Lat. Am. J. Solids Struct. 2015, 12, 730–746. [Google Scholar] [CrossRef]
  41. Gunasilanetal, M. Comparative Failure of Aeronautical Alloys Al2024 and Aa7075 at Low and High Strain Rate. In Proceedings of the 7th International Conference on Mechanics and Materials in Design, Albufeira, Portugal, 11–15 June 2017. [Google Scholar]
  42. Rahmat, N.A.B. Prediction of Maximum Strain and Strain Rate in SHPB Specimens Based on Energy Analysis. Master’s Thesis, University of Malaysia, Pahang, Malaysia, 2012. [Google Scholar]
  43. Coşkun, A.; Gunduz, S. An investigation on cold, warm and hot deformation behaviour of Al 2024 alloy under as-received, solution heat treated, peak aged and over aged conditions. Can. J. Metall. Mater. Sci. 2020, 59, 297–305. [Google Scholar] [CrossRef]
  44. Bai, Y.; Teng, X.; Wierzbicki, T. On the application of stress triaxiality formula for plane strain fracture testing. J. Eng. Mater. Technol. Trans. Asme. 2009, 131, 0210021–02100210. [Google Scholar] [CrossRef]
  45. Goldsmith, W.; Finnegan, S.A. Normal and oblique Impact of cylindro- Conical and cylindrical projectiles of metallic plates. Int. J. Impact Eng. 1986, 4, 83–105. [Google Scholar] [CrossRef]
Figure 1. Curve fitting of true plastic stress-strain values to obtain B and n.
Aerospace 08 00281 g001
Figure 2. Curve fitting of true plastic stress-strain values at different strain rates to determine C.
Aerospace 08 00281 g002
Figure 3. Schematic diagram of SHPB.
Aerospace 08 00281 g003
Figure 4. Curve fitting of true plastic stress-strain values at different temperatures to obtain m.
Aerospace 08 00281 g004
Figure 5. PEEQ versus Triaxiality curve to determine D1, D2 and D3 parameters on notched specimen.
Aerospace 08 00281 g005
Figure 6. Determination of D4 at various strain rates for notched specimen.
Aerospace 08 00281 g006
Figure 7. (a) Representative structured mesh used for the model with 4.00 mm target thickness. (b) Enlarged view of the point (Yellow) considered for x-axis stress.
Aerospace 08 00281 g007
Figure 8. Mesh independent study with respect to element size and corresponding computational time.
Aerospace 08 00281 g008
Figure 9. (a) Residual velocity vs. impact velocity. (b) Energy absorption vs. impact velocity—for 3.18 mm target thickness.
Aerospace 08 00281 g009
Figure 10. Energy absorption obtained from LS DYNA simulation for 200 m/s impact velocity for target thickness of 3.18 mm.
Aerospace 08 00281 g010
Figure 11. Detailed perforation of the projectile in to 3.18 mm target thickness for an impact velocity of (a) 200 m/s and (b) ballistic limit of 87.3 m/s.
Aerospace 08 00281 g011
Figure 12. Failure through plugging of 3.18 mm target thickness for an impact velocity of (a) 200 m/s and (b) 900 m/s.
Aerospace 08 00281 g012
Figure 13. (a) Residual velocity vs. impact velocity. (b) Energy absorption vs. impact velocity for the 4 mm target thickness.
Aerospace 08 00281 g013
Figure 14. Variation in ballistic velocities with target thicknesses.
Aerospace 08 00281 g014
Table 1. True stress–true strain values given as input to the simulations in present study [2].
True Stress (MPa)True Plastic Strain
00
264.500.028
273.550.047
286.230.061
304.330.074
320.650.096
329.710.111
Table 2. True stress-true strain values given as input to SHPB simulations in present study [41].
For Strain Rate-2220/sFor Strain Rate-4500/s
True Stress (MPa)True Plastic StrainTrue Stress (MPa)True Plastic Strain
402.80348.20
461.00.04468.80.023
473.20.056511.80.045
513.00.071492.30.061
555.10.125519.20.081
502.60.139563.70.112
603.20.176607.30.152
543.10.193576.50.196
578.90.238609.40.215
Table 3. J.C. Parameters obtained for AL 2024 T3 alloy.
Material Parameters for 2024–T3 AlloyDamage Parameters for 2024–T3 Alloy
A(MPa)265D10.13
B(MPa)426.66D20.13
n0.34D3−1.5
C0.016D40.011
m1D50
Table 4. Material properties of target and projectile used in LS DYNA software.
PropertyTarget—Al 2024 AlloyProjectile—Steel
Modulus of Elasticity (GPa)71200
Density (kg/m3)27107850
Poisson’s Ratio0.330.3
Table 5. Details of no. of elements and nodes for the FE model.
Target ThicknessNo. of ElementsNo. of Nodes
3.18 mm22,04123,152
4.00 mm30,80235,029
6.35 mm39,76540,283
Table 6. Residual velocities obtained from simulations are compared and validated by analytical model for all thicknesses and for various impact velocities for Al 2024-T3 alloy.
Target Thickness3.18 mm4.00 mm6.35 mm
S No.Impact Velocity (m/s)Simulative Residual Velocity (m/s)Chen et al. [27] Analytical Residual Velocity (m/s)Relative Percentage Difference between Analytical and Simulation (%)Simulative Residual Velocity (m/s)Chen et al. [27] Analytical-Residual Velocity (m/s)Relative Percentage Difference between Analytical and Simulation (%)Simulative Residual Velocity (m/s)Chen et al. [27] Analytical-Residual Velocity (m/s)Relative Percentage Difference between Analytical and Simulation (%)
1900881.84873.650.94874.04866.450.87891.31845.085.47
2800782.56776.160.83775.35769.520.76789.65749.525.35
3700683.29678.610.69677.46672.480.74687.59653.695.18
4600584.12580.960.54579.8575.30.78584.14557.474.78
5500485.33483.160.45481.96477.870.85450.14460.62−2.27
6450436.18434.170.46432.87429.010.90374.15411.81−9.14
7400386.93385.090.47384.37380.001.15327.61362.60−9.64
8350337.95335.880.61334.89330.781.24261.94312.82−16.26
9305293.7291.420.78290.20291.95−0.60277.6267.263.86
10250236.70236.72−0.01234.92238.24−1.40207.1209.87−1.31
11200183.17186.36−1.71183.36189.12−3.04111.18154.37−27.9
12183------------Ballistic Limit attained
13150128.79134.66−4.36123.84139.4−11.16
1410062.4678.445−20.3738.50
1597------Ballistic Limit attained
1687.30.0073.7590
Ballistic Limit attained
Table 7. Energy absorption of Al 2024-T3 alloy obtained from simulations for all thicknesses and for various impact velocities.
Target Thickness3.18 mm4.00 mm6.35 mm
S No.Impact Velocity (m/s)Energy Absorption (J)Energy Absorption (J)Energy Absorption (J)
1900638.00909.00845.08
2800545.00767.00749.52
3700456.20612.70653.69
4600 371.00470.20557.47
5500285.30349.50460.62
6450241.70298.50411.81
7400202.9241.80362.60
8350163.6204.3333.12
9305132.78173.80314.95
10250127.71144.28386.9
11200127.23125.86545.32
12183----660.74
13150116.67141.34
14100120.33168.06
1597--185.64
1687.3150.37--
Publisher’s Note: MDPI stays neutral with regard to jurisdictional claims in published maps and institutional affiliations.

