Abstract
A strong interest in highly-efficient, small-scale propeller configurations can be recognized, especially due to the currently growing number of and usage possibilities for unmanned aerial vehicles (UAVs). Although a variety of different propulsion concepts already exist on the market or are discussed in the literature, there is still a demand for a systematic investigation to compare such configurations, in particular, small-scale propellers with a fixed pitch, which are analyzed in this work. Therefore, different configurations of small-scale propellers with a fixed pitch are analyzed in this paper. They were operated as isolated single propellers and as ducted propellers in a cylindrical wing. Furthermore, due to their flight envelope, UAVs are likely to operate at highly inclined inflow conditions and even under reverse inflow. These non-axial inflow conditions have a major influence on the flow field around a propeller. In order to investigate this influence, all analyses were performed at a range of inflow angles in relation to the propeller axis from to .
1. Introduction
Many reasons can be found for a propeller experiencing non-axial inflow (see Figure 1). In particular, conventional UAV multicopter configurations with propellers on a fixed vertical axis cause highly yawed inflow conditions in horizontal flight [1,2].
Additionally, aircraft equipped with conventional propeller configurations can face angles of attack of up to , for example, in very slow forward flight (like take-off and landing), during side-slip and during a turning flight [3].
For applications in the field of maritime vehicles, such inflow conditions are very common. Nowadays, many highly maneuverable ships are equipped with so-called azimuth thrusters. These are propellers mounted on a 360°-turnable nacelle, and typically surrounded by a duct [4]. All control forces are produced via the effective side-forces caused by the non-axial inflow [5].
During a typical multicopter configuration mission, a significant amount of time will be spent in hover states in which a propeller mounted inside a duct is theoretically more efficient than an open propeller [6]. However, by increasing the range, the importance of non-axial inflow conditions rises. In order to improve the aerodynamic efficiency of innovative aircraft, especially using ducted fixed-pitch propellers, a better understanding of the occurring propeller flow fields and the aerodynamic effects under different inflow conditions is required [7,8,9,10].
Facing non-axial inflow conditions, a highly complex three-dimensional flow field around the propeller occurs (see Figure 2). The rotation and the twist angle form a spanwise pressure gradient together with a centrifugal force (violet arrows), accelerating in particular the separated flow on the upper blade side (green zone) radially towards the blade tip (blue arrows at the trailing edge).
In the rotating system of the propeller, this radial velocity causes a Coriolis force aligned towards the trailing edge (violet arrows at the trailing edge). The combination of all these effects forms a favorable pressure gradient, making the boundary layer more stable against “tatic” flow separation. Furthermore, the area of separated flow is decreased, possibly resulting in an increased suction on the blade’s upper side [11]. The flow around the blade tip is responsible for the formation of the tip vortex (orange). The profile of the bound circulation over the blade radius defines the characteristics of the shed vortices. The rapid decrease of the circulation at the blade root corresponds with the root vortex.

Figure 1.
Definition of the coordinate system. From [12].

Figure 2.
Flow phenomena of a propeller under non-axial inflow. (a) Illustration of the inflow, the rotational speed and the induced velocities, the flow around the blade tip, the radial flow and the vortex structures. (b) Illustration of the resulting three-components’ pressure distributions and forces.
A common description of a propeller is that of a rotating wing. However, the resulting pressure distribution on the propeller surface differs from the corresponding two-dimensional polar data. The reasons for this discrepancy are the occurring three-dimensional flow effects, and with the variation of the angle of attack, the non-axial inflow velocity components. They result in additional local axial and tangential velocities, and eventually, a variation of the local inflow velocity magnitude and direction (see Figure 3). Hence, they influence the pressure gradients , along the propeller blade and the pressure difference between the upper and the lower blade side . Additionally, due to the non-axial inflow, this influence becomes periodic. Consequently, the flow separation, the radial flow and the resulting propeller thrust become periodic as well. More precisely, the influence on the thrust of the advancing and the retreating blade may be contrary. Thereby, additional pitching and yawing moments and asymmetric tip vortices are obtained. Furthermore, within non-axial inflow, there is an increased blade vortex interaction by the deflected wake causing additional time-varying loads on the propeller.
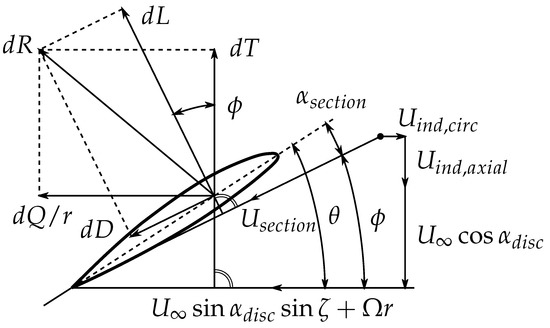
Figure 3.
Inflow characteristics of a propeller’s blade section under non-axial inflow. The non-axial inflow influences the local lift and drag , and furthermore, the local thrust and portion of propeller torque [12].
In this study, a comparison was performed between an open propeller and a ducted propeller configuration. Thereby, the main focus was set on their individual behavior under non-axial inflow conditions. Aerodynamic load measurements were performed in the wind tunnel A of the Chair of Aerodynamics and Fluid Mechanics of the Technical University of Munich using an internal six-component balance. Transient loads were obtained with unsteady Reynolds-averaged Navier–Stokes (URANS) calculations.
Besides the force analysis, the flow field, occurring under different inflow angles, was analyzed extensively in order to explain the found load characteristics. The URANS results enable detailed insights of the flow field, such as the evolution of the blade tip vortices; the wake contraction; and flow separation or the forming of shear layers and other complex vortex structures. The numerical data were validated by the experimentally obtained integral forces and by a comparison to complementary conducted flow field measurements by stereo particle image velocimetry (PIV).
Non-axial inflow conditions have been of interest since the beginning of aviation history and have been analyzed in other work in the literature. However, the majority of studies were performed with large-scale propellers or for a limited regime of inflow angles [13,14,15,16,17,18].
In addition, in this work, the loads’ results especially are presented in such a way that enables the differentiation between the influence of an additional lateral inflow velocity component (for example due to a gust) and the influence of a rotation of the inflow velocity vector. Furthermore, a comprehensive analysis of the occurring flow fields under different inflow angles was conducted, allowing the explanation of the load behaviors by the formation of characteristic vortex structures and flow separation regions.
The knowledge of this analysis could possibly be used for a mission-specific choice of propeller configurations or duct geometries for future aviation vehicles. Additionally, future propulsor designs could take into consideration the influence of the non-axial inflow on their performance.
2. Experimental Approach
The experiments were performed in the wind tunnel A of the Chair of Aerodynamics and Fluid Mechanics of the Technical University Munich. Its nozzle is 1.8 m in height, 2.4 m in width; its test section is 4.8 m long. The turbulence intensity was 0.4%; the maximum velocity was 60 m/s. Small-scale two-bladed fixed-pitch propellers APC 18x8E of the company APC Propellers were used. The propellers have a diameter of 18 inch (0.46 m) and a geometrical pitch of 8 inch (giving a pitch angle at the radial location of 10.7°). Their chord length and twist angle distribution can be seen in Figure 4b.
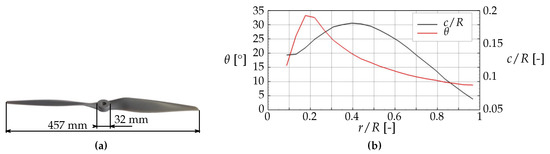
Figure 4.
(a) Size, (b) twist angle and chord length distribution of the applied APC 18x8E propeller.
The geometry of the duct is designed for operating conditions with very low advance ratios or even static thrust, respectively, including a large inlet radius and profile thickness and a wide diffusor angle. The measures of the duct can be seen in Figure 5. For the operation inside the duct, the rounded blade tips of the propeller model are cut at a radius of mm (around three percent is cut off). It is common to use individually designed propellers with long chords until the blade tip and blunt blade tips to reduce the flow through the blade tip gap [19]. In this work, the same propeller was used both in an open and a ducted configuration (except the adaption of the blade tip). The intention was to provide an easier comparison of both concepts.
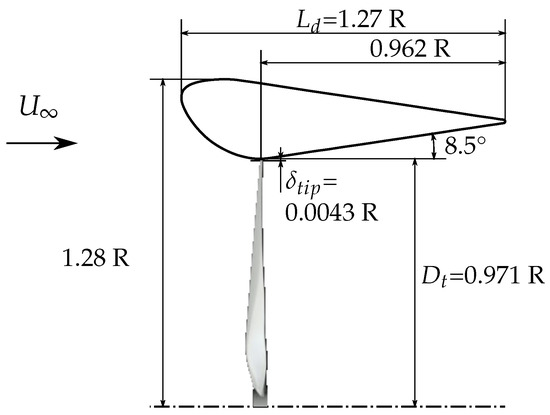
Figure 5.
Dimensions of the applied duct.
To drive the propeller, a speed-controlled direct current motor (Maxon Motor EC-60-167131, electrical power 400 W) was used. Its backside was connected to a six-component internal balance (K6D40 200N/5Nm/CG of the company ME-Meßsysteme GmbH) to obtain the aerodynamic loads with a resolution of 0.5 N/0.005 Nm in thrust direction and 0.2 N/0.005 Nm perpendicular to the thrust direction concerning the balance’s full range of measurements. The balance’s sample rate was 300 Hz. In order to achieve steady loads, the measurements were averaged over thirty seconds or for around 9000 samples, respectively. At a rotational speed of rpm this corresponds to around 2000 revolutions. To measure the aerodynamic forces of the models only, the assemblies of the motor and balance were contained by a 3D-printed, closed, self-holding fairing (see Figure 6b). Between the motor and the balance, a support was integrated for the mounting of the duct. The whole system could be rotated in the wind tunnel, enabling the measurement at inflow angles from to (see Figure 6a).
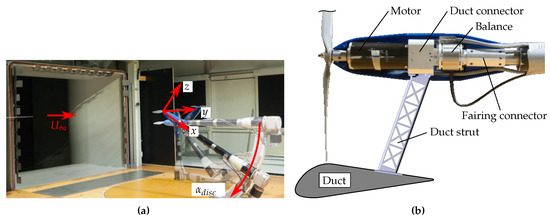
Figure 6.
(a) Rotatable wind tunnel support with mounted propeller. (b) Instrumentation of the support with a one-sided illustration of the duct.
The flow field was measured using a stereo particle image velocimetry (PIV) at a plane of measurement which was oriented vertically in the cross-section of the propeller and located at its rotational axis. The laser was positioned above the wind tunnel on a traverse system. Both cameras were mounted on the side of the wind tunnel on another traverse system, around one meter away from the flow and moving uniformly with the laser for different measurement positions (see Figure 7a). For analyzing the vortex structures in the wake, the PIV was performed phase-locked, triggered by the motor control unit. In order to minimize the shading of the laser beam by the propeller blades, all measurements were performed with the propeller in a horizontally oriented position (). The spatial resolution of the PIV images was 3.3 mm. To calculate the mean velocity components, 200 image samples were recorded for every measurement and time-averaged. Stanislas et al. state that a proper calibration of the setup results typically in precisions of determining the displacements of around 0.1 to 0.3 pixels for each camera image [20]. Hence, the resulting uncertainty for the three velocity components can be estimated at two percent of the inflow velocity.
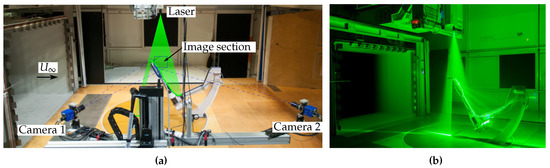
Figure 7.
(a) Stereo-PIV setup. The laser and the cameras were mounted on uniformly moving traverse systems. (b) The laser illuminated the vertically aligned plane of measurement.
3. Numerical Approach
Using a finite volume method, the incompressible URANS equations were solved on a structured grid. The commercial software ANSYS ICEM CFD was used to mesh the geometry while ANSYS Fluent was applied as a flow solver.
The computational mesh consisted of two domains. One was an outer, static, hexahedral domain which contained the wind tunnel support geometry and had an edge length of 14 m (approximately 30 times the propeller diameter). Inside it, a second cylindrical domain contained the propeller geometry and rotated with the rotational speed of the propeller. Between both domains, a sliding mesh condition was applied. The meshing of the propeller domain was performed for the half of the cylinder, while the other side was mirrored. For the isolated propeller, a convergence study of the mesh size was performed by analyzing the static thrust under the test case m/s, and rpm. Five different meshes of increasing cell number but consistent blocking scheme were used. With Figure 8 it is apparent that the mesh with about 12.6 million cells provided a satisfying convergence. The propeller domain consisted of about 2.6 million cells; the others belonged to the outer domain. An impression of the grid at the representative blade section is shown in Figure 9b.
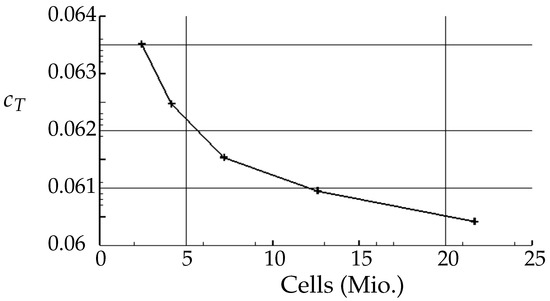
Figure 8.
Mesh convergence study.
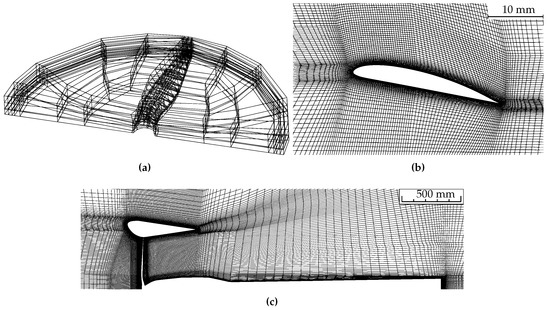
Figure 9.
Computational grid. (a) Blocking of the rotational propeller domain, (b) grid around the airfoil at , (c) grid of propeller and outer domain at the symmetry plane ().
The grid of the ducted propeller configuration is defined accordingly. Inside the duct, it was kept fine in order to accurately resolve the occurring flow separation and interference effects between duct and propeller. The number of cells in its static domain was about 18 million cells; the propeller domain contained about 3 million cells. The meshing close to the geometry surfaces provided a dimensionless wall distance of to resolve the viscous sublayer accurately. In Figure 9c, the grid of both domains of the ducted configuration at the symmetry plane is shown.
For the calculations, a pressure-based solver was applied. Since the blade tip Mach number was about , the fluid was modeled as incompressible. The time-step was set according to a rotational speed of the inner domain of one degree per time-step ( s for the case of 4000 rpm). The spatial and temporal gradients were discretized with a second order scheme. The solver used the SIMPLE algorithm. For the inlets, a velocity vector was defined with a turbulence degree set to match the conditions of the wind tunnel experiments. For the outlet surfaces, pressure-outlets were used. The turbulence was modeled with the k- shear stress transport (SST) model. These settings were chosen according to experiences of previously performed propeller simulations which showed close agreement to experimental data. [21,22] The simulations were conducted over fifteen to twenty propeller revolutions to achieve convergence, depending on the inflow angle. In order to obtain time-averaged loads, the forces and moments were averaged over the last revolution.
To validate the numerical setup, the thrust coefficients of the open and the ducted configuration are plotted in Figure 10 as derived both by experimental measurements and by numerical simulations; they show close agreement of both methods for inflow angles up to .
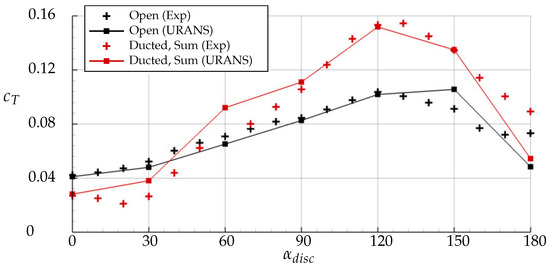
Figure 10.
Validation of the numerical setup by the thrust coefficient . .
4. Results and Discussion
In this chapter, the results of the ducted propeller configuration are analyzed and compared to the results of the same propeller without a duct of previous analysis. Shown are both the experimental results and the data obtained by URANS calculations.
4.1. Steady Loads
First, the steady loads are presented. In Figure 11a, the ratio of thrust coefficient to power coefficient , used as a measure for propeller efficiency, is shown for static thrust conditions (). The comparison of the ducted propeller with the open one shows that at static thrust conditions, the duct has a positive effect on the propeller efficiency. It increased for all analyzed rotational speeds as a nearly constant offset. The reason for this was an additional duct-generated portion of thrust due to the flow acceleration by the inlet lip, correlated with a suction zone, and the wake expansion and deceleration by the diffusor, respectively, correlated with increased static pressure behind the propeller plane. Those favorable effects may have been limited to some extent by the disadvantageous flow velocity increase in the propeller plane, correlated with a reduction of the propeller thrust portion.
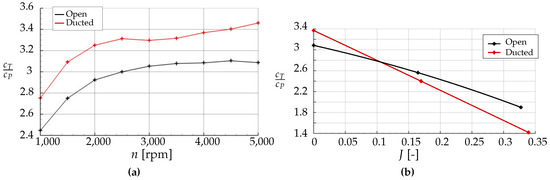
Figure 11.
Ratio of thrust coefficient to power coefficient . (a) Static thrust conditions (), (b) polar over the advance ratio J with rpm. Wind tunnel data.
These effects are strongly dependent on the inflow velocity. In Figure 11b, the ratio of thrust coefficient to power coefficient is shown over the advance ratio J for a constant rotational speed. It is apparent that for both configurations the efficiency decreased with a rising advance ratio. This behavior was expected, since an increasing advance ratio decreases the local inflow angle at the propeller’s blade sections . Eventually, no thrust can be produced any more. The efficiency of the ducted configuration decreased more rapidly than the one of the open propeller.
In the experiments, the total loads of both propeller and duct were measured together. On the contrary, with the computational results, the propeller and duct loads can be distinguished, enabling a more detailed analysis. In Figure 12, the thrust distribution of propeller and duct is shown. In static thrust conditions, the duct formed a favorable pressure distribution which produced around 28% of the total thrust. With a rising advance ratio, the aerodynamic drag of the duct was increasing which decreased the duct portion of the thrust. At the same time, the increased advance ratio lowered the propeller thrust as well. For an advance ratio of around , the thrust portion of the duct became zero. Eventually, for advance ratios greater than around , the rising duct drag overcompensated for its beneficial effects and the propeller became more efficient without the duct (see Figure 11b).
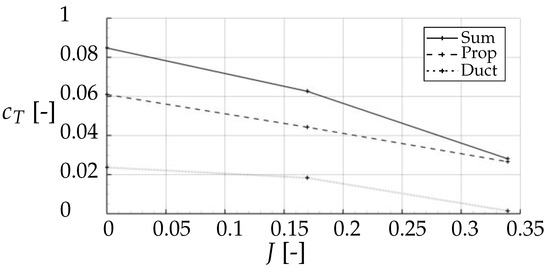
Figure 12.
Thrust coefficient distribution. Polar over the advance ratio J, rpm. URANS results.
In Figure 13a, the thrust coefficient is plotted over the inflow angle for the isolated propeller (black) and the ducted one (red). The comparison shows that the ducted propeller is far more strongly affected by the inflow direction than the isolated one. Especially in fast forward flight, the thrust is affected already by small inflow angle variations. This can be seen in Figure 13b, where the total duct thrust is plotted by contour levels for the here defined axial advance ratio (showing the influence of the axial inflow component) and the lateral advance ratio (for the non-axial inflow component), reading
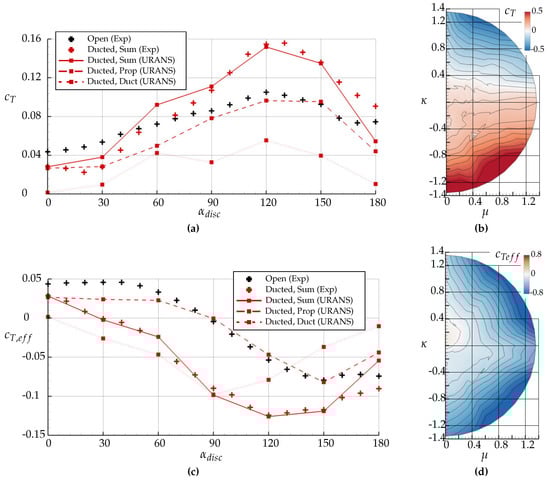
Figure 13.
(a,b) Thrust coefficient and (c,d) effective thrust coefficient . (a,c) ; black: open propeller; red: ducted propeller configuration. (b,d) Plot of total loads of the ducted configuration over and . Wind tunnel data.
Oppositely, for relatively small advance ratios below around , the lateral inflow magnitude (plotted on the x-axis in Figure 13b) influences the thrust level only to a minor extent. With the primarily horizontal scheme of the isolines of the thrust in the figure, the previously mentioned dependency on the inflow angle can be specified to a variation of the axial inflow magnitude (plotted on the y-axis).
The total thrust of the ducted configuration is mainly produced by the propeller. Nonetheless, the duct increases the axial velocity at the propeller plane, especially at low inflow angles. Hence, the thrust portion produced by the propeller is reduced in comparison to the isolated propeller (see Figure 13a). Similar to the case of the isolated propeller, the propeller thrust of the ducted configuration increases with a rising inflow angle to a maximum at due to a variation of the local inflow angle and magnitude at the blade sections (see Figure 3). At higher inflow angles, the thrust decreases again.
At an axial inflow with an advance ratio of , the duct produced only a minor portion of thrust, since the duct produced a drag high enough to overcompensate for the duct thrust. Nonetheless, the duct thrust increased with the inflow angle. Between inflow angles of , the relatively high thrust portion of the duct can be explained by its lift force, which was partially aligned towards to the thrust direction. For higher inflow angles of , it can be explained by the fact that its drag force was partially oriented towards the thrust direction. Over the whole inflow angle polar, a maximum of around 40% of the total thrust was produced by the duct. For nearly all inflow angles, the propeller thrust portion was reduced by the duct in comparison to the isolated propeller. Only at did the duct increase the propeller thrust by a shielding of the inflow, hence reducing the local propeller inflow velocity. This aspect will be discussed in detail in Section 4.3.4 of the flow field analysis.
For the design of an aircraft, the thrust produced in the flight direction especially is of primary importance. Therefore, the herein defined effective thrust coefficient (see Figure 1) is plotted in Figure 13c. It is apparent that the increasing thrust coefficient of the propeller over is compensated by the fact that the thrust vector is rotated away from the flight direction. The isolated propeller produces an approximately constant effective thrust up to an inflow angle of around ; then it decreases. For the ducted configuration, the propeller thrust remains constant over a wider inflow angle regime of up to .
The duct itself shows a different behavior. While the thrust coefficient of the duct increases up to an inflow angle of , as well, the long duct shape produces additionally a strong force perpendicular to the propeller axis . Already at small inflow angles, this force has a component oriented in the inflow direction which overcompensates for the produced thrust. Therefore, the effective thrust portion of the duct decreases rapidly with the inflow angle (see Figure 13c). The plot of the total effective thrust over and (see Figure 13d) shows that eventually, the ducted configuration can produce effective thrust only for a limited regime of operating conditions of and .
In Figure 14a, the lift force coefficient (perpendicular to the inflow direction; see Figure 1) is plotted over the inflow angle. It is apparent that under an axial inflow ( and ), no lift force is produced. Insights into the different behavior of propeller and duct under non-axial conditions give the comparison of their thrust portions for . At lower inflow angles between , the duct produces much more force in the lift direction than the propeller. This “wing-lift” of the duct in the sense of an increased angle of attack has a greater effect than the rotation of the propeller thrust towards the lift direction. Oppositely, at higher inflow angles between , the propeller lift is three times higher than the lift force produced by the duct. The characteristics of the polar of the propeller lift portion are similar to those of the isolated propeller’s polar. In total, for the analyzed operating conditions, the ducted configuration forms a nearly symmetric lift polar. At its maximum, the lift is around 60% higher than the portion of the propeller lift force alone.
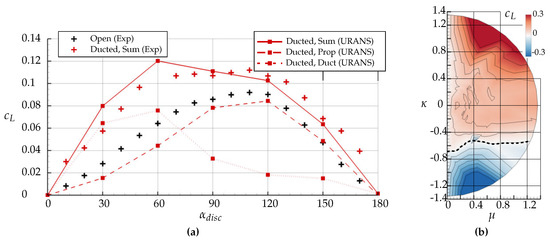
Figure 14.
(a,b) Lift coefficient . (a) ; black: open propelle; red: ducted propeller configuration. (b) Plot of total loads of the ducted configuration over and . Wind tunnel data.
Plotted over and , it becomes apparent that the ratio of propeller lift portion to duct portion is strongly dependent on the advance ratio. For small advance ratios, the maximum lift occurred for , produced primarily by the rotation of the propeller’s thrust vector. For high advance ratios, the maximum occurred for , primarily due to the lift polar of the duct. Furthermore, the figure shows that a limit of maximum reverse inflow existed between around and (highlighted by the dashed line in Figure 14b). Beyond that, the configuration produced down-force.
In Figure 15, the pitching moment coefficient is plotted over the inflow angle. Two findings shall be described here. First, for the ducted configuration, the pitching moment portion of the ducted propeller showed a zero-crossing. At smaller inflow angles, the propeller produced a negative pitching moment, which tended to rotate the propeller towards the inflow. This stable behavior was contrary to the isolated propeller and ended at an inflow angle of . For higher inflow angles, the pitching moment was positive. On the contrary, the duct experienced a positive (unstable) pitching moment for all inflow angles. Particular at an inflow angle of , the moment was very high and tended to rotate the duct away from the inflow.
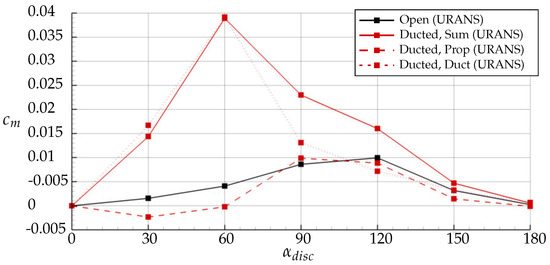
Figure 15.
Pitching moment coefficient . , URANS results.
The second finding was the relation of the pitching moment portion of the duct in comparison to the one of the propeller. The magnitude of the propeller portion was exceeded by the duct by the factor four. The reasons for that were the long chord length of the duct and the fact that all moments were referred to the center of the propeller plane, located at around 24% of the duct chord length. The resulting high forces produced by the duct body resulted in the large moment around the propeller’s center.
The comparison of the propeller portion of the pitching moment with the characteristics of the open propeller revealed a strong influence of the duct on the propeller pitching moment as well. Due to the interference with the duct, the propeller produced a pitching moment twice as high as without it which will be discussed in Section 4.3 of the flow field analysis. Furthermore, the influence of the duct on the flow field and the corresponding inflow conditions at the local blade sections of the propeller led to the inversed direction of the pitching moment at lower inflow angles.
4.2. Transient Loads
In this section, the thrust coefficients of the propeller and the duct thrust portions and are illustrated time-resolved over one propeller revolution for different inflow angles.
Figure 16 shows that under an axial inflow, the propeller thrust is constant over time. Already for minor non-axial inflow conditions ( and ), the thrust becomes periodic due to the asymmetric influence of the non-axial inflow on the local blade section conditions. Yet the fluctuations are rather small (see the red lines). A similar characteristic is valid for a very high inflow angle () and a fully reverse inflow (; see the green lines).
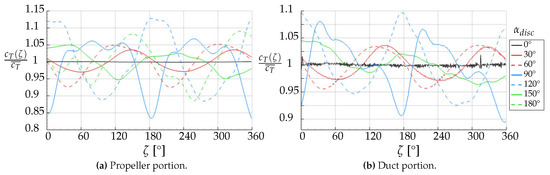
Figure 16.
Time-resolved relative (a) propeller and (b) duct thrust coefficients over one propeller revolution for different inflow angles. Plotted in relation to their individual averaged thrust magnitudes. , URANS calculation.
On the contrary, the blue lines, showing the transient propeller thrust for the inflow angles and , indicate a highly fluctuating thrust behavior. This results from a high inflow asymmetry inside the duct, caused by a recirculation zone at the windward side of the duct. It results in low velocities on the windward side of the propeller plane, while on the leeward side the flow through the duct is accelerated. This can be seen graphically in Section 4.3.4 of the flow field analysis.
Concerning the transient loads of the duct, they generally fluctuate to a minor extent compared to the propeller loads, and their tendencies strongly follow the behavior of the transient propeller loads. Hence, one can assume that the interference with the propeller is the main reason for transient duct loads. Of minor importance are the duct-specific flow phenomena, such as the forming of large-scale recirculation zones. They seem to be more constant over time and contribute less to the load fluctuations.
4.3. Flow Field Analysis
In this section, the flow field of the ducted propeller is analyzed and compared to the isolated propeller, illustrating the individual influence of the inflow angle on the applied configuration. One motivation for the application of a duct is the minimization or even prevention of the forming of blade tip vortices, which would in reduced induced drag. Other effects are the acceleration of the fluid in front of the propeller and deceleration downstream of the propeller, respectively, resulting in forward-directed low-pressure areas and backward-directed high-pressure areas. The analysis will show that the selected duct realized these benefits for limited operating conditions.
4.3.1. Axial Inflow,
In Figure 17, the induced axial velocity in the flow fields of the isolated and the ducted propeller are shown for an axial inflow () and an advance ratio of . Thereby, the velocity is normalized in such a way that the magnitude of the possibly occurring lateral inflow velocity component is substracted, reading
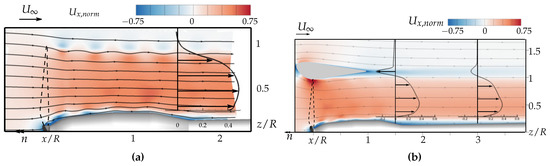
Figure 17.
Normalized induced axial velocity component . (a) Open propeller, (b) ducted propeller. URANS calculation. , .
The formation of the blade tip vortices was prevented by the duct and replaced by a continuous shear layer surrounding the propeller slipstream. One can also see that the duct increased the flow velocity on the propeller plane, while reducing it downstream of the duct (the line plots at show a maximum normalized induced axial velocity of around for the isolated configuration versus for the ducted propeller). Furthermore, it is apparent that under the high advance ratio of , the duct cannot form an area of increased velocity and favorable suction at the inlet lip. Instead, nearly the complete forward-directed surface faces a decelerated inflow.
In Figure 18, the pressure coefficient on the duct surface is plotted for two selected inflow conditions ( m/s and m/s; thus, and ). The comparison reveals the strong dependency of the “duct-benefits” on the inflow velocity. Under the lower inflow velocity, the duct formed a favorable suction at the inlet and an increase in static pressure at the diffusor surface. Additionally, the pressure coefficient at the convex outside duct surface was higher for the reduced velocity, resulting in a further thrust increase. Note that under the reduced inflow velocity, the propeller showed a higher influence on the pressure distribution of the duct, indicating that the produced propeller thrust was higher than at m/s.
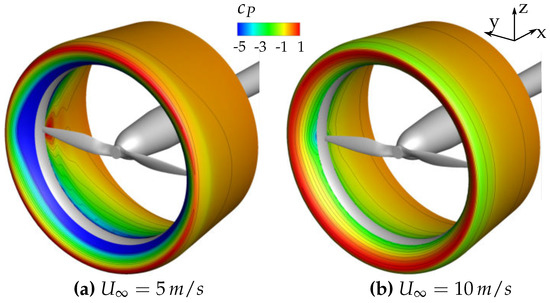
Figure 18.
Pressure coefficient distribution on the duct contour. rpm, . URANS calculation.
The comparison of the axial velocities of both configurations indicates a different radial velocity distribution. The flow inside the ducted propeller wake showed maximum velocity at the inner region, while towards the tips of the blades, the velocity decreased. The reasons for this were the deceleration due to the duct geometry by the wake expansion and the surface friction. A similar deceleration effect on the surrounding outer flow was recognizable as well.
A more precise view of the flow fields of the isolated and the ducted propeller is enabled by the illustration of their normalized vorticity components perpendicular to two intersecting planes (see Figure 19a,b). The left planes are located in the cross-sections of the propellers (), showing the normalized vorticity in y-direction , illustrating, for example, the blade tip vortices and the blade wakes. The right planes are placed normal to the inflow direction in a distance of R and show the normalized vorticity in the inflow direction , reading
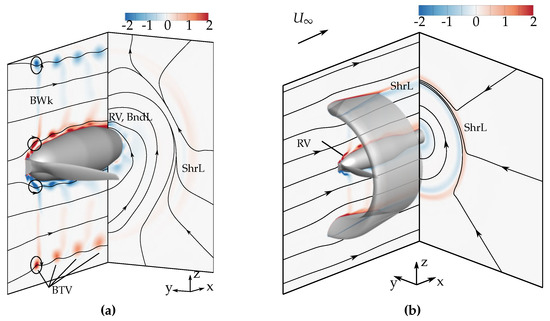
Figure 19.
Normalized vorticity components perpendicular to two intersecting planes. (a) Open propeller, (b) ducted configuration. URANS calculation, , .
One recognizes the forming of the tip vortices by the open propeller versus the production of a continuous shear layer (ShrL) by the ducted configuration. This shear layer is formed by two velocity gradients. First, the difference in the axial velocity by the propeller wake acceleration and the boundary layer of the duct. Second, the difference in the rotational velocity by the swirling of the propeller wake.
The inside and the outside surfaces of the duct, and therefore, their boundary layers, were oriented oppositely to each other. Likewise, the decelerating influences of the duct surfaces and the resulting velocity gradients of the axial velocity were oriented against each other. Therefore, the sign of the vorticity in y-direction alternates within the continuous shear layer (see left plane).
For the ducted propeller, the shear layer was visible in both planes. In the plane at the propeller’s cross-section, it showed the velocity gradient in z-direction due to the accelerated propeller wake and the influence of the duct surface boundary layer. In the perpendicular plane, these effects were not visible since their corresponding vorticity was oriented tangential to the plane. Instead, the visible circular ring of vorticity showed the vorticity component in x-direction of the shear layer, caused by the gradient of the circumferential velocity.
Furthermore, the in-plane streamlines indicate a sharp separation of the rotating propeller wake and the outer flow around the duct. Oppositely, for the case of the open propeller, the blade tip vortices especially cause a stronger mixing of inner and outer flow, resulting in a more gradual transition. Therefore, the circumferential shear layer in Figure 19a is much less distinct and the streamlines of the open propeller indicate a higher influence of the outer flow on the propeller wake, while for the ducted configuration, the swirl of the flow is dominant. One recognizes both in the accelerated core flow and in the outer flow a radial velocity component towards the center of the propeller flow. Reasons for this are the acceleration of the propeller flow and the corresponding contraction of the propeller wake, and the convex contour of both the outside duct contour and the wind tunnel support fairing at this slice location.
4.3.2. Minor Inflow Angle,
The flow field of the ducted propeller is more influenced by the non-axial inflow than the one of the open propeller. In Figure 20, the normalized velocity component in the direction of the propeller axis is plotted. It is apparent that a main effect of the duct is the forming of a large-scale recirculation zone downstream of the leeward duct lip.
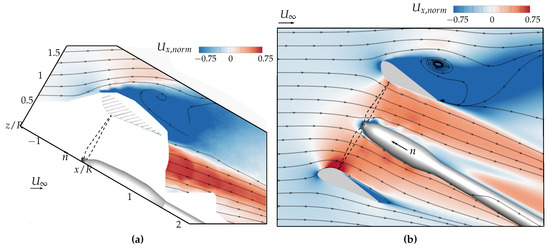
Figure 20.
Normalized induced axial velocity component of the ducted propeller. (a) PIV measurement with blanked areas due to shading of the PIV laser sheet. (b) URANS calculation. , .
The recirculation zone was surrounded by two distinct shear layers, beginning at the leading edge and at the trailing edge of the duct, respectively (see Figure 21). A vortex could be seen inside this leeward recirculation zone, driven by the deflected outer flow. The mixing of the flow in that vicinity caused a spreading of the the surrounding shear layer downstream of the vortex.
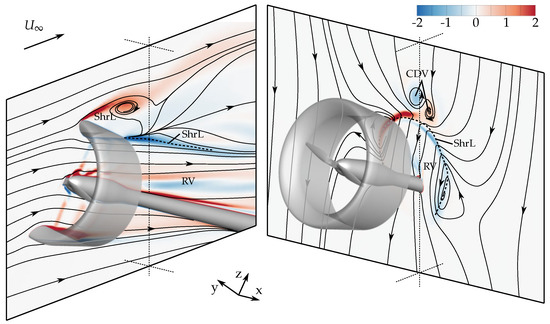
Figure 21.
Normalized vorticity components perpendicular to two intersecting planes. URANS calculation, , .
Already at an inflow angle of , a strong acceleration of the propeller flow occurred at the windward side of the duct due to the convex shape of the inside duct contour. On the contrary, downstream of the propeller plane, a rapid flow deceleration occurred. The correlated increase of the static pressure resulted in a pressure-induced flow separation and another small recirculation zone inside the duct (see Figure 20b).
On the leeward side, the propeller wake was decelerated over a large portion of the of the duct inlet. At an inflow angle of , this area was oriented forward, resulting in a large portion of drag. Furthermore, the asymmetry of the pressure distribution with strong suction on the windward side and a pressure increase at the leeward inlet lip caused a high pitching moment.
The shear layer from the leeward trailing edge between the recirculation zone and the propeller wake is marked with a dashed line in both the plane of the propeller’s cross-section and in the right plane, perpendicular to the inflow. On the right, the curved character of this shear layer is apparent, following the curvature of the duct geometry. Since on the negative y-side, the rotational velocity of the propeller flow is oriented roughly in the direction of the non-axial inflow component (in the z-direction), while on the positive y-side, the velocity components are oriented against one another, the vorticity changes in sign over the circumference.
Additionally, while evaluating the vorticity vectors caused by the gradient of the axial velocity between propeller wake and outer flow at different locations, their clockwise orientation and alignment on a curve around the propeller wake (looking from the front downstream) becomes apparent.
With the propeller axis tilted against the flow direction, and therefore, against the right plane, the vorticity is oriented diagonal to the inflow direction at the maximum and minimum y-locations, resulting in vorticity components aligned with the inflow direction, hence being visible on the right plot at these locations (see the in-plane streamlines forming vortices). In contrast, at the maximum and minimum z-locations, the vorticity is oriented tangential the right plane, and therefore, not visible.
In the right slice, one can also recognize a lateral deflection of the flow in the y-direction towards the propeller slipstream, caused by the acceleration of the wake of the propeller. Inside the propeller wake, the in-plane stream lines are oriented straight downwards, since the axial velocity of the accelerated propeller wake has a large velocity component tangential to the slice, outweighing the circumferential velocity component of the rotating wake.
The root vortex (RV) is visible in both planes, deflected by the non-axial inflow component and convecting downstream away from the support structure.
Furthermore, another vortex pair is visible in the right plane on top of the leeward recirculation zone. For easier reference in further descriptions, in this work, these vortices are called central duct vortices (CDV). Their formation is based on the superposition of two flow effects, as illustrated in Figure 22.
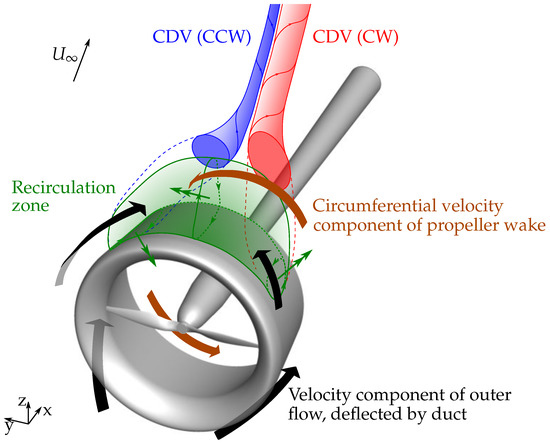
Figure 22.
Formation of the central duct vortices. Derived from URANS calculation, , .
The first effect is the rotation inside the large-scale recirculation zone in leeward of the duct (green zone). Its rotation is illustrated schematically by the circumferential velocity and the rotation vector at three locations and can be described as a bent spiral. The second effect is the outer flow (black arrows). Upstream of the duct, its deflection results in velocity components on the y-axis facing away from the duct. Downstream of the duct, the outer flow is deflected towards the propeller wake around the duct surface. Still, due to flow separation, it does not penetrate the recirculation zone but sweeps on top of it and accelerates the rotational flow inside the recirculation zone.
At the negative y-location, the superposition of the recirculation zone rotation and the inward-directed outer flow then forms a clockwise oriented vortex (CW CDV). The vortex is intensified by the circumferential velocity component of the rotating propeller wake, located directly under the formed vortex (brown arrows). In contrast, at the positive y-location, a counter-clockwise oriented vortex (CCW CDV) is formed due to the inverted direction of the recirculation zone rotation. Hence, this vortex is decelerated by the rotating propeller wake, and its vorticity is lower than the one of the clockwise vortex (see Figure 21).
4.3.3. Medium-High Inflow Angle,
For an inflow angle of , a large portion of the flow field leeward of the isolated propeller showed an increased normalized axial velocity due to the aligning of the fluid towards the direction of the propeller axis (see Figure 23a). On the contrary, at the windward side, deceleration could be recognized due to the blockage effect of the support structure and the inner region of the propeller wake. The main flow structures of the propeller wake were still detectable downstream of the leeward side of the propeller plane, like the convecting tip vortices. Similarly to the flow field under axial inflow, one can recognize the blade wakes and their bending by the induction of the tip vortices. The root vortex bent away from the support structure, making it clearly visible in the propeller’s cross section as a zone of reduced axial flow velocity.
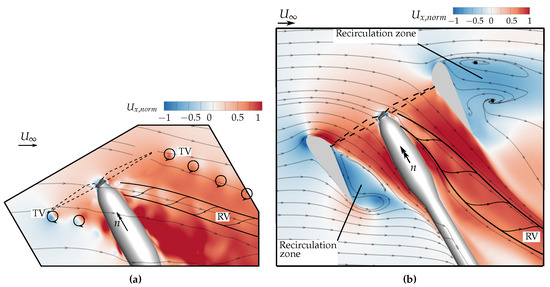
Figure 23.
Normalized induced axial velocity component . (a) Open propeller, (b) ducted propeller. URANS calculation. , .
In the flow field of the ducted propeller, two large-scale regions of separated flow were formed due to flow separation at both the windward and the leeward inlet lips (see Figure 23b). At the duct’s windward inlet lip, a significant flow velocity peak was formed directly upstream of the propeller plane. Inside the duct, the recirculation zone narrowed the flow through the duct, causing another region of accelerated flow. On the contrary, the highly tilted duct surface caused a stagnation of the outer flow, similarly to the region close to the leeward inlet lip.
This velocity distribution resulted in a strong asymmetry concerning the static pressure, especially at the contours of the duct inlet lips. At the windward side, the highly accelerated flow formed a pressure coefficient of around (see Figure 24). In contrast, at the leeward side, stagnation occurred over a large portion of the inlet lip, resulting in a pressure coefficient of around . Another asymmetry was present concerning the outer flow as well, yet in a minor magnitude of versus . This strong asymmetry of the pressure distribution resulted in the largest detected pitching moment coefficient of around (see Figure 15).
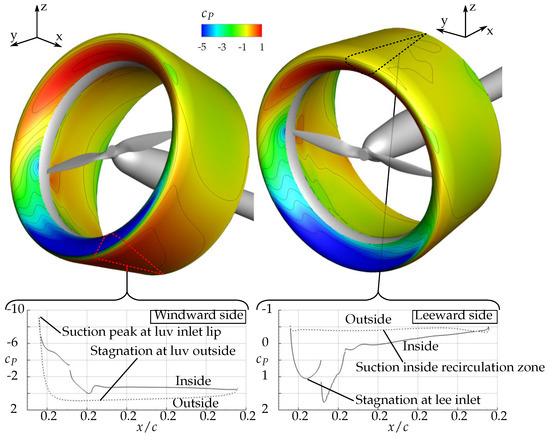
Figure 24.
Pressure distribution around the duct contour at the propeller’s cross-section (). URANS calculation, , .
The illustration of the vorticity at two intersecting planes (see Figure 25) enables a more detailed analysis of the flow field. In the left plane, at the propeller’s cross-section, one can see the sizes of the mentioned recirculation zones, the trail of the surrounding shear layers and the strong deflection of the propeller wake. Additionally, it is apparent that the support structure caused another large recirculation zone.
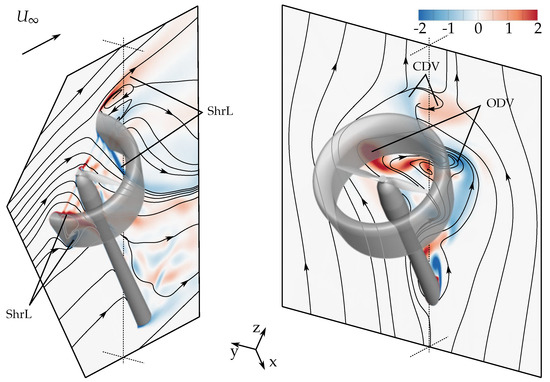
Figure 25.
Normalized vorticity components perpendicular to two intersecting planes. URANS calculation, , .
In the right plane, one can see that the shear layer, starting at the trailing edge of the duct, was only barely visible at this stage, since its vorticity was oriented rather tangential to the slice plane. Instead, the plot became dominated by the two vortices, starting from the maximum respective minimum y-location of the duct. In this work, this vortex pair are called outer duct vortices (ODV). Their formation is illustrated schematically in Figure 26.
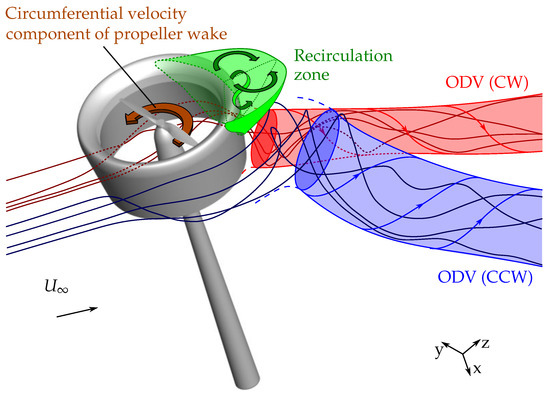
Figure 26.
Formation of the outer duct vortices. Derived from URANS calculation, , .
When the inflow hit the duct contour, it was deflected massively by its body since under this inflow angle, the flow was oriented against the duct contour rather than inside its throat. The streamlines in Figure 25 right illustrate this deflection even far away of the duct. Close to the body, the degree of deflection was highly uneven. Together with the tilted round shape of the duct, this caused a rotation of the outer flow in the vicinity of the outer duct contour. Downstream of the duct, the magnitude of the velocity component of the outer flow towards the propeller wake varied depending on the location along the duct chord, hence increasing the strength of the rotation. Eventually, two vortices were formed downstream of the duct. The vortex starting at the minimum y-location rotated counter-clockwise and was accelerated by the rotation of the propeller wake; the other one rotated in the opposite way.
In comparison to the inflow angle , the flow inside the leeward recirculation zone is here more complex (compare Figure 22). Two counter-rotating vorticity components next to each other can be recognized which are accelerated by the conjuncture of the surrounding outer flow downstream of the duct. The opposing rotational sense results from the curved shape of the passing outer flow on both sides of the recirculation zone. Perpendicular to these vortices, two additional counter-rotating vorticity components on top of each other are formed (s-shaped green arrow). Their rotatianal sense is based on the outer flow passing over the recirculation zone and the propeller wake passing under the recirculation zone, respectively. Eventually, inside the recirculation zone, diagonally oriented and interfering movements occur.
In the right slice plane can be seen that the central duct vortices (CDV), which are based on the flow in the recirculation zone, are reduced in strength and more spread in comparison to the inflow condition . It is believed that under , the increased complexity of the flow inside the recirculation zone with a less distinct rotational spiral is responsible for this reduction of the CDVs.
4.3.4. High Inflow Angles, = 90–180
At an inflow angle of , the outer flow still separated at the leeward inflow lip of the duct (see Figure 27a). Therefore, the large-scale leeward recirculation zone and the surrounding shear layers were still present. Additionally, in combination with the convecting outer flow, the central duct vortices (CDV) were formed as well.
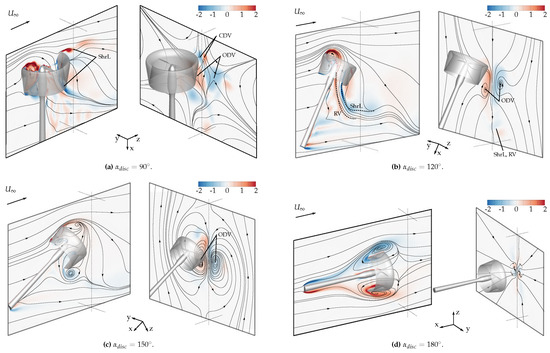
Figure 27.
Three-dimensional illustration of the vortex structures under high inflow angles and reverse inflow, respectively. Normalized vorticity components perpendicular to two intersecting planes. URANS calculation, , .
Inside the duct, one can see that at the windward side, half of the duct throat was blocked by the inner recirculation zone with two counter-rotating vortices. The flow passed through the duct only on the leeward side. Figure 28 shows the velocity components occurring at a section close to the propeller plane, area-averaged over the duct’s throat area. The data were obtained by one time-step of the URANS calculations.
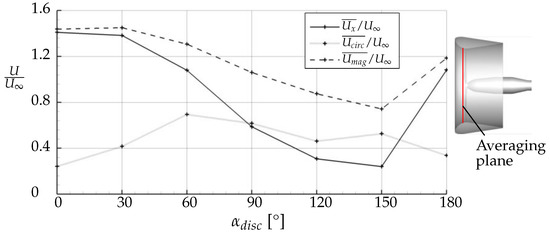
Figure 28.
Area-averaged velocity components at the duct throat. URANS calculation, .
That illustrates the reduction of the averaged axial velocity for inflow angles between due to the blocking by the inner recirculation zone. On the contrary, the averaged circumferential velocity was increased. Eventually, both effects increased the local inflow angle at the blade sections . Therefore, the increased blockage of the flow inside the duct under high inflow angles is one reason for the high propeller thrust coefficient which possibly even outweighs the thrust of an isolated propeller (see Figure 13a).
Especially under high inflow angles, the flow field around the duct is characterized by a high asymmetry concerning the flow velocities and pressure distribution. Figure 27 shows the recirculation zone formed at the windward inlet lip of the duct, correlated with low velocities. On the contrary, the flow through the leeward side of the duct showed very high velocities. This asymmetry has two other major effects. First, the propeller experiences a high pitching moment. Figure 15 shows that at the inflow angles and this moment is around ten times higher compared to all other inflow angles. The second effect is a high fluctuation of the propeller loads during one propeller revolution. In Figure 16, the transient propeller thrust coefficient is plotted over one propeller revolution. It shows that the propeller experiences highly fluctuating loads at high inflow angles of . These fluctuating loads cause strong vibrations with consequences for the whole propulsion system or even the aircraft structure.
In the right plane perpendicular to the inflow of Figure 27a, one can see that the central duct vortices (CDV) become less distinct while the outer duct vortices (ODV) become increasingly the main flow effect of the slip-stream.
For inflow angles higher than ninety degrees, the central duct vortices were no longer present. Figure 27b shows that the flow separation at the windward inlet lip and the suction of the propeller wake cause reverse flow upstream of the duct. This reduces or completely prevents the formation of a recirculation zone downstream of the duct, and thereby, the formation of the central duct vortices.
For inflow angles between , the outer duct vortices dominate the flow field. For a complete reverse flow of , they vanish since the aligning of the duct axis along the inflow direction prevents the superposition of velocity components of different directions.
Comparing the series presented in Figure 27, it is apparent that with increasing inflow angle, the recirculation zone inside the duct moves forward, and eventually, for a reverse inflow it moves around the inlet lip to a location outside the duct. Simultaneously, the leeward recirculation zone decreases in size and forms a concentrated vortex similar to the one of the inside recirculation zone. Thereby, a symmetry of the flow field is reached. Additionally, the blockage inside the duct vanishes. This results in a dramatic increase of the average axial velocity at the propeller plane (see Figure 28), and thereby, in a major decrease of the propeller thrust (see Figure 13a).
5. Conclusions and Outlook
The influences of non-axial inflow conditions on a small-scale isolated propeller and ducted configuration were analyzed by aerodynamic force measurements at different inflow angles. In addition, investigations of the flow field were performed by the application of PIV and URANS calculations.
Under static thrust conditions, the ducted propeller configuration produced more thrust than the open propeller. At only relatively low advance ratios, the beneficial effect of the duct on the total thrust vanished due to the increasing pressure drag reducing the effective thrust. A similar effect occurred under non-axial inflow; the ducted propeller configuration showed a higher sensitivity in comparison to the open propeller, further decreasing the ability of the ducted propeller to produce thrust in the flight direction. Instead, the duct produced a high force component perpendicular to the propeller axis with a force component in the drag direction. Additionally, a high pitching moment was produced under non-axial inflow.
The analysis of the transient aerodynamic loads showed that at high inflow angles of and , the total thrust of the ducted configuration was highly fluctuating due to a recirculation zone formed inside the duct. Besides that, a high pitching moment was produced under non-axial inflow due to a strong pressure asymmetry acting on the large duct surface.
The detailed analysis of the occurring flow fields helped to explain the load characteristics. Specific flow effects, such as the formation of complex vortex structures, could be identified and illustrated. Their existence could be addressed and connected to specific inflow conditions.
Overall, the analyzed duct shape is disadvantageous in order to produce effective thrust under high advance ratios or non-axial inflow conditions. It is rather useful for static thrust conditions or in order to produce a lift force. As a thrust propulsor of a flying vehicle, a duct with a thinner lip should be considered. Additionally, in case non-axial inflow may occur, the duct chord length should be minimized.
Due to opposing benefits of different geometries, the design of the duct shape has to fit to the individual mission profile. In particular, the portion of time in which the aircraft shall perform flight operations at low advance ratios or even hover flights plays a major role in the design process and for the decision of whether or which duct shape could possibly be useful for the target mission. An innovative technique may be promising for extending the beneficial range of operating conditions. A flexible duct geometry, possibly realized by a membrane over an inner forming rigid structure, could constitute a long duct with a large inlet lip for take-off or hover operations. During forward-flight, the duct’s inlet lip could be narrowed and its chord be length-shortened for minimizing pitch moments, lateral forces, pressure drag and surface friction while still being able to prevent the formation of blade tip vortices.
Author Contributions
Conceptualization, M.C. and C.B.; methodology, M.C. and C.B.; investigation, analysis and visualization, M.C.; validation, M.C.; data curation, M.C.; writing, review and editing, M.C. and C.B.; project administration and funding acquisition, C.B. All authors have read and agreed to the published version of the manuscript.
Funding
This research (Project HyProp) was funded by the Bavarian Research Foundation (Bayerische Forschungsstiftung) under the grant number AZ-1277-17.
Acknowledgments
The successful collaboration and support by the project partner Rolls-Royce Deutschland is highly acknowledged. Special thanks are addressed to ANSYS for providing the flow simulation software. Last but not least, the authors thank the company APC Propellers for providing the geometrical data of the analyzed propeller.
Conflicts of Interest
The authors declare no conflict of interest. The funders had no role in the design of the study; in the collection, analyses, or interpretation of data; in the writing of the manuscript, or in the decision to publish the results.
Abbreviations
| Force coefficient, [-] | |
| Pitching moment coefficient, [-] | |
| Pressure coefficient, [-] | |
| J | Propeller advance ratio, [-] |
| L | Lift force, [N] |
| n | Rotational speed [Hz] |
| q | Stagnation pressure, [Pa] |
| r | Radial position [m] |
| R | Propeller radius [m] |
| T | Thrust force [N] |
| Effective thrust, [N] | |
| Induced velocity [m/s] | |
| Effective inflow velocity at local blade section [m/s] | |
| Inflow velocity [m/s] | |
| Velocities in x (axial), y and z-direction [m/s] | |
| Normalized velocity magnitude, [-] | |
| Angle of attack of the propeller disc [] | |
| Effective angle of attack at local blade section [] | |
| Axial advance ratio, [-] | |
| Lateral advance ratio, [-] | |
| Flow angle at local blade section, [] | |
| Density of air [kg/m] | |
| Twist angle at local blade section [] | |
| Vorticity in y-direction [-] | |
| Angular velocity [/s] | |
| Propeller circumferential position [] |
References
- Bristeau, P.J.; Martin, P.; Salaün, E.; Petit, N. The Role of Propeller Aerodynamics in the Model of a Quadrotor UAV. In Proceedings of the European Control Conference, Budapest, Hungary, 23–26 August 2009; pp. 683–688. [Google Scholar]
- Theys, B.; Dimitriadis, G.; Andrianne, T.; Hendrick, P.; Schutter, J.D. Wind Tunnel Testing of a VTOL MAV Propeller in Tilted Operating Mode. In Proceedings of the International Conference on Unmanned Aircraft Systems (ICUAS), Orlando, FL, USA, 27–30 May 2014; pp. 1064–1072. [Google Scholar]
- Glauert, H. Airplane Propellers. In Aerodynamic Theory—Division L; Durand, W.F., Ed.; Julius Springer: Berlin, Germany, 1935; pp. 32–58. [Google Scholar]
- Steen, S.; Koushan, K. (Eds.) Marine Propulsors; Marine Sc. and Eng.: Basel, Switzerland, 2018; ISBN 978-3-03897-202-0. [Google Scholar]
- Hamid, A.; Steen, S. Experimental and Theoretical Analysis of Propeller Shaft Loads in Oblique Inflow. J. Ship Res. 2011, 55, 1–21. [Google Scholar]
- Weir, R.J. Ducted Propeller Design and Analysis; Sandia Report SAND87-211, UC-32; Sandia National Laboratories: Albuquerque, Mexico; Livermore, CA, USA, 1987.
- Pereira, J.L. Hover and Wind-Tunnel Testing of Shrouded Rotors for Improved Micro Air Vehicle Design; University of Maryland: College Park, MD, USA, 2008. [Google Scholar]
- Russell, C.R.; Sekula, M.K. Comprehensive Analysis Modeling of Small-Scale UAS Rotors. In Proceedings of the AHS International 73rd Annual Forum & Technology Display, Fort Worth, TX, USA, 9–11 May 2017. [Google Scholar]
- Russell, C.R.; Theodore, C.R.; Sekula, M.K. Incorporating Test Data for Small UAS at the Conceptual Design Level. In Proceedings of the AHS International Technical Conference on Aeromechanics Design for Transformative Vertical Flight, San Francisco, CA, USA, 16–18 January 2018. [Google Scholar]
- Zhou, W.; Ning, Z.; Li, H.; Hu, H. An Experimental Investigation on Rotor-to-Rotor Interactions of Small UAV Propellers. In Proceedings of the 35th AIAA Applied Aerodynamics Conference, Denver, CO, USA, 5–9 June 2017. [Google Scholar]
- Lindenburg, C. Modelling of Rotational Augmentation Based on Engineering Considerations and Measurements. In Proceedings of the European Wind Energy Conference, London, UK, 22–25 November 2004. [Google Scholar]
- Cerny, M.; Herzog, N.; Faust, J.; Stuhlpfarrer, M.; Breitsamter, C. Systematic Investigation of a Fixed-Pitch Small-Scale Propeller Under Non-Axial Inflow Conditions. In Proceedings of the Deutscher Luft- und Raumfahrtkongress (DLRK), Friedrichshafen, Germany, 4–6 September 2018. [Google Scholar]
- Glauert, H. The Stability Derivatives of an Airscrew; Reports and Memoranda; British A. C. A, HM Stationery Office: Richmond, UK, 1919. [Google Scholar]
- Harris, R.G. Forces on a Propeller Due to Sideslip; Reports and Memoranda, Technical Report No. 427; British A. C. A, HM Stationary Office: London, UK, 1918. [Google Scholar]
- Kutty, H.A.; Rajendran, P. 3D CFD Simulation and Experimental Validation of Small APC Slow Flyer Propeller Blade. Aerospace 2017, 4, 10. [Google Scholar] [CrossRef]
- Lanchester, F.W. The Flying-Machine from an Engineering Standpoint; Constable & Co., Ltd.: London, UK, 1917. [Google Scholar]
- McLemore, H.C.; Cannon, M.D. Aerodynamic Investigation of a Four-Blade Propeller Operating through an Angle of Attack Range from 0 Degree to 180 Degree; NACA Technical Note; Langley Aeronautical Laboratory: Langley Field, VA, USA, 1954. [Google Scholar]
- Misztal, F. Vorträge aus dem Gebiete der Aerodynamik und Verwandter Gebiete; Springer: Berlin/Heidelberg, Germany, 1930. [Google Scholar]
- Bontempo, R.; Cardone, M.; Manna, M.; Vorraro, G. Ducted Propeller Flow Analysis by Means of a Generalized Actuator Disk Model. Energy Procedia 2014, 45, 1107–1115. [Google Scholar] [CrossRef]
- Stanislas, M.; Okamoto, K.; Kähler, C.J.; Westerweel, J. Main results of the second international PIV challenge. Exp. Fluids 2005, 39, 170–191. [Google Scholar] [CrossRef]
- Stuhlpfarrer, M.; Valero-Andreu, A.; Breitsamter, C. Numerical and experimental investigations of the propeller characteristics of an electrically powered ultralight aircraft. CEAS Aeronaut. J. 2017, 8, 441–460. [Google Scholar] [CrossRef]
- You, J.H.; Breitsamter, C.; Heger, R. Numerical investigations of Fenestron™ noise characteristics using a hybrid method. CEAS Aeronaut. J. 2016, 7, 185–207. [Google Scholar] [CrossRef]
© 2020 by the authors. Licensee MDPI, Basel, Switzerland. This article is an open access article distributed under the terms and conditions of the Creative Commons Attribution (CC BY) license (http://creativecommons.org/licenses/by/4.0/).