1. Introduction
The introduction of future configurations of unconventional aircraft demand for innovative structural concepts to improve the structural performance, and thus reduce the structural weight. New materials and specific couplings are necessary to cope with such demanding structural design influencing static and dynamic aircraft performances. Moreover, in the design phase, the structural model could be improved by FE (finite element) analysis and numerical optimizations. In particular, the conventional design process can be improved and simplified when a preliminary step in numerical optimization is adopted. The design space for the aeroelastic tailoring is being significantly enlarged with the introduction of innovative solutions such as Variable Angle Tow (VAT) laminates and curvilinear stiffeners [
1,
2,
3,
4,
5]. Previously experimental/numerical comparisons as in ref [
6,
7] were discussed pointing out specific post-critical behavior of thin-walled composite wing box under bending and torsion loads. A specific analytical procedure for determining equivalent stiffness of box-beam typical configuration has been developed recently. Innovative configurations accounting for local coupling effects due to the presence of straight and curved stringers have been introduced in [
8,
9,
10,
11].
Particularly, the local stiffening effects introduced by innovative configurations may allow unconventional structural coupling and postpone critical aeroelastic phenomena otherwise typical of a wing with a High Aspect Ratio (HAR) [
2,
3,
12,
13,
14]. An appropriate structural model capable of taking into consideration specific structural behavior of such kind of configurations should be adopted, in order to correctly introduce the terms of geometric nonlinearity in the curvatures of the beam, the effects due to the introduction of the composite material and the effects of local stiffness. [
12,
15,
16,
17,
18,
19]. Outcomes obtained within the preliminary stages, where low fidelity models are adopted to navigate the entire design space via optimization or parametric analysis, can be further investigated in the successive design phases, by means of detailed FE analysis.
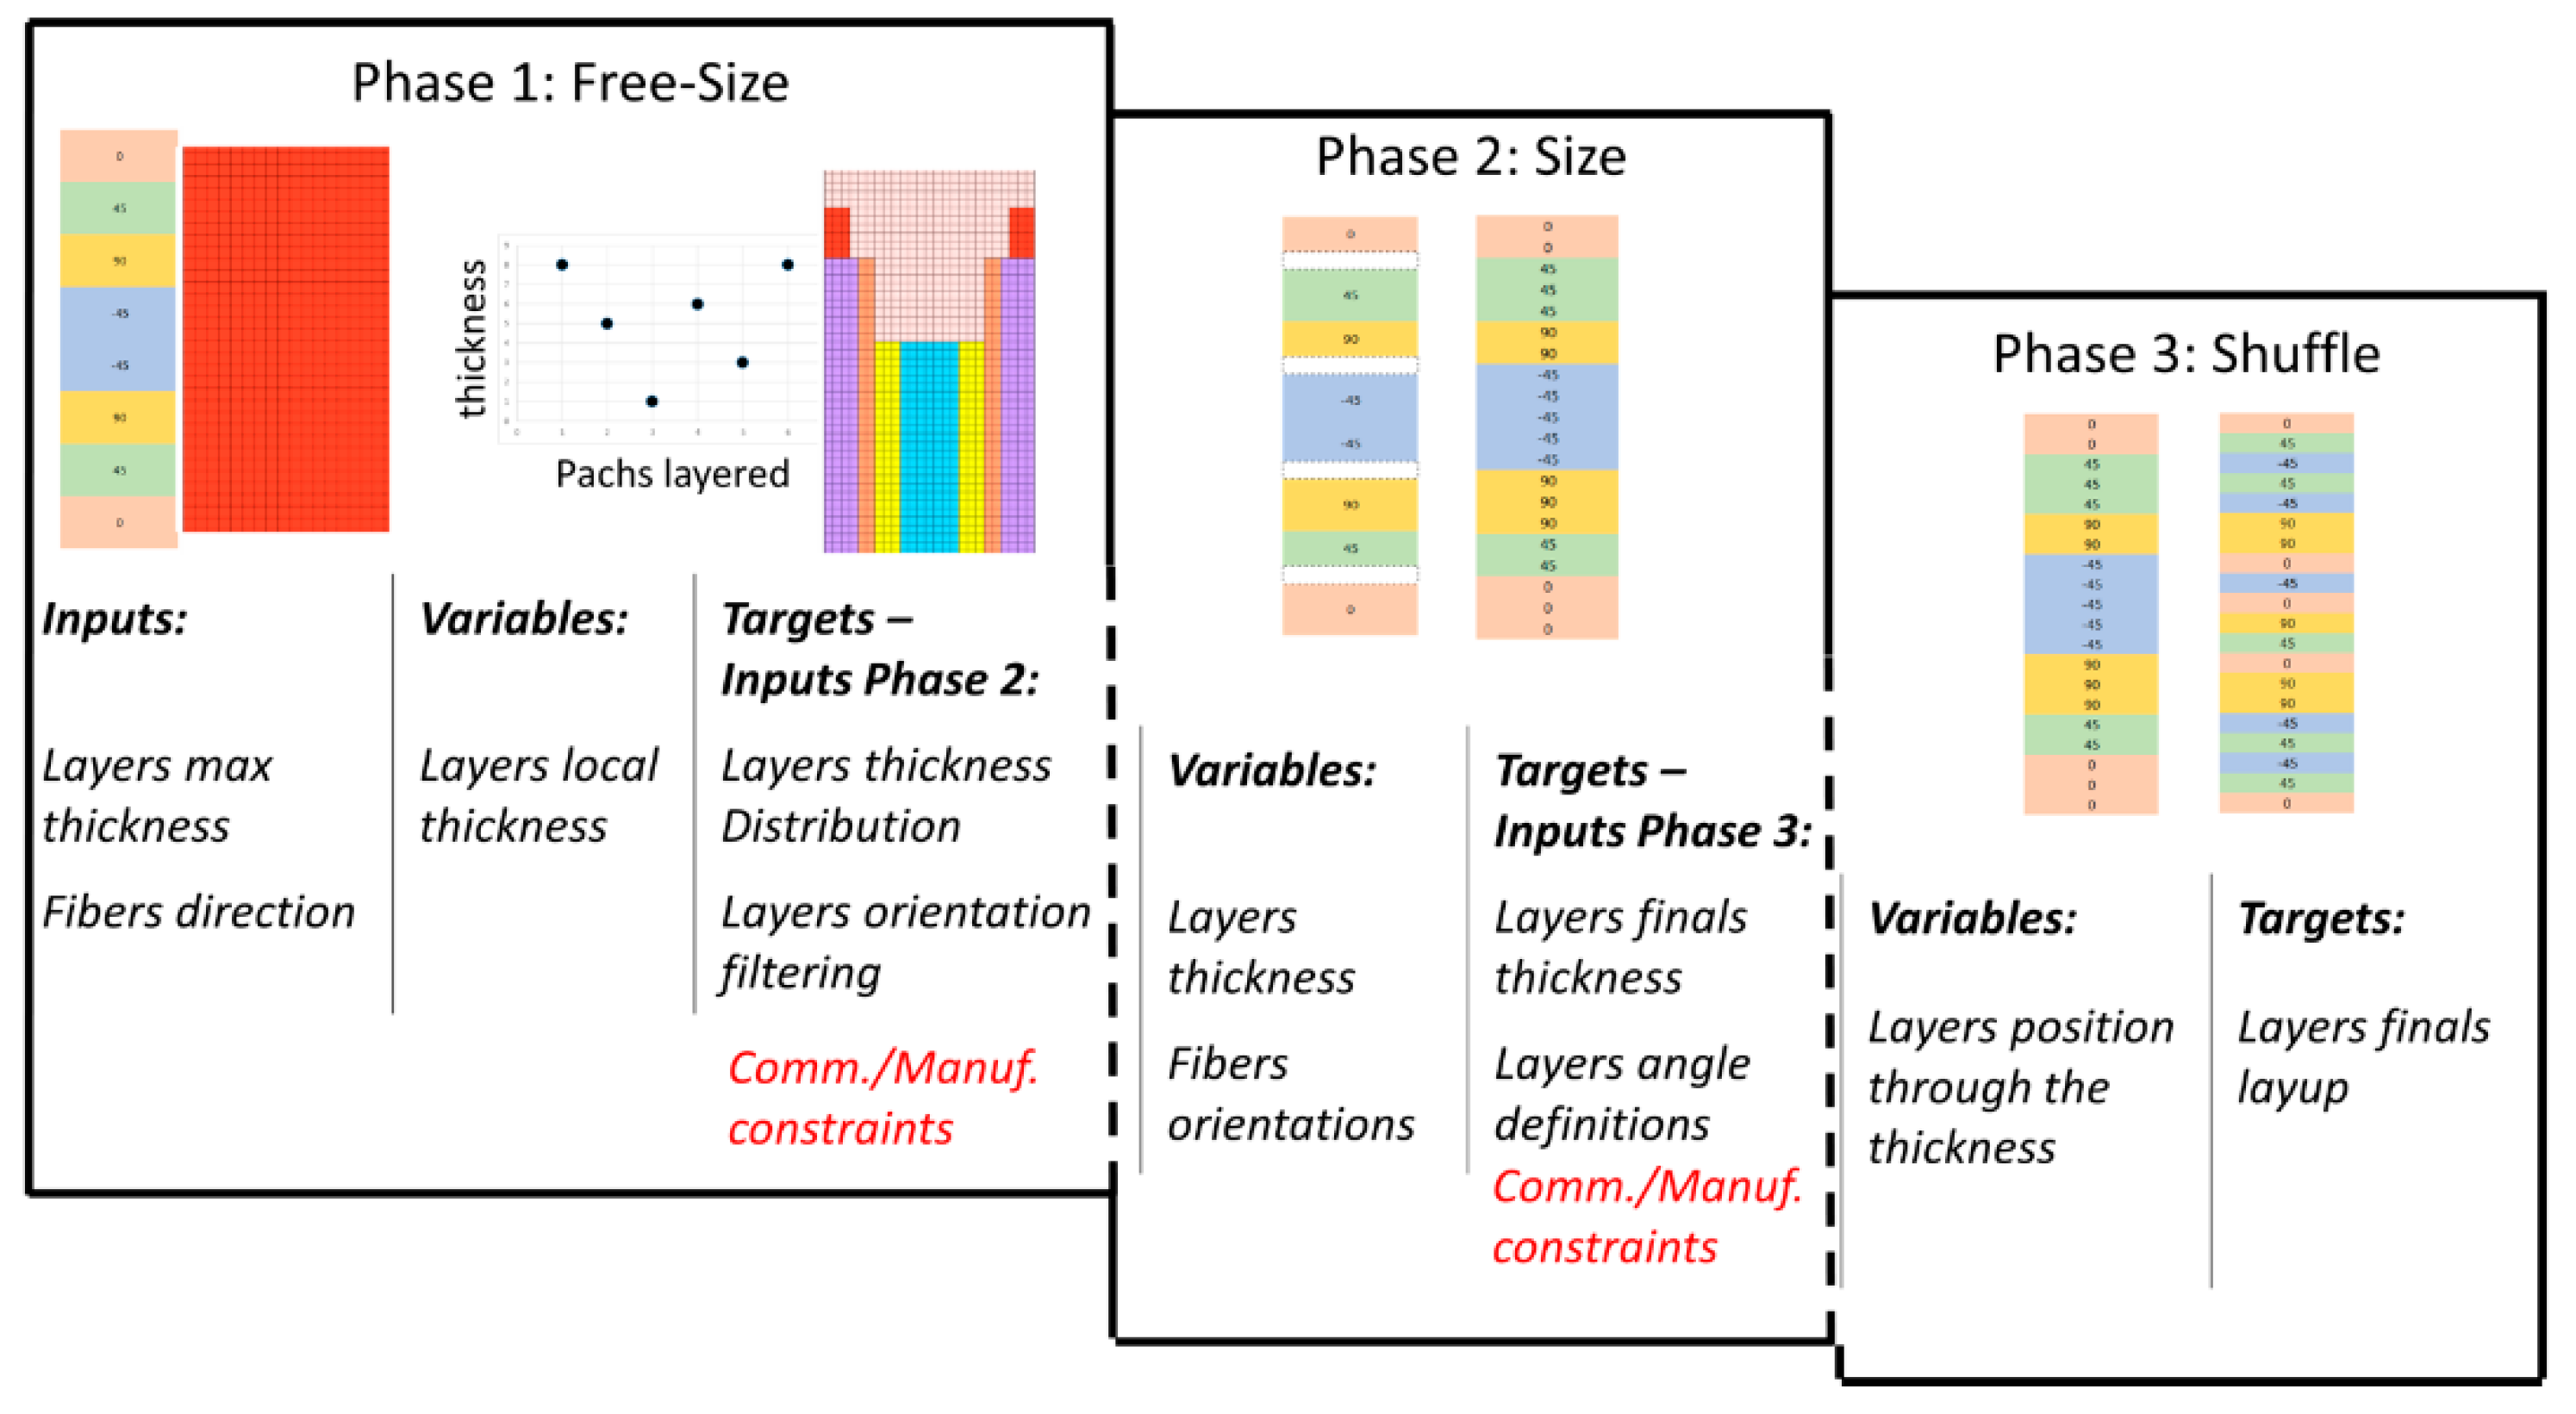
A three steps strategy is implemented in Altair OptiStruct to optimize composite structures. The main features of the optimization strategy are briefly summarized herein (
Figure 1) [
20,
21,
22,
23,
24]. Phase I, namely Free Size Optimization, is useful during the conceptual design stages. It seeks optimal plies thicknesses and orientations starting with an initial guess which commonly is a quasi-isotropic laminate made by thick plies. The latter are defined as “super plies” within Altair’s suite. Phase II begins with the standardization of the thicknesses and orientations considering manufacturing and commercial constraints. It is worth noting that Phase II no longer is a conceptual design stage because it works on component defined geometries and thicknesses. For this stage, the optimization is performed with the Altair’s Free Size Optimization method with the Gauge technique. Finally, phase III performs the stacking sequence optimization, i.e., solves the combinatorial optimization problem aiming at attaining the desired performance by shuffling the plies through the laminate thickness. This task is performed using Altair’s Shuffle Optimization.
The present paper aims to validate the outcomes of a low fidelity beam-wise model previously developed [
8,
9,
10,
11] and analyze design aspects not clearly highlighted by the available literature in the presence of structural couplings typical of innovative aeroelastic configurations. The validation is two-fold namely: (a) the results obtained with a simplified box-beam model are validated through Altair OptiStruct and, (b) an experiment is carried out to fully assess the outcomes of the low-fidelity model. The final objective of the manuscript is to emphasize the need for an accurate low-fidelity model with respect to cumbersome FE optimization for navigating the design domain during preliminary design stages.
The equivalent beam properties of a single-cell box beam are computed as in [
8]. The optimal configuration is identified through a parametric analysis. Concurrently, the optimization is performed using a commercial FE code, namely Altair OptiStruct. Finally, the optimized box-beam is built and tested to assess the numerical results.
2. Equivalent Structural Model for Composite Box-Beams and Numerical Optimization Procedure Description
The beam behavior is described through the longitudinal displacement
u (x, t), the transverse displacement
v (x, t) and
w (x, t), along the y and z axes, respectively, and the torsional angle
θ (x, t), as shown in
Figure 2. Two mutually interrelated coordinate systems are introduced: the first one is the orthogonal Cartesian global coordinate system (
x, y, z) and the second one is the local plate coordinate (
x, s, n) where the n-axis is normal to the middle surface of a plate element, while the s-axis is tangent to the middle surface and is directed along the contour line of the cross-section (
Figure 2). A relation between the two coordinate systems can be established as follows (see
Appendix A for all the symbols):
In the case of a single-cell, closed cross-section, a homogenization method as in [
8,
9,
10,
12] has been used in calculating the effective properties of reinforced shells and plates. A reduced stiffness matrix has been obtained for a single lamina, starting from the unidirectional/orthotropic composite layer relations in the material system (1,2,3) and applying a simple rotational transformation from the material coordinate system to the
x-s-n coordinate system [
8].
The following assumptions have been introduced: the cross-sections do not deform in their own planes; transverse shear effects are discarded (t/2 h ≤ 0.1, t/2 w ≤ 0.1, 2 w/L ≤ 0.1, 2 h/L ≤ 0.1); a free warping assumption (bi-moment effect discarded), valid for a high aspect ratio wing, has been considered while hoop stress resultants are discarded; the shear flow is considered constant (Nxs = cost) in the spirit of the Batho–Bredt theory; the strains are small and the linear elasticity theory has been applied.
Although the membrane approximation is valid in the above range, it would be interesting to investigate the limit of such an approximation and to see whether a modification of the stiffness relations is necessary in certain cases. The mid-plane displacement components
um,
vm, and
wm of an arbitrary point in the global coordinate system can be expressed as:
where
g is a warping correction function and can be determined from the condition that should be a single-valued continuous function as in [
12,
15]. The local plate stiffness ([
A], [
B] and [
D]) is determined on the basis of the lamination angle and the stacking sequence. If symmetric lamination holds, [
B] = 0 and if the circumferential resultant stress and moment are assumed to be zero, according to the thin-walled tube hypothesis, the expressions of the [
A*] and [
D*] matrices are reduced to:
Resultant section loads and stiffness matrix are reported in Equations (5) and (6):
The [
C] matrix in Equation (6) is representative of the membrane contribution and local plate stiffness effect as in [
8]. Specific relations, such as those that represent bending torsion coupled configurations (Circumferentially Asymmetric Stiffness (CAS) models) and stiffness coefficients are computed as in
Table 1 where the area enclosed by the midline of the contour section is reported. The formulation reported in
Table 1 is correctly developed due to the fact that the thin-walled box beam is real. On the contrary, as reported in [
11,
25] when the thin-walled beam is equivalent to a stiffened 3D configuration, a specific torsional approximation is required. Starting from the definitions of the beam curvatures:
It is possible to derive the definition of the system compliance from the point of view of the theoretical beam model:
The compliance value obtained in this way will then be compared successively with the result obtained through Altair OptiStruct. From the experimental point of view, the stiffness of the beam can be obtained by applying first a unitary force in the z-direction and then a unit torque. The application of the Principle of Virtual works (PLV) provides deflection and rotations:
and consequently, the components of the stiffness matrix can be determined as follows:
Once the experimental measurements of the stiffnesses were known, the experimental compliance with the same formula reported in Equation (8) could be evaluated. In the following, because only one experimental flexural test was performed, comparisons will be reported between the theoretical, experimental and FEM analysis only in terms of average deflection and tip rotation when a single force at the end is applied. The comparison in terms of compliance is instead included in the comparison between theoretical and numerical results.
Regarding the optimization procedure, a commercial code is considered: Altair OptiStruct technics Gauge Optimization. Gauge optimization is an iterative process based on gradient methodology applied with Method of Feasible Directions (MFD) algorithm [
23,
24]. During the numerical process design variable changes during each iteration are limited to a narrow range within their bounds, this guarantees a stable convergence. The end of the iterative process corresponds to optimal design (feasible design) when the convergence criteria are satisfied for two consecutive iterations. This means that for two consecutive iterations, the change in the objective function is less than the objective tolerance and constraint violations are less than 1% [
23,
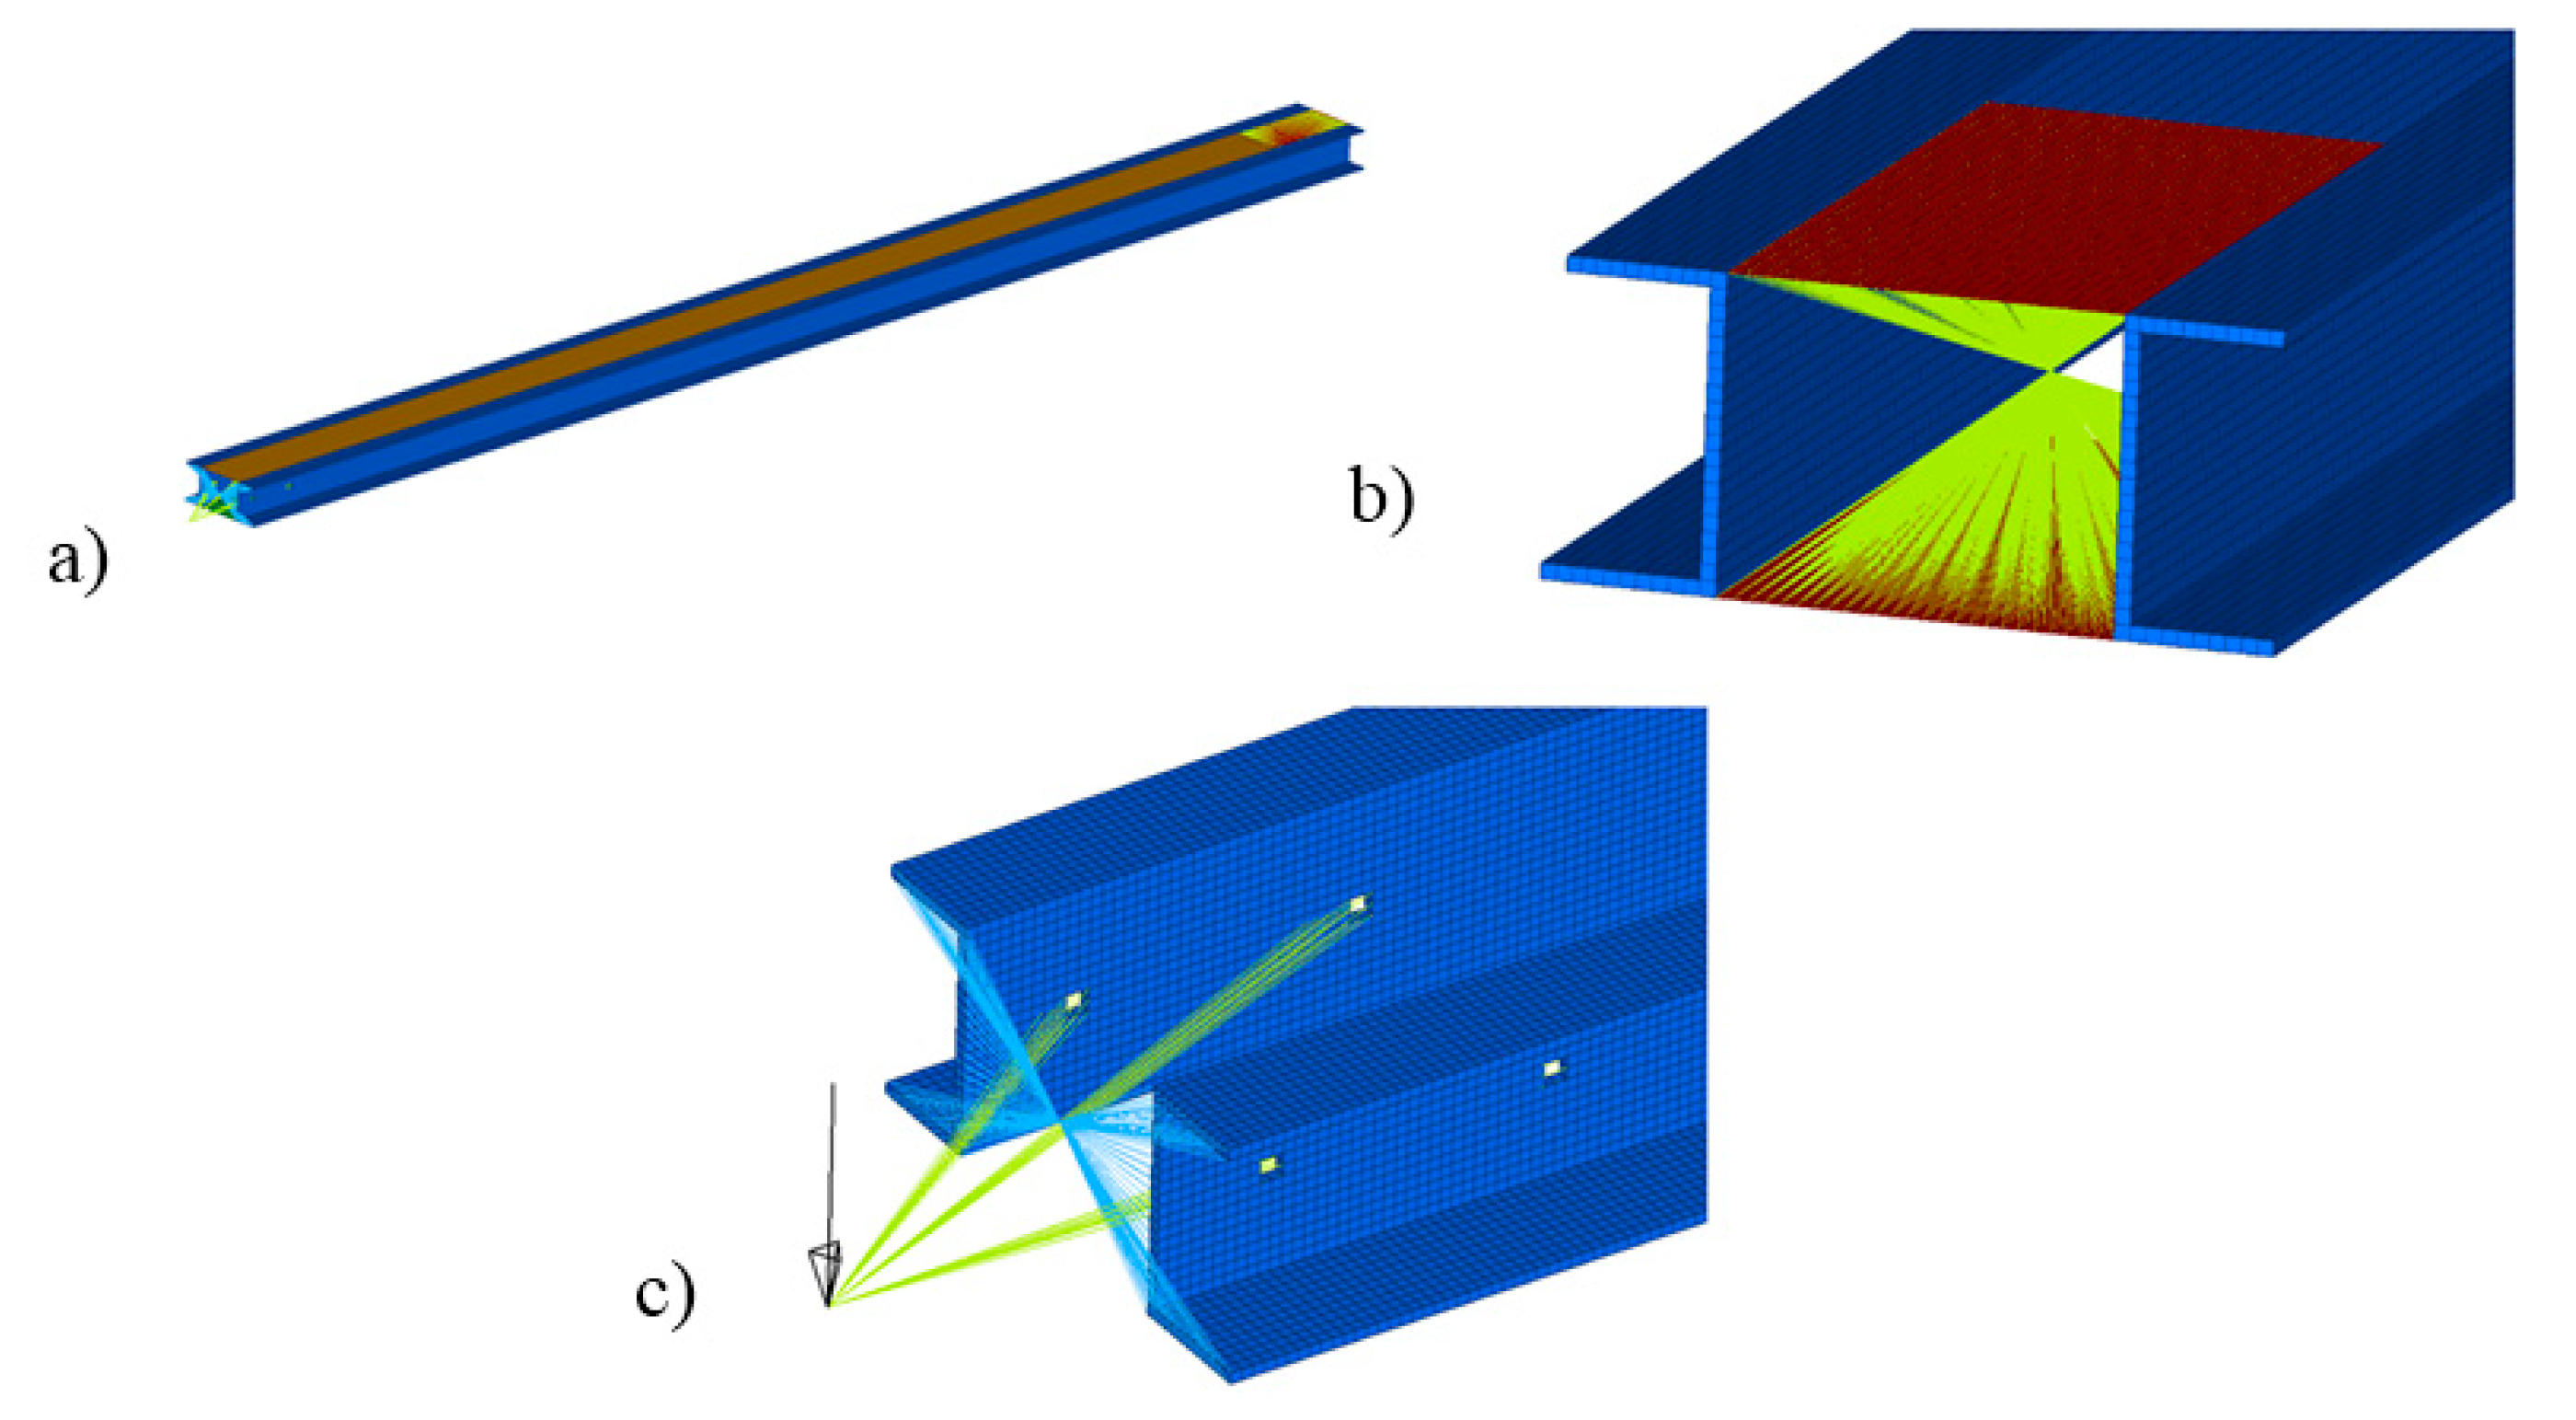
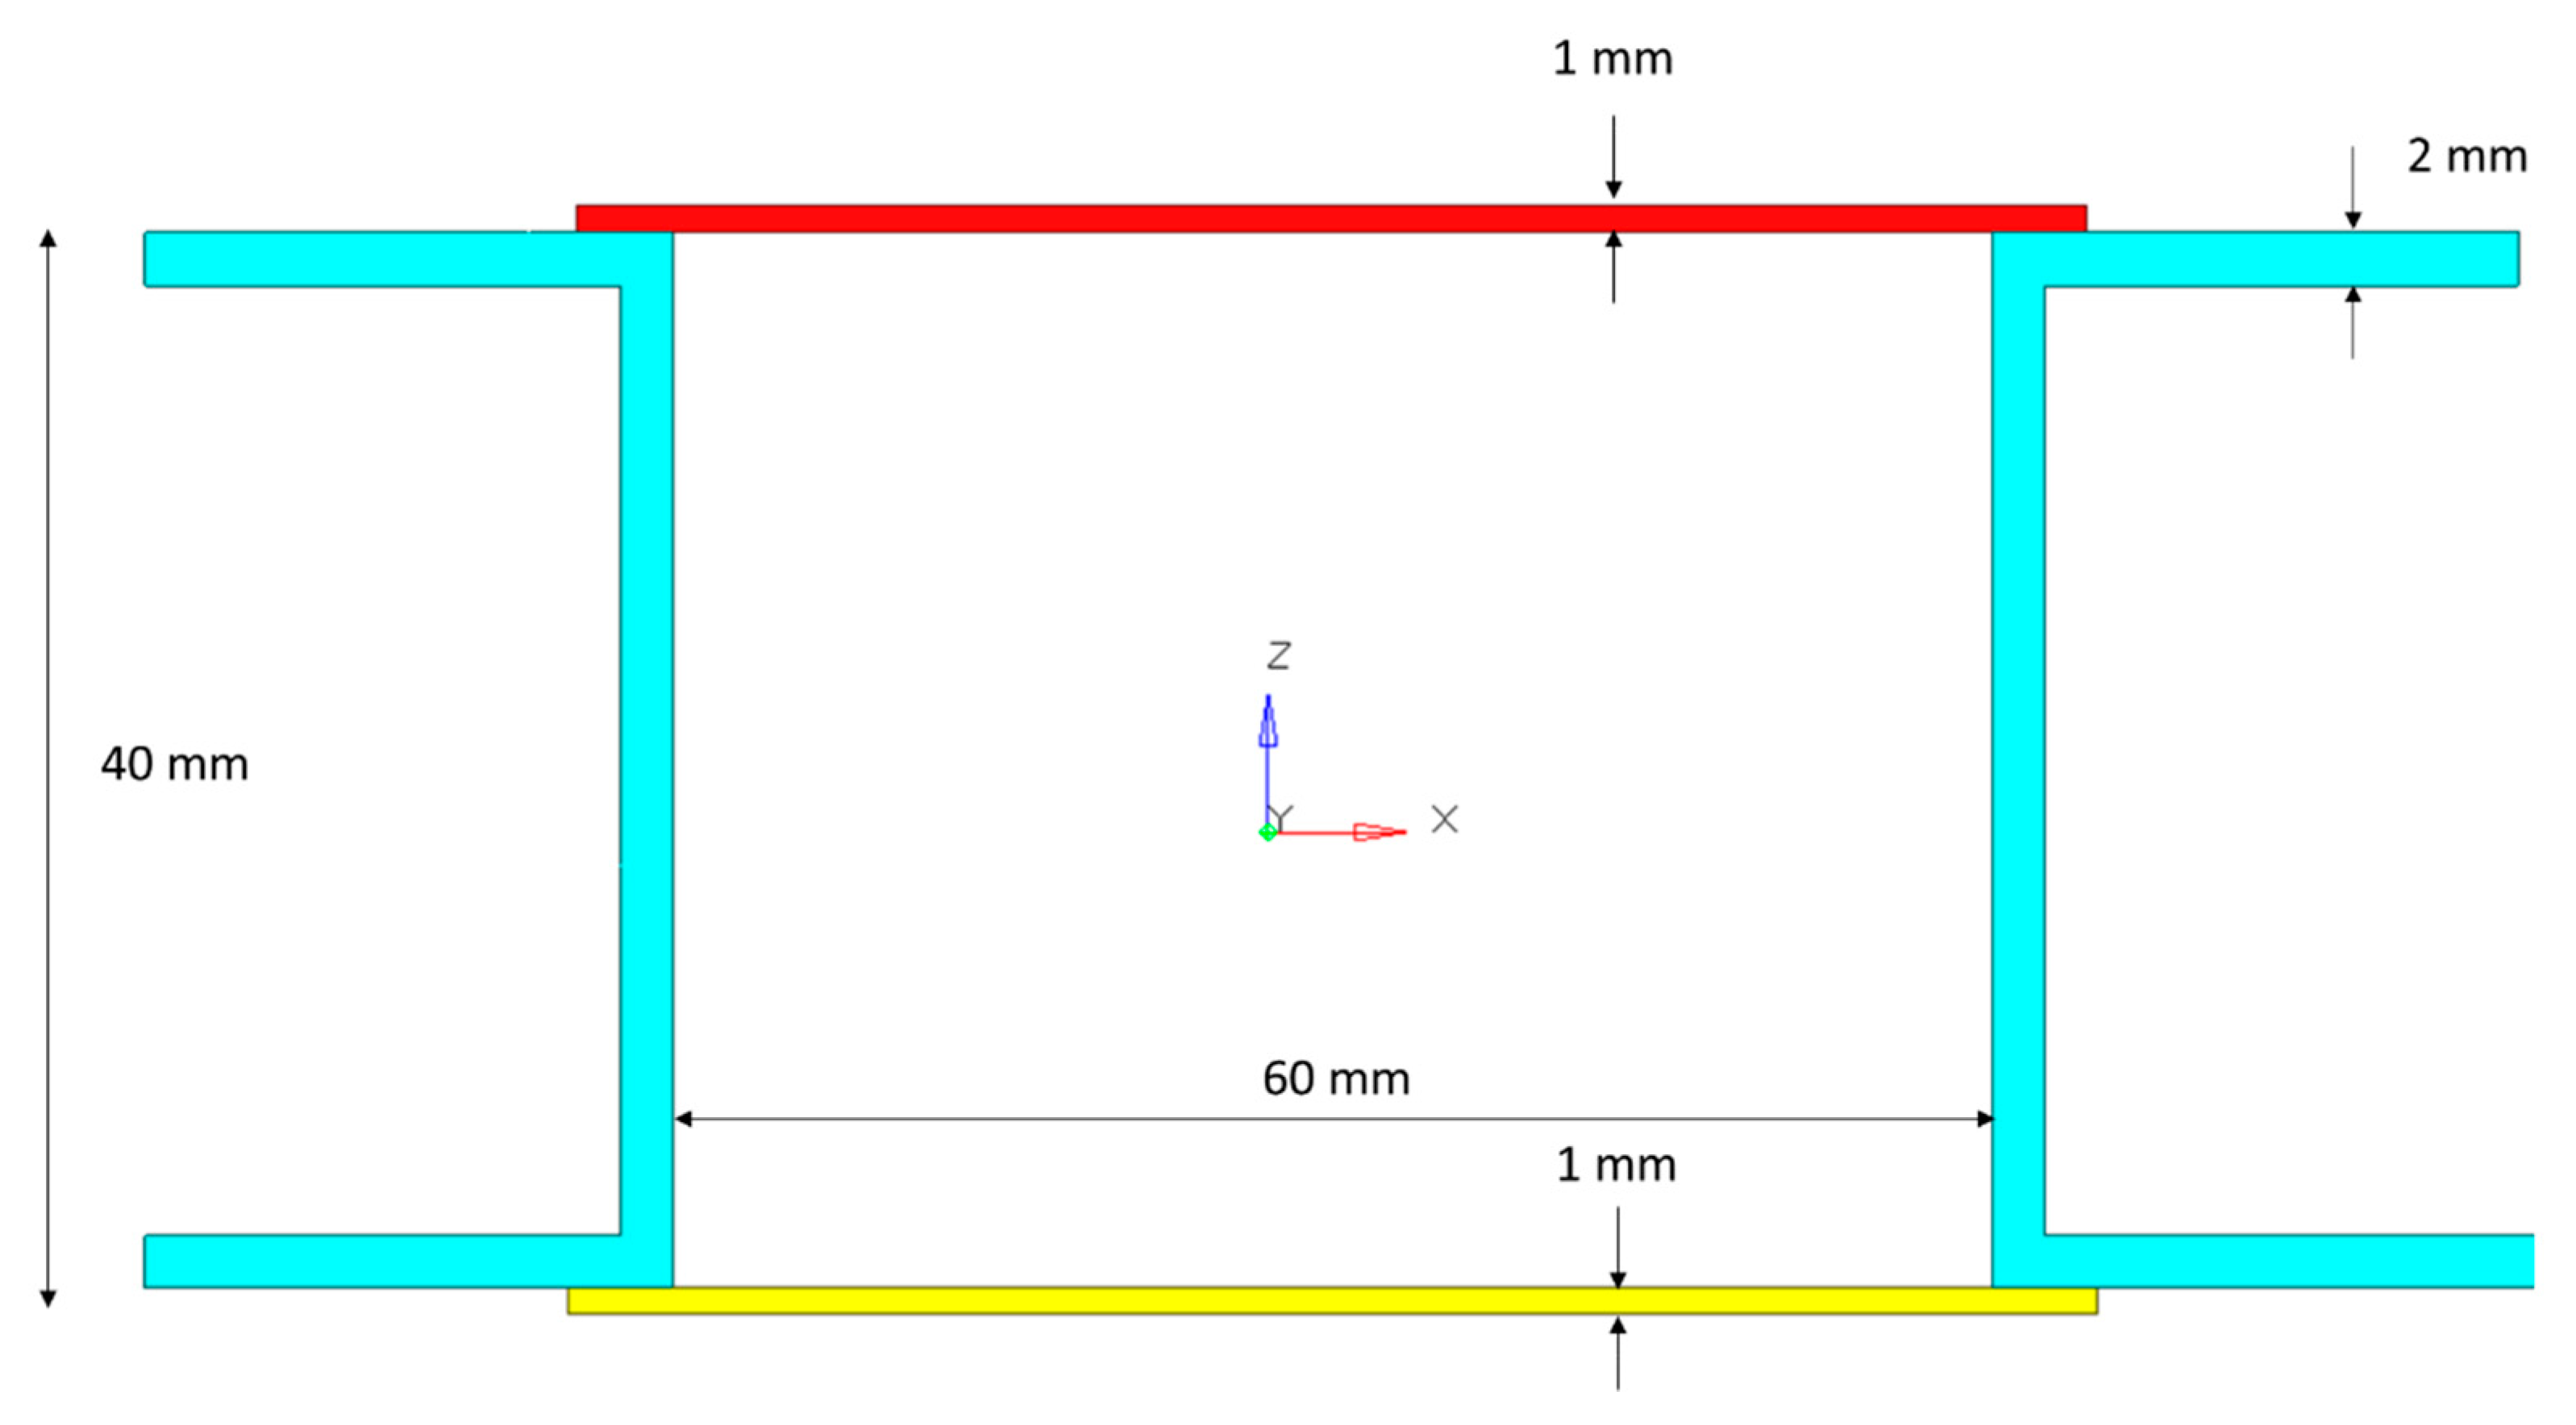
24]. The Gauge numerical optimization can be applied to 2D shell elements exclusively and in particular to the thickness or material orientation property variables. In this work, a 3D/2D mixed FE model of composite box beam is developed using shell elements (PCOMP) and hexa elements as shown in
Figure 3. The design zones are the upper and lower panels in composite material; these are connected to the steel webs with mesh nodes mapping technique in order to simulate the excellent adhesion of epoxy glue bond joints. Only a small portion of these is defined as no-design space to exclude from the analysis of the constraints-application area. In either the simplified model and in the FE model, the transversal load is applied with an eccentricity of 40 mm with respect to the beam tip according to the experimental test. Numerical optimization is performed to identify the laminate plies angles in order to obtain the most bending-torsion couple effect. The result is reached by optimizer reducing the beam global stiffness to find the maximum of the objective function (compliance) subjected to the beam tip rotation constrain. A summary of the FE model setup is reported the following:
Composite laminate definition and optimization setting: initial lay-up [04] for both plates
Optimization Objective definition: maximum compliance (Equation (8))
Discrete angle definition from –90° to 90°, 1° each iteration
Optimization constraint: tip rotation higher than 0.845° for enhancing bending–torsion coupling.
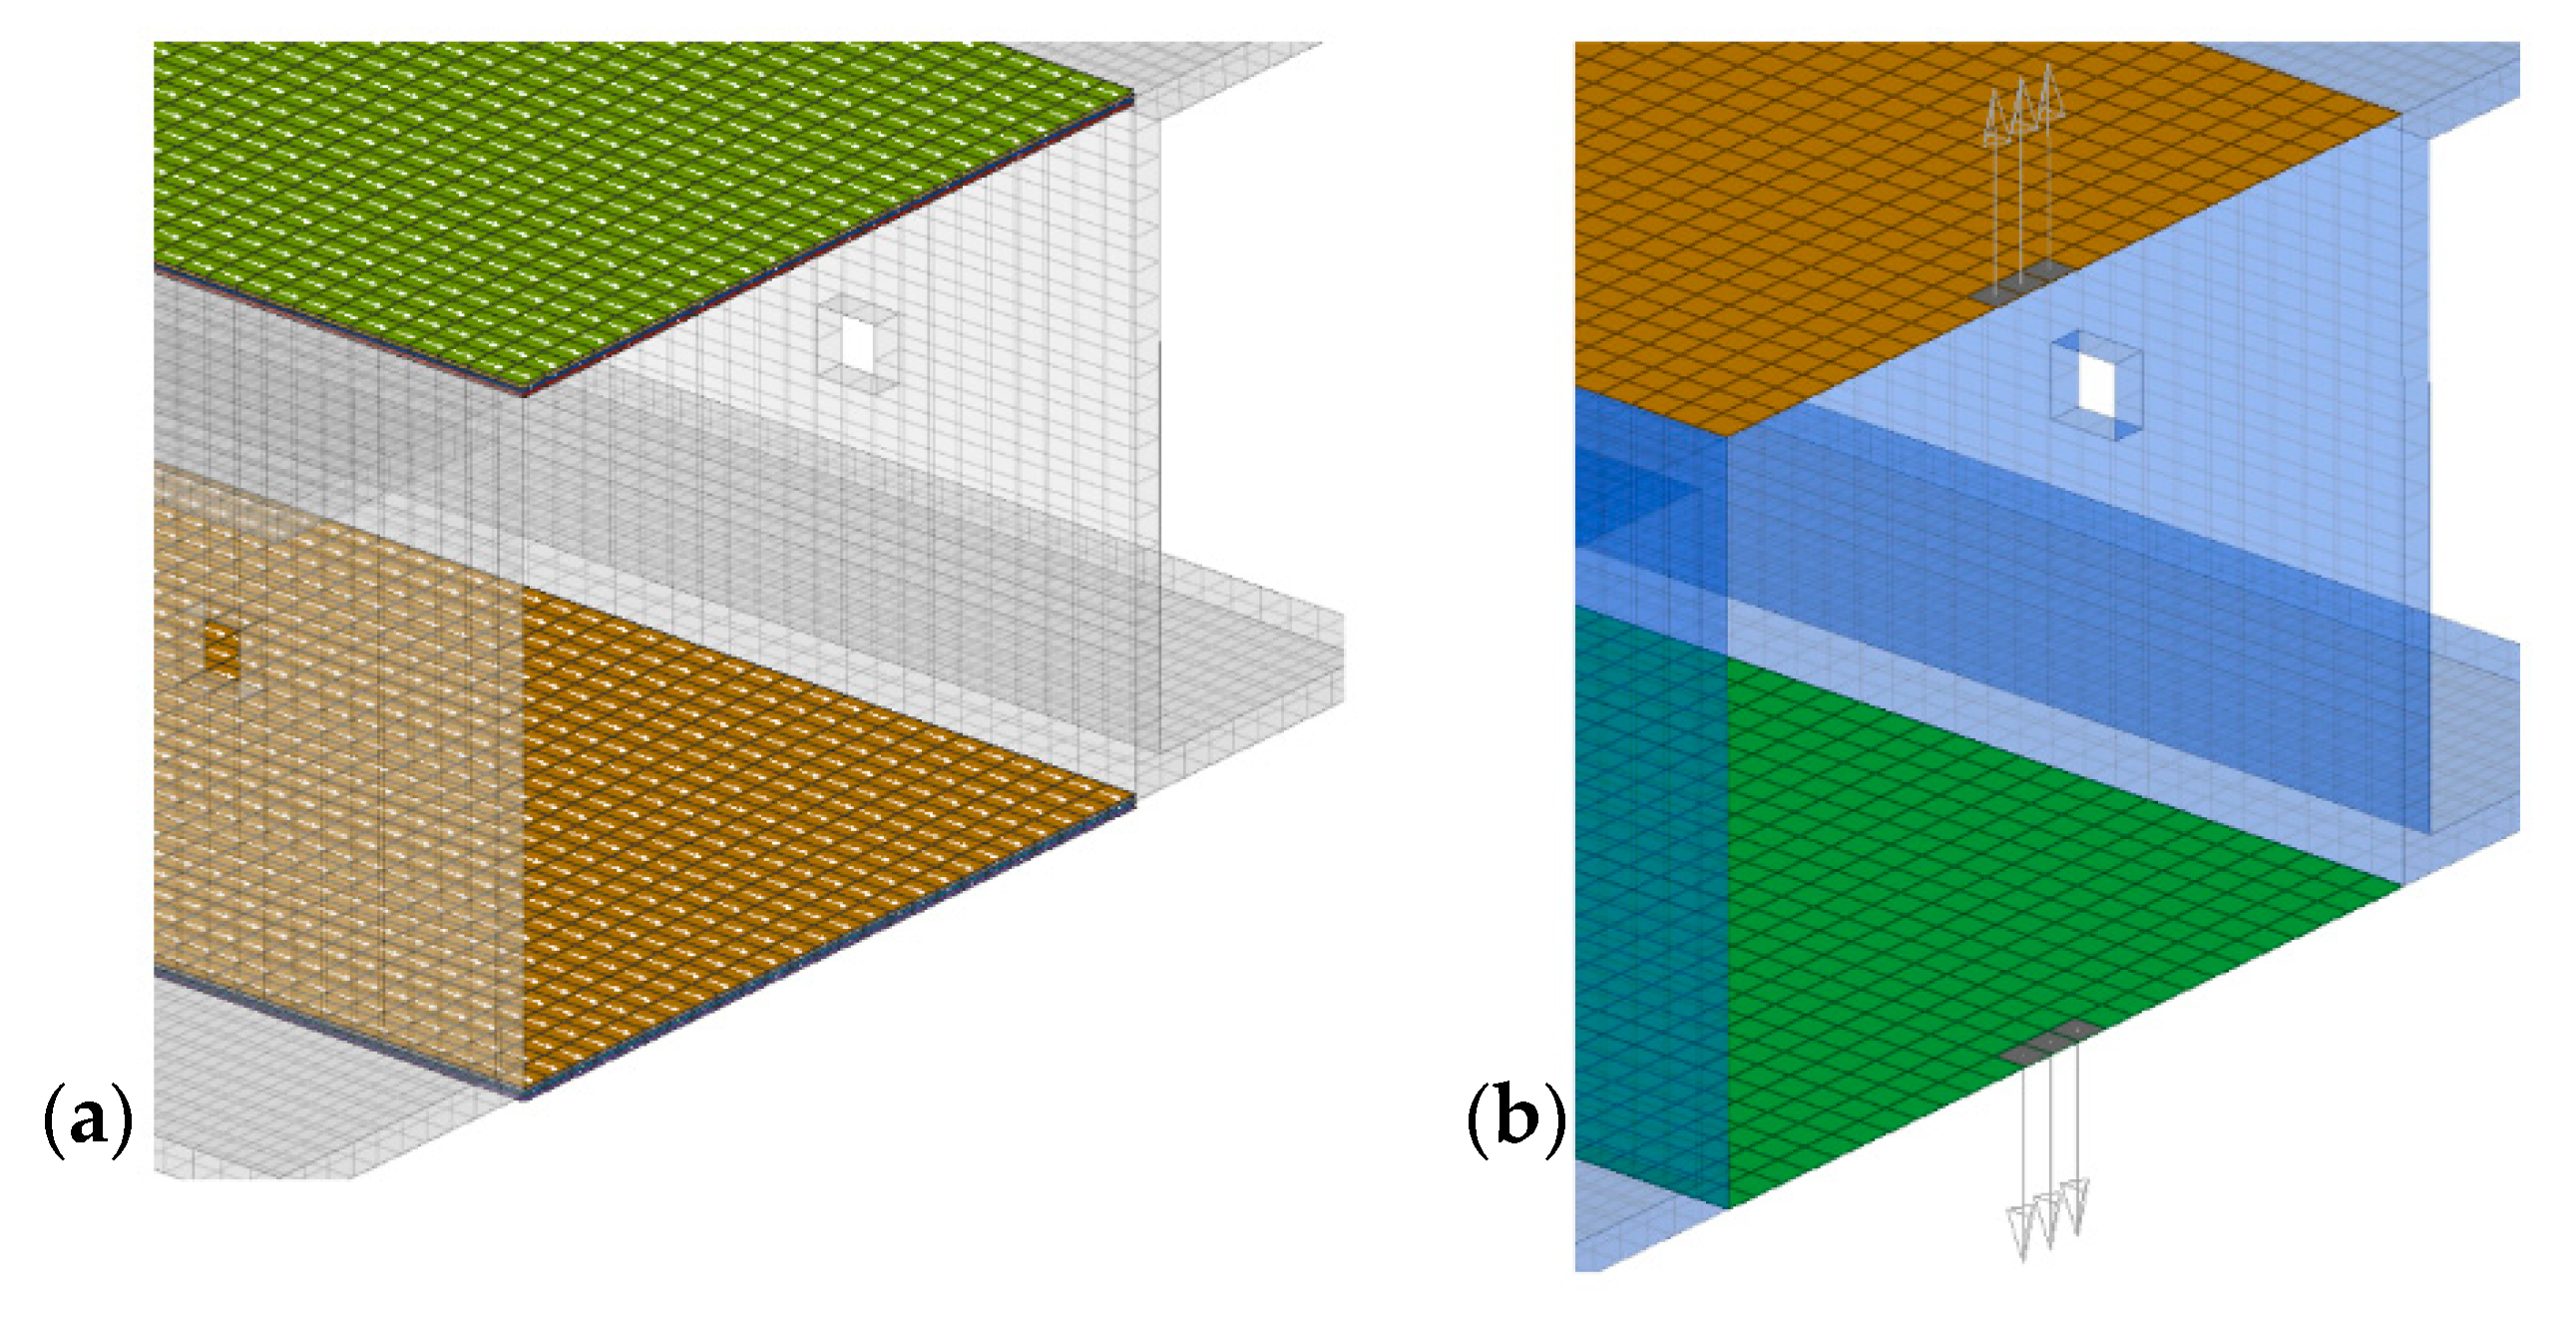
Considering that, in the FE model with composite laminate (
Figure 4a), the plies orientation angle is evaluated turning around the shell element normal direction with the “right-hand rule”. The model presented in this work has the composite plates modeled with shell elements that have opposite normal vectors between upper and lower plate,
Figure 4b. This condition in order to have a visual simplified post-processing of plies angles during the iterative process: the same ply in the upper plate and lower to have the same orientation should be a positive angle value in the upper plate and the same but negative in the lower.
4. Numerical/Experimental Comparison and Validation
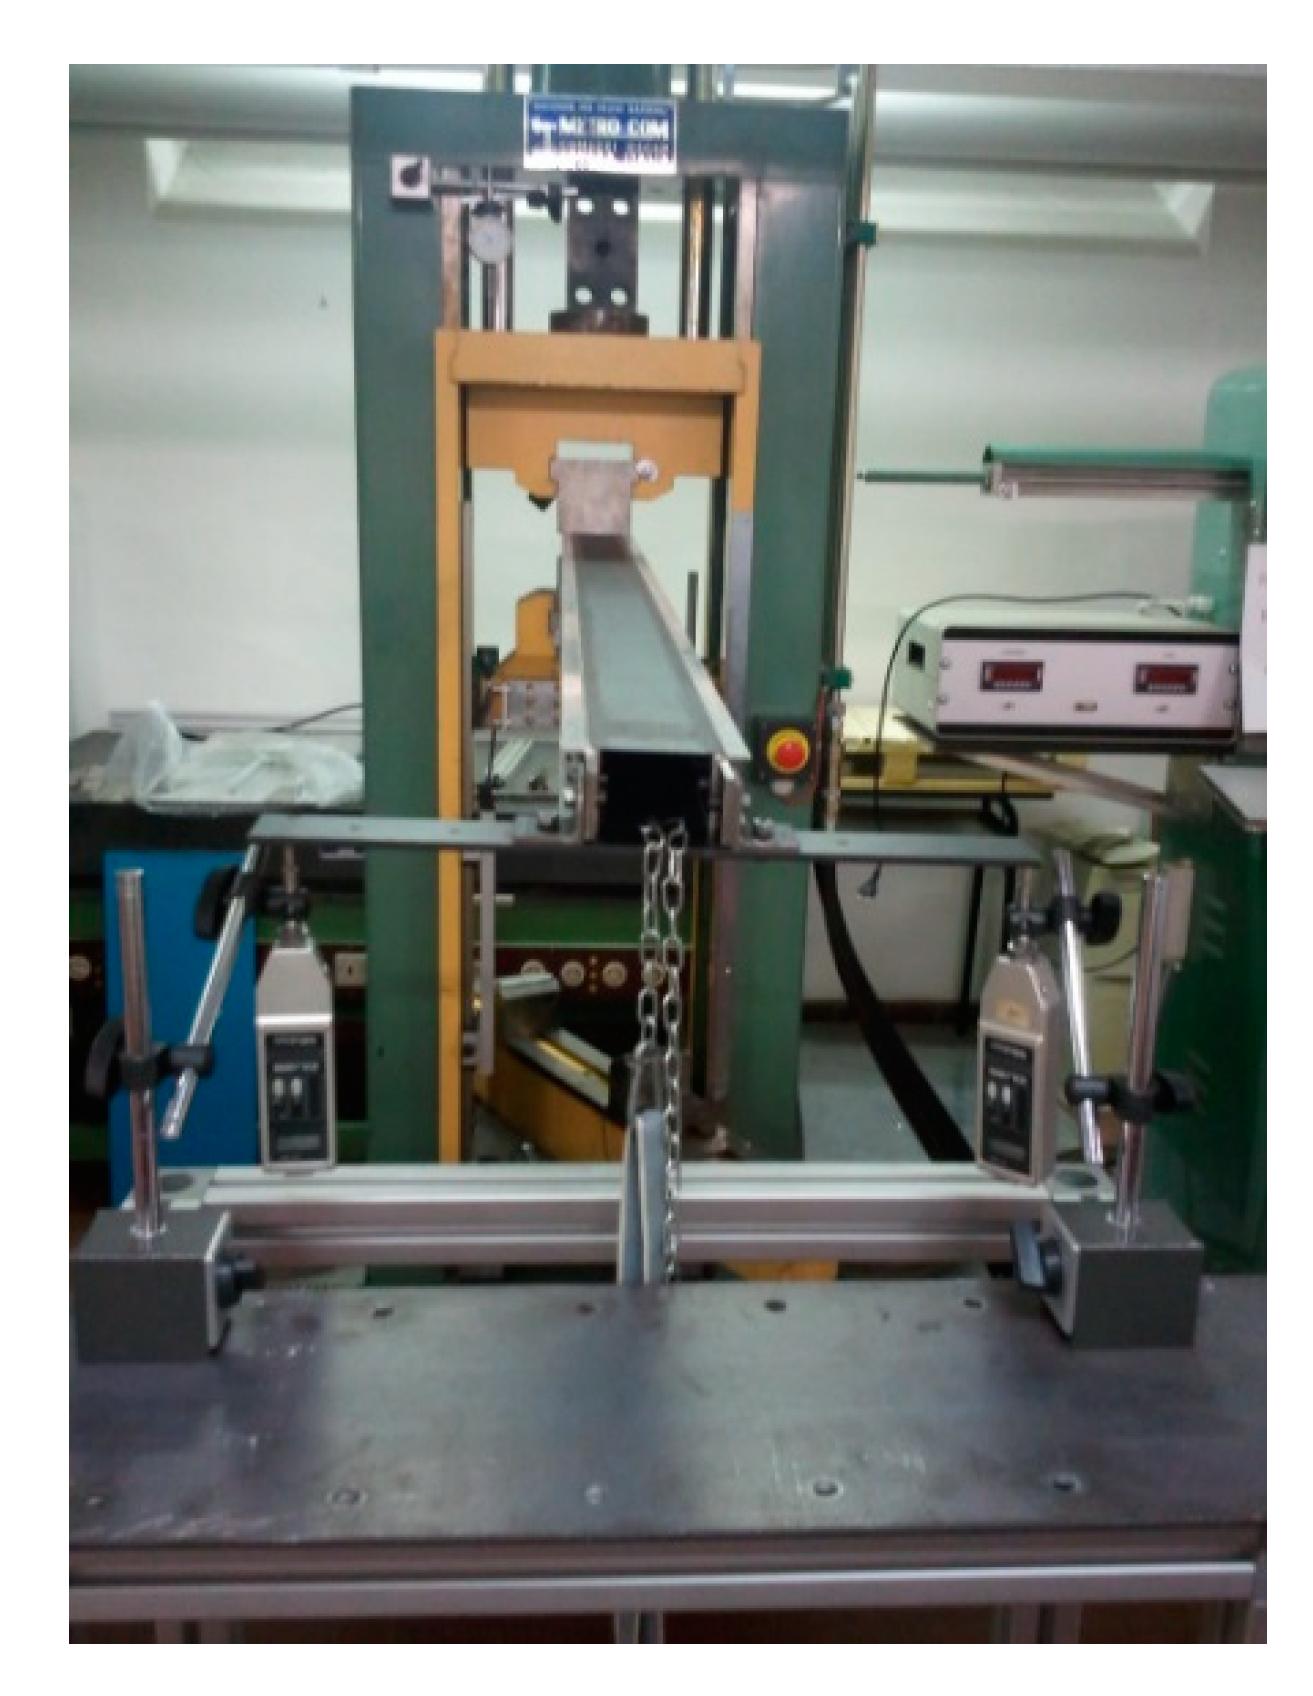
The selected test case has been loaded as a cantilever beam (
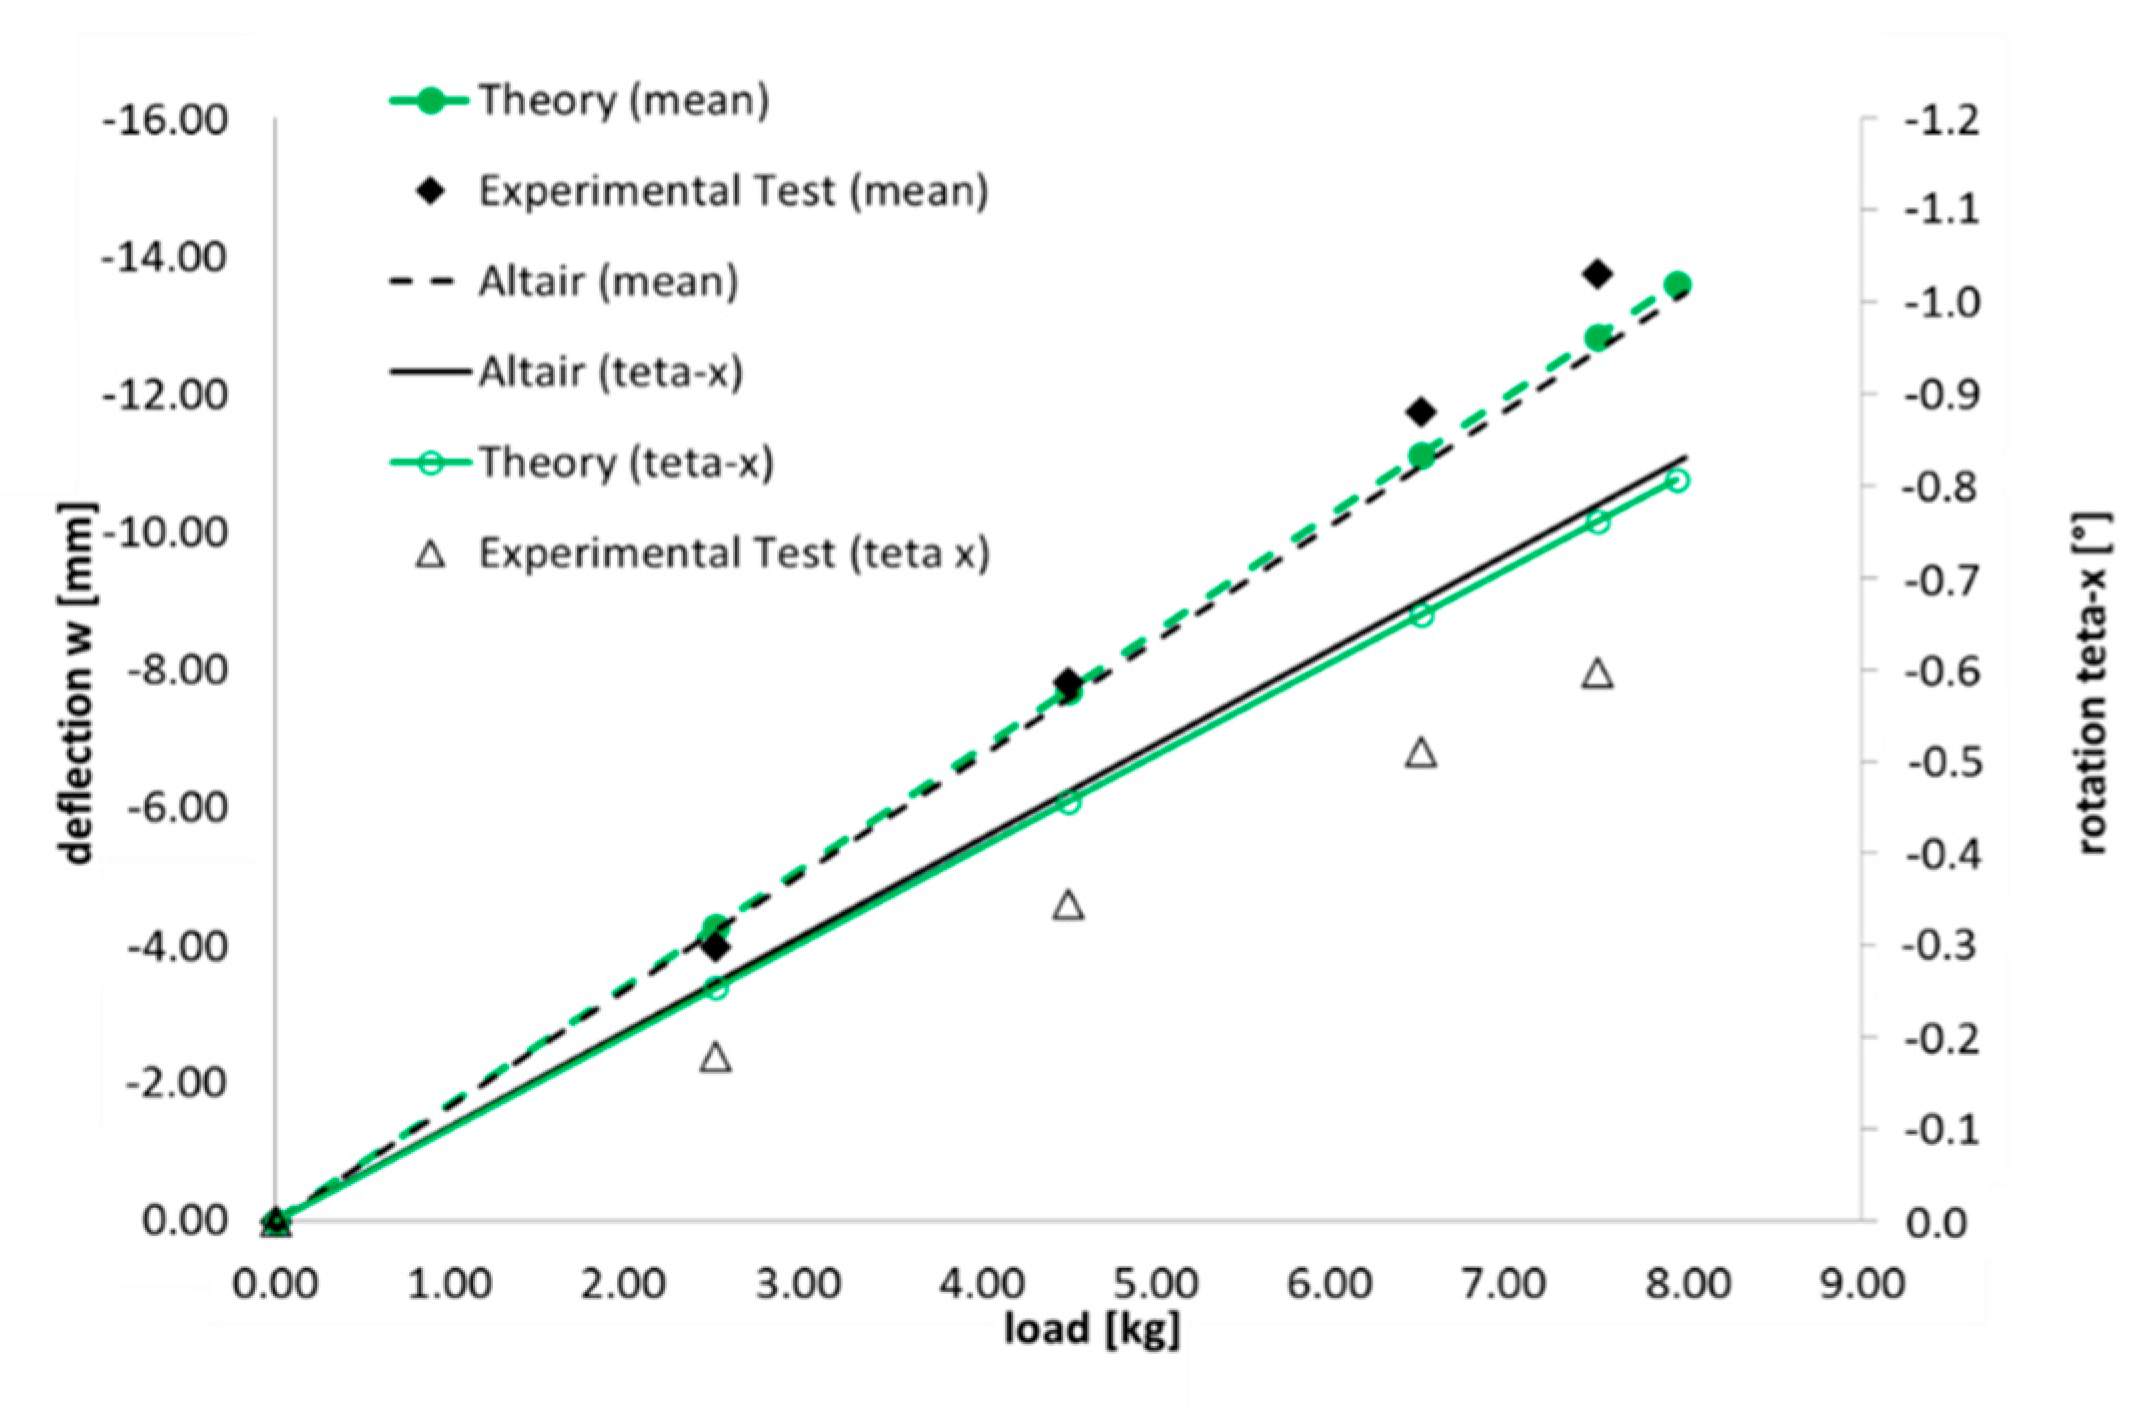
Figure 8) measuring the tip deflection and torsion. The analytical results, numerical results and the experimental ones are compared in
Figure 9. The box-beam has been simulated by the FEM procedure using consistent laminate lay-up.
Similar behavior was obtained for both theoretical and experimental results,
Figure 9 shows the deflection and rotation of the center of the tip section, obtained from the displacements measured by the two transducers. The main differences can be attributed to the variability of the data related to the considered composite material and to a not perfect correspondence between the clamped constraint and load system in the theoretical and numerical model with respect to the experimental case.
In order to validate the theoretical methodology and to correlate the experimental test results obtained in the Polytechnic laboratory with a numerical simulation, an optimization with Altair Optistruct software has been performed. The boundary conditions are implemented in order to simulate the experimental test load condition with a maximum load equal to 8 kg. Gauge technique allows the optimization of a singular feature of element property such as thickness for PSHELL and each orientation angle/layer thickness for PCOMP 2D elements. In this work, numerical optimization was used in order to check and validate the theoretical results about the layer angle on torsion capabilities. The Gauge technique has been applied to identify the optimal layer angle in order to obtain the maximum bending–torsion couple effect for the box-beam.
The initial condition used is a box beam with upper and lower panels made by unidirectional laminate with fibers oriented at 0°. It is worth noting that this initial configuration yields no bending–torsion coupling.
The Gauge optimization is an iterative process based on gradient methodology, an efficient and consolidated approach to optimize the aerospace composite material components such as described in [
26].
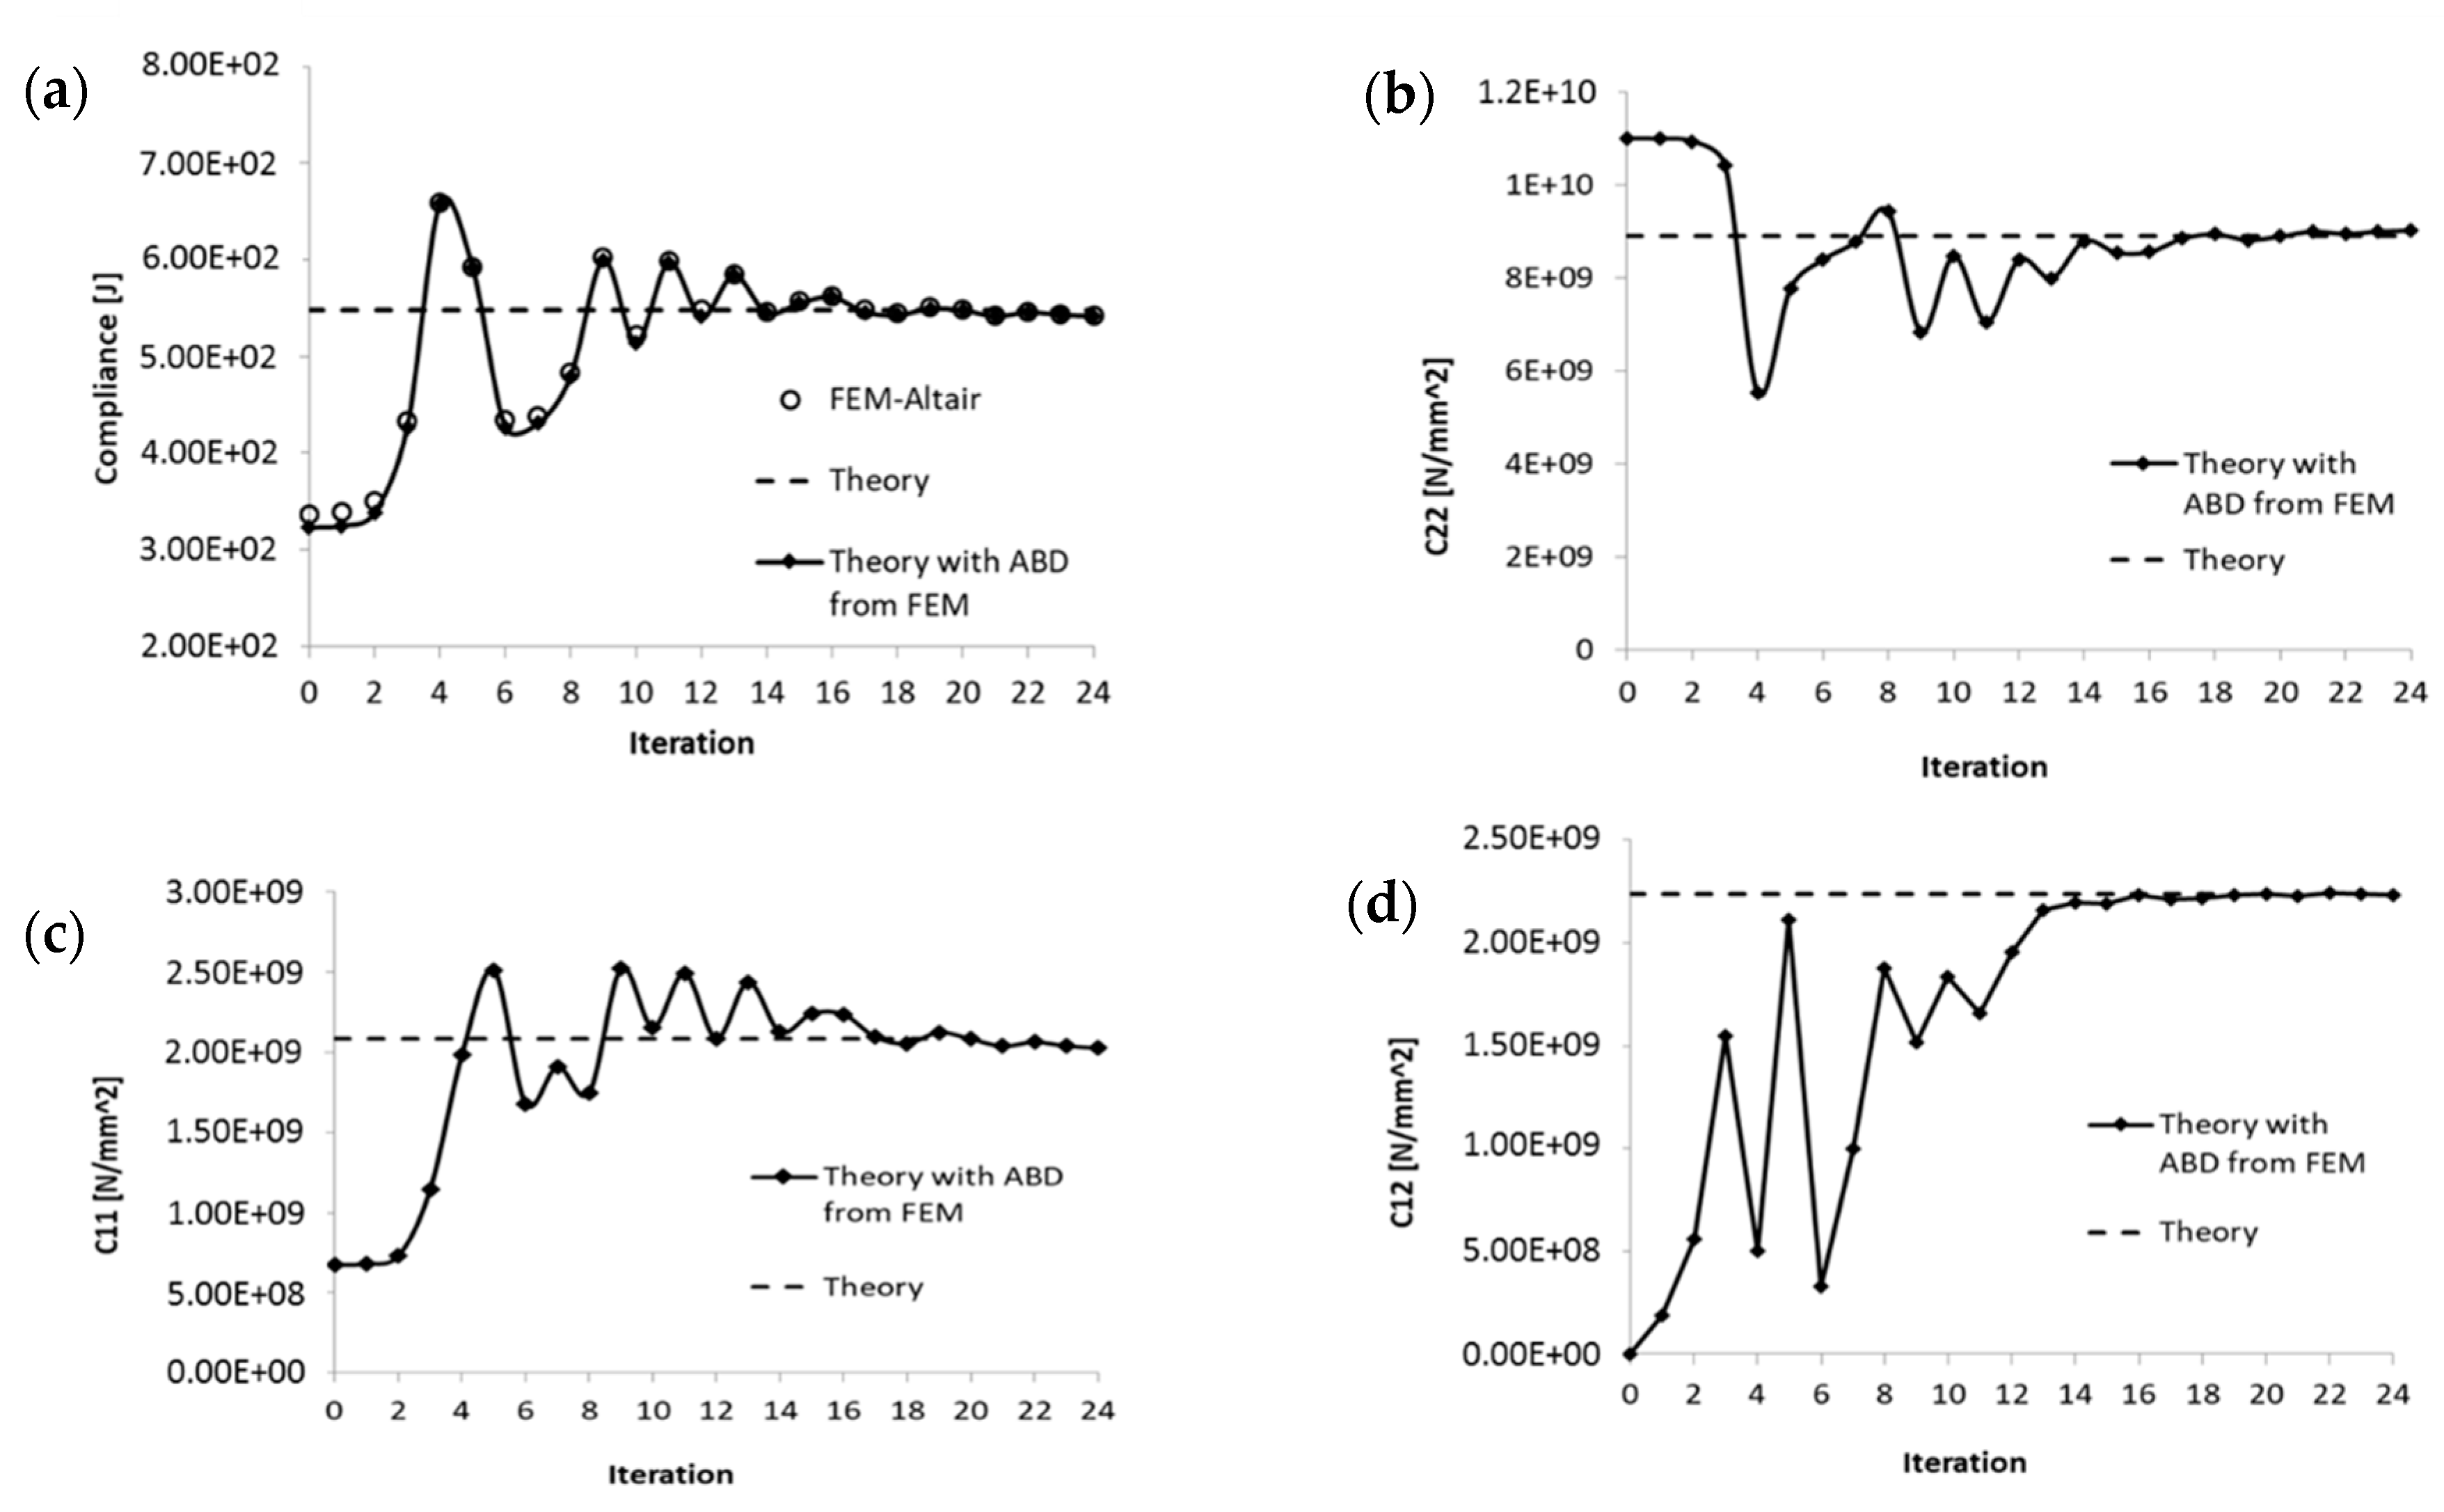
Figure 10 reports the comparison between the results obtained by the optimizer and the theoretical reference as a function of iterations. The compliance computation demonstrated that the composite beam model, despite assumptions adopted (transverse shear warping effect discarded, symmetric configuration [
B] = 0 adopted) presents a comparable energy contribution with the FEM model where all these effects are included, demonstrating the validity of the assumptions.
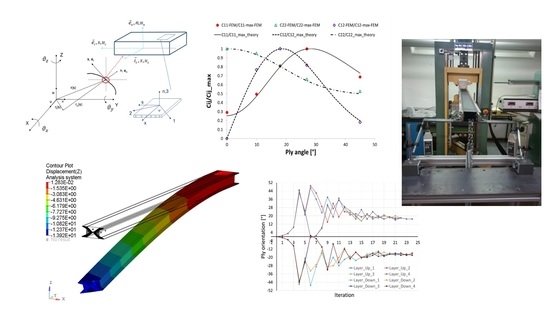
Comparison is performed on global stiffness matrix coefficients related to flexural stiffness (C22), torsional stiffness (C11) and coupling stiffness (C12). For numerical results, these coefficients are evaluated from [
A] and [
D] laminate stiffness matrices using formulas reported in
Table 1. The stiffness plots report a very good convergence of numerical values to the reference point obtained theoretically with all layers at 18°.
The last iteration shows a tip rotation of about 0.845° and deformation energy (compliance) of about 542.5 J corresponding to 8 kg load.
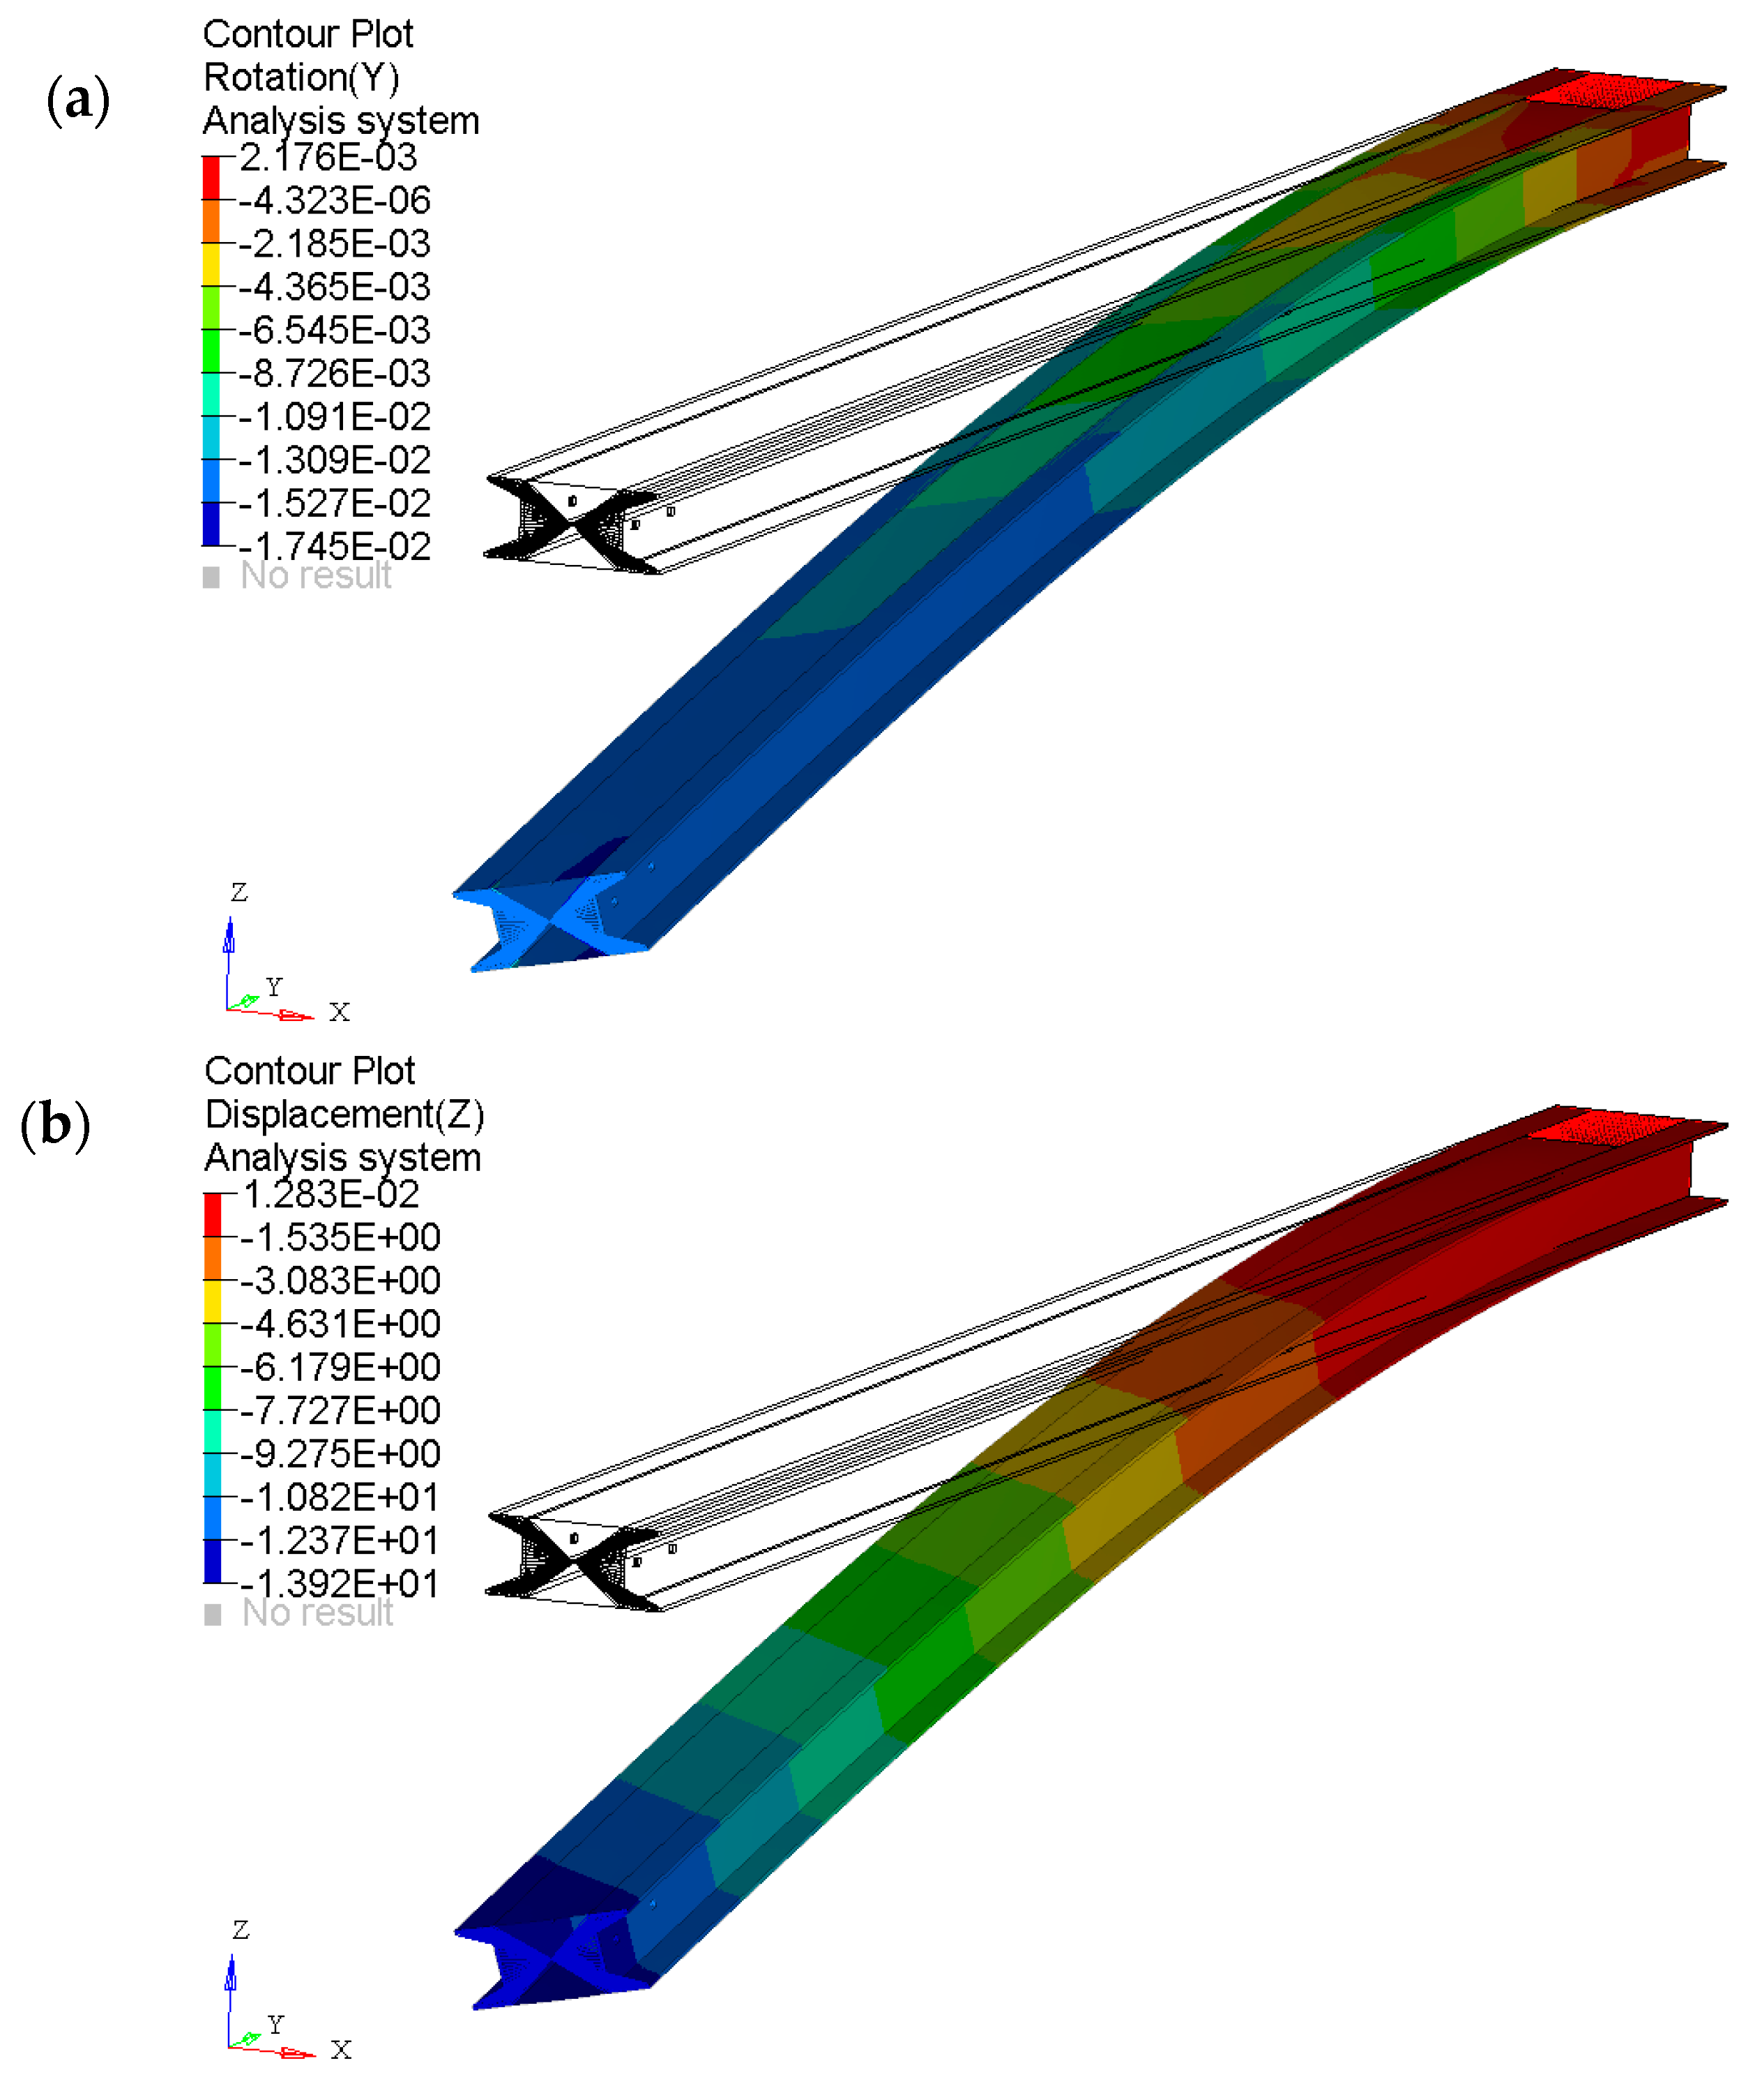
FEA results of box beam layered with the optimal layup obtained from numerical optimization show displacement and rotational fringe with linearity counters, with the maximum effect of bending-torsion coupled effect evident on the box beam tip (
Figure 11). The optimum condition is asymptotic at the level of global stiffnesses as shown in
Figure 10. Low difference in plies orientation between the numerical best results (24th iteration) and the previous lay-ups is allowed as it does not contribute to an appreciable deviation in stiffness. The asymptotic behavior is confirmed also by torsion angle analysis along with the numerical iteration, where the difference through tip rotation at iterations 22 and 24 is less than 1%.
The lamination obtained with the feasible design result at iteration 22 is very close to the theoretical optimum lay-up (all 18°), as reported in
Table 2 and
Figure 12. The lower plate of box beam optimized numerically has 3 to 4 layers difference to reference layup while the upper plate has all the layers at 17°. All plies have orientation values very close to theoretical reference therefore the theoretical result can be evaluated obtained by a robust methodology. Maximum variation is obtained at layer 4 of the lower plate where an optimum of −16° is obtained respect to the theoretical −18°.
5. Conclusions
The validation of the optimal configuration for a hybrid isotropic/composite box-beam has been presented. The performances offered by the optimal beam configuration obtained with a low-fidelity beam model have been compared against those of a high-fidelity model synthesized using Altair OptiStruct and with an experiment. The selected structural performance expected by the low fidelity model of a composite/aluminum thin-walled box-beam, specifically selected for the validation, is investigated. The numerical optimization and experimental configuration results are compared in order to confirm the validity of the selected procedure. The maximizing of slender box-beam compliance in order to obtain the plies orientation angle correlated to maximum bending/torsion effect is imposed in both methodologies.
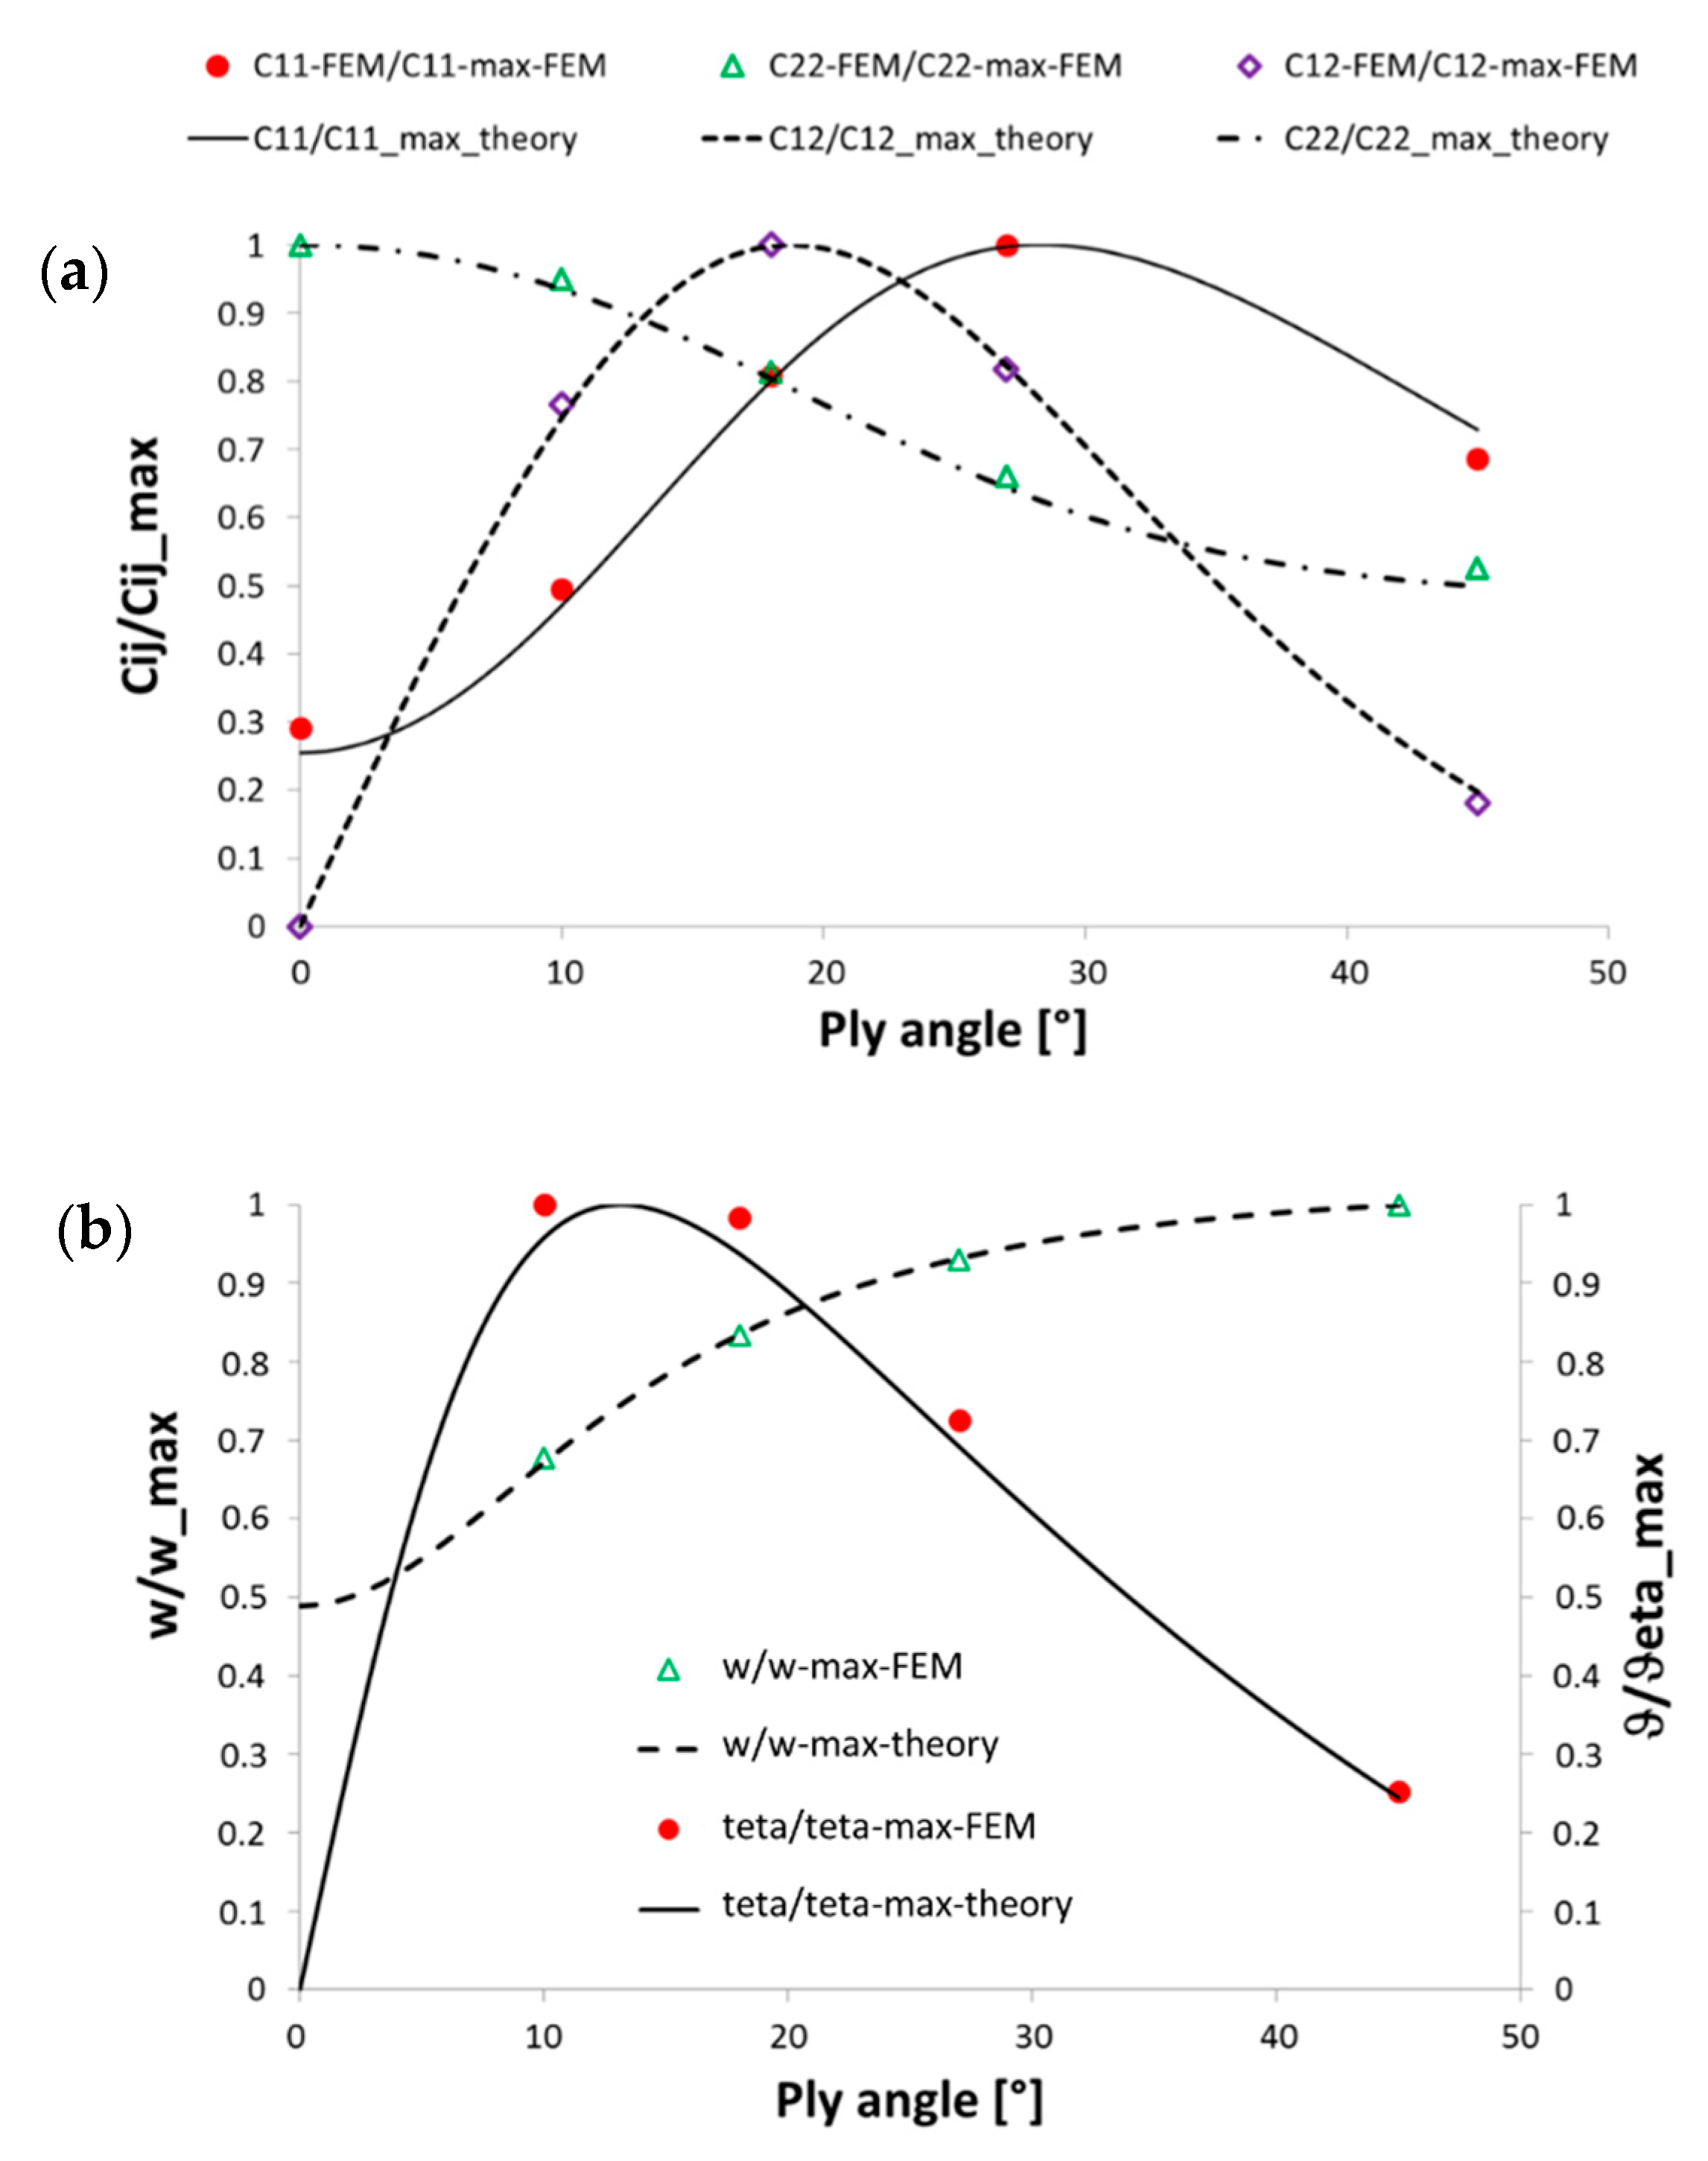
A simple case of a coupled cantilevered beam with load at one end is introduced. Maximum of flexural torsional coupling stiffness ratio was obtained with a ply of the upper and lower faces oriented at about 18° while the maximum torsional rigidity ratio was obtained with fibers oriented at about 27° and maximum rotation obtained with a ply angle of 12° different from 18°.
These types of considerations obtained by low fidelity models are fundamental in any design of innovative aeroelastic configurations and not fully investigated by open literature.
The low-fidelity model (simplified beam-model) results are in good agreement with the high-fidelity model (FE model), confirming the validity of initial assumptions. The comparison with the experimental test shows a certain difference presumably due to uncertainties about the mechanical properties of the composite laminate and constraint conditions. However, a similar torsional–bending coupling behavior is clearly shown. In closure, it has been shown that low-fidelity has to be preferred with respect to accurate models within early design stages to identify promising solutions to be further investigated in the successive design stages.


