Modeling and Characterization of a Thermally Controlled Iodine Feeding System for Electric Propulsion Applications

 ,
,  , , and
Abstract
:1. Introduction
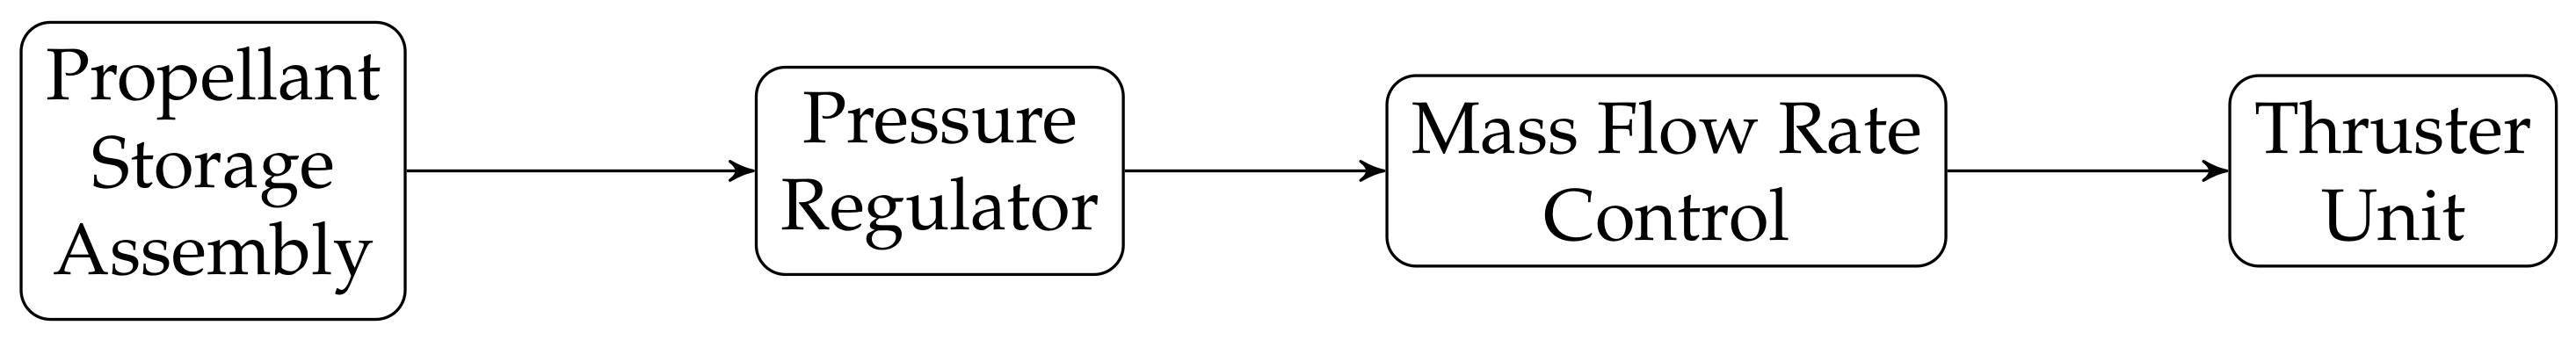
2. Iodine Feeding System Architecture
2.1. Electric Propulsion Propellant Feeding Systems
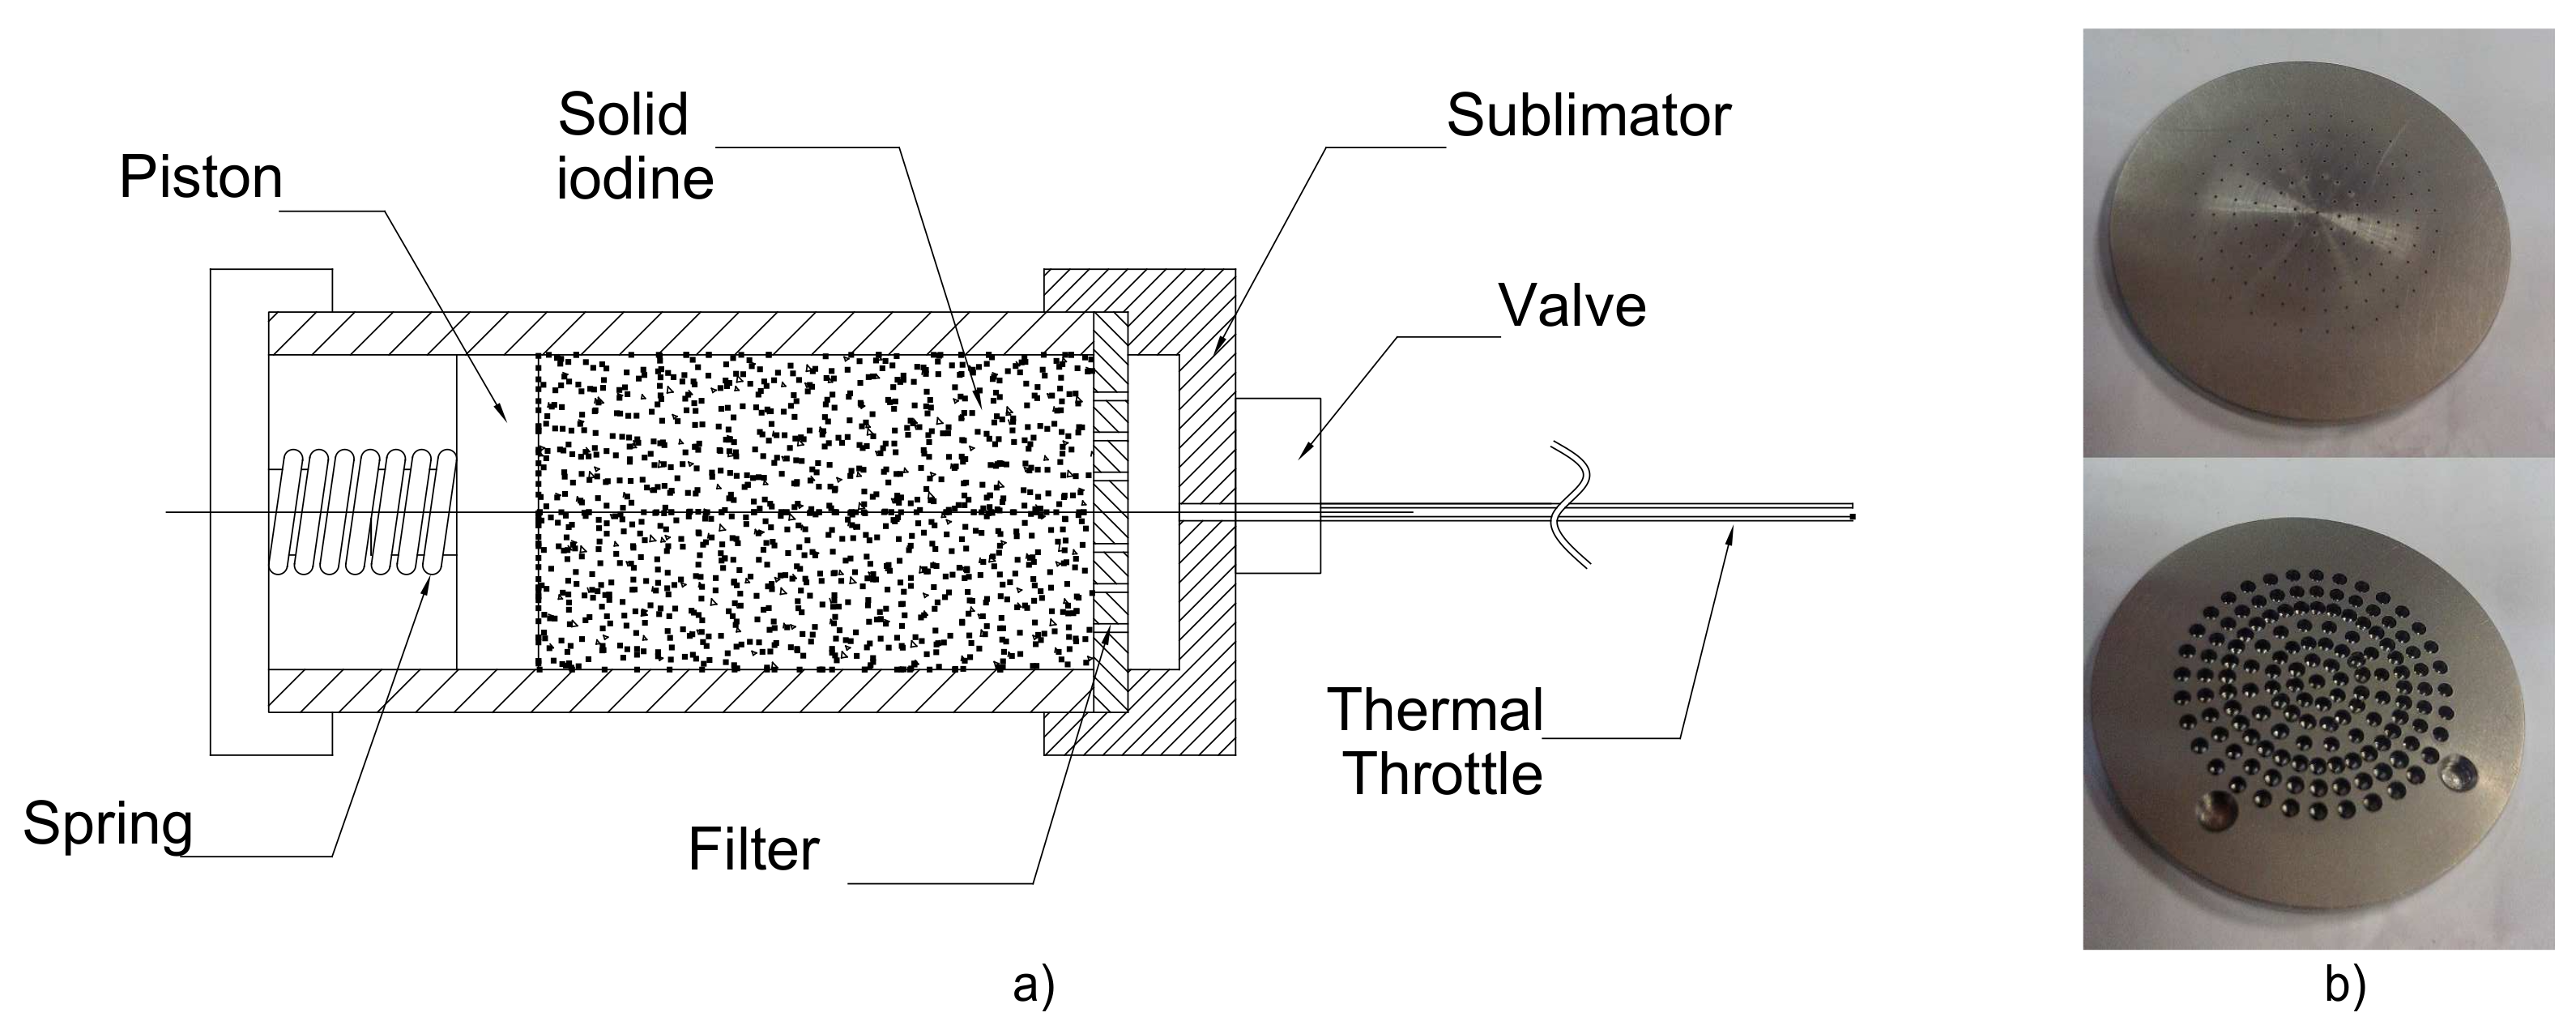
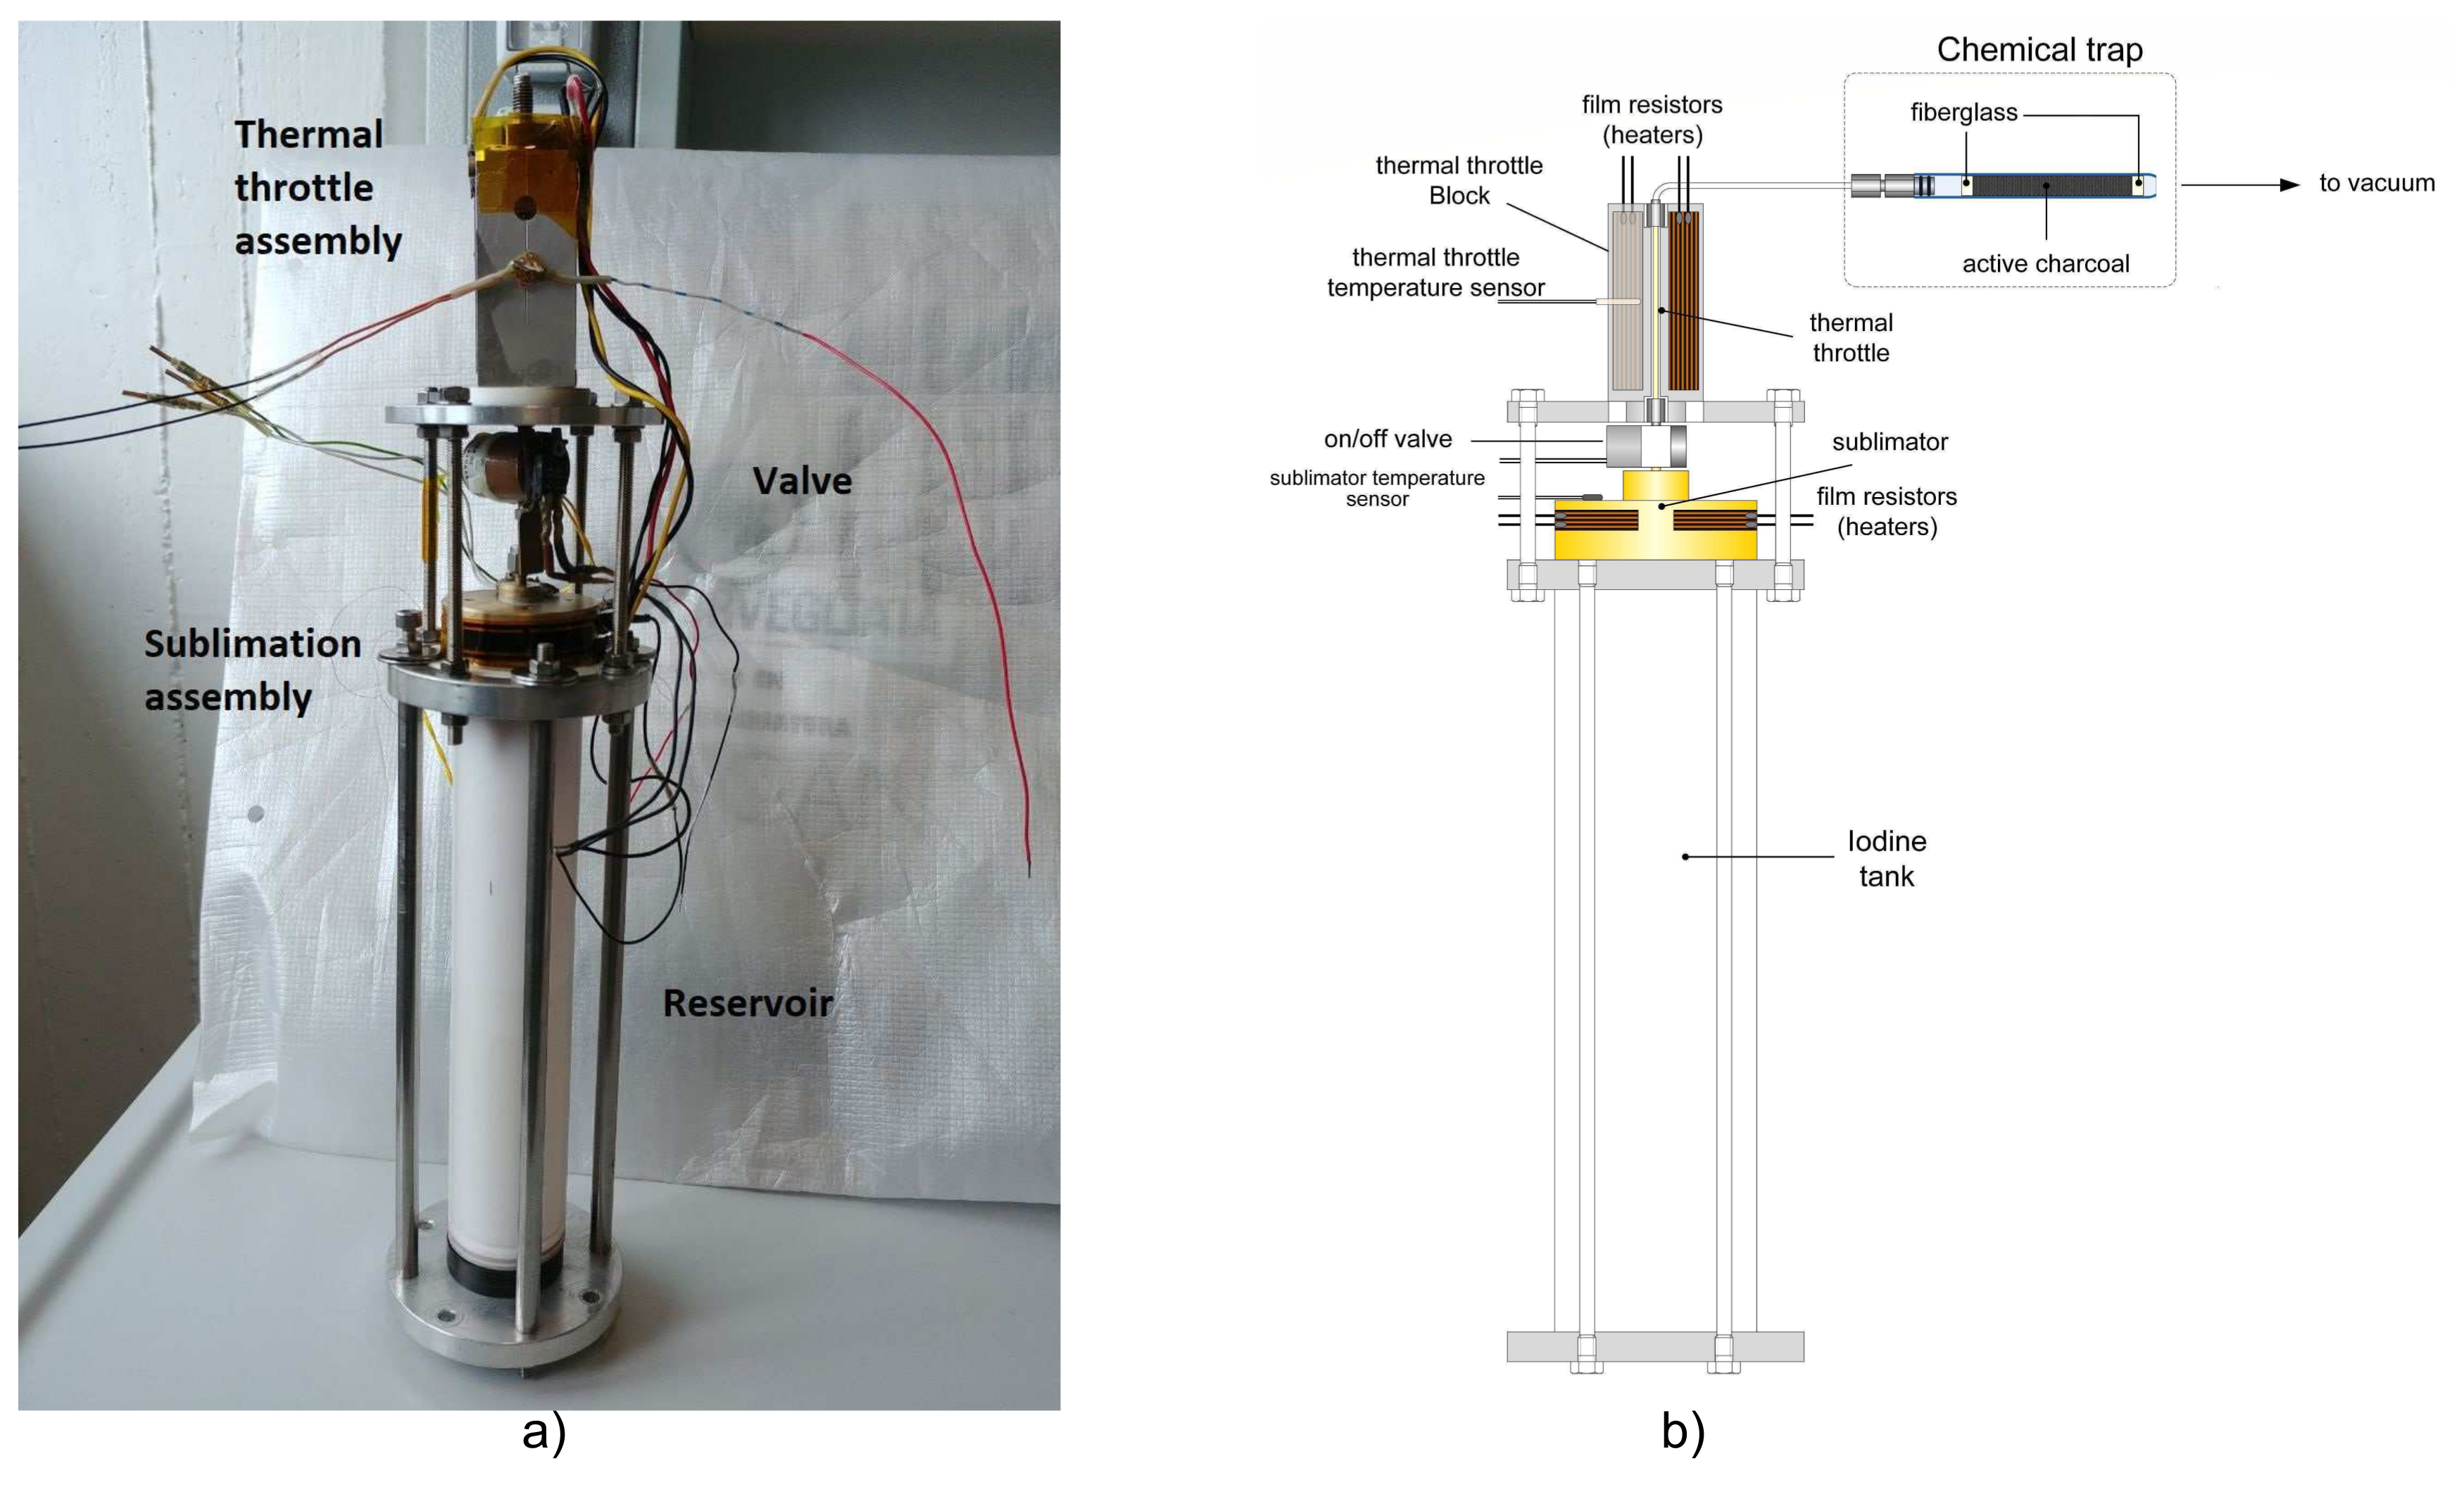
2.2. Developed Iodine Feeding System
- Low power requirements, as only a small surface of the iodine is heated and power loss towards the base of the tank is limited by the low thermal conductivity of iodine;
- absence of significant thermal control issues at a system level, given that only a small part of the system is at high temperature and can be easily insulated;
- short response time, between 20 and 30 min at start up, since the involved thermal inertia are small;
- control requirement only on the temperature of the system, simplifying diagnostics and control;
- reliability, as the valve is the only active component;
- good throttleability; and
- scalability.
3. Feeding System Physical Model
- Station (1)
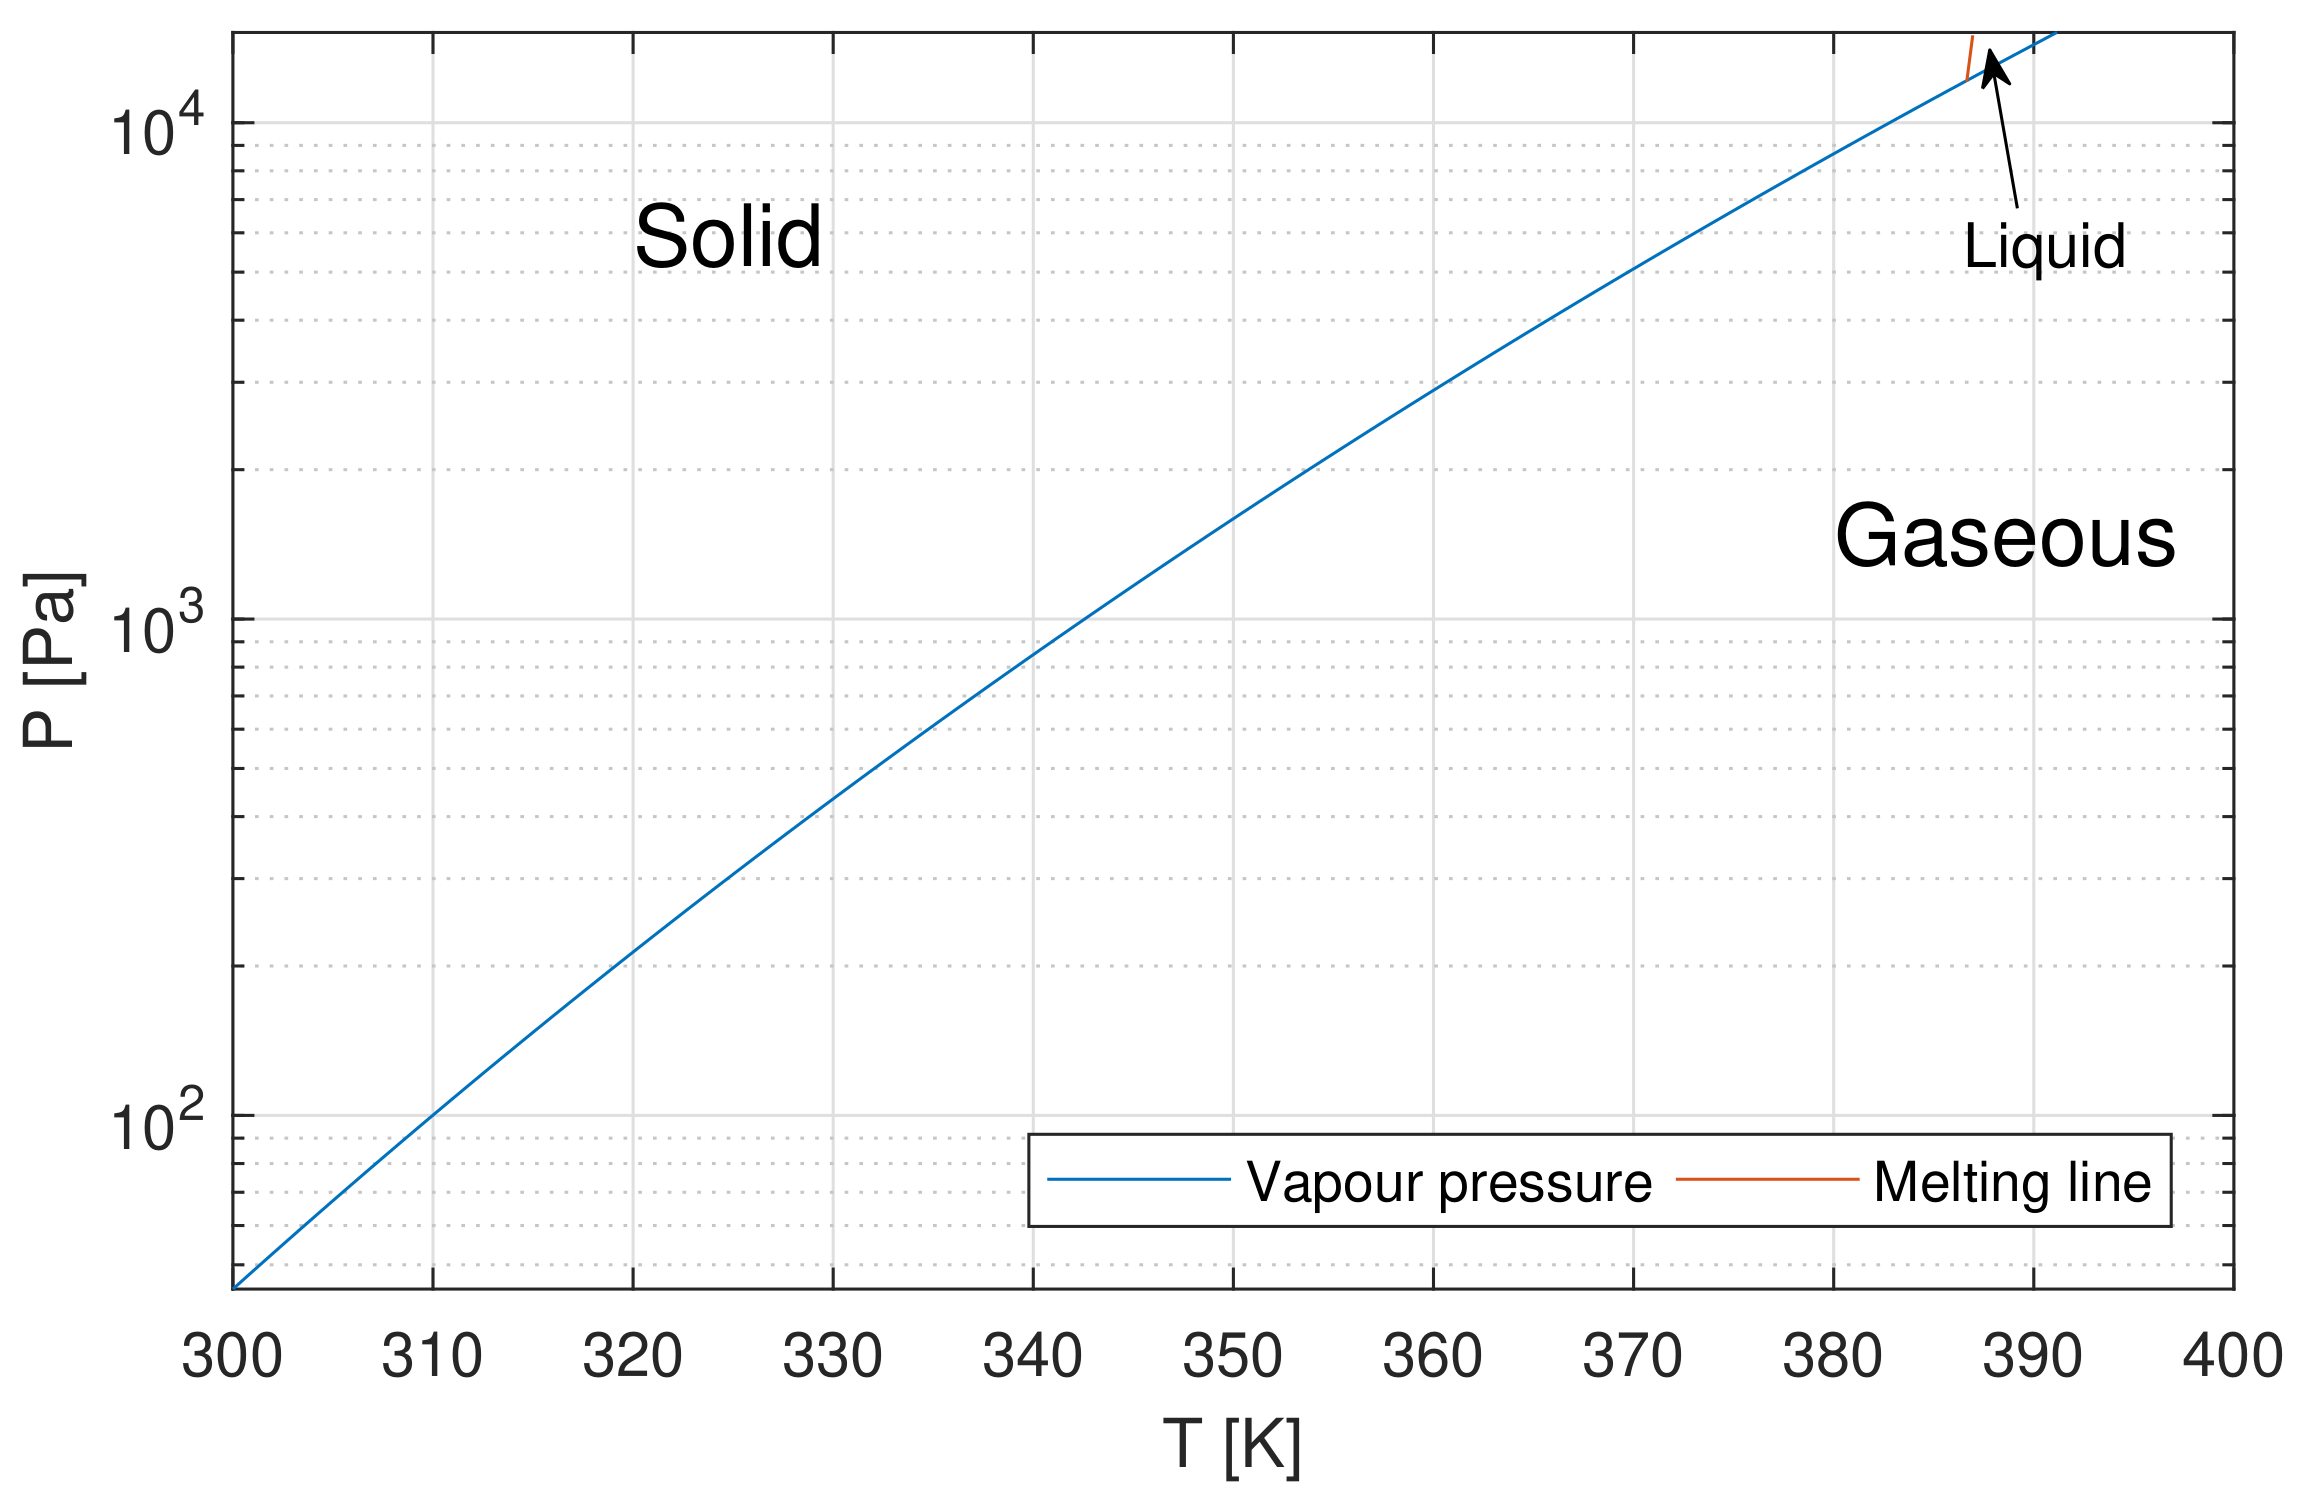
- Sublimation of a finite mass flow rate from a surface at close-to equilibrium condition, defined according to the Clausius–Clapeyron relation between pressure and temperature, corrected by the presence of a finite mass flow rate. The iodine mass flow rate is expressed as a function of heat power input and vapor thermodynamic properties.
- Stage (1–2)
- Isothermal flow through a multi-perforated metallic filter.
- Stage (2–3)
- Isothermal flow along the plenum between the filter and the coupling PTFE (Teflon®) pipe inlet.
- Stage (3–4)
- Compressible viscous flow with heat exchange and fixed wall temperature along the valve coupling pipes () and the capillary pipe (D). The valve introduces a concentrated pressure loss. Between the points in which the PTFE and the capillary pipe the area changes an isothermal flow with area change is considered, as in Stages 2–3.
- Station (4)
- Sonic condition at the capillary pipe exit, decoupling upstream from downstream flow.
3.1. Tank Model
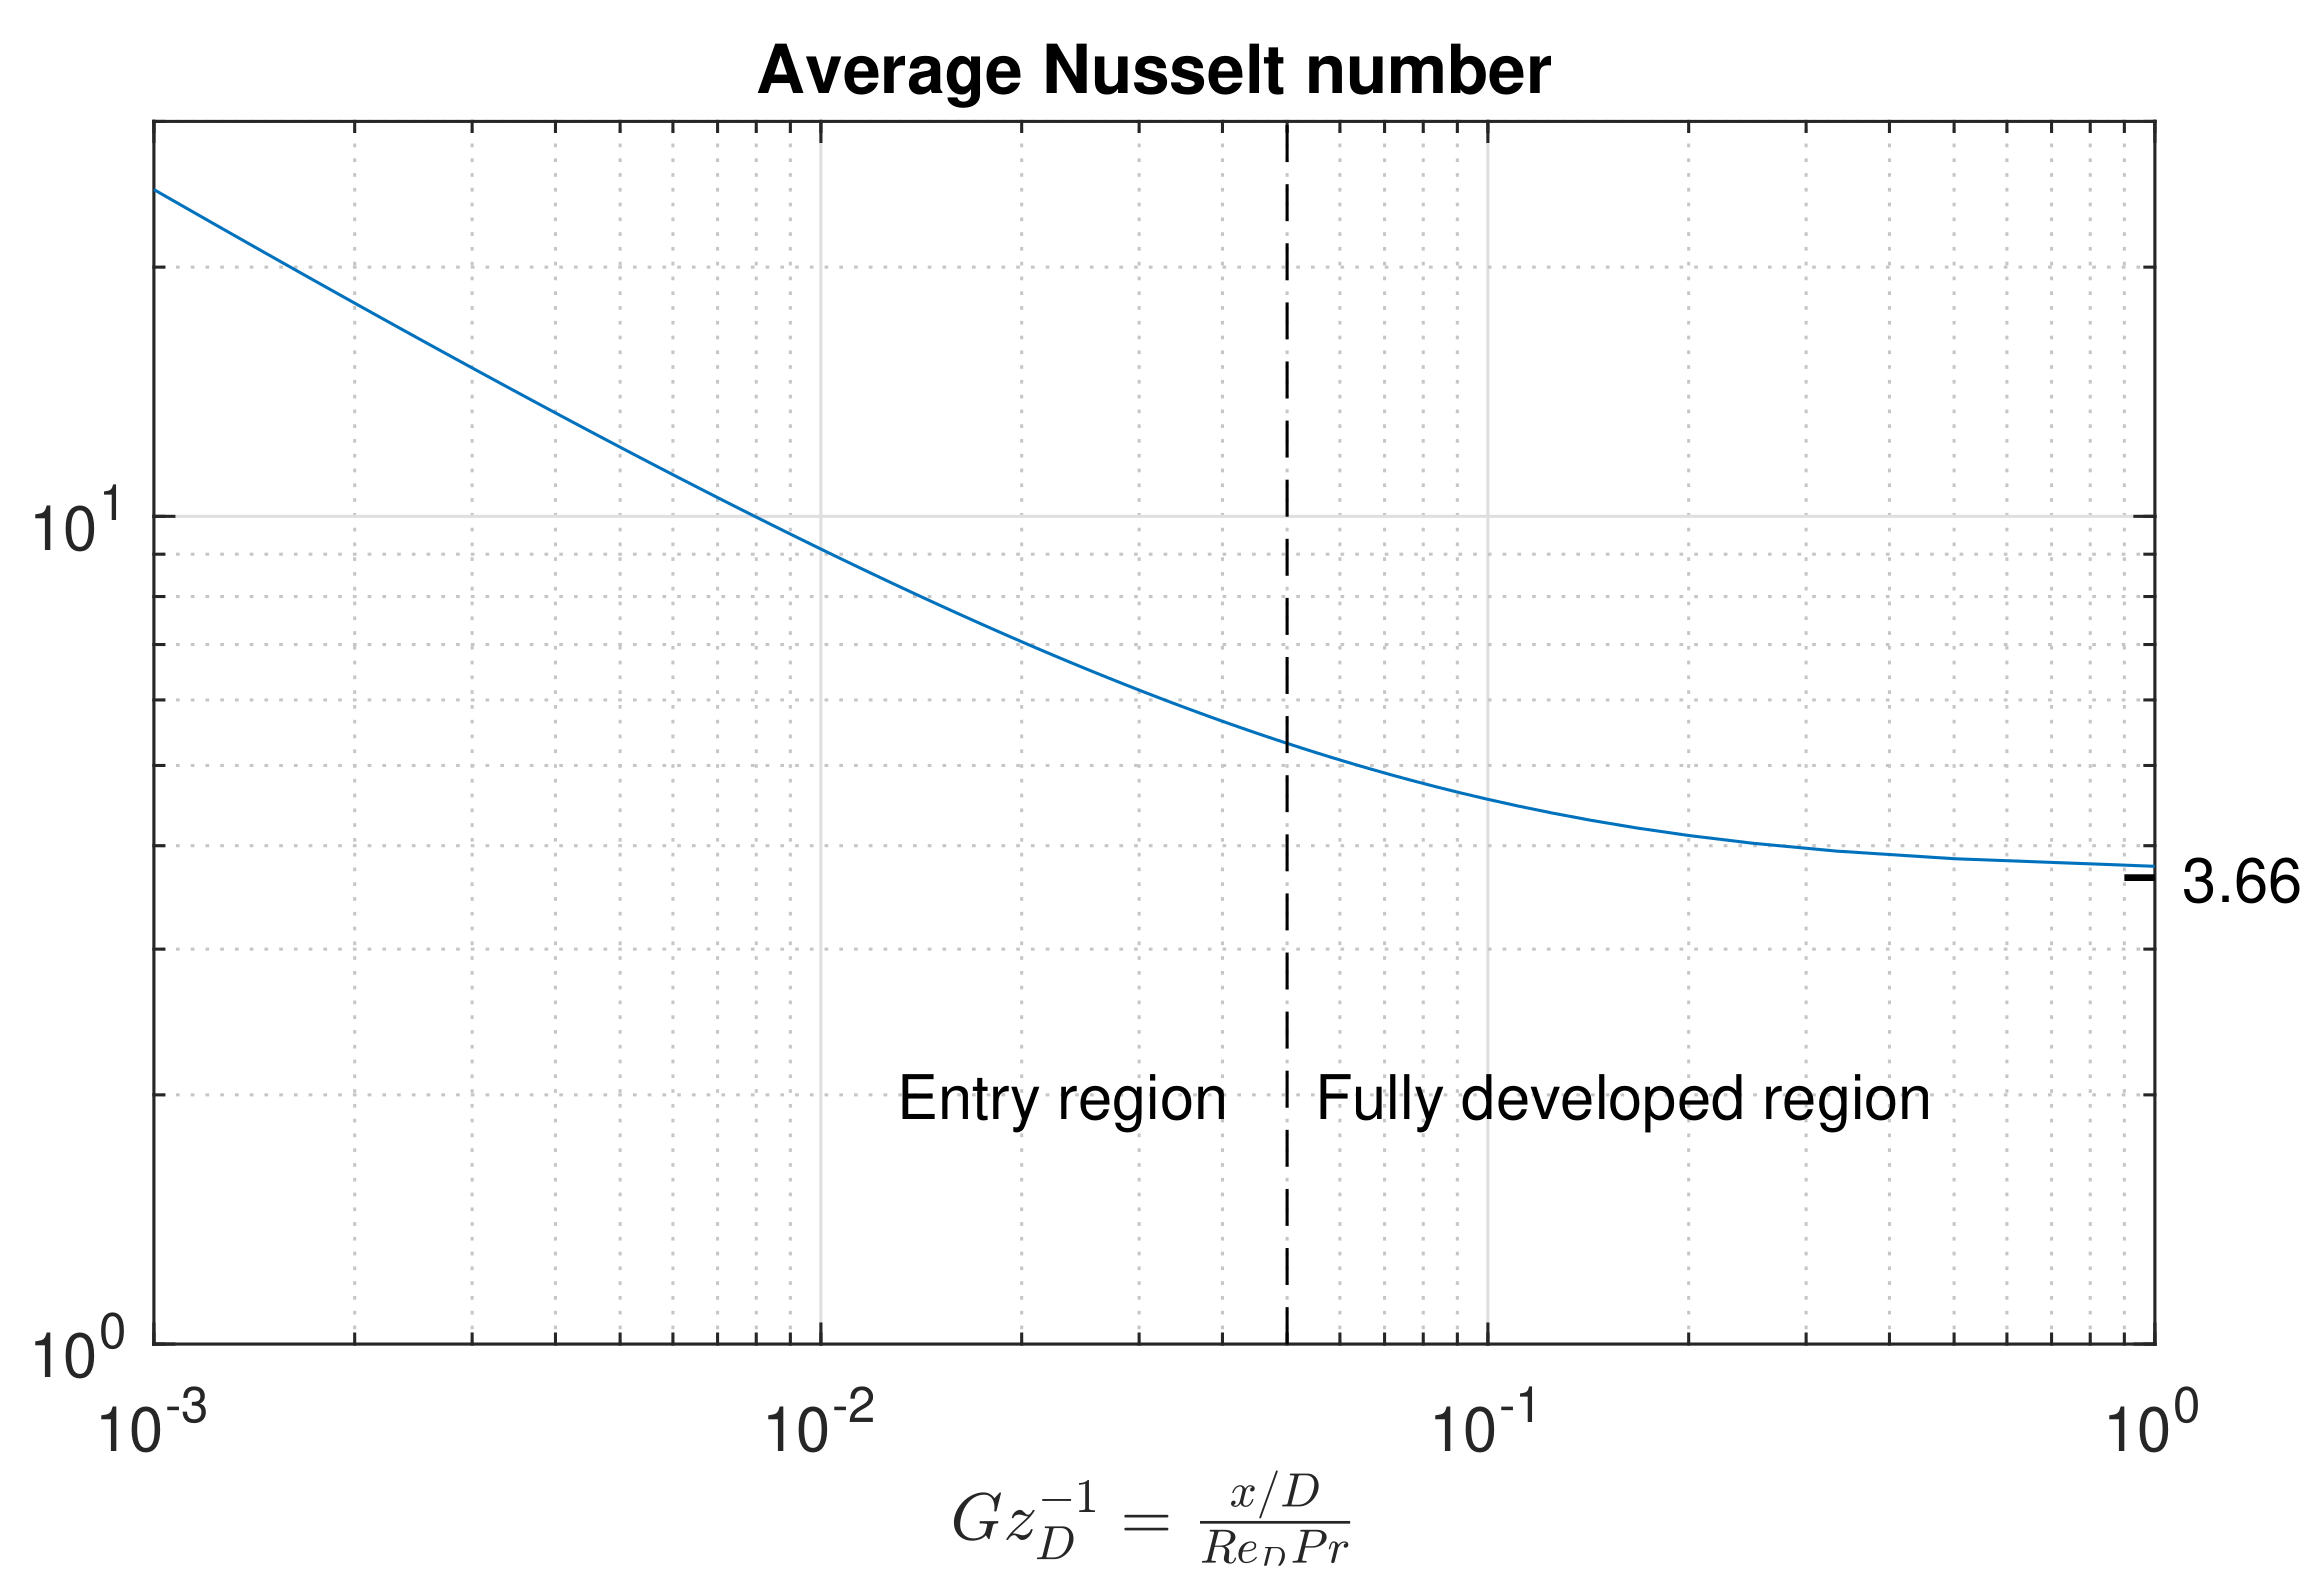
3.2. Thermal Throttle Model
- the Nusselt number, i.e., the ratio between convective and conductive heat transfer, is (entry flow effects are neglected); and
- the friction factor will be a function of the Reynolds number, as .
3.3. Numerical Implementation
4. Thermal Throttle Preliminary Tests with Air
4.1. Results
4.2. Discussion
5. Feeding System Test
5.1. Feeding System Prototype
5.2. Vacuum Facility and Iodine Collection Method
5.3. Test Procedure
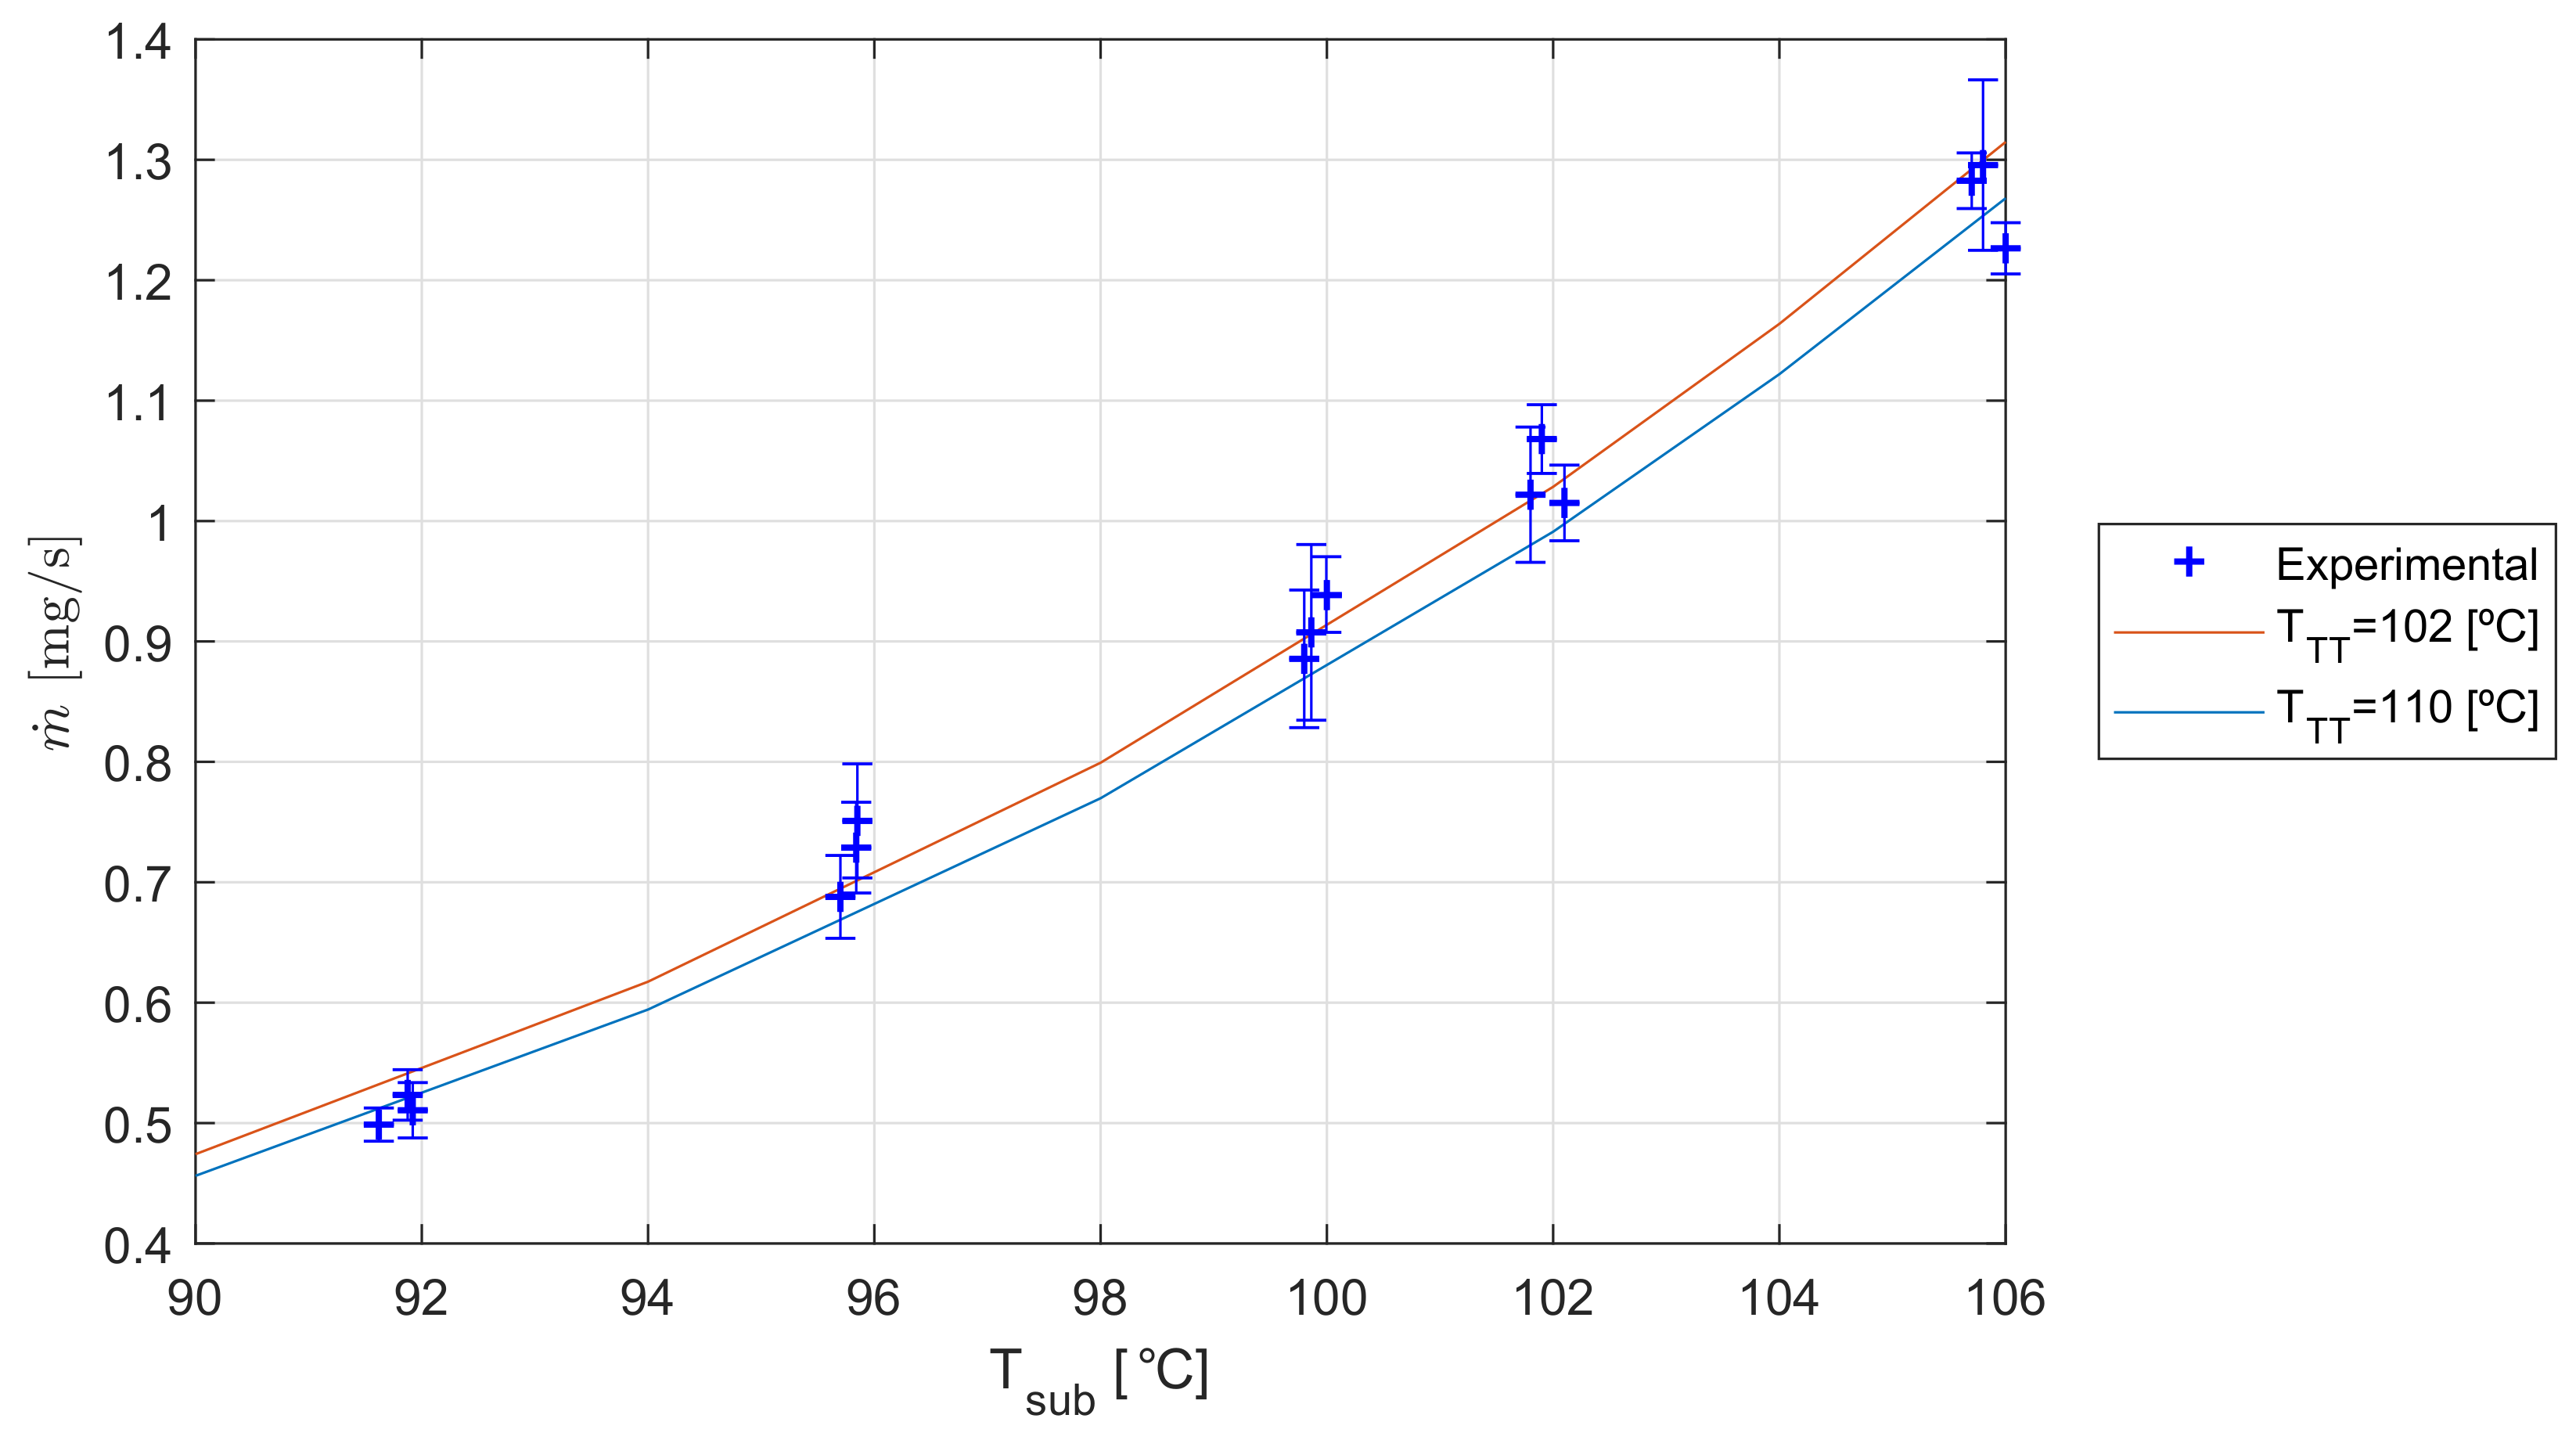
6. Results
7. Discussion
8. Conclusions
Author Contributions
Funding
Acknowledgments
Conflicts of Interest
References
- Szabo, J.; Robin, M.; Paintal, S.; Pote, B.; Hruby, V. High Density Hall Thruster Propellant Investigations. In Proceedings of the 48th AIAA/ASME/SAE/ASEE Joint Propulsion Conference—Exhibit, American Institute of Aeronautics and Astronautics, Atlanta, GA, USA, 30 July–1 August 2012. [Google Scholar] [CrossRef]
- Betzendahl, R. Rare Gases: A Fast Growing Global Commodity; CryoGas International: Lexington, MA, USA, 2007. [Google Scholar]
- Linnell, J.; Gallimore, A. Efficiency Analysis of a Hall Thruster Operating with Krypton and Xenon. In Proceedings of the 41st AIAA/ASME/SAE/ASEE Joint Propulsion Conference and Exhibit, American Institute of Aeronautics and Astronautics, Tucson, AZ, USA, 10–13 July 2005. [Google Scholar] [CrossRef] [Green Version]
- Dankanich, J.; Szabo, J.J.; Pote, B.; Oleson, S.R.; Kamhawi, H. Mission and System Advantages of Iodine Hall Thrusters. In Proceedings of the 50th AIAA/ASME/SAE/ASEE Joint Propulsion Conference, American Institute of Aeronautics and Astronautics, Cleveland, OH, USA, 28–30 July 2014. [Google Scholar] [CrossRef] [Green Version]
- Szabo, J.; Robin, M.; Paintal, S.; Pote, B.; Hruby, V.; Freeman, C. Iodine Plasma Propulsion Test Results at 1–10 kW. IEEE Trans. Plasma Sci. 2015, 43, 141–148. [Google Scholar] [CrossRef]
- Tverdokhlebov, O.; Semenkin, A. Iodine propellant for electric propulsion—To be or not to be. In Proceedings of the 37th Joint Propulsion Conference and Exhibit, American Institute of Aeronautics and Astronautics, Salt Lake City, UT, USA, 8–11 July 2001. [Google Scholar] [CrossRef]
- Branam, R. Iodine Plasma (Electric Propulsion) Interaction with Spacecraft Materials—AFRL-AFOSR-VA-TR-2016-0381; Technical report; Air Force Research Laboratory: Wright-Patterson Air Force Base, OH, USA, 2016. [Google Scholar]
- Paganucci, F.; Saravia, M.M.; Mininni, M.; Bernazzani, L.; Ceccarini, A.; Boulzaguet, T.; Pellegrini, G.; Ducci, C.; Pedrini, D.; Andreussi, T.; et al. Progress on the Development of an Iodine-fed Hall Effect Thruster. In Proceedings of the 35th International Electric Propulsion Conference, Georgia Institute of Technology, Atlanta, GA, USA, 8–12 October 2017. IEPC-2017-418. [Google Scholar]
- McLean, C.H.; Webb, S.D.; Onursal, C.A.; Ralea, M.; Stolan, J.A. Development of a Flight Propellant Regulation System for Hall Effect Thrusters. In Proceedings of the 27th International Electric Propulsion Conference, Pasadena, CA, USA, 14–19 October 2001. IEPC-01-321. [Google Scholar]
- Bober, A.; Kozubsky, K.; Komarow, G.; Maslennikov, N.; Kozlov, A.; Romashko, A. Development and Qualification Test of a SPT Electric Propulsion System for “GALS” Spacecraft. In Proceedings of the 23rd International Electric Propulsion Conference, Seattle, WA, USA, 12–17 September 1993. IEPC-93-008. [Google Scholar]
- Bushway, E.D., III; Engelbrecht, C.S.; Ganapathi, G.B. NSTAR Ion Engine Xenon Feed System: Introduction to System Design and Development. In Proceedings of the 25th International Electric Propulsion Conference, Cleveland, OH, USA, 24–28 August 1997. IEPC-97-044. [Google Scholar]
- Aadland, R.S.; Engelbrecht, C.S.; Ganpathi, G.B.; Browning, D.A.; Wilson, F.; Hoskins, W.A. Xenon Propellant Management System for 40 cm NEXT Ion Thruster. In Proceedings of the 39th AIAA/ASME/SAE/ASEE Joint Propulsion Conference and Exhibit, Huntsville, AL, USA, 20–23 July 2003. AIAA-2003-4880. [Google Scholar]
- Szabo, J.J., Jr.; Pote, B.; Paintal, S.; Robin, M.; Hruby, V. Iodine Fueled Plasma Generator System. U.S. Patent 8,610,356B2, 17 December 2013. [Google Scholar]
- Dressler, R.A.; Levandier, D.J.; Chiu, Y.H. Iodine Electric Propulsion Thrusters. U.S. Patent 6,609,363B1, 26 August 2003. [Google Scholar]
- Polzin, K.A.; Peeples, S.R.; Seixal, J.F.; Mauro, S.L.; Lewis, B.L.; Jerman, G.A.; Calvert, D.H.; Dankanich, J.; Kamhawi, H.; Hickman, T.A.; et al. Propulsion System Development for the Iodine Satellite (iSAT) Demonstration Mission. In Proceedings of the 34th International Electric Propulsion Conference, Kobe-Hyogo, Japan, 6–10 July 2015. IEPC-2015-09/ISTS-2015-b-09. [Google Scholar]
- Tsay, M.; Frongillo, J.; Hohman, K. Iodine-Fueled Mini RF Ion Thruster for CubeSat Applications. In Proceedings of the Joint Conference of 30th International Symposium on Space Technology and Science 34th International Electric Propulsion Conference and 6th Nano-satellite Symposium, Hyogo-Kobe, Japan, 4–10 July 2015. IEPC-2015-273/ISTS-2015-b-273. [Google Scholar]
- NIST Standard Reference Database Number 69; NIST: Gaithersburg, MD, USA, May 2018.
- Polzin, K.A.; Peeples, S.R.; Martinez, A.; Seixal, J.F.; Mauro, S.; Burt, A.O.; Myers, J.L. Engineering Model Propellant Feed System Development for an Iodine Hall Thruster Demonstration Mission. In Proceedings of the 52nd AIAA/SAE/ASEE Joint Propulsion Conference, American Institute of Aeronautics and Astronautics, Salt Lake City, UT, USA, 25–27 July 2016. [Google Scholar] [CrossRef] [Green Version]
- Idel’chik, I.; Steinberg, M. Handbook of Hydraulic Resistance; CRC Press: Boca Raton, FL, USA, 1994. [Google Scholar]
- Ascher, H.; Shapiro, R.E.S. The Dynamics and Thermodynamics of Compressible Fluid Flow; John Wiley & Sons, Inc.: Hoboken, NJ, USA, 1953. [Google Scholar]
- White, F.M. Viscous Fluid Flow, 2nd ed.; McGraw-Hill, Inc.: New York, NY, USA, 1991. [Google Scholar]
- Chung, T.H.; Lee, L.L.; Starling, K.E. Application of Kinetic Gas Theories and Multiparameter Correlation for Prediction of Dilute Gas Viscosity and Thermal Conductivity. Ind. Eng. Chem. Res. 1984, 23, 8–13. [Google Scholar] [CrossRef]
- Chung, T.H.; Mohammad, A.; Lee, L.L.; Starling, K.E.; Ajlan, M. Generalized Multiparameter Correlation for Nonpolar and Polar Fluid Transport Properties. Ind. Eng. Chem. Res. 1988, 27, 671–679. [Google Scholar] [CrossRef]
- Reid, R.C.; Prausnitz, J.M.; Poling, B.E. The Properties of Gases & Liquids; McGraw-Hill: New York, NY, USA, 1987. [Google Scholar]
- Neufeld, P.D.; Janzen, A.R.; Aziz, R.A. Empirical equations to calculate 16 of the transport collision integrals Ω(l,s)* for the Lennard-Jones (12-6) potential. J. Chem. Phys. 1972, 57, 1100–1102. [Google Scholar] [CrossRef]
- Mason, E.A.; Monchick, L. Transport properties of polar-gas mixtures. J. Chem. Phys. 1962, 36, 2746–2757. [Google Scholar] [CrossRef]
- Dose, V. Bayesian inference in physics: Case studies. Rep. Prog. Phys. 2003, 66, 1421–1461. [Google Scholar] [CrossRef]
- Sivia, D.; Skilling, J. Data Analysis: A Bayesian Tutorial; Oxford Science Publications: Oxford, UK, 2006. [Google Scholar]
- Veitch, J.; Vecchio, A. Bayesian coherent analysis of in-spiral gravitational wave signals with a detector network. Phys. Rev. D 2010, 81. [Google Scholar] [CrossRef] [Green Version]
- Pitkin, M.; Romano, J. Available online: https://ccpforge.cse.rl.ac.uk/gf/project/multinest (accessed on 1 February 2017).
- Bergman, T.L.; Lavine, A.S.; Incropera, F.P.; DeWitt, D.P. Fundamentals of Heat and Mass Transfer; Wiley: Hoboken, NJ, USA, 2011. [Google Scholar]
- Paganucci, F.; Bernazzani, L.; Ceccarini, A.; Saravia, M. Development of an Iodine Feeding System for Low Power Ion and Hall Effect Thrusters. In Proceedings of the AIAA Propulsion and Energy 2019 Forum, American Institute of Aeronautics and Astronautics, Indianapolis, IN, USA, 19–22 August 2019. [Google Scholar] [CrossRef]
- Paganucci, F.; Saravia, M.; Pedrini, D.; Bernazzani, L.; Ceccarini, A. Development of an Iodine Propellant Feeding System for Electric Propulsion. In Proceedings of the 5th Space Propulsion Conference, Rome, Italy, 2–6 May 2016. [Google Scholar]
- Rankine, A.O. On the Viscosity of the Vapour of Iodine. Proc. R. Soc. A Math. Phys. Eng. Sci. 1915, 91, 201–208. [Google Scholar] [CrossRef] [Green Version]
- Saravia, M.M. Alternative Propellants for Hall Thrusters. Ph.D. Thesis, Università di Pisa, Pisa, Italy, 2019. [Google Scholar]


| Propellant | Xe | Kr | I | I |
|---|---|---|---|---|
| Atomic (molecular) mass (AMU) | 131.3 | 83.8 | 126.9 | 253.8 |
| Ionization Properties | ||||
| First, Ionization potential [eV] | 12.1 | 14 | 10.5 | 9.3 |
| Peak cross section [] | 4.8 | 3.7 | 6.0 | 12.0 |
| Storage and Handling Properties | ||||
| Storage density near room temp. [] | 1.6 * | 0.5 * | - | 4.9 |
| Melting point [C] | −112 | −157 | - | 113.7 |
| Boiling point at 10 [C] | −181 | −208 | - | 9 |
| Cost [/kg] | 2000 | 150 | - | 480 |
| Set Point | Measurement | ||||||
|---|---|---|---|---|---|---|---|
| [hPa] | [C] | [C] | [C] | [C] | [C] | [mg/sec] | [mbar] |
| 1008 ± 5 | 24 | 40 | 40 | 40 | 50 | 16.2 | 7.6 |
| 24 | 60 | 60 | 60 | 60 | 15.25 | 7.5 | |
| 24.5 | 80 | 80 | 80 | 80 | 14.1 | 7.45 | |
| 24 | 100 | 100 | 99 | 99 | 12.9 | 7.4 | |
| 24.5 | 120 | 120 | 120 | 110 | 12.3 | 7.3 | |
| 24 | 120 | 120 | 120 | 120 | 11.85 | 7.3 | |
| 24.5 | 140 | 140 | 139 | 139 | 11.25 | 7.25 | |
| 24 | 160 | 160 | 160 | 159 | 10.44 | 7.2 | |
| T Sublimation Body [C] | T Thermal Throttle [C] |
|---|---|
| 108 | |
| 104 | 110 |
| 112 | |
| 110 | |
| 100 | 105 |
| 102 | |
| 110 | |
| 98 | 105 |
| 100 | |
| 110 | |
| 94 | 105 |
| 100 | |
| 110 | |
| 90 | 105 |
| 100 |
| T Sublimation Body | T Thermal Throttle [C] | Average | Std. Dev. | |
|---|---|---|---|---|
| [C] | [C] | [mg/s] | [mg/s] | % |
| 91.6 | 100.3 | 0.499 | 0.014 | 2.76 |
| 91.9 | 105.3 | 0.511 | 0.023 | 4.49 |
| 91.9 | 110.3 | 0.523 | 0.021 | 4.00 |
| 95.9 | 101.1 | 0.751 | 0.047 | 6.30 |
| 95.7 | 105.3 | 0.688 | 0.034 | 5.00 |
| 95.8 | 110.3 | 0.729 | 0.038 | 5.17 |
| 99.9 | 108.8 | 0.908 | 0.073 | 8.03 |
| 100.0 | 105.0 | 0.886 | 0.031 | 3.50 |
| 99.8 | 100.0 | 0.886 | 0.057 | 6.45 |
| 102.1 | 110.0 | 1.015 | 0.031 | 3.09 |
| 101.9 | 105.0 | 1.068 | 0.029 | 2.67 |
| 101.8 | 102.0 | 1.022 | 0.056 | 5.49 |
| 106.0 | 112.0 | 1.227 | 0.021 | 1.73 |
| 105.8 | 110.0 | 1.296 | 0.071 | 5.46 |
| 105.7 | 108.0 | 1.283 | 0.023 | 1.80 |
| T Sublimation Body [C] | T Thermal Throttle [C] |
|---|---|
© 2020 by the authors. Licensee MDPI, Basel, Switzerland. This article is an open access article distributed under the terms and conditions of the Creative Commons Attribution (CC BY) license (http://creativecommons.org/licenses/by/4.0/).
Share and Cite
Saravia, M.M.; Bernazzani, L.; Ceccarini, A.; Vinci, A.E.; Paganucci, F. Modeling and Characterization of a Thermally Controlled Iodine Feeding System for Electric Propulsion Applications. Aerospace 2020, 7, 10. https://doi.org/10.3390/aerospace7020010
Saravia MM, Bernazzani L, Ceccarini A, Vinci AE, Paganucci F. Modeling and Characterization of a Thermally Controlled Iodine Feeding System for Electric Propulsion Applications. Aerospace. 2020; 7(2):10. https://doi.org/10.3390/aerospace7020010
Chicago/Turabian StyleSaravia, Manuel Martín, Luca Bernazzani, Alessio Ceccarini, Alfio Emanuele Vinci, and Fabrizio Paganucci. 2020. "Modeling and Characterization of a Thermally Controlled Iodine Feeding System for Electric Propulsion Applications" Aerospace 7, no. 2: 10. https://doi.org/10.3390/aerospace7020010
APA StyleSaravia, M. M., Bernazzani, L., Ceccarini, A., Vinci, A. E., & Paganucci, F. (2020). Modeling and Characterization of a Thermally Controlled Iodine Feeding System for Electric Propulsion Applications. Aerospace, 7(2), 10. https://doi.org/10.3390/aerospace7020010