1. Introduction
The International Civil Aviation Organization (ICAO) for the standardization of international air traffic formulated its vision of a global, optimally economical, sustainable, and safe Air Traffic Management (ATM) system in Doc 9854 [
1] in 2005. Every six years, ICAO defines the necessary instruments, procedures, and implementation data in so-called Aviation System Block Upgrades (ASBU) [
2]. Therein, together with the Single European Sky ATM Research Programme (SESAR), ICAO plans to implement Trajectory Based Operations (TBO) by 2028, with the prospect of increasing air traffic efficiency, increasing the safety level, and increasing the environmental compatibility of air traffic.
TBOs describe 4D trajectories with binding-time specifications to enable airlines to plan and operate flights individually and dynamically. In contrast to today’s long-term and static flight planning along with a fixed route structure, TBOs enable 4D multi-criteria optimized free routes. TBOs are expected to give air traffic control (ATC) access to the separation-related position data of all aircraft [
3,
4]. With TBO, all air traffic stakeholders (i.e., the flight itself, the airline, the ATM network, and the air traffic service provider (ANSP)) can update individual, sometimes conflicting, optimization targets and restrictions on a single trajectory during the flight. Through an efficient exchange of information, a revision of the flight path is possible so that during the flight the optimal trajectory is achieved as a compromise between all air traffic participants.
This dynamic trajectory optimization carries an important potential to react to operational conditions on a tactical level. For example, TBOs allow us to react to disruptions in the flight plan and therewith to reduce delay costs already during the flight. Those actions may induce additional costs in terms of extra fuel burn. From this follows an optimization problem, wherein costs for delay reducing actions in the air and on the ground have to be balanced with the expected delay costs. The delay costs, however, strongly depend on the number of transfer passengers and are flight-specific.
This paper investigates the success rate and the compensation rate of several actions to reduce delay costs by opposing the costs of these measures to the expected passenger-sensitive delay costs. In this paper, we focus on the estimation of costs of five different operational strategies to keep delay-induced operation costs in a flight network as low as possible. After we have surveyed the relevant scientific literature (
Section 2), we propose a scheme to estimate the relevant passenger flow from inbound and outbound flight at a major German hub airport (
Section 3). We use the resulting passenger flow values to feed a cost calculation scheme that provides a total cost estimation for a given delay situation (
Section 4). With the goal to find out if we can reduce these costs, we discuss five different operational strategies to reduce the resulting reactionary costs of a delay of a flight in a network (
Section 5). For the evaluation of these strategies, we propose innovative performance indicators (
Section 6). Using these indicators, we analyze the ability of the five operational costs reduction strategies for the given data set (
Section 7).
2. State of the Art
2.1. Delays in Airline Operations
In 2019, an average of 1328 flights per day in Europe had a delay of more than 15 min [
5]. Delay is defined as the difference between the scheduled off-block time (SOBT) and the start time window assigned by the central air traffic flow control unit, the actual off-block time (AOBT) [
6]. On average, this also called Air Traffic Flow Management (ATFM) delay caused approximately EUR 100 per minute of delay for airlines [
7]. If a flight is delayed, it causes a primary delay at the destination airport. If this disturbance cannot be made up for during the next turnaround, the delay is carried over into the following flight events. Due to these reactionary delays, tactical network delays cannot be excluded. Per minute of primary delay, Europe suffers an average of two thirds of a minute of secondary delay [
7].
The reasons for primary and reactionary delays are manifold. For example, technical problems on the aircraft mainly induce primary delay, as long as the aircraft is exchanged. Passenger- or baggage-related delays, cargo or postal-related causes, flight operational disruptions, and aircraft-related malfunctions on the apron, the cause of which is usually queues in the airside infrastructure, are primarily responsible for reactionary delay.
If there are technical defects on the aircraft with primary delay, the flight dispatcher must include the replacement or repair of the aircraft in the cost calculation. Both generally lead to unavoidable delays in flight operations. The frequency of a technical defect on an aircraft that causes a delay on the ground of more than 15 min is described as Technical Dispatch Reliability (TDR) and achieves very low failure rates in civil air traffic with values between
% and
% [
8].
Airlines send the reasons for their delays as a delay code, defined by the International Air Transport Association (IATA), in AHM 780 (i.e., a standard format for Aircraft Movement Messages) from the departure airport to the destination airport [
9]. Among the causes of reactionary delays, passenger-related delays (i.e., waiting for delayed passengers or baggage) are particularly sensitive for airlines as commercial enterprises.
If delay costs are to be minimized, it is important to distinguish between primary and reactionary delay. While the primary delay of a single flight is primarily limited to personnel costs and passenger compensation claims, the costs of reactionary delays become almost unpredictable due to the propagation of the primary delay to subsequent flight events and may even have an impact on maintenance costs. Airlines have set up the Airline Operations Control Center (AOCC) to avoid reactionary delays. Here, the flight dispatcher tries to compensate for the reactionary delay costs to the same extent as he tries to maintain passenger comfort. In 2004, passenger rights and conditions were laid down uniformly throughout Europe in EU Regulation (EC) No. 261/2004. In this regulation, compensation claims are dependent on distance and delay. For example, for flights with distances of up to 1500 km, compensation amounting to EUR 250 can be claimed from a delay of two hours (see
Section 4.4).
Airlines have different possibilities to react to delays. Most of these possibilities may save delay costs, but induce costs themself. Hence, the efficiency of each one depends strongly on the duration of the delay, the number of sensitive connective passengers, and possible onward flights. For example, airlines plan time buffers in their flight schedules, which depend on the distance to be flown, the SOBT, and the extent of the delays in the past [
10]. The measurement of these time buffers requires a trade-off between opportunity costs (lost revenue due to the longer ground time of an aircraft) and the costs of the delay of an aircraft [
11]. Allocating these schedule buffers efficiently in daily airline schedules to eliminate critical resource dependencies and therewith to improve the network robustness is still under investigation [
12,
13,
14,
15].
If delay costs are subject to a multi-criteria trajectory optimization, a rough estimate of the delay costs of EUR 100 per minute cannot be used because reactionary delay costs incurred by an airline are individual cases. For this reason, the individual costs of each strategy must be quantified and implemented them in a trajectory optimization environment. For example, the Toolchain for Multi-Criteria Aircraft Trajectory Optimization (TOMATO) [
16] enables a comparison of delay costs with the total costs of the whole flight to derive flight-specific recommendations for action. Only then, environmentally induced detours (e.g., to avoid turbulent areas, traffic congestion, or the formation of contrails) can be offset against the expected delay costs. Today, the avoidance of contrail formation is not an operational target, since contrails are not burdened with costs. However, the radiative impact of contrails on global warming has been proven [
17] and is socially accepted [
18]. In line with a greener aviation, contrail costs might be an efficient instrument in the near future. The non-linear relationship between contrail costs and delay costs has already been elaborated [
19].
In this study, the detailed cost rates have been applied to each delayed flight individually in a network provided by a representative rotation schedule of an airport, depending on the number of transfer passengers and the airline business model to develop recommendations for actions.
2.2. Quantification of Delay Costs
In the Airline business, delay costs, especially passenger-related costs, are not published. Airline delay costs are part of the airline business model and often belong to the company secret.
The University of Westminster accumulated the delay costs of numerous European airlines and published mean values for three different scenarios [
7]. The scenarios reflect different passenger sensitivities and are referred to as high, base, and low. This estimation was made aircraft-type specific for 15 aircraft types and allows a more detailed overview of airline delay costs. Cook and Tanner [
7] provide reference values for the cost of delay to European airlines based on the year 2014. However, not all cost components and aircraft types are considered in this report and the number and connectivity of sensitive transfer passengers of an individual flight are not considered.
Usually, intents in optimizing ground operations (e.g., to minimize the turnaround time) have to deal with defining delay costs in the objective function. However, if the turnaround time is to be minimized, costs play an underestimated role. Hence, costs are only approximated in those studies. For example, as part of the Airport-Collaborative Decision Making (A-CDM), several studies deal with an accurate prediction of turnaround target times by incorporating stochastic process time distributions without considering the turnaround costs at all [
20,
21,
22,
23,
24,
25,
26]. In these studies, delay costs are often linearized and do not consider passenger-related costs. Analytical approaches aiming an optimal allocation of airport resources, such as ground handling equipment [
27,
28], pushback trucks [
29], de-icing slots [
30] or aircraft stands [
31,
32] approximate the costs as parameterized boundary conditions in their optimization. All these studies do not couple ground and flight operations and hence do not need to consider detailed flight-specific monetary delay costs [
19].
Beatty et al. [
12] minimize the costs of reactionary delays by allowing the airline to swap landing slots. Ahmadbeygi et al. [
13] and Wu [
14] focus on the advantage of planning slacks in the planned schedule to minimize delay costs. Wu et al. [
15] identified weak links in an airline network using a Bayesian Network in a delay-tree framework for modeling multiple resource connections for transfer passengers. All these studies do not consider the possibility to reduce the delay costs of individual sensitive passengers.
Delay may be reduced by Air Traffic control (ATC) and an intelligent slot assignment. Although this strategic level is out of the scope of this paper, Montlaur and Delgado [
33] analyzed a significant regression between minimized total flight delay and minimum passenger delay which motivates the analysis of this paper. They applied other slot allocation priorities than those usually applied in Rotation by Schedule and placed a stronger focus on passenger numbers without considering the number of connective passengers. Manley and Sherry [
34] also considered passenger flows in the slot assignment, but did not distinguish between connective passengers and passengers at their final destination.
2.3. Delay Costs in Aircraft Trajectory Optimization
Other studies, dealing with monetary delay costs in trajectory optimization often do not consider the environmental part of the trajectory assessment, although it contains the most unpredictable impact factors. The focus of the project Turnaround Integration in Trajectory and Network (TITAN) [
35] was the identification of improvement opportunities in the communication between aircraft turnaround stakeholders [
36] to reduce the delay on ground. However, in TITAN the aircraft was still considered stationary. During the turnaround, the trajectory continues to evolve but only in the time dimension [
35]. Neither the network level nor environmental issues are developed in detail. Other studies end at the airport slot allocation and are not interested in the effect of trajectory deviations on the delay costs [
37,
38,
39,
40,
41]. Other authors focus on the absorption of delays, neglecting negative effects as increased costs by gaining speed [
42]. The restrictions may result from the necessity to precisely model the individual aircraft trajectory to assess competitive cost factors of the trajectory. To consider different weightings of the cost functions physically reliable modifications regarding flight path or speed are required. Therefore, an aircraft performance model with optimization potential is essential. Those highly complex and aircraft type-specific models are rare. Matthes et al. [
43] developed a performance model for the development of environmentally friendly trajectories based on BADA performance tables which is a rough approximation of the aircraft performance [
44]. Here, delay costs were not considered. The Air Traffic Optimizer (AirTOp) would be able to couple the trajectory and ground operations, but also relies on BADA performance tables and is restricted to the implementation of a Standard Atmosphere [
45]. Commercial products, such as Lido flight 4D by Lufthansa or the Air Traffic Simulator (TAAM) by Jeppesen only consider a Standard Atmosphere without any wind information. Therewith, weather effects cannot be reproduced.
The conducted literature scan reveals that the analyzes of reactionary delay costs and its propagation into a flight network has not yet been adequately investigated. This paper aims to contribute to the closure of this research gap.
4. Cost Impacts of Reactionary Delay
Since the aim of this paper is the monetization of airline delay costs to be considered in a multi-criteria trajectory optimization, only the tactical delay costs and especially the tactical delay costs at the network level (reactionary delay costs) are relevant. Strategic delay costs are not taken into account because they do not arise in operational business and therefore cannot be influenced by operational compensation strategies. In this paper, aircraft type-specific cost components for fuel, maintenance, crew, and passengers developed by Cook et al. [
11,
47] are extended by carbon dioxide emission costs and missing aircraft types considering improvements in the efficiency of recently developed aircraft.
4.1. Fuel Burn and Kerosene
In order to determine fuel flow for additional flight time due to delay, we distinguish between flight phases ground (containing auxiliary power unit (APU), idle and taxi), cruise (containing cruise and climb) and descent (containing descent and holding) [
11]. For each flight phase and each scenario, a linear function of fuel flow
(kg/min) depending on MTOW (t) has been identified within the data provided by [
11] with coefficients of determination between
. Again, the scenarios reflect different airline business models and different pay load factors (low: PLF = 85%, base: PLF = 65% and high: PLF = 50%). For example, in the high scenario additional fuel during cruise
is calculated by
For each scenario, the functions are used to extend the fuel flow to missing aircraft types.
We assume a lower fuel flow of recently developed aircraft types due to technical improvements. For this reason, fuel flow is reduced for A346 by 5%, A20N, A388, and B748 by 10%, and A359, B788, and B789 by 20%. Furthermore, the fuel flow of the old MD82 is increased by 10%. The reduced fuel flow of A20N, A388, and B748 and the increased fuel consumption of MD82 could be approximated with the aircraft performance model COALA [
49]. The 5% gain in fuel efficiency of the A346 is only an assumption, which must be validated for future analysis. The available, interpolated, and manipulated aircraft types are listed in
Table 2.
The price per kilogram kerosene is assumed to be EUR 0.5, EUR 0.6, and EUR 0.7 for the low, base, and high scenario, respectively.
In the high scenario, fuel costs per minute delay amount to
4.2. Costs
Carbon dioxide emissions constitute a major part of jet engine emissions with contribution to global warming. Depending on the degree of completeness of the combustion of kerosene the emission index
(kg
/(kg kerosene)) varies between
[
50]. In this study, we assume an emission index of
,
and
in the low, base and high scenario, respectively. In the last two years, the price per tonne emitted carbon dioxide
(EUR/t
) varied between
[
51]. Minimum, mean and maximum values are transferred to the scenarios. Finally, costs for
per kilogram kerosene range from EUR 0.057/kg, EUR 0.078/kg and EUR 0.097/kg kerosene for the low, base and high scenario, respectively. Finally, in the high scenario,
costs yield to
4.3. Maintenance Costs (MRT)
Cook and Tanner [
7] determined the maintenance costs for twelve different aircraft types (compare
Table 2), which are due to the longer stress on an aircraft, e.g., due to the delay in the air or on the ground for the low, base, and high scenario. Costs distinguish between the flight phases gate, taxi, and airborne. Maintenance costs linearly depend on the square root of MTOW (
). For example, in the high scenario, increased maintenance costs (EUR/min) due to airborne delay can be approximated by
Coefficients of determination between give evidence for the linear dependency. Hence, other aircraft types have been interpolated and no manipulation took place.
4.4. Costs for Crew and Passengers
Cook and Tanner determined costs for the crew due to extra work during delay
(EUR/min) for the base and high scenario as a function of the delay [
7] for twelve different aircraft types (see
Table 2). In the low scenario, it is assumed that overtime is not remunerated [
7]. Since these numbers reflect the analyses of the year 2014, we increased the crew costs by
% and 1% per year for the base and high scenario, respectively. The number of crew members is defined in the prototype certification of the aircraft and depends on the number of passengers and the airline business model. The compensation of overtime hours (EUR/min) given by Cook and Tanner [
7] can be linearly approximated as function of
(
) with coefficients of regression between
. For example, in the high scenario, additional crew costs for the airline are calculated by
Passenger costs due to delay
(EUR/min) are distinguished between hard costs
(EUR/min) (for compensation and assistance services which an airline must pay to passengers in the event of delay, regulated by law) and soft costs
(EUR/min) (support for particularly time-sensitive first-class or business-class passengers, not regulated by law). Compensation payments for hard costs are defined in Regulation (EG) 261/2004. Hard costs for the airline, depending on the number of passengers are provided by Cook and Tanner [
7] and can be approximated as power function of the primary delay
(min) with a regression coefficient of
:
The compensation paid for an annulation of the flight in case of a very large delay depends on the travel distance and is defined in Regulation (EG) Nr. 261/2004. Flights with distances shorter than 1500 km, between 1500 and 3500 km and longer than 3500 km are compensated with EUR 250, EUR 400 and EUR 600, respectively. Additionally, a catering/hotel allowance of EUR 86, EUR 107 and EUR 122 are assumed for the low, base, and high scenario, respectively.
Passenger soft costs per passenger depending on the primary delay (min) are discretized by [
7] in five-minute steps. We corrected the figures for inflation of
% between 2014 and 2019, and interpolated linearly between the five-minute steps. The share of soft costs from the total passenger costs has been assumed to be 10% in the low and base scenario and 20% in the high scenario. Finally, we approximate the amount of total passenger delay costs with the following power functions:
4.5. Conclusions of Airline Reactionary Delay Costs
Finally, the total airline costs per minute reactionary delay can be estimated summarizing Equations (
3) to (
11) to
In the high scenario, the components are quantified to
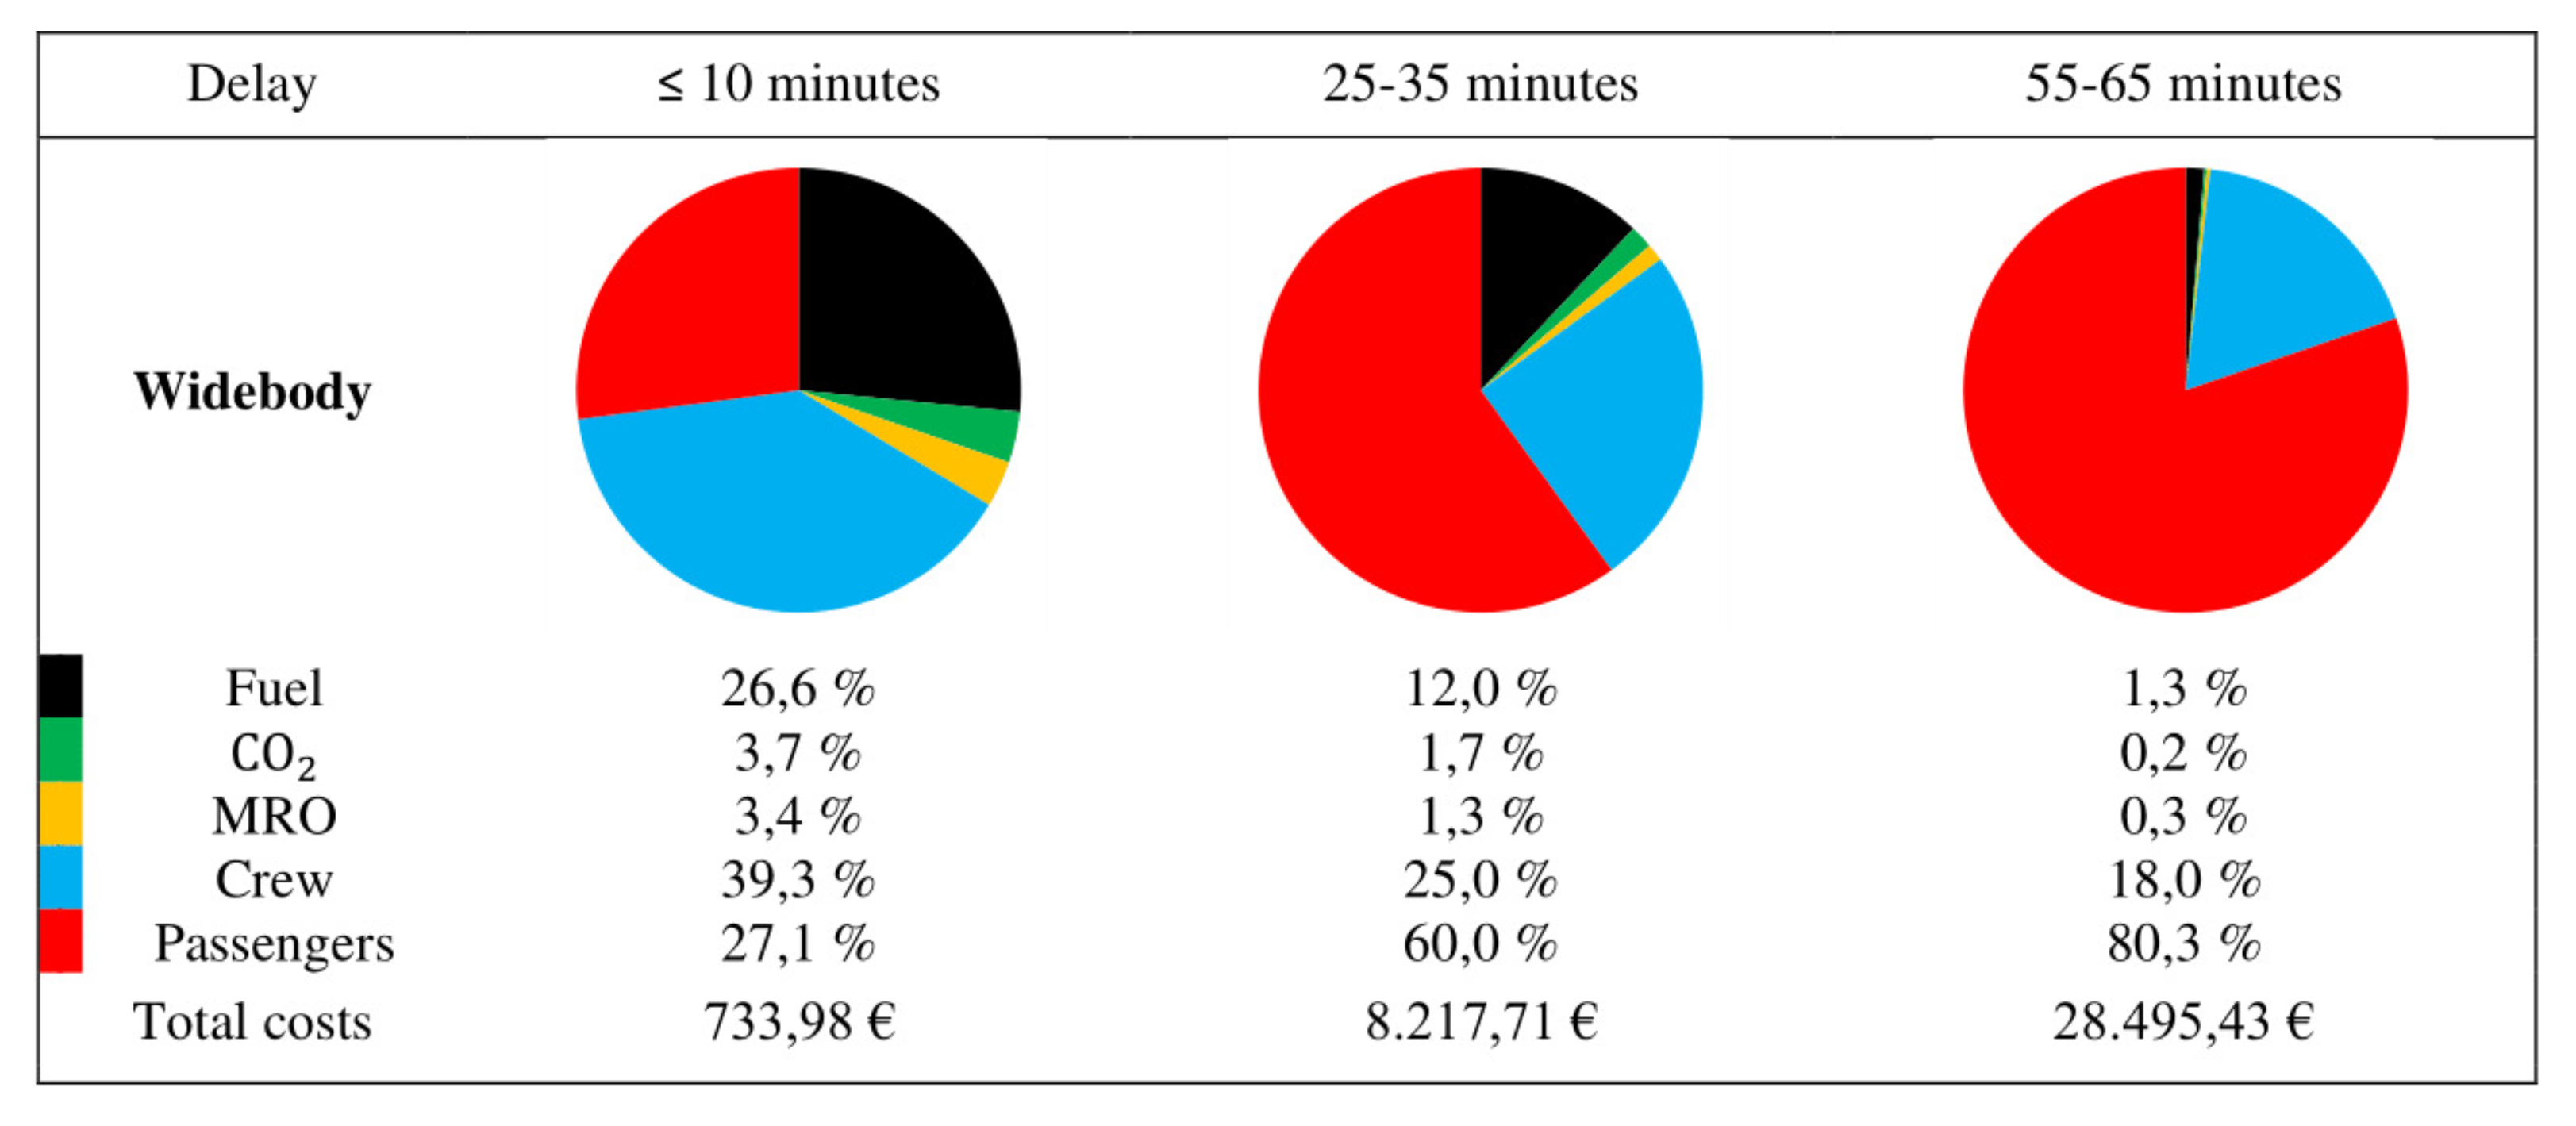
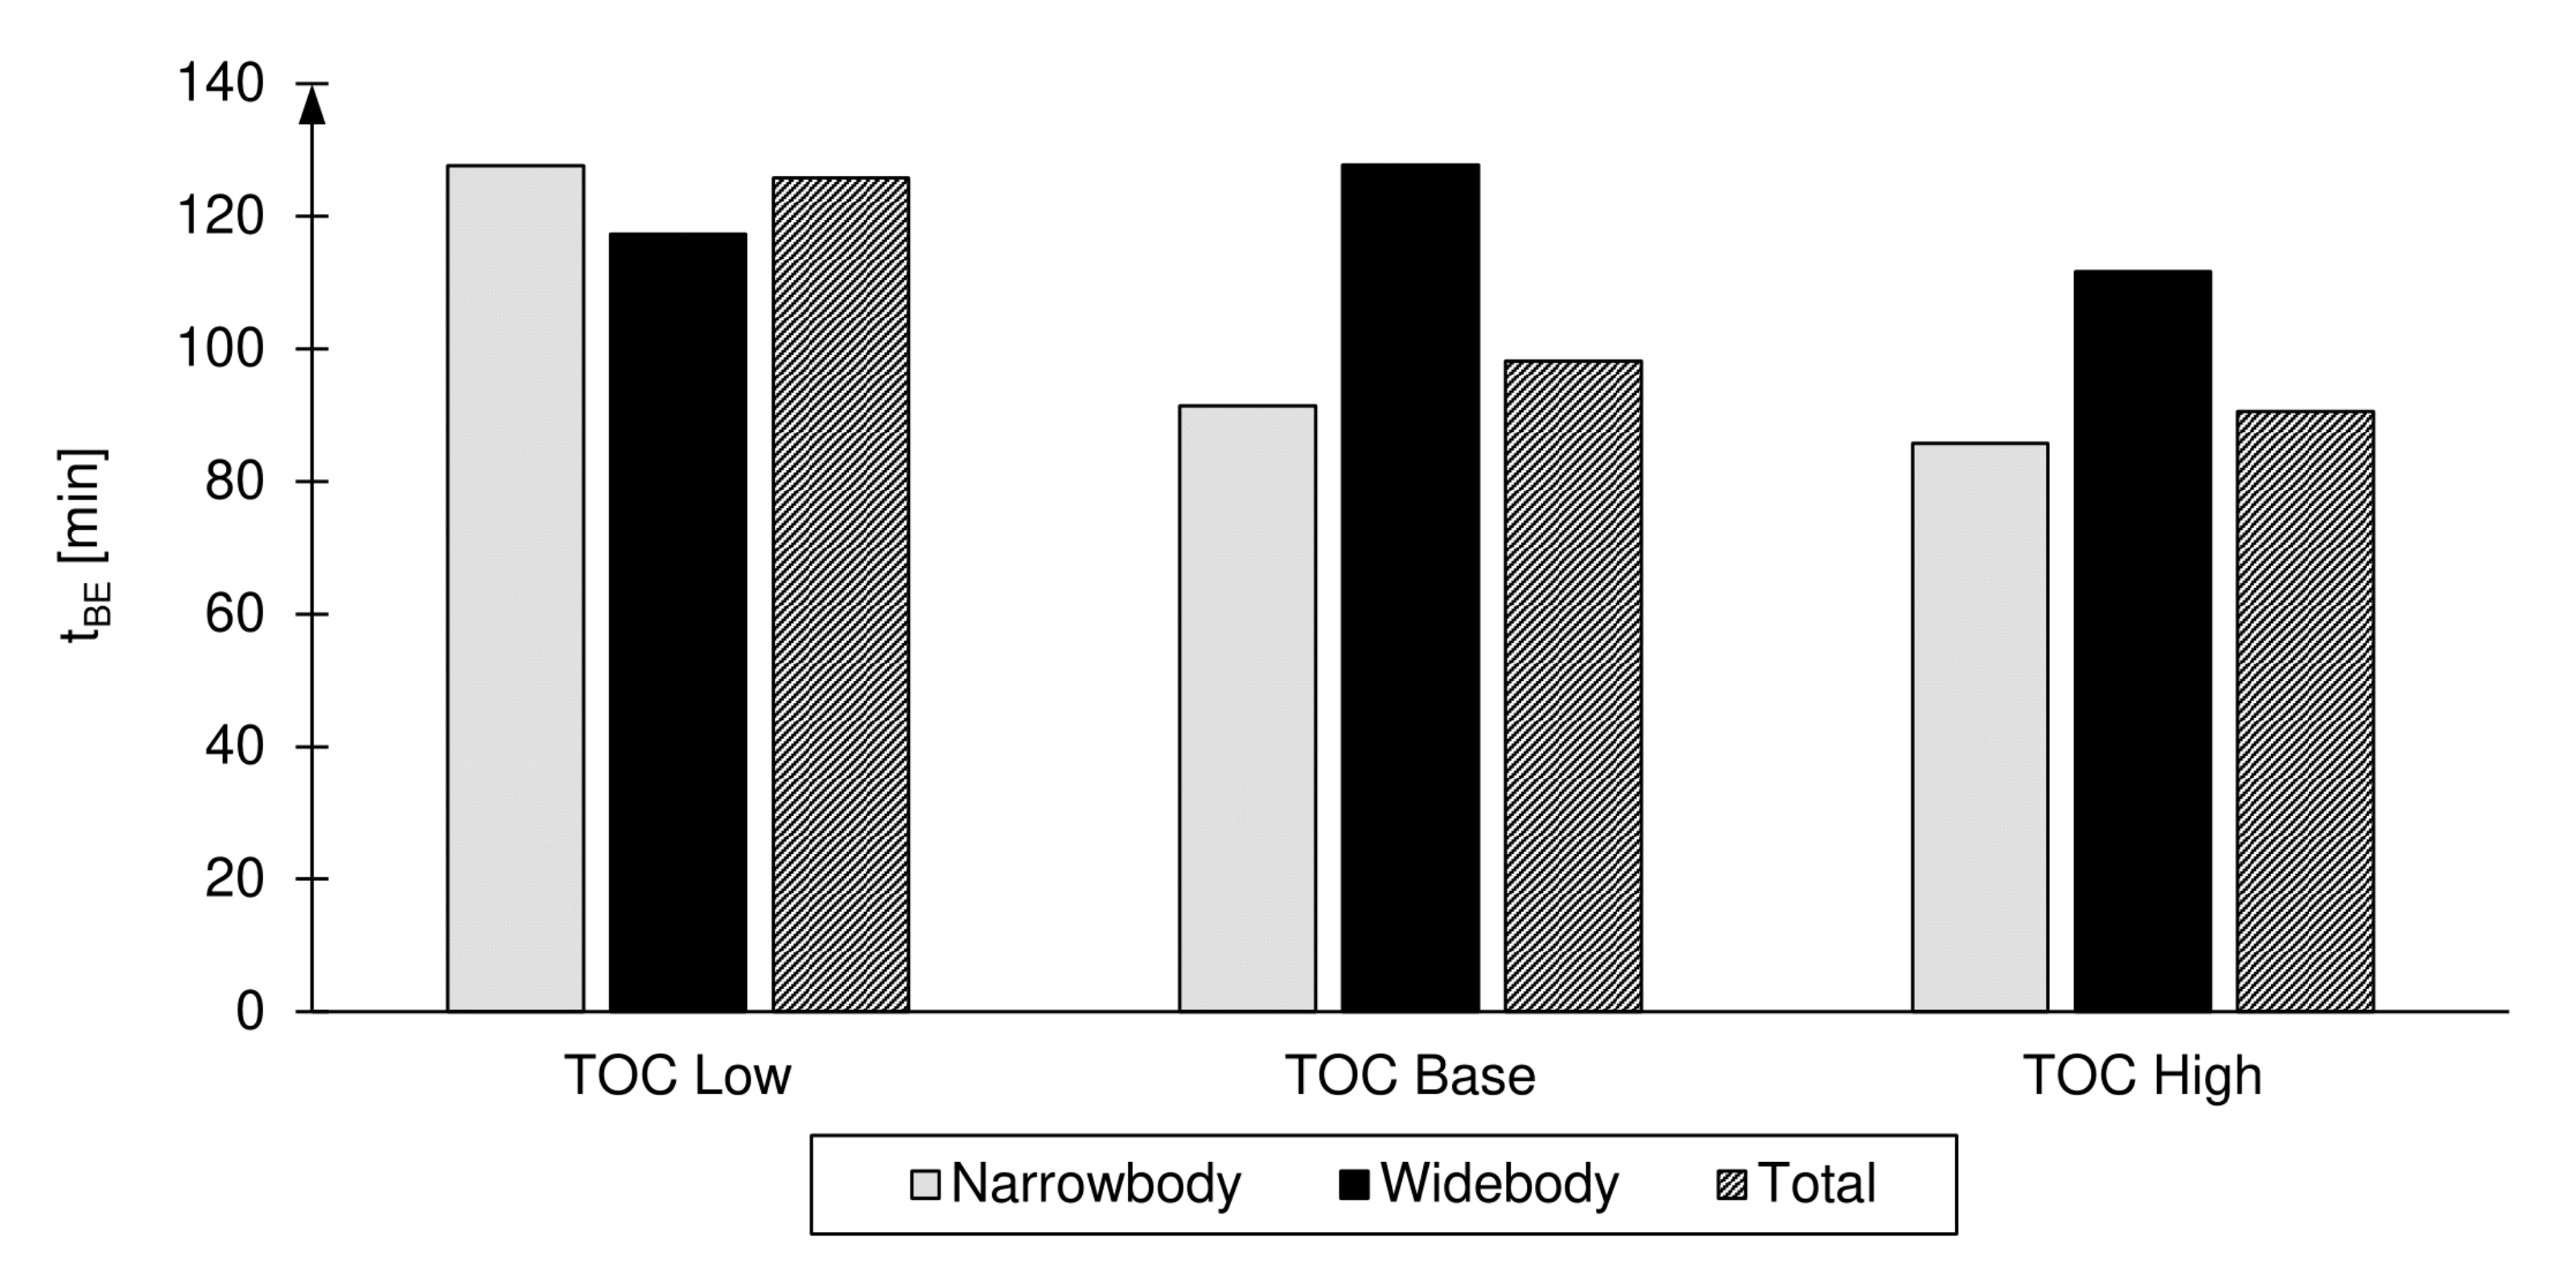
The impact of individual delay cost components on the total delay costs depends on the scenario (low, base, or high), on the aircraft size (narrowbody or widebody), and the total amount of delay.
Figure 3 shows the share of cost components as mean values per delay interval. For small amounts of delay (<10 min), the share of crew costs dominates the cost balance. The higher the amount of delay, the more important the share of reactionary passenger costs and the lower the importance of kerosene and crew.
Note,
Figure 3 only shows the result of the analysis done in
Section 4. Here, the reactionary delay costs per delayed flight without any compensation strategy is shown. In the following, compensation strategies of reactionary delay are analyzed, formalized, and applied to the flight schedule of FRA.
5. Compensation Strategies of Reactionary Delay
In the following, costs for five compensation strategies to minimize airline delay costs are estimated to find the most efficient strategy or combination of strategies for each delayed flight in the example rotation schedule.
5.1. Fast Turnaround ()
The total turnaround time (TAT) as the duration of the aircraft on the ground is hard to predict, especially in case of an arrival delay [
21,
25,
26]. The reasons for that are manifold: First: the actual gate position may vary from the scheduled one, second: resources of the ground operations may be limited, third: the ATC clearance for take-off may be retarded because of a missed take-off slot, and fourth: the network management operations center (NMOC) may retard the clearance because of a missed airway slot. This often results in a delay increase of an already delayed aircraft due to an unexpectedly long stand on ground [
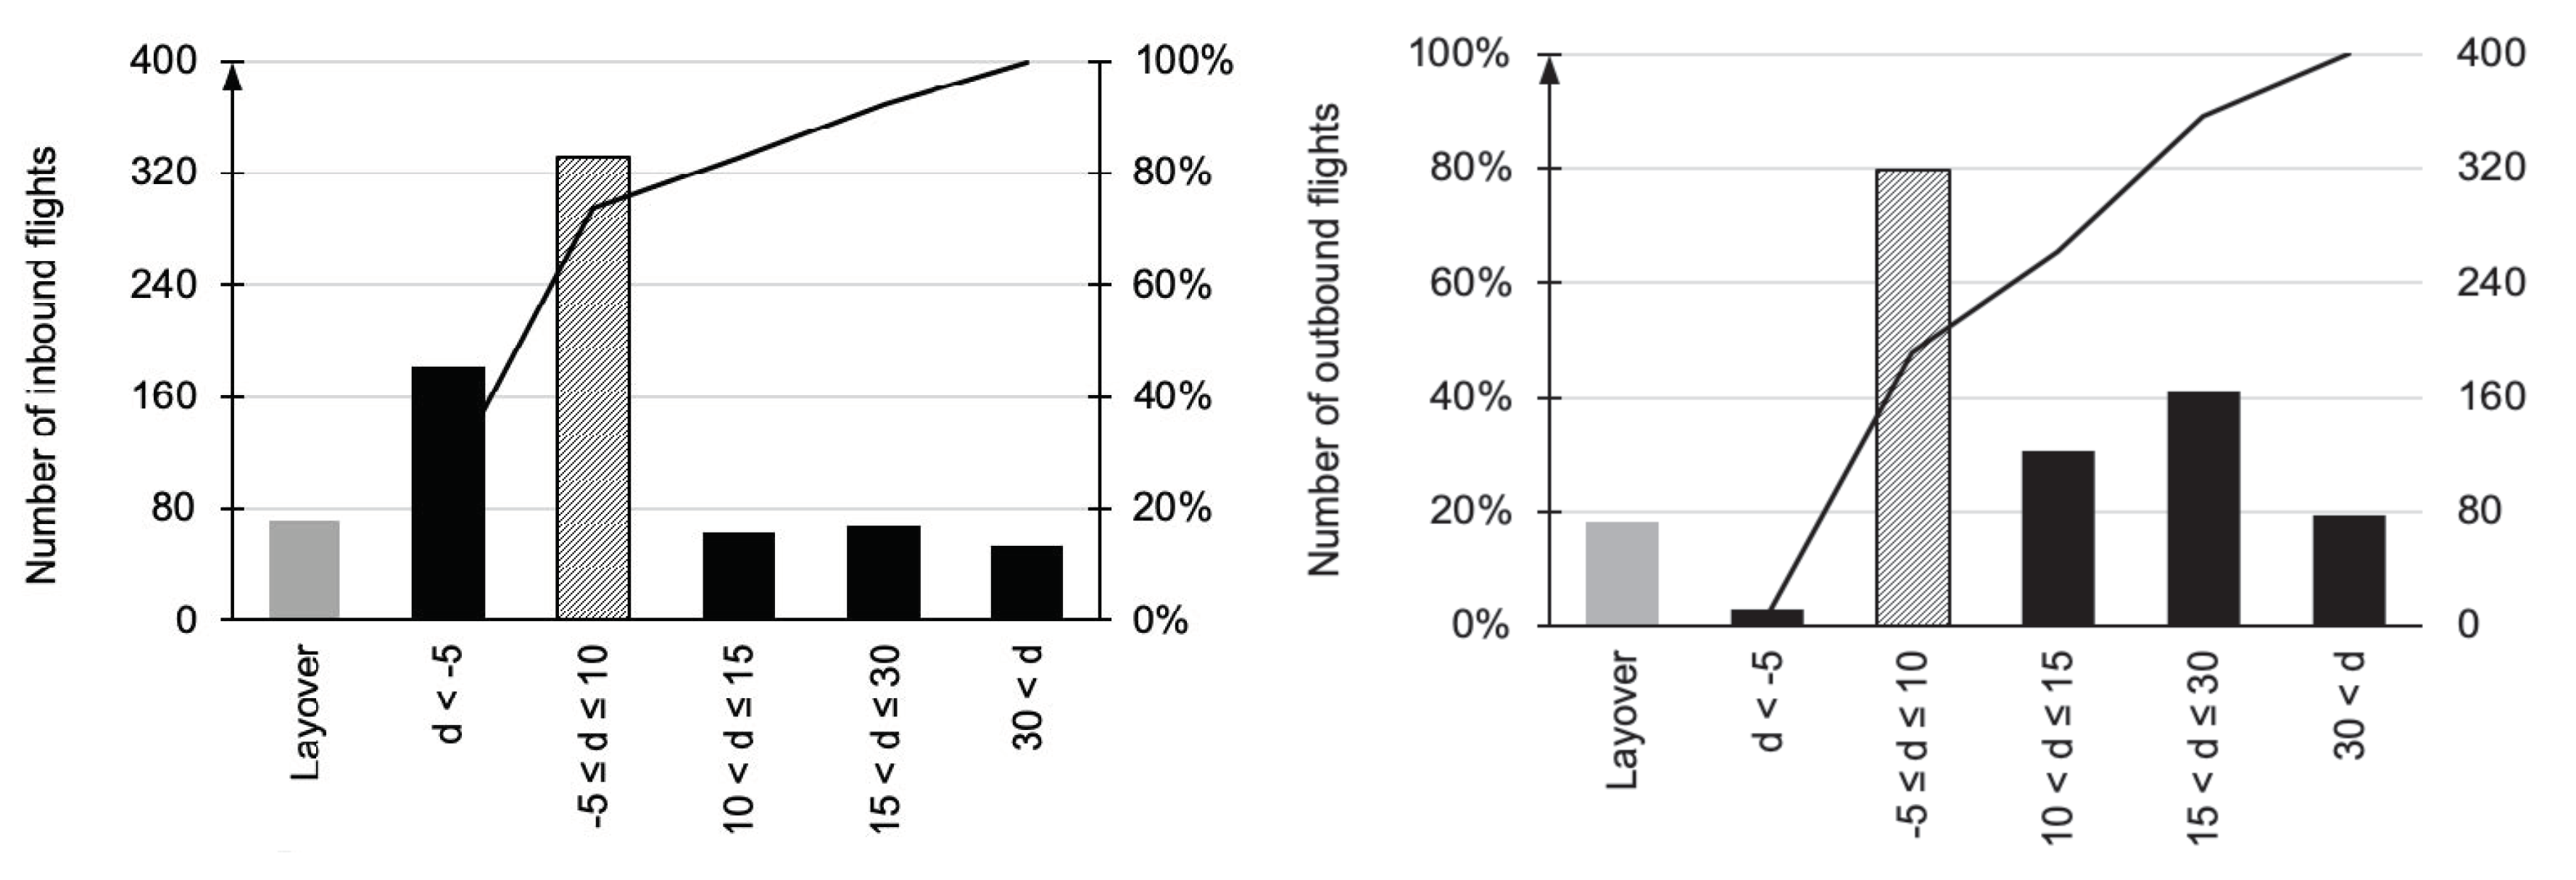
21]. The analyzed rotation plan of Frankfurt Airport showed that 81% of the delayed flights exceeded their scheduled TAT. Nevertheless, reducing the TAT to a minimum TAT is an acknowledged compensatory strategy [
19]. Aircraft-type specific minimum TATs are defined in the airplane characteristics for airport planning, e.g., [
52]. It is assumed, that minimum TAT can be reached by using increased personnel and planning resources for the ground manager. Salaries of personal resources are defined in the staff hourly rates of each airport [
48]. For the ground manager, an additional EUR 50 are assumed in the low and base scenario, and EUR 100 are allocated for the high scenario. Furthermore, a standard processing fee for a fast turnaround of EUR 100 is allocated. In the low scenario, one additional cleaning and one loading staff member and one loadmaster are assumed for narrowbodies, two cleaning and loading staff members, and one loadmaster for widebodies are allocated. In the base scenario, the cleaning staff members are doubled and in the high scenario cleaning and loading staff members are doubled.
In summary, the costs for depend on the scenario (low, base, high), the aircraft size (widebody, narrowbody) and on the salary of the cleaning and catering staff. The number of delay minutes that can be reduced is limited depending on the aircraft. Note, the success of this strategy depend neither on the number of connective passengers nor on the amount of reactionary delay.
This compensation strategy cannot be applied to aircraft with overnight stays at the airport and to aircraft with an increased TAT of more than 45 min, because those aircraft are assumed to have a different problem than personnel shortages (e.g., unexpected maintenance). The reduction to a minimum TAT reduces the reactionary delay costs but causes higher personnel costs.
5.2. Increasing Aircraft Cruising Speed ()
Usually, with the first notice to airmen (NOTAM) after take-off, the crew receives information about the latest time on position to guarantee that each passenger onboard will reach the booked connection flight. This NOTAM contains a priority list (in terms of passenger soft costs) of passengers and their connecting flight and provides the opportunity to adjust the aircraft speed (more precisely, the cost index as ratio of time costs and fuel costs ((USD/minute) (USD/kg fuel)
) for Airbus and ((USD/min) (USD/lb fuel)
) for Boeing) in case of very sensitive passenger connections. Although the aircraft performance envelopes during the cruise are limited, on long-haul flights the aircraft can save up to 50 min of flight time [
53]. With a regression coefficient of
, flight time savings
S (min) depending on the great circle distance
d (km) between departure and destination, provided by [
53], can be linearly approximated by
The increased fuel flow
per jet engine (kg) due to the increased cruising speed can be approximated as a function of
SEquation (
21) has been derived from values provided by [
53] with a regression coefficient of
. Because of expected technological improvements, we decreased the additional fuel flow for the aircraft types A359, B788, and B789 by 10%. Additionally, to the amount of increased fuel costs (
Section 4.1), we calculated increased
costs (compare
Section 4.2) for the additionally burned fuel. These additional costs must be weighed against the reduced reactionary delay costs.
Note, we ignore that the increased amount of fuel must have been tanked before take-off. From this follows, that in operations the cruising speed may not be increased during the whole cruising phase. Furthermore, the performance limits of modern aircraft severely limit the speed of cruising flight between the stall speed for lift generation and the maximum Mach number [
54]. Often, the recommended cruising speed is already close to the upper limit of the maximum Mach number. Increased fuel costs and engine loads are cost-driving negative effects that make this measure only recommendable for extremely sensitive transfer passengers.
In summary, the costs for depend on the aircraft type and on the fuel price which is a function of the scenario. The number of delay minutes that can be reduced depends on the distance between departure and destination and on the potential of the aircraft to increase cruising speed. Note, the success of this strategy depend neither on the number of connective passengers nor on the amount of reactionary delay.
5.3. Rebooking of Passengers ()
Passenger compensation claims will be reduced by rebooking the transfer passengers if an alternative connection to the destination is available. In this context, co-operations, especially strategic alliances with other airlines, represent an enormous competitive advantage.
Table 3 lists preferences (with increasing costs) when determining the substitute transport to be booked.
Compensation costs for rebooking passengers are defined as the difference between the original ticket price and the expected price of the passenger’s new ticket on the one hand, and a flat rate per passenger on the other. To determine the expected additional ticket costs, the average ticket price for flights from a German airport is used [
55] and this is defined as the price for the base scenario. We distinguish between destinations in Germany, Europe, and other continents than Europe. For the low and high-cost scenario, this ticket price is reduced (low scenario) and increased (high scenario) by 50%, respectively.
A multiplier
M on the ticket price is used to consider the cooperation between the airline and the new provider (see
Table 3 for details). Based on the calculated seat load factor (Equation (
1)) of the selected connecting flight and the calculated number of connecting passengers (see
Section 3.4) it is assumed that the connecting flight can be fully loaded with connecting passengers. The resulting ticket prices for rebooking passengers are listed in
Table 4.
In summary, the costs for
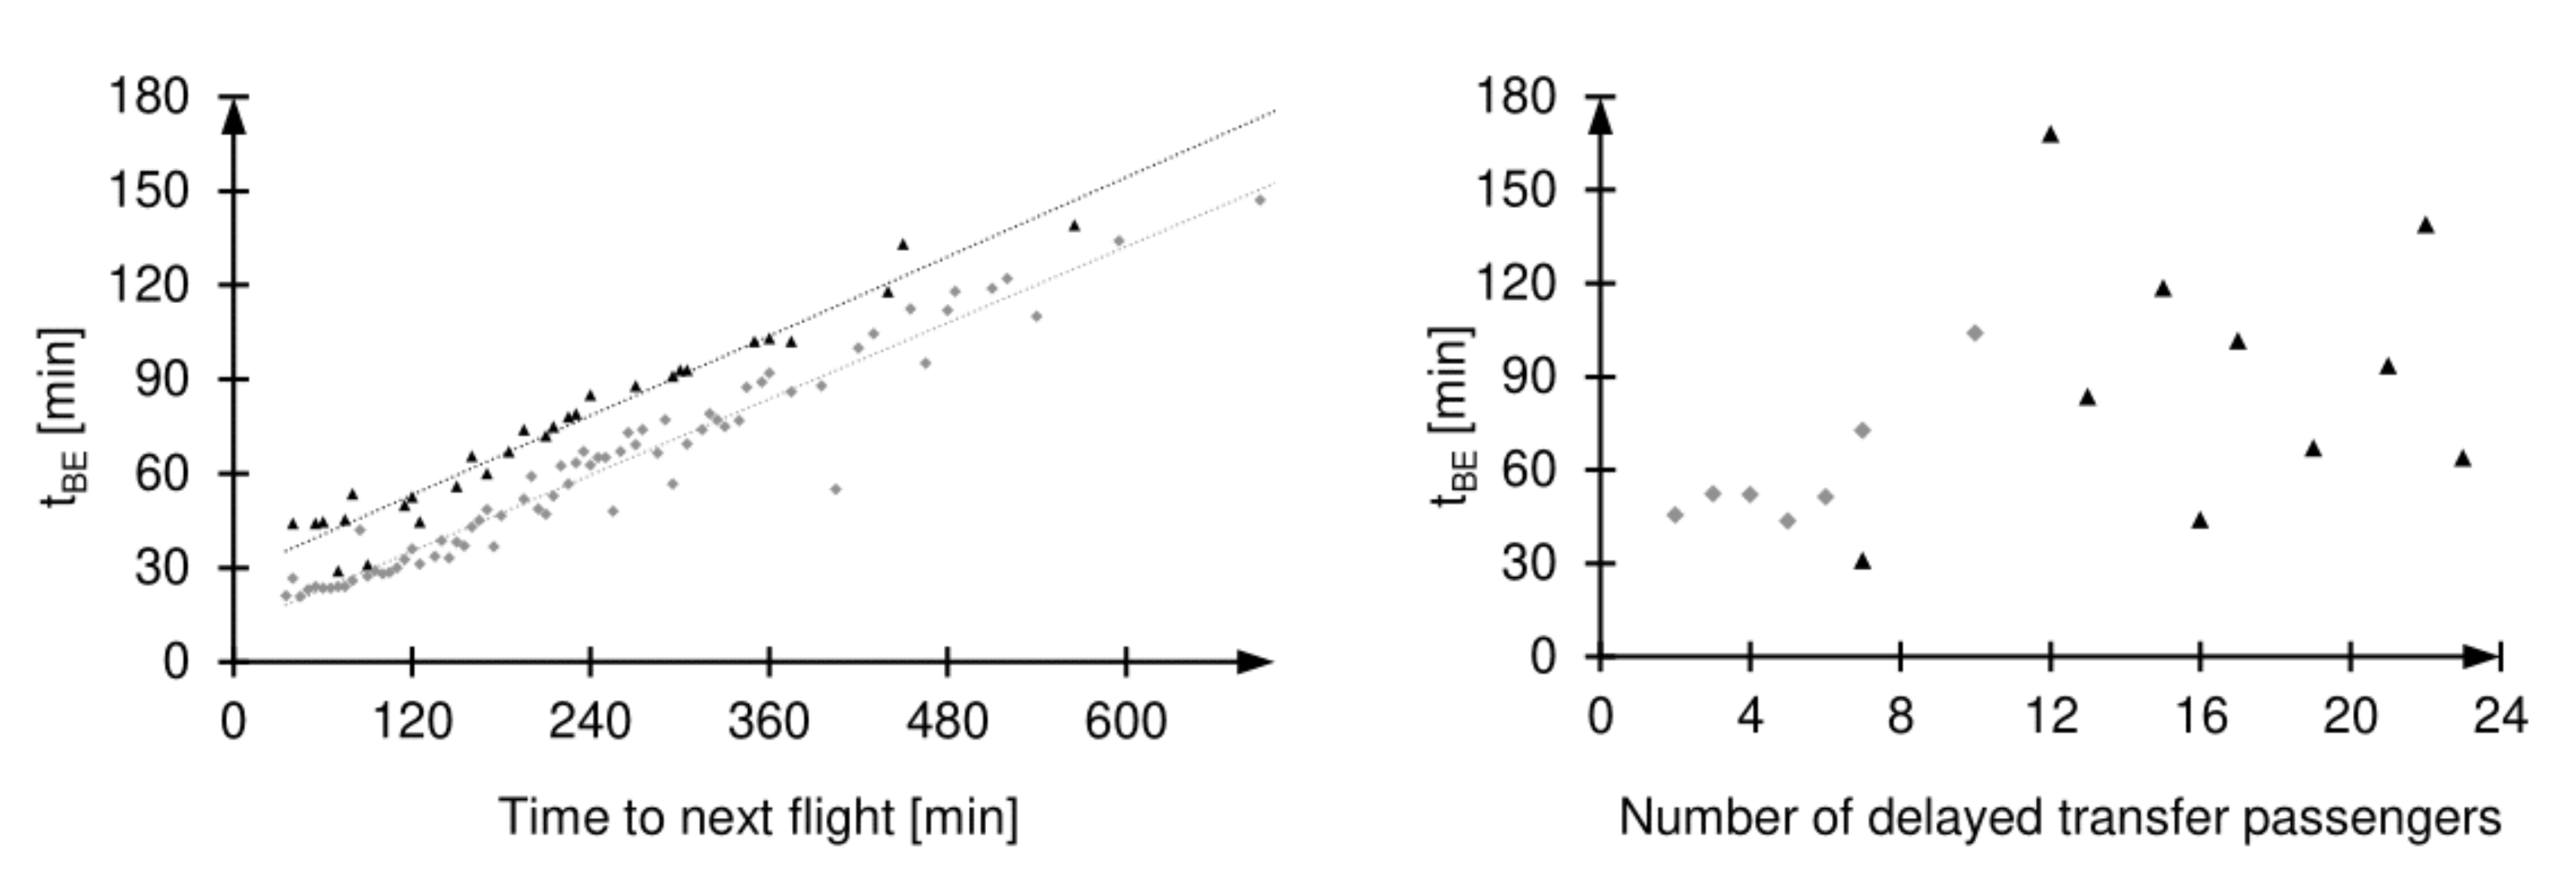
depend on the scenario (low, base, high), the number and destinations of delayed passengers (i.e., the aircraft size), the number and connectivity of alternative connections and on the cooperation of the airline with other airlines. Therewith, the number of delay minutes cannot be reduced and the success of this strategy depends significantly on the number of connective passengers and on the amount of reactionary delay. For example, for a B763 aircraft from Rom-Fiumicino (LIRF) to Frankfurt (EDDF) with a delay of
with 209 passengers on board (in the high scenario), we assumed 20 passengers on board, who miss their connecting flights. According to the airport statistics of Frankfurt Airport [
48],
%,
%,
% of the connections are going to German, European and intercontinental destinations, respectively. In this example, three of three passengers could be rebooked within Germany to Köln/Bonn EDDK for a ticket price of EUR 240 per passenger. In total, 8 out of 12 passengers could be rebooked within Europe to Reykjavík BIRK for a ticket price of EUR 217 and one out of five passengers could be rebooked to another intercontinental flight to Sydney Airport YSSY for a ticket price of EUR 787.5.
5.4. Delay of Connecting Flights ()
Although time buffers are considered in airline networks (especially of network carriers) missed connections of individual passengers cause high costs for compensation and rebooking (). This can be avoided by making the connecting flight wait for the passenger and thus accepting a delay itself. It is examined up to which delay the waiting for passengers is economically reasonable and from when on passengers should be rebooked on the next possible flight. Thereby, the actual off-block time of the connecting flight is considered and a possible delay of the connecting flight is added to the actual off-block time. Passengers who do not miss their connecting flight because the connecting flight is already delayed will not be considered. Only passengers who miss their connecting flight according to the rotation schedule are considered in this strategy.
The number of delayed transfer passengers depending on the business model and scenario is listed in
Table 1. The allocation of alternative connecting flights is described in
Section 3.4. The expected primary and reactionary delay costs for the connecting flight are derived in
Section 4.
In summary, the costs for depend on the scenario (low, base, high) the number and destinations of delayed passengers (i.e., the aircraft size), the number and connectivity of alternative connections, and on the number of aircraft whose departure is delayed. With this strategy, the number of delay minutes cannot be reduced. Therewith, the success of this strategy depends significantly on the number of connective passengers and on the amount of reactionary delay.
The strategy might be efficient in case of a significant number of transfer passengers in an aircraft with a primary delay, which causes a delay of the corresponding connecting flight since otherwise the compensation costs incurred (e.g., additional overnight costs) burden the cost balance disproportionately and significantly reduce passenger comfort. In this case, the flight dispatcher carefully weighs up the delay of the planned connecting flight. If no further reactionary delay costs are to be expected due to the delay of the connecting flight, this strategy is recommended.
5.5. Flight Cancellation ()
The greater the delay of a flight, the higher the delay costs incurred by an airline. At a critical delay level, the cancellation of a flight will be more economical than the delayed execution of this flight. For this reason, it is being examined at which delay level, the reactionary costs of delay exceed the costs of cancellation. The costs of canceling a flight on the day of its planned execution include the legally prescribed compensation and support services by Regulation (EC) No. 261/2004 (hard costs) and the lost future revenue (soft costs) (see
Section 4.4). Besides, the lost revenue due to the canceled flight itself is taken into account, which includes the revenue from the sale of the flight tickets and the revenue from in-flight sales. The costs for delivery of baggage to the passenger’s destination address are also included. This is offset by savings on the operational side. The costs for kerosene (
Section 4.1), charges for the use of airport infrastructure and certain airways, maintenance costs (
Section 4.3), and handling costs (
Section 5.1) at the destination airport are eliminated [
56]. The costs for flight cancellation depend on the business model, the aircraft size, and the number of booked seats and are taken from [
56]. The costs range from EUR 97 for a low-cost carrier seat in a narrowbody up to EUR 314 per seat in a half-loaded widebody of a network carrier.
In summary, the costs for depend on the scenario (low, base, high) the number and destinations of connective passengers (i.e., the aircraft size) and the number and connectivity of alternative connections. The number of delay minutes cannot be reduced. Therewith, the success of this strategy depends significantly on the number of connective passengers and on the amount of reactionary delay.
6. Performance Indicators for the Assessment of a Compensation Strategy
As pointed out in
Section 5, five options to reduce reactionary delay costs are associated with a specific delayed flight. It was also pointed out, that the deployment of a compensation strategy induces costs. In an optimization problem, the difference between the reactionary delay cost reductions and the compensation costs for each flight will be minimized.
However, the benefit of the countermeasure depends on the time when they are applied. The benefit of a compensation strategy changes with ongoing time. With the help of the previously outlined cost estimation model, we can quantify the benefits of the different strategies for different situations. For each compensation strategy , we compare the observed costs from the reference scenario without any compensatory measurements with the costs that are observed if we apply .
We start with the evaluation of each individual relevant flight f and for each of the three cost scenarios and determine flight-specific performance indicators:
Time at which the cost reduction is maximum: (min);
Earliest time from which the compensation strategy is beneficial: (min);
Latest time until the application of strategy is beneficial: (min);
Maximum cost reduction: (EUR).
Since these points in time depend on the amount of the delay, they are only partly suitable for valuation. More meaningful results can be obtained by comparing the respective point in time with the original delay. For this purpose, we define key performance indicators (KPIs), which can be calculated for a specific delay interval between and . The total number of flights with delay within and is .
The
success rate
indicates the percentage of flights in the delay interval
for which the application of the compensation strategy
leads to a reduction of the total delay costs. The number of those flights is referred to as
. In this study, we investigate delay intervals [
with a length of 0.5 min.
The success rate
refers to the performance of a collection of flights for a given compensation strategy. The application of
to all flights within the delay interval
d is shown in
Figure 4,
Figure 5 and
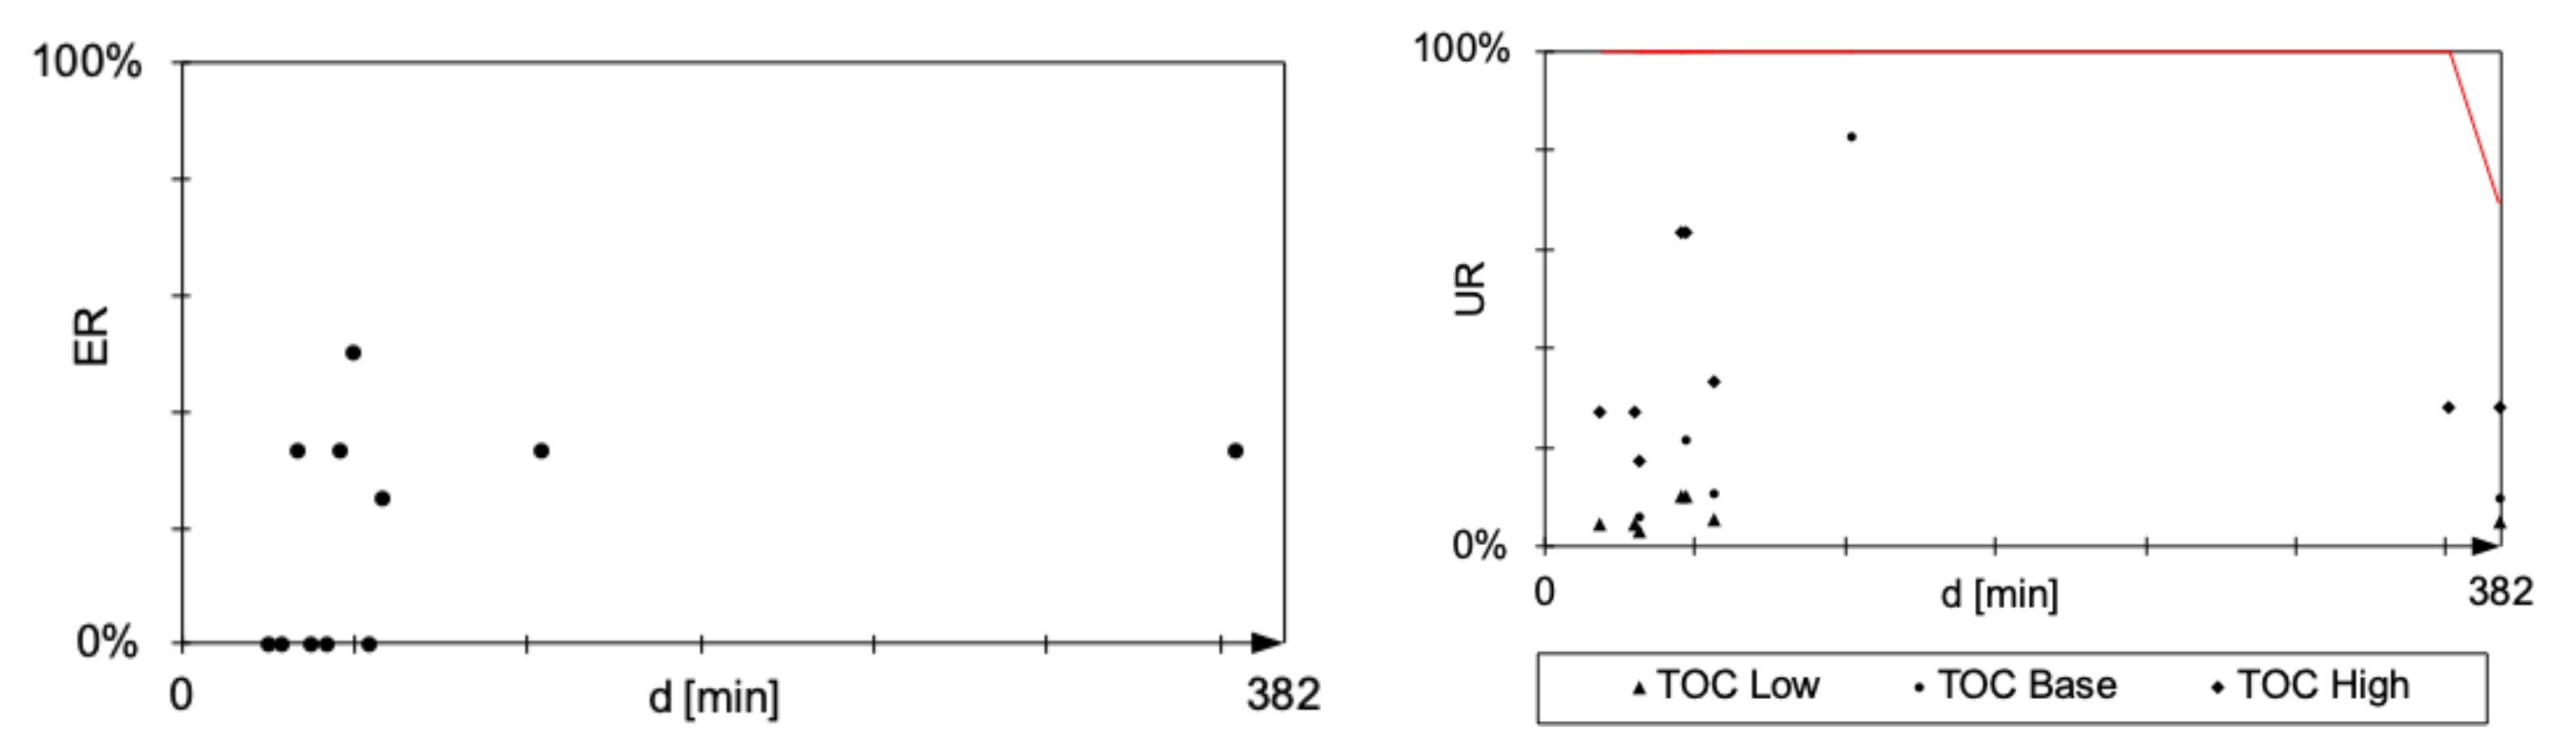
Figure 6. However, it is also necessary to estimate the impacts of applying a certain strategy to an individual flight. For this purpose, we define the following three performance indicators.
The
optimal compensation rate of a flight
indicates the time of the maximum saving
(min) related to the delay
d (min). It is a measure of the extent to which the delay must be compensated to achieve the greatest possible cost reduction. The cost reduction refers to the expected reactionary delay costs in case of non-application of the strategy. To evaluate a single compensation strategy, the mean value of
of all flights in a given delay interval is calculated and shown in
Figure 4 and
Figure 5.
The break-even point (min) indicates the point in time up to which the use of the compensation strategy is economical. In case more delay is compensated, the costs of using the compensation strategy exceed the possible savings in reactionary delay costs. To evaluate a compensation strategy, the mean value of of all flights in a given delay interval is calculated.
The
break-even rate (min)
indicates the point in time
in relation to the delay
d (min) up to which the use of a compensation strategy for a flight is economically. To evaluate the compensation strategy, the mean value of the
of all flights is calculated in a certain delay interval.
In the event that at least a certain number of minutes of delay has to be compensated so that the overall operating expenditure is reduced, the break even rate
will indicate the time
in relation to the delay
d from which the use of the compensation strategy for a flight is worthwhile:
To evaluate the compensation strategy, the mean value of
of all flights in a given delay interval is calculated and shown in
Figure 4.
, , and further depend on the airline business model. For this reason, the assessment of each strategy is done for three scenarios low, base, and high with low, medium and high total operating costs, respectively.
8. Conclusions and Outlook
In this paper, five different delay compensation strategies were analyzed and applied to a rotation schedule of 24 h at Frankfurt Airport, Germany. Therefore, important components of reactionary delay costs provided by [
7] were adapted to other aircraft types, enhanced for carbon dioxide costs, adjusted for inflation of
% between 2014 and 2019, and enhanced by delay costs, covering transfer passenger’s concerns. Subsequently, for each strategy, costs for compensating delays were approximated. Finally, all strategies were applied to all delayed flights in the rotation schedule and the productivity was analyzed depending on the amount of delay of each aircraft.
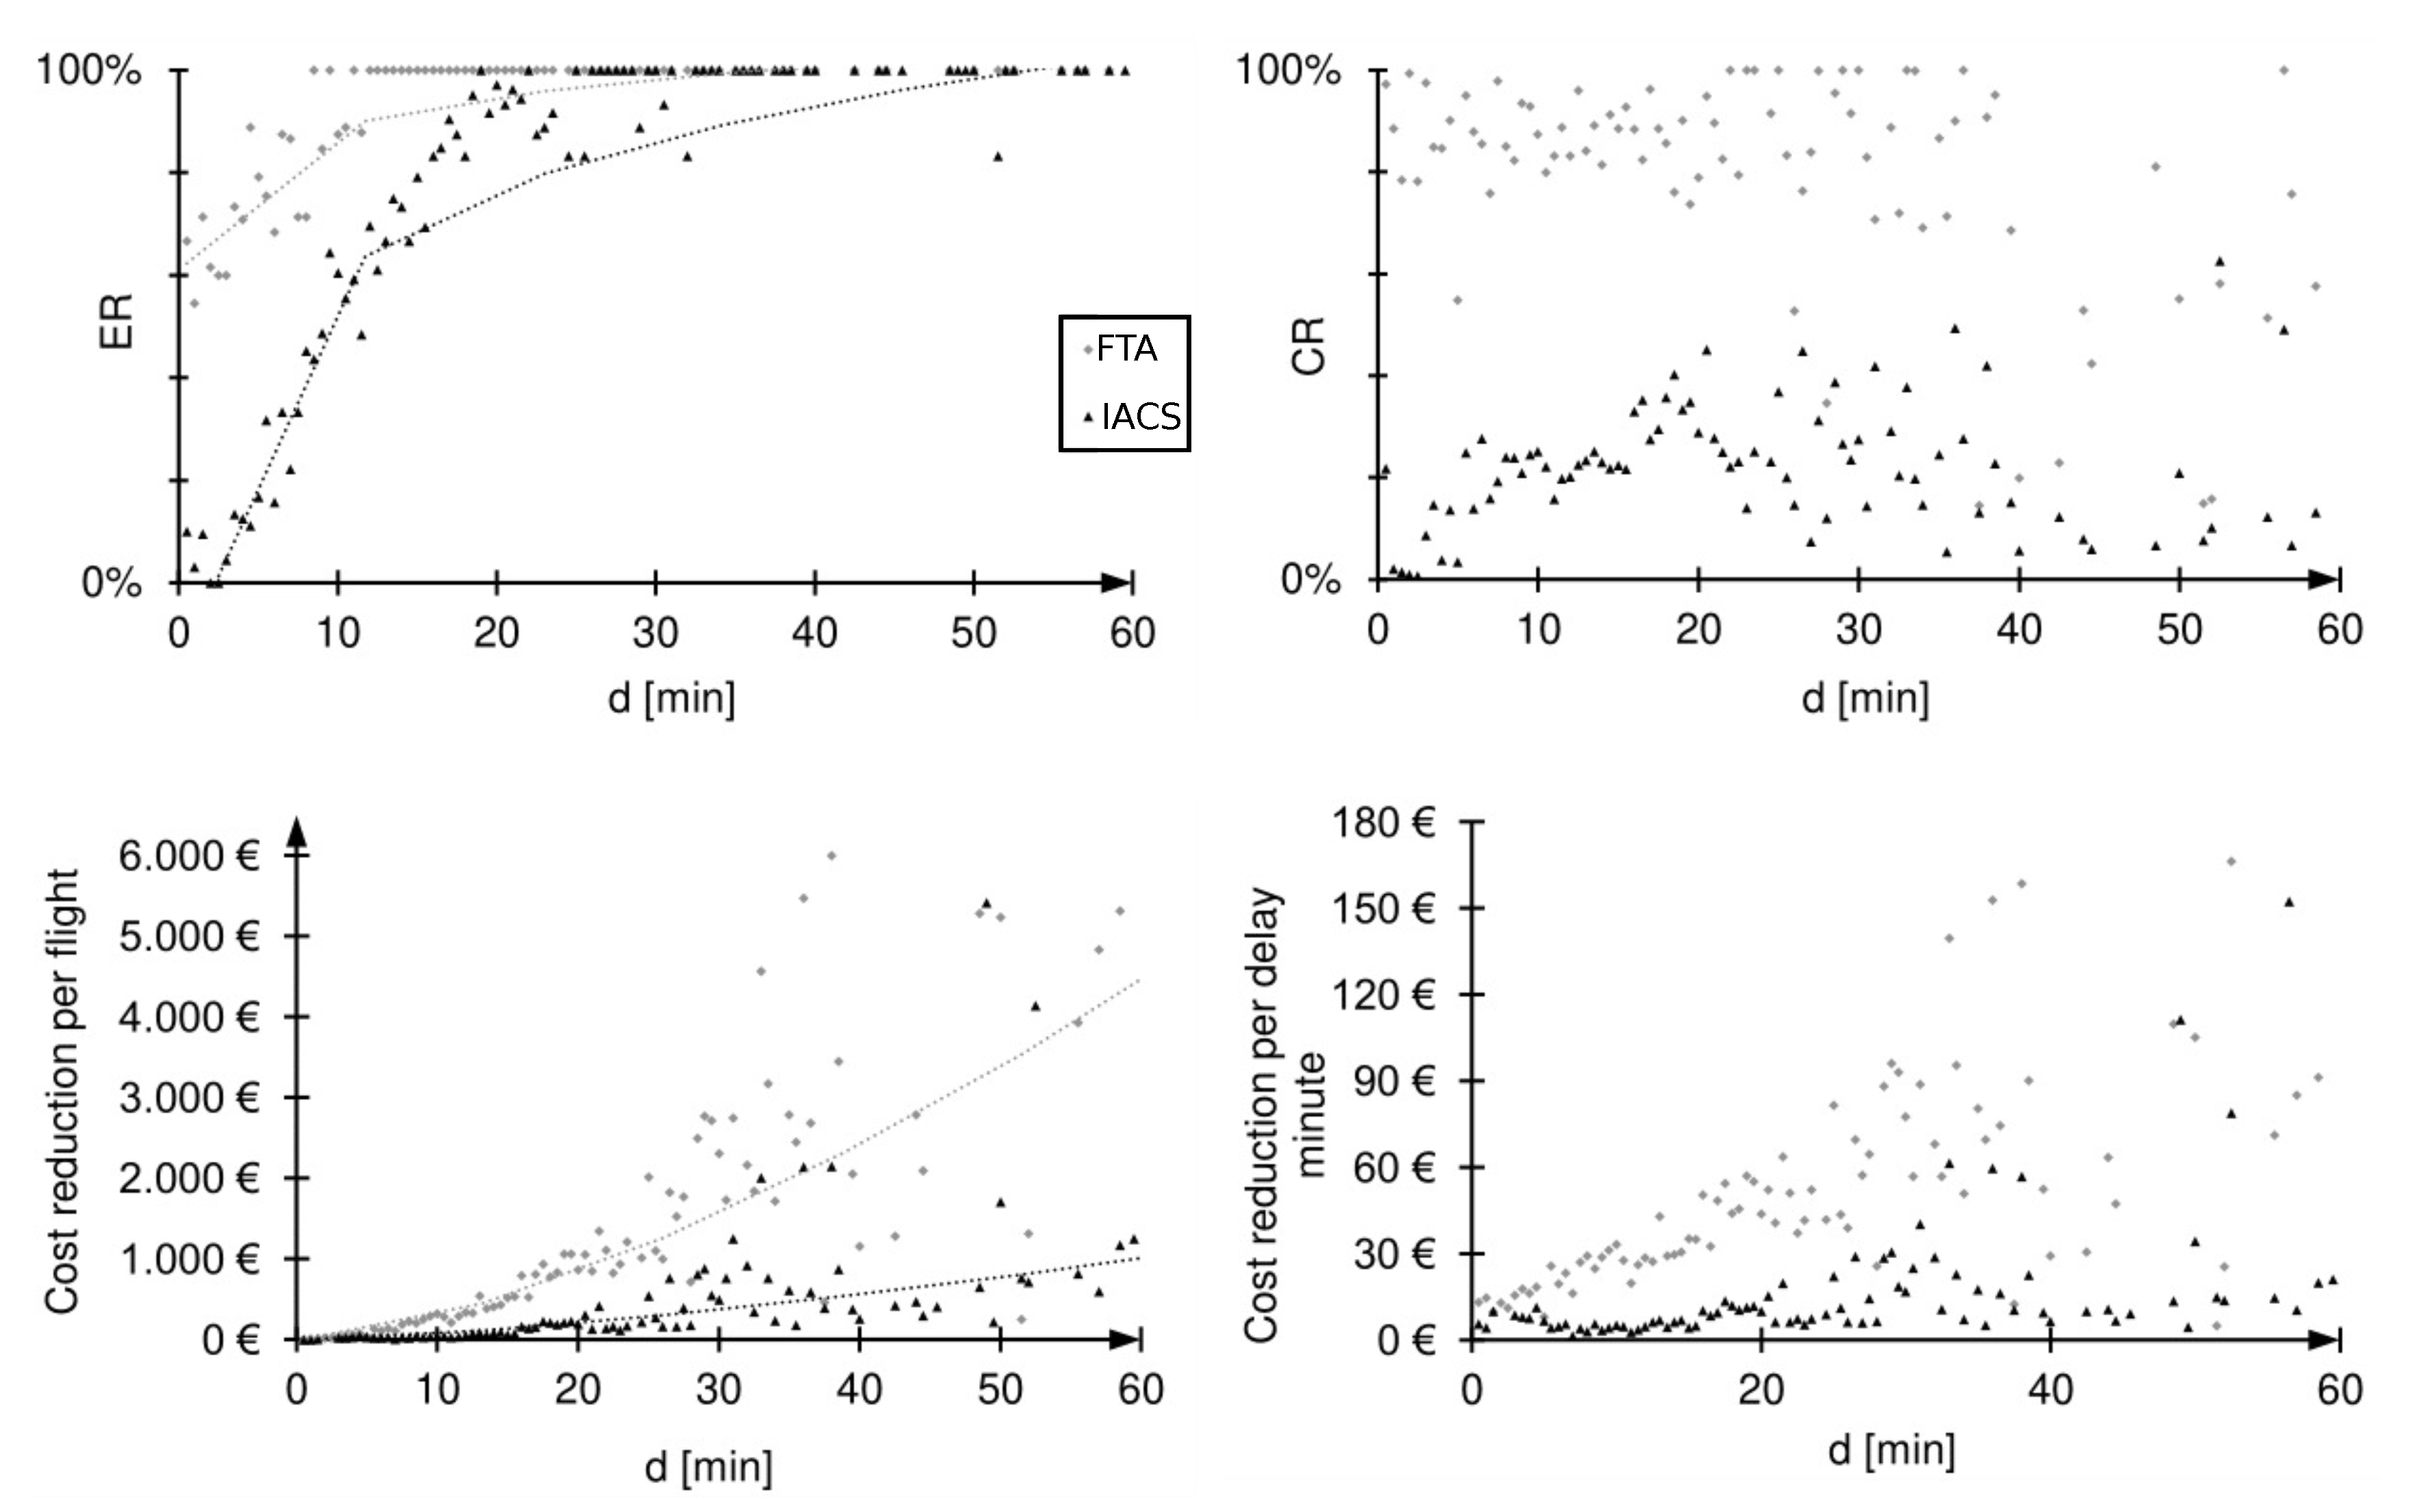
The most promising strategies for reducing reactionary delay costs are fast turnaround
and the speed increase during cruise
. The use of the fast turnaround as a compensation strategy is preferable to the use of speed increase, because of a higher compensation rate
(
Figure 9, top right), i.e., a larger proportion of the original delay can be compensated for with a cost-optimal solution. The reason for this may be, on the one hand, the lack of a data basis for modeling the strategy fast turnaround. On the other hand, this may be because with
the delay can already be compensated before departure. Thus, the flight in question could start on time, compensation for the delay during the flight would no longer be necessary, and reactionary delay costs for this flight would not be incurred. By using the fast turnaround strategy, the reactionary delay costs incurred by an airline can be reduced more than with increased speed (
Figure 9, bottom). Both when considering
per flight and delay minute, the maximum cost reduction
is higher on average for the fast turnaround.
The inclusion of individual transfer passengers in the delay cost balance of an airline involves the uncertainty of the number of these passengers if the method is to be implemented in a trajectory optimization. The high sensitivity of this number is reflected in the efficiency of the strategies , and . The assumptions made in this study regarding the number and destination of individual transfer passengers were specially adapted to the statistics of Frankfurt Airport. Number and destination vary for each airport and airline business model. It must be emphasized that not only the function of the airport in the network (i.e., hub or spoke), but also the connections to tourist and business destinations, intermodal connectivity (public transport connections), as well as the number and type of airlines operating at the airport have an impact on the efficiency of the , and strategies. In addition, the efficiency of the strategies is strongly dependent on the frequency of air connections to a given destination. These conditions are defined in the flight plan, which is used as an example in this study. This means that the results of this study cannot simply be transferred to other airports or flight plans. The example of Frankfurt Airport was chosen because of its high number of transfer passengers and its good connectivity to give the strategies many possibilities. Despite the high number of transfer passengers and the good connectivity, the example of Frankfurt Airport provides a higher efficiency of non-passenger dependent strategies to compensate for delay costs
In the next step, the calculation rule for the costs of each compensation strategy and the different cost components of delay costs are going to be implemented in the multi-criteria aircraft trajectory optimization tool TOMATO [
16,
57] of TU Dresden. Therewith, delay costs will be considered as weighting functions in trajectory optimization and will act as decision support, when balancing environmentally-driven detours (e.g., around condensation trail sensitive areas) and cost-index-driven speed adjustments. This coupling has already been initiated in [
19], but with strongly approximated delay costs. With the new approach, costs for additional fuel burn will be calculated precisely and not approximated, as done in this study. Note, in this study, the numbers, destinations, and costs of connecting passengers are restricted to Frankfurt Airport in 2019. Unfortunately, the assumptions cannot be taken over to an arbitrary airport with different connectivity. From this follows, before implementing the approach in TOMATO, assumptions have to be made to deal with this problem.


