Article

Assessment of Aircraft Surface Heat Exchanger Potential

by
Hagen Kellermann
*,
Anaïs Luisa Habermann
and
Mirko Hornung
Bauhaus Luftfahrt e.V., Willy-Messerschmitt Straße 1, 82024 Taufkirchen, Germany
*
Author to whom correspondence should be addressed.
Aerospace 2020, 7(1), 1; https://doi.org/10.3390/aerospace7010001
Submission received: 20 November 2019 / Revised: 9 December 2019 / Accepted: 12 December 2019 / Published: 19 December 2019
(This article belongs to the Special Issue 9th EASN International Conference on Innovation in Aviation & Space)

Abstract

:
Providing sufficient cooling power for an aircraft will become increasingly challenging with the introduction of (hybrid-) electric propulsion. To avoid excessive drag from heat exchangers, the heat sink potential of the aircraft surface is evaluated in this study. Semi-empirical correlations are used to estimate aircraft surface area and heat transfer. The impact of surface heating on aircraft drag is qualitatively assessed. Locating surface heat exchangers where fully turbulent flow is present promises a decrease in aircraft drag. Surface cooling potential is investigated over a range from small regional aircraft to large wide body jets and a range of surface temperatures. Four mission points are considered: Take-off, hot day take-off, climb and cruise. The results show that surface heat exchangers can provide cooling power in the same order of magnitude as the waste heat expected from (hybrid-) electric drive trains for all sizes of considered aircraft. Also, a clear trend favouring smaller aircraft with regards to the ratio of available to required cooling power is visible.

1. Introduction

Research for next generation commercial aircraft is driven by ambitious goals to reduce the aircraft’s environmental impact such as the European Commission’s Strategic Research and Innovation Agenda (SRIA) [1] that targets a 75% reduction in CO 2 emissions by the year 2050 compared to the year 2000. A big contributor to achieve those targets is the propulsion system. Novel propulsion concepts with intercoolers [2], topping cycles [3] or bottoming cycles [4] are currently under investigation to reduce the specific fuel consumption. Another promising approach seems to be a higher electrification of the on-board systems or even the propulsion system. Examples are the more electric aircraft [5] or (hybrid-) electric propulsion systems [6]. Their electric components generate waste heat that needs to be rejected in an efficient way. Many concepts result in higher thermal loads of the systems. Conventional cooling concepts require ram air and heat exchangers, which are placed in the airflow path and thus generate drag [7]. Another option is to use existing aircraft surfaces for heat transfer from the inside of the aircraft to the ambient [8]. These structurally integrated heat exchangers may be beneficial for both weight and drag of the Thermal Management System (TMS) because no additional components such as the ram air heat exchanger are required and no components are installed in the flow path. Additionally, heat rejection to the aircraft’s boundary layer may lead to drag reductions [9]. The aim of this paper is to investigate the heat sink potential of available aircraft surfaces.
Wang et al. present a good overview of the application of surface heat exchangers in aircraft up to the year 1999. In the beginning, the development of surface heat exchangers was driven by the cooling demand of piston engines with increasing power densities. In the 1920ies and 1930ies they were mainly used in racing aircraft. In some aircraft such as the “Supermarine S.6” surface heat exchangers covered surfaces of multiple components such as wings, fuselage and floats. In military aircraft, leading edge steam radiators were successfully tested. However, despite the proven thermodynamic performance the technology was not put into practical applications due to hazards such as machine gun fire. When gas turbines started to replace piston engines in aircraft, the engine cooling problem vanished and with it surface heat exchangers. However, academic research on surface heating continued. The results indicate that heating aircraft surfaces might not only serve for heat dissipation but also as means of boundary layer control. It is commonly agreed that heat addition to a laminar boundary layer increases instabilities and therefore may lead to an earlier transition, thus increasing drag [8].
More recent studies showed a growing interest in surface heat exchangers again due to the increased cooling demand from the aforementioned technologies. Especially new engine concepts such as Ultra High Bypass Ratio Turbofans and open rotors with very compact gas generators and mechanical transmission have increased oil heat loads. Sousa et al. investigated a surface cooler with fins inside a turbo fan engine bypass as air cooled oil cooler (ACOC). Numerical calculations in combination with experiments were conducted. They showed that the surface cooler was capable of rejecting 76 % of the take-off oil heat load [10]. Surface air cooled oil coolers (SACOC) are investigated by multiple EU-funded projects such as SHEFAE [11], SHEFAE 2 [12] and SACOC [13]. Sakuma et al. carried out investigations of the effects of varying SACOC geometries in the context of SHEFAE 2. They found that two 200 mm long heat exchangers could reject the same heat as one 900 mm long one while maintaining the same pressure drop allowing for area and weight optimization of the SACOC [14].
Recently, Liu et al. conducted numerical studies to describe pressure loss and heat transfer of different aircraft surface heat exchanger fin configurations including continuous, segmented and staggered fins. They found the continuous configuration to have the most advantageous heat transfer to pressure drop ratio [15]. Part of the wing surfaces were used for heat dissipation of a hybrid electric aircraft with a TMS utilizing fuel as working fluid. The results showed that steady state cooling of the electric propulsion system is possible in most operating points, however the aircraft only had 20 % hybridization [16].
While there is a good amount of literature on surface coolers in aircraft applications, most investigate research questions tailored to one specific engine or aircraft or try to optimize the surface heat exchanger geometry. In contrast, this study aims to generally predict the thermodynamic potential of the aircraft surface for a range of differently sized aircraft. The goal is to quickly assess the feasibility of using a TMS with surface heat exchangers for a hybrid electric configuration.
For that purpose, a thermodynamic model of a surface heat exchanger covering existing aircraft surfaces is developed. A scalable geometric model of a tube and wing type aircraft with podded engines is derived with a semi-empirical approach. It is used to analyse the impact of aircraft size and available portions of the total surface area on the potential cooling power. Various sensitivities of the model including surface temperature, incoming radiation and component geometries are considered. In addition, drag increments resulting from non-adiabatic boundary layers are assessed.
The ambient conditions differ at each operating point. The study evaluates steady state heat transfer performance in pre-defined sets of Mach number ( M a ), altitude ( a l t ) and ISA temperature deviation ( d T I S A ). They reflect typical operating conditions of commercial aircraft namely Take-Off (TO), Hot Day Take-Off (HTO), Climb (CL) and Cruise (CR), which are relevant sizing points for the TMS. The quantification of the potential of the aircraft’s skin as heat sink can be used by future projects on advanced propulsion concepts to account for the total amount or a fraction of the system’s waste heat removal.

2. Aircraft Correlations

The study aims to estimate the surface heat sink potential of a range of aircraft covering most of the commercial aviation market. Therefore, data for aircraft ranging from small regional aircraft up to large wide body jets are used as basis for the correlations. Besides correlations for the wetted surface area ( A w e t ), the data is analysed with regard to propulsive power as it will be an indicator for the size of future hybrid electric power trains and thus the expected required cooling power ( Q r q ). Most data are obtained from Reference [17]. They provide aircraft data up to the year 2000 for aircraft from different manufactures including Airbus, Boeing, Fokker and Bombardier. Additional data especially for newer aircraft are extracted from documents provided by the manufacturers [18,19].

2.1. Aircraft Component Geometries

A w e t of the aircraft consists of the surface areas of multiple components. This study is strictly limited to the tube and wing aircraft configuration and thus the components considered as possible locations for surface heat exchangers are:
  • Fuselage
  • Wing
  • Nacelles
  • Horizontal tail
  • Vertical tail
For wing, horizontal and vertical tail the data at hand contains the exposed area ( A e x p ) that is, for a wing the area given is the base area outside the fuselage. In a first order approximation, A e x p is doubled to calculate A w e t . More accurate semi-empirical methods to calculate the wetted area of bodies with an airfoil cross section for example in Reference [20] exist, however, for an initial potential assessment, it seems more reasonable to choose the simplest method possible. For the fuselage and nacelles, A w e t is also not directly available. Instead, length and diameter (in case of the nacelle the maximum diameter) are included. A w e t of these components is estimated by using the geometric model of a cylinder. This approach overestimates the area for the nacelles, because a cylinder with the nacelle length and the maximum diameter as constant diameter has a larger A w e t than the actual nacelle with a variable diameter. For the fuselage, the overestimation of the lateral surface area is reduced by the fact that an open cylinder model is used but the fuselage is actually a closed body. For a quick estimation of the order of magnitude of the error from these geometric simplifications, a point validation is conducted using available data from an A320 sized aircraft model [21]. Table 1 shows the comparison between the simplified A w e t ( A s i m ) and the actual A w e t ( A a c t ) as well as the relative deviation of A s i m from A a c t :
The deviation for the total A w e t is less than 10%. For each component, the expected direction of deviation is confirmed that is, for fuselage and nacelles the simplifications lead to an overestimation of A w e t whereas for all the other components the methods underestimate A w e t . The largest deviation is present for the fuselage with 15.8%. Overall, the deviations are considered acceptable for the scope of this study, because the aim is to find basic correlations among a wide range of aircraft rather than developing precise calculation methods for one specific aircraft.

2.2. Surface Area Correlations

Four possible aircraft design parameters are identified as potential variables to correlate with the total wetted surface area:
  • Maximum Take-Off Weight ( M T O W )
  • Maximum number of seats ( n m a x )
  • Maximum payload ( M P L )
  • Design range ( R d e s )
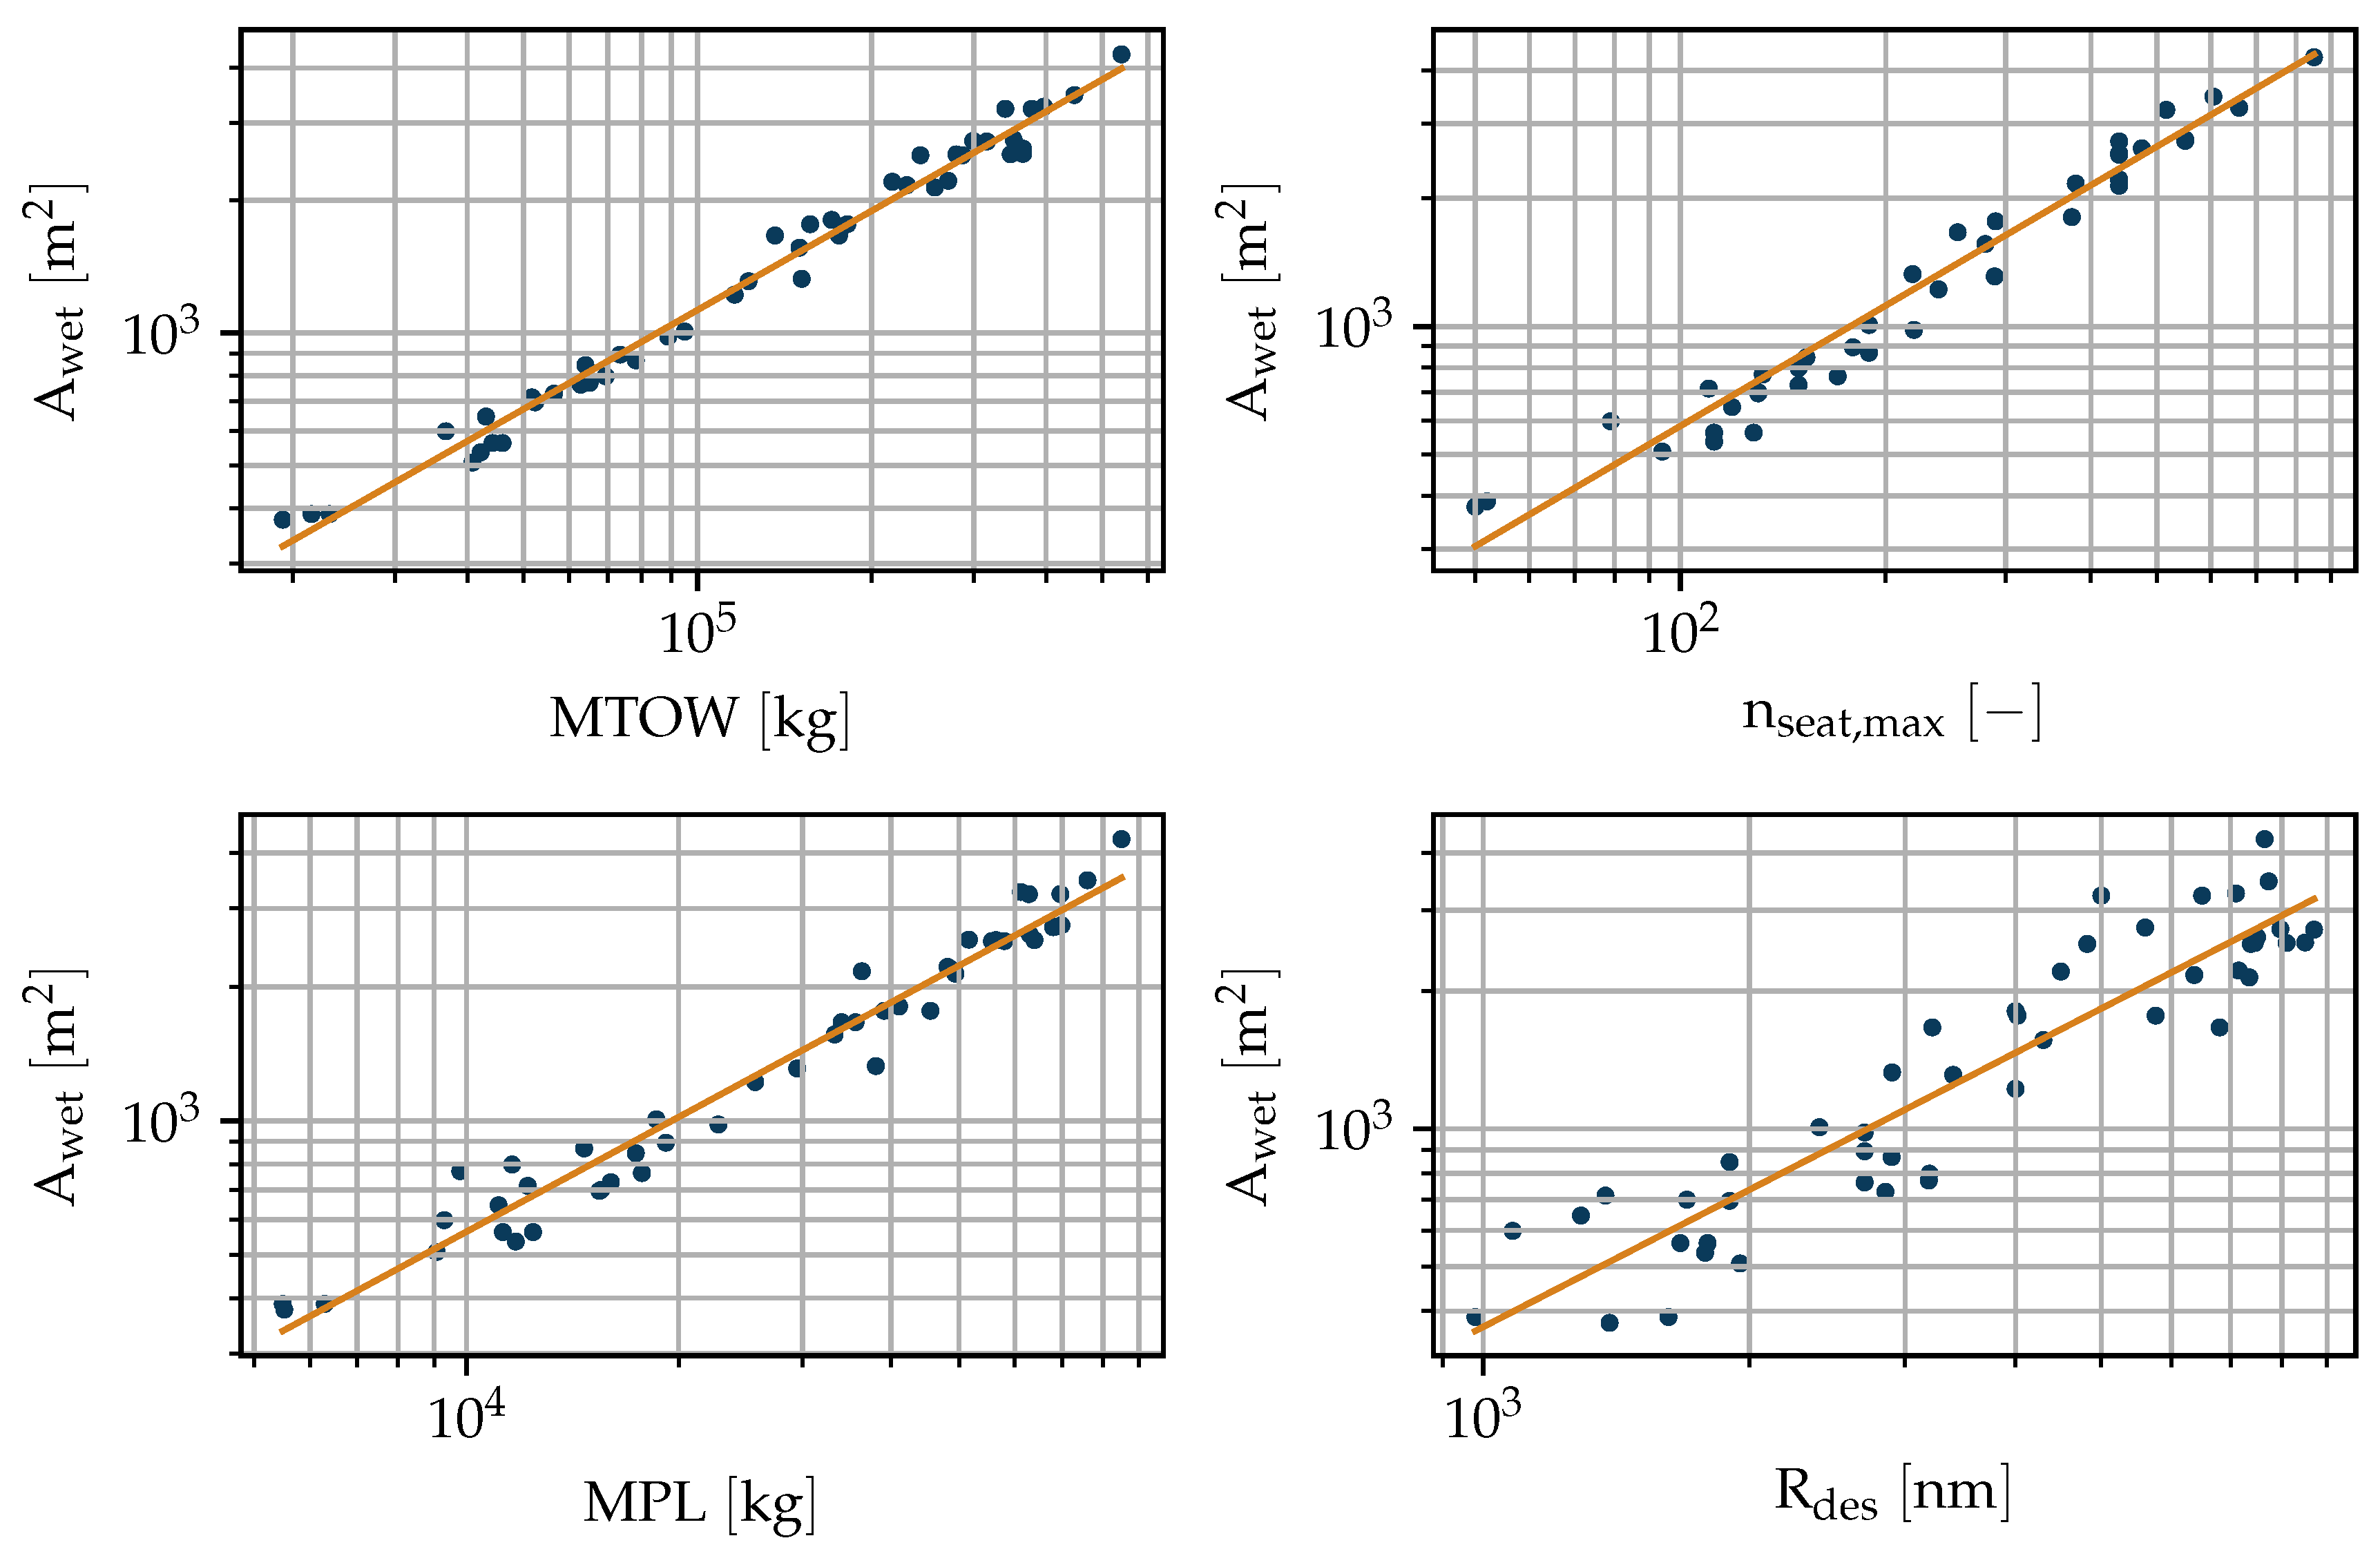
All four are defined in the conceptual design stage of an aircraft and affect the overall aircraft design. For all four variables, correlations with A w e t are found using least squares polynomial fits. To assess the quality of each fit, the coefficient of determination ( r 2 ) is used. The best fits that is, the ones with the highest r 2 value for all four variables are linear fits of the log-log scaled data and are shown in Figure 1. The corresponding fits are summarized in Equation (1) with the coefficients given in Table 2.
l o g 10 A w e t = a · l o g 10 x + c
The correlation of A w e t with R d e s has a higher variance than the other three. A w e t correlates very well with M T O W , M P L and n m a x ( r 2 > 0.95 ). For this study, the M T O W correlation is chosen because it has the highest r 2 value and M T O W is the most general and robust aircraft parameter to compare against. It could also be used for retro fitted cargo aircraft, which is not possible for n m a x . However, the other correlations might be useful for a first A w e t assessment prior to the M T O W calculation in the conceptual design phase. The correlations are limited to their source data that is, they may not be used outside the range of the source data. They may be used for future aircraft that is, hybrid electric aircraft if no significant change in the respective correlation is expected due to for example technology changes. From the heat transfer modelling (cf. Section 3) it becomes apparent that solely knowing the total wetted area of the aircraft ( A w e t , t o t ) is not sufficient even for the simple correlations that are used in this study. The distribution of A w e t , t o t among the component groups mentioned in Section 2.1 is investigated. No correlation is found with any of the x-parameters from Table 2. The share of each component of A w e t , t o t ( A w e t , i ) is rather constant. Therefore, a mean is applied and the results are listed together with the standard deviation ( σ ) for each mean in Table 3.

2.3. Propulsive Power

To put the available cooling power ( Q a v ) in perspective with the required cooling power ( Q r q ) an estimation of the expected waste heat is necessary. The quantity of waste heat of a future propulsion system will depend on many factors, especially the propulsive power ( P p r o p ), the transmission efficiency ( η t r a n s ), which includes all losses from shaft power ( P s h a f t ) to P p r o p , the Degree of Power Hybridization ( H P ) [22] of the drive train and the overall electric efficiency ( η e c ). Calculation of the exact heat loads over the entire mission are part of a detailed iterative design process. For a first estimation, simple methods are applied to estimate the waste heat during take-off, which is likely to be one of the most critical mission points with regards to cooling requirements. Starting from the take-off thrust ( F T O ), which is available in the data set, Q r q is derived:
Q r q = ( 1 η t r a n s ) · P p r o p · H P · ( 1 η e c )
with P p r o p as:
P p r o p = F T O · v T O
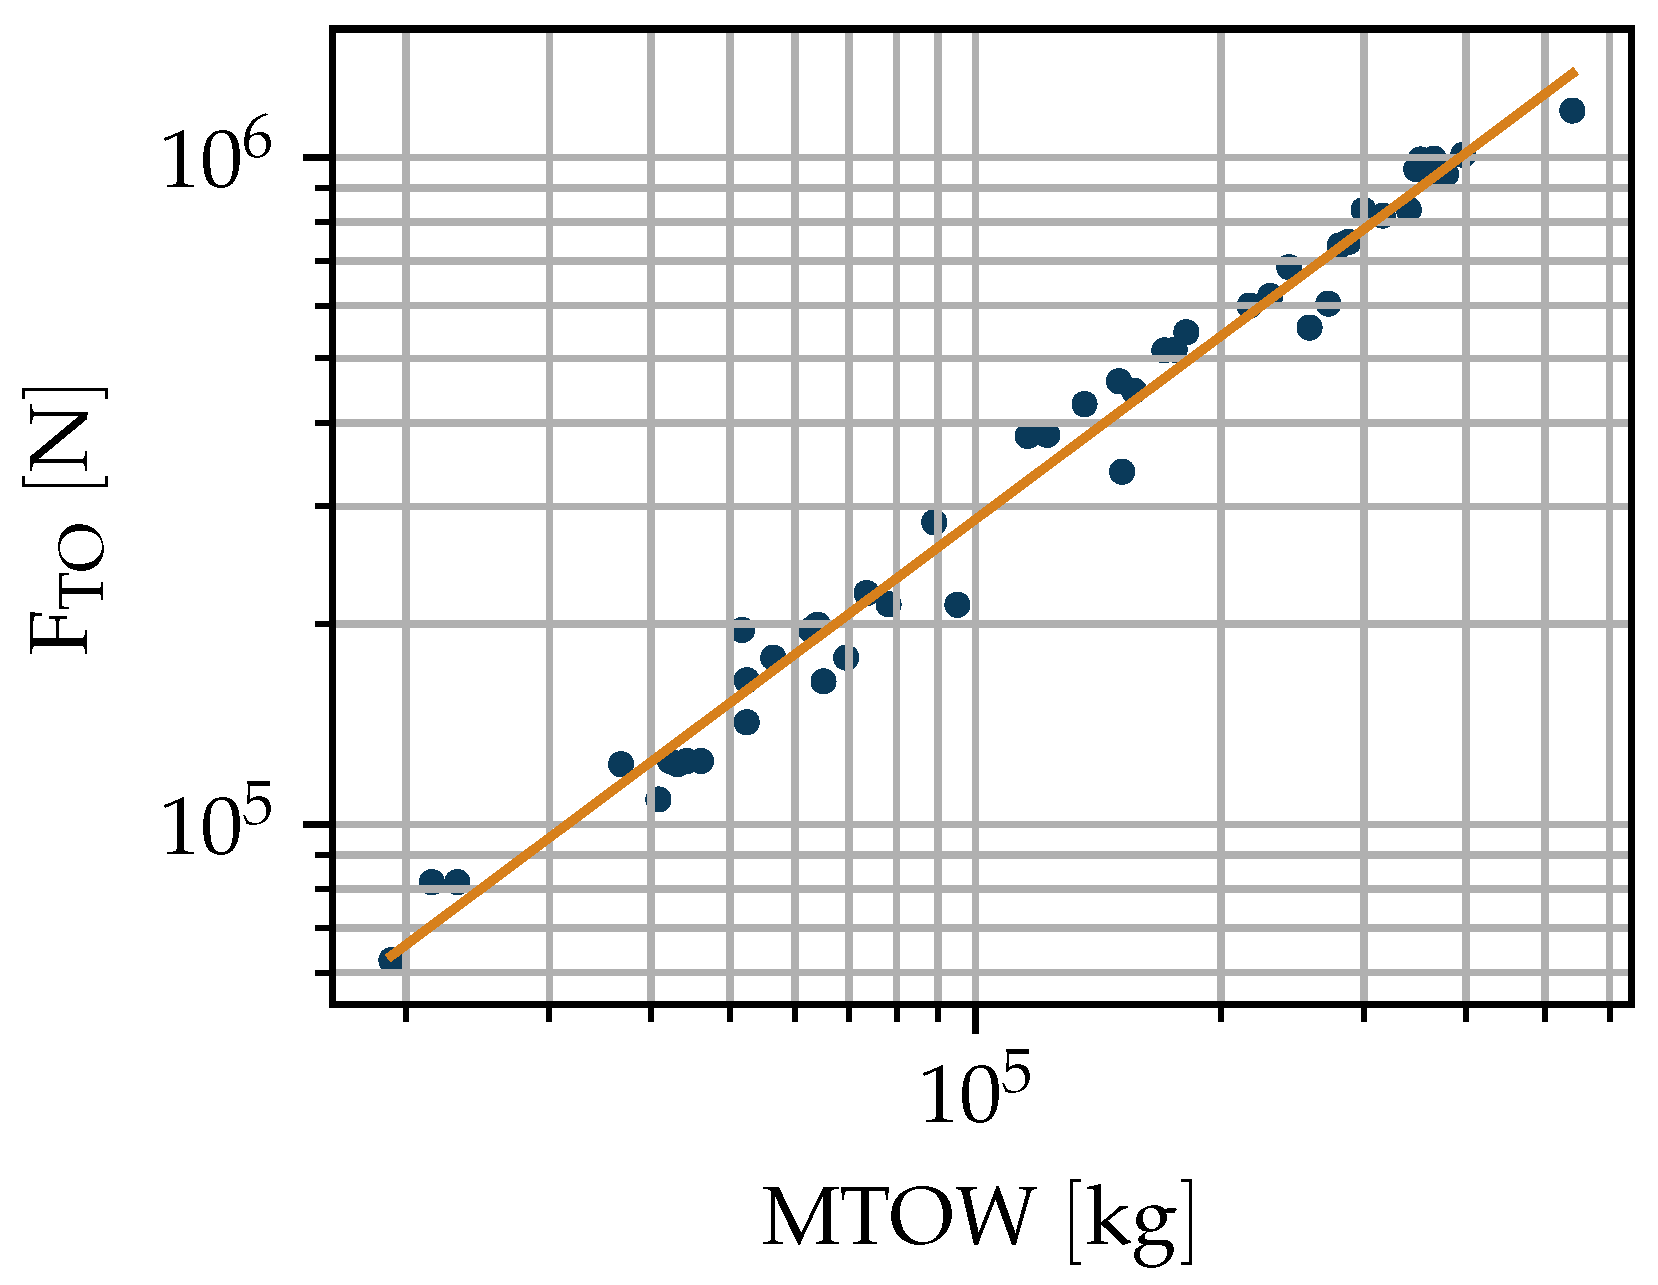
With v T O being the take-off velocity, which is calculated based on Sea Level (SL) conditions with d T I S A = 0 and M a = 0.2 as representative M a T O . The F T O values are obtained from another linear fit of the log-log scaled data over M T O W . The resulting fit (Equation (4)) is shown in Figure 2. It has an r 2 value of 0.983.
l o g 10 F T O = 0.913 · l o g 10 M T O W + 0.895

3. Surface Heat Transfer

In this section, the applied heat transfer models are described. The sensitivity of the methods to changes in geometry is tested and the impact of surface heating on drag is assessed.

3.1. Modeling

Flat plate models with uniform temperature distribution are used for heat transfer calculations for all components. Correlations for the local Nusselt number ( N u x ) from References [23,24,25] are applied to calculate local heat transfer coefficients ( α x ), which requires a local discretization of the geometry in flow direction. The trapezoidal shaped components (wing and tail planes) are also discretized in span wise direction to account for the different flow lengths and corresponding Reynolds numbers ( R e x ). Incoming solar radiation is accounted for in the overall heat balance by means of a material absorption coefficient and an incoming radiation power ( P r a d ) on all surfaces that are exposed to the sun. Unless stated otherwise an absorption coefficient of 0.25 typical of white paint and P r a d of 1362 W/m 2 , which is the constant value outside earth’s atmosphere [26] are assumed. For each component, half of A w e t is considered to be exposed to P r a d . Those are conservative assumptions since P r a d has a slightly lower value even at the highest flight levels than the above-mentioned value outside the atmosphere. Detailed descriptions of the used convection correlations and heat balances can be found in Reference [16]. The used 2D methods are less precise than for example 3D Computational Fluid Dynamics methods but they are sufficient for a first quantification of the surface cooling power in the conceptual design stage.

3.2. Sensitivities

The aforementioned local discretization of the heat transfer calculation depends on R e x . Section 2.2 focuses on correlations of the total and component wise A w e t . However, to calculate R e x more knowledge of the geometry is required. For example, two fuselages with the same A w e t have different R e x distributions if their slenderness ratios ( Λ ) differ. To account for these effects, the geometric model of the components is refined. For cylindrical components (fuselage, nacelle) the sensitivity of Λ is studied:
Λ = l / d
With length (l) and diameter (d). Wing and tail components are modelled as single section trapezoids with no leading edge sweep. Their geometries, specifically the span-wise chord distribution can be fully defined with the help of their A e x p , aspect ratio ( A R ) and taper ratio ( λ ) [20]. The following sensitivity studies are conducted around TO conditions. It is one of the most critical conditions for TMS design, because of the low air flow velocities, high ambient temperatures ( T a m b ) and large cooling demand ( Q r q ) due to maximum propulsive power. Unless otherwise specified, the values in Table 4 are assumed for the wing sensitivity studies. The values are not specific to any aircraft but generally lie inside the range of the given data. R e x , c is the critical Reynolds number and T s u r f the average surface temperature. In a real cooling application, the surface temperature would most likely not be uniform but have a gradient in the direction of a hot side flow underneath the surface. However, in this first approximation an average T s u r f is assumed for simplification.

3.2.1. Transition Location

Flat plate heat transfer correlations distinguish between laminar and turbulent flow. They rely on the knowledge of a critical location ( x c ) where transition occurs. Usually x c is defined by R e x , c which according to Reference [24] is between 1 × 10 5 to 3 × 10 6 depending on free stream turbulence and surface roughness. Detailed transition modelling is a complex research area and beyond the scope of this work. However, a sensitivity study with varying R e x , c and M a ranging from slow taxiing M a = 0.01 to representative TO M a = 0.2 is conducted. The results of the theoretically available cooling power ( Q a v ) as well as the relative Q a v compared to the Q a v at the lowest R e x , c for each M a ( Q R e , x , c , m i n ) are displayed in Figure 3.
An increased M a results in increased Q a v because of the increased effects of forced convection. Shifting R e x , c to higher values, results in a decrease in Q a v . Turbulent flows favour heat transfer more than the structured flow in laminar regions because of the increased particle mixing within the boundary layer. With increased R e x , c the portion of A e x p with laminar flow increases. For very low M a increasing R e x , c beyond 2 × 10 6 results in laminar flow on the entire surface. A further increase in R e x , c has no additional effect. The transition point has a large influence on Q a v . For 3D wings, transition is more complex than defining an R e x , c and assuming instantaneous transition. This study does not accurately account for real transition effects. The results in Section 4 assume fully turbulent flow areas downstream the transition location. Therefore, the results of this study cannot directly be used for concepts with enhanced laminarity such as natural laminar flow (NLF) wings. Covering these advanced aerodynamic concepts is part of future work.

3.2.2. Wing Aspect Ratio

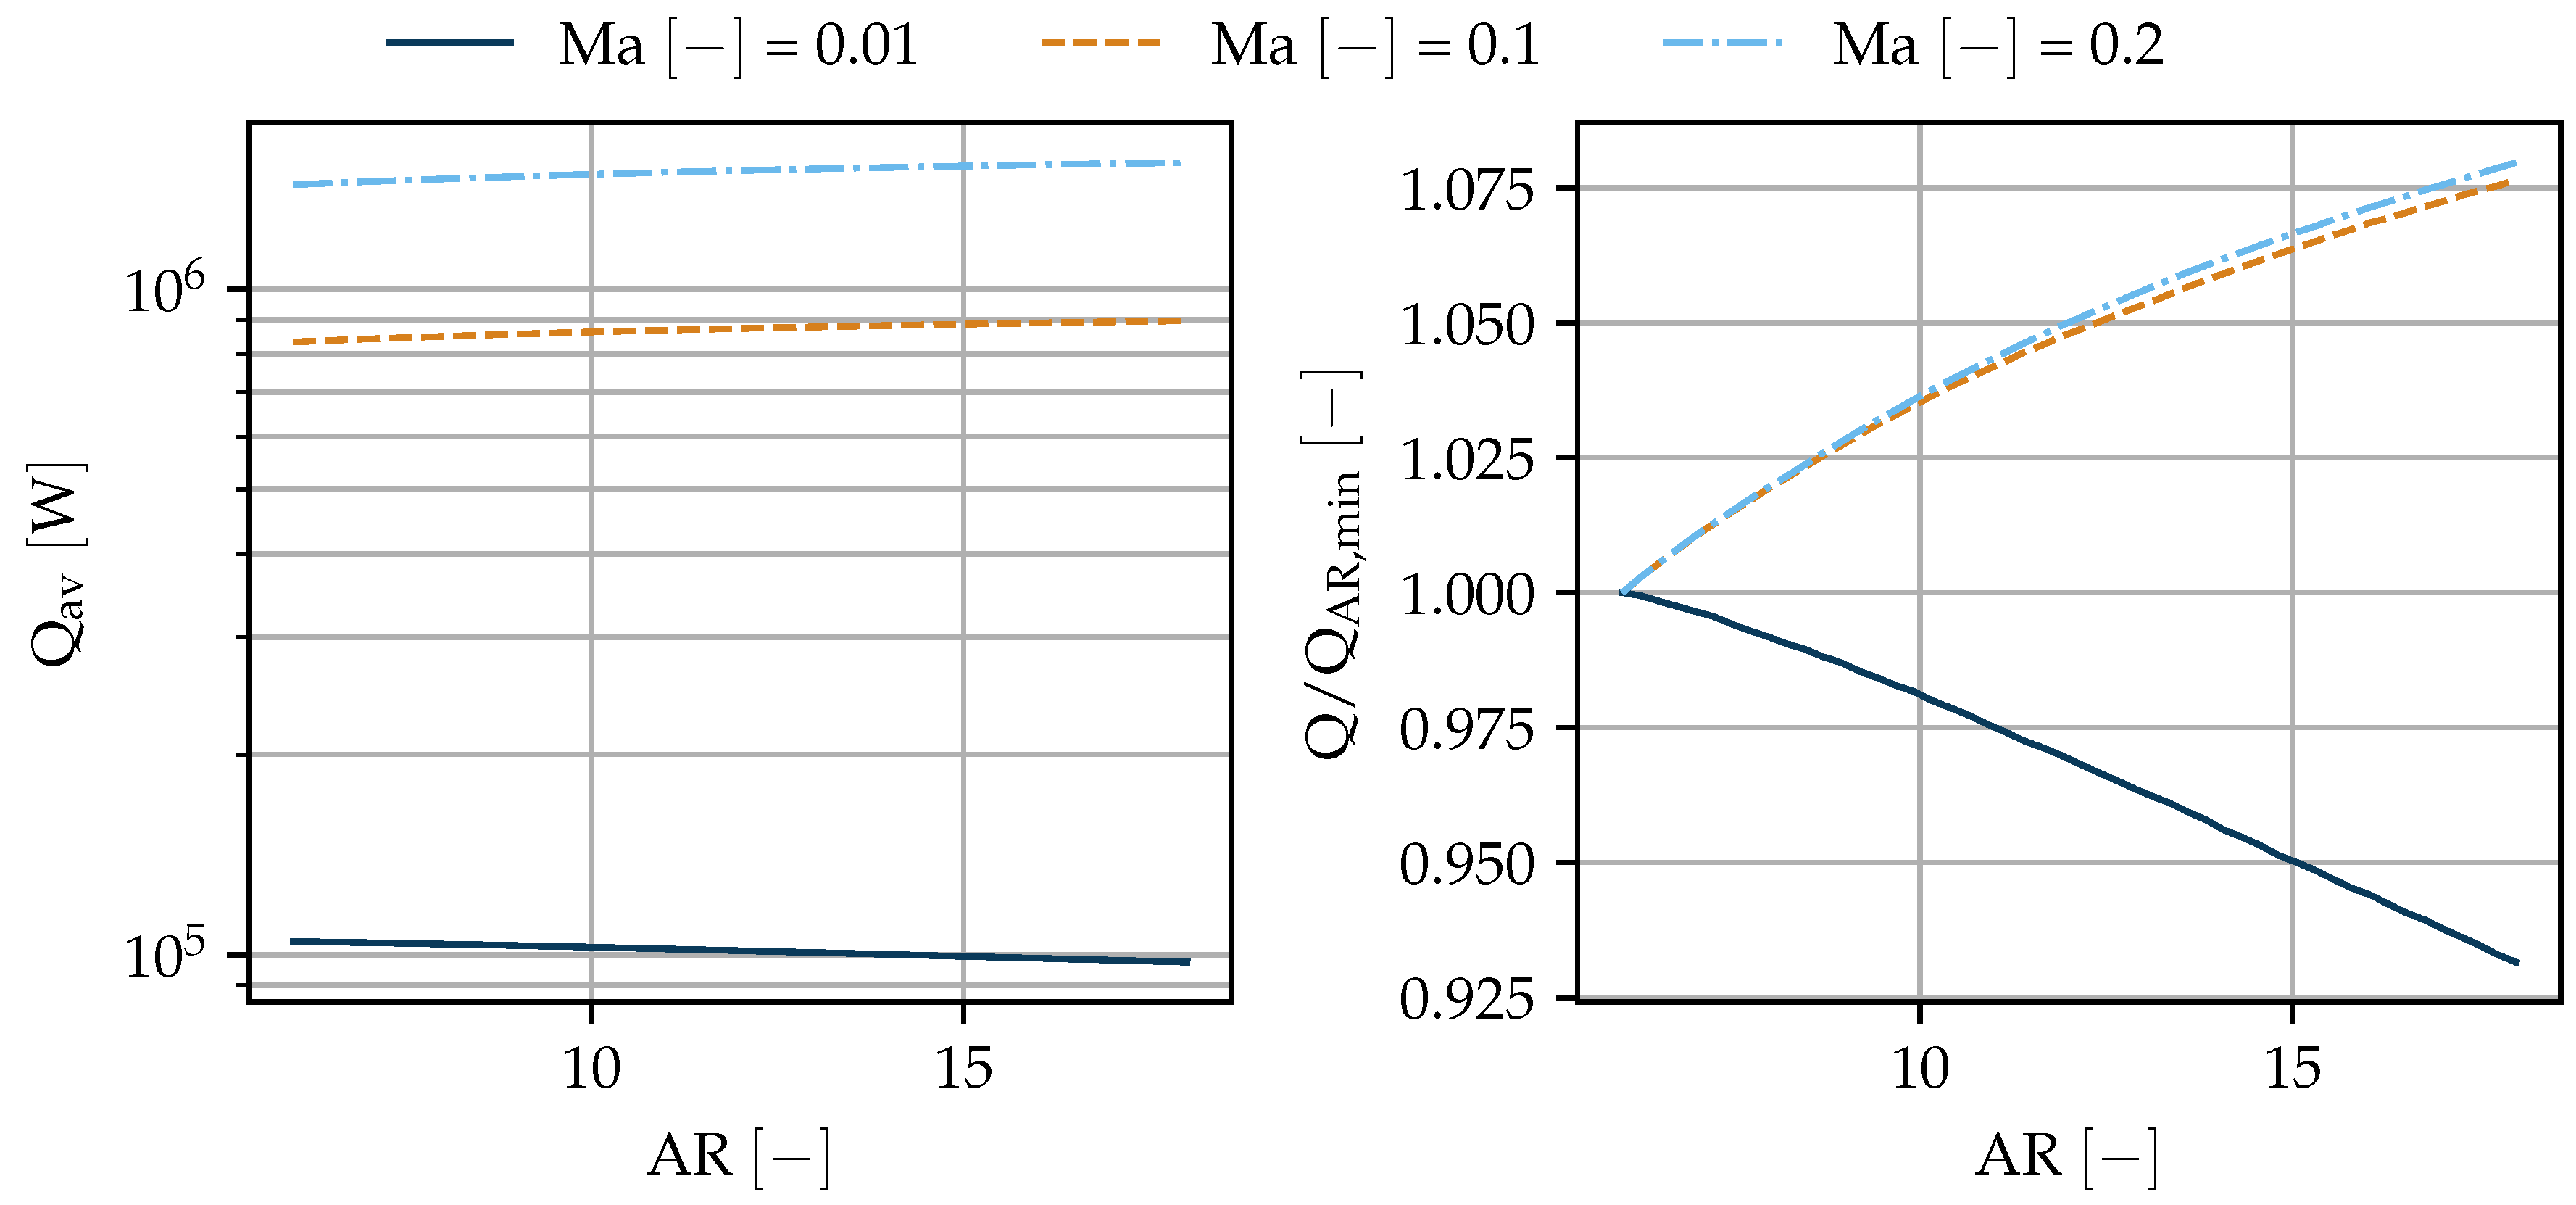
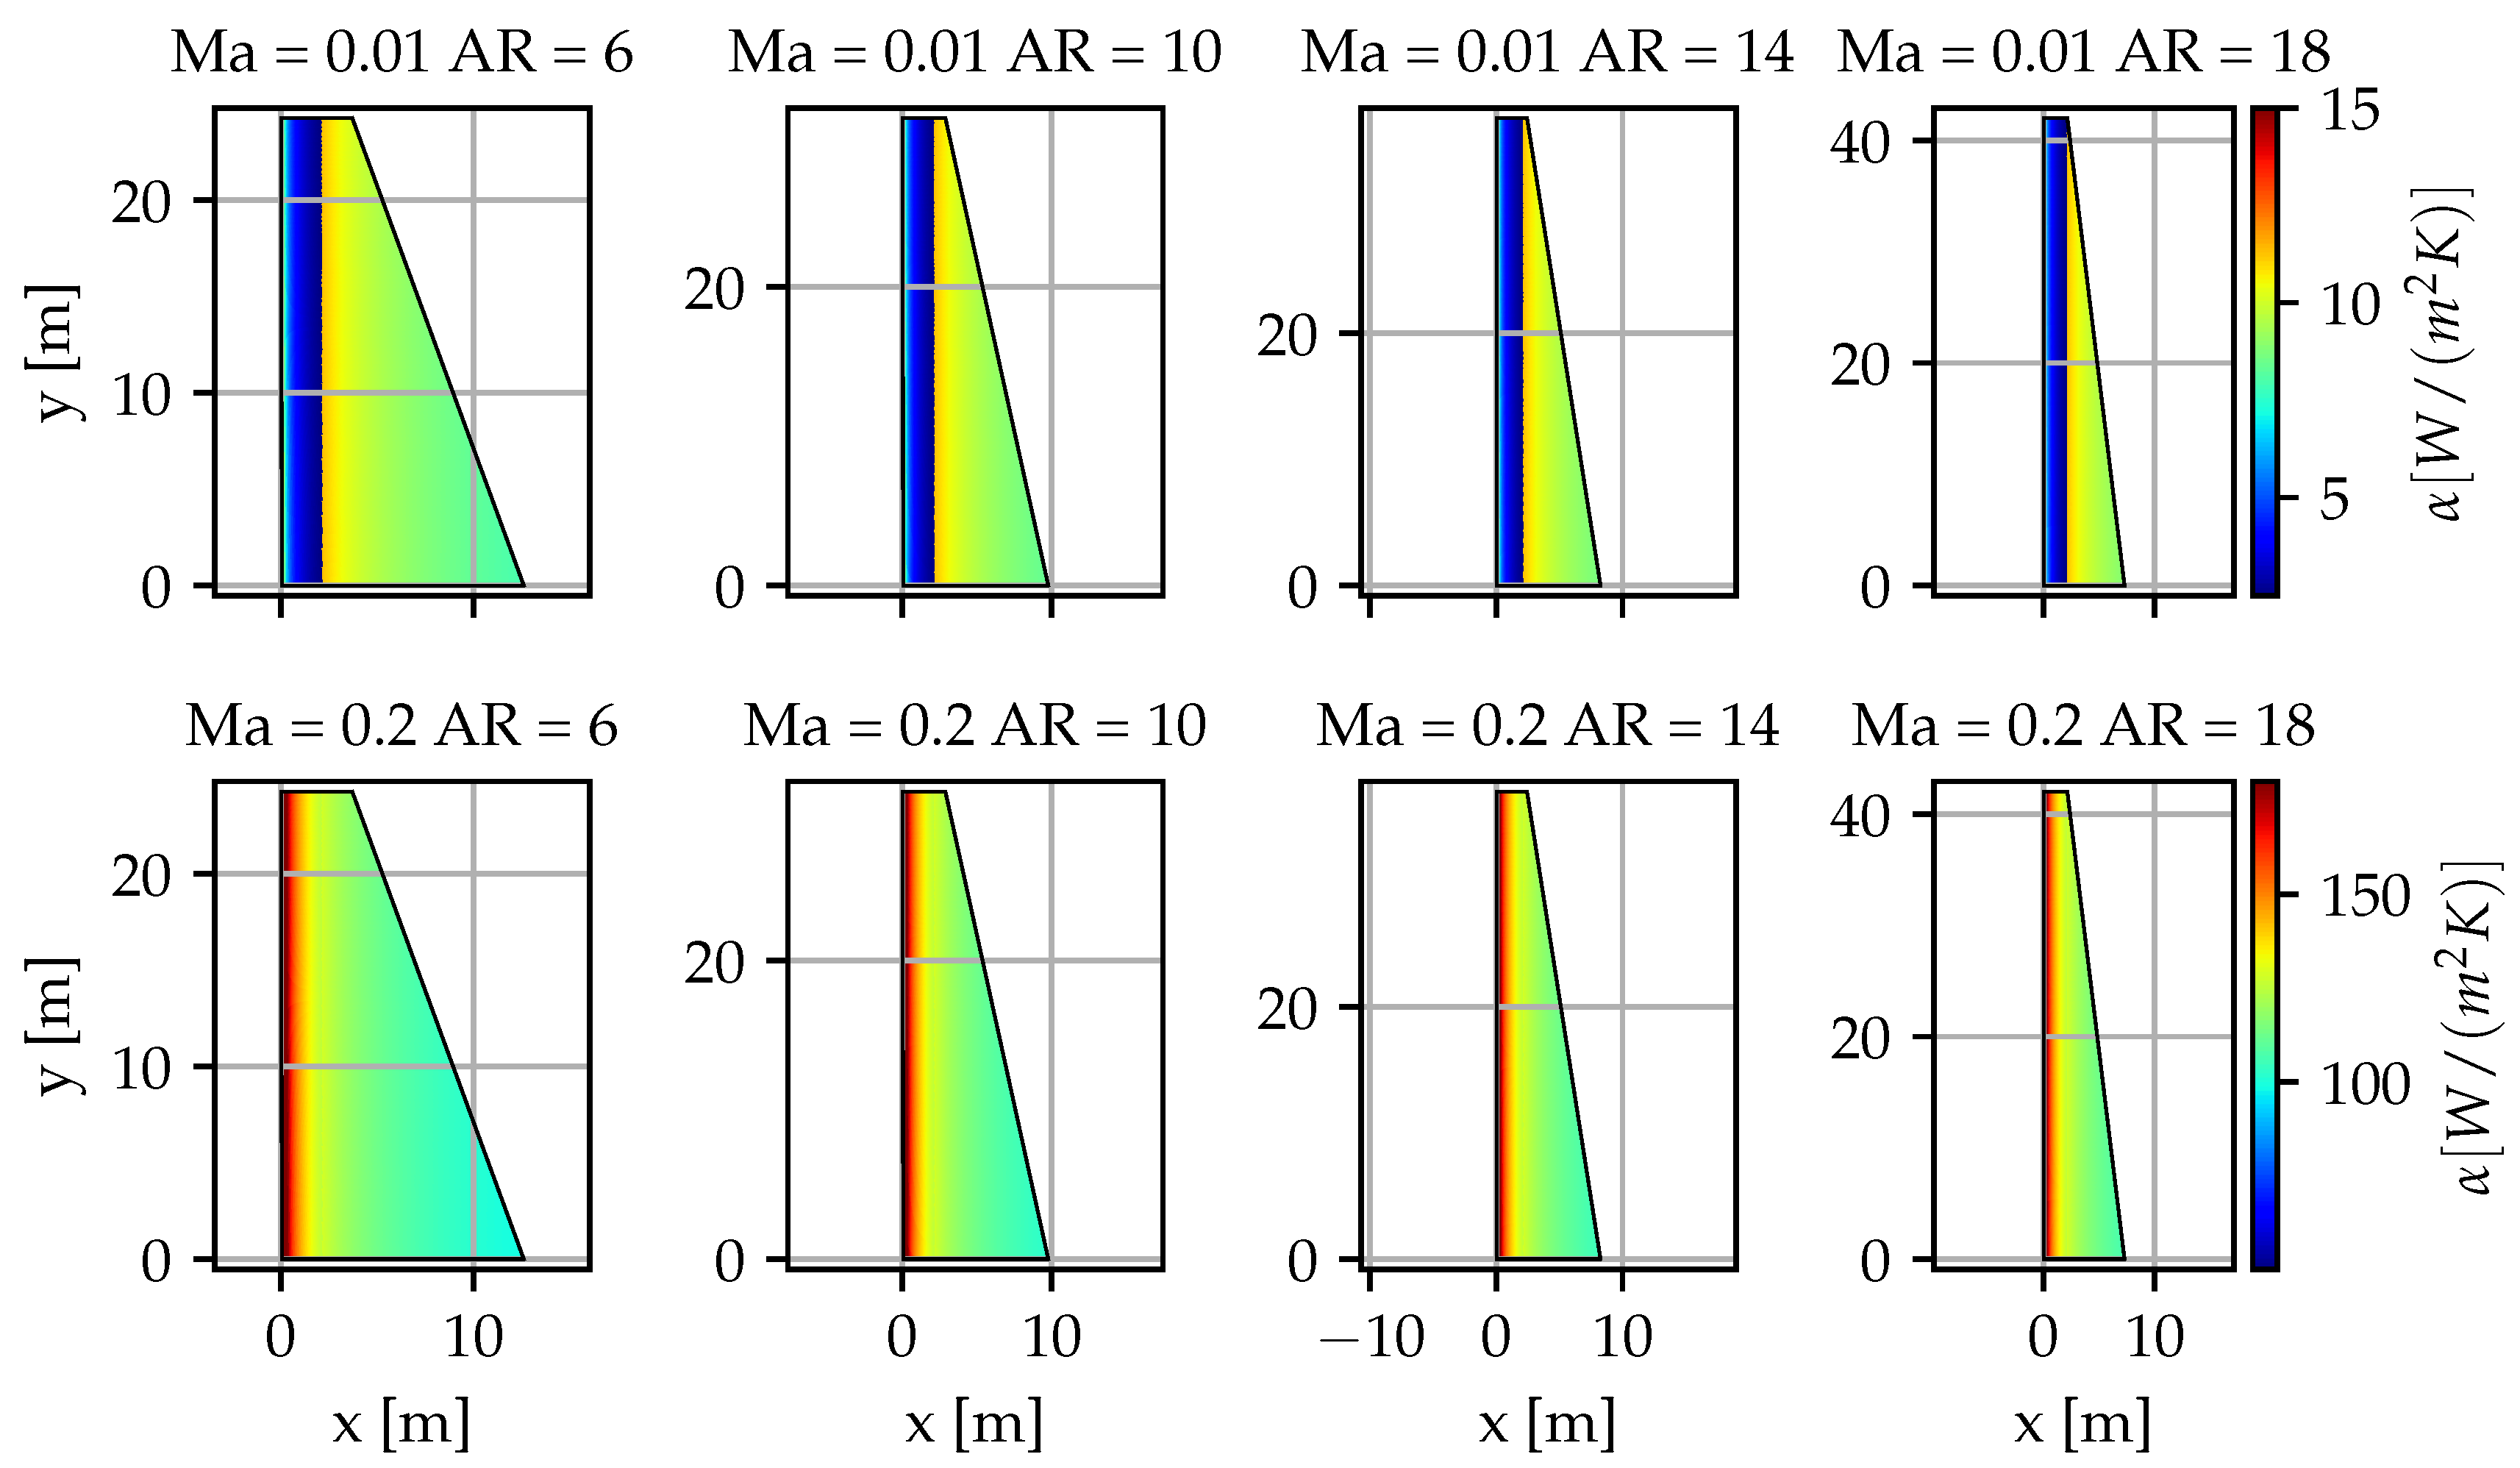
A R is varied from 6 to 18—a range that includes all aircraft used for the correlations in Section 2 and also leaves margin for possible future aircraft with increased A R . The results of Q a v as well as the relative Q a v compared to the Q a v at the lowest A R for each M a ( Q A R , m i n ) are displayed in Figure 4. For better comprehension of the trends in Figure 4, the effect of increasing A R on the local α x distribution for the lowest and largest M a are illustrated with heat maps in Figure 5.
Q a v increases with M a , because the forced convection increases, due to increasing R e . Depending on M a , Q a v increases or decreases with increasing A R . More specifically for the lowest M a of 0.01 , Q a v decreases with increasing A R . For all other M a used in the study Q a v increases with A R . Two counteracting effects are the reason:
  • In general, α x decreases along x because of the increasing thickness of the thermal boundary layer ( δ T ). Therefore, higher A R favours heat transfer because for the same area, the average chord length is lower (cf. Figure 5 bottom graphs).
  • The front section of the wing is laminar, which results in small α x . A higher A R increases the span and, thus, the laminar portion of the plate’s total area (cf. Figure 5 top two graphs). The x c depends on M a . For low M a the transition occurs further downstream, which means that this second effect contributes more.
Tripling the aspect ratio results in ± 8 % Q a v depending on M a . The sensitivity is too weak for the expected precision of this study that aims to determine the order of magnitude of the surface cooling power. Hence, it is not regarded in the following studies.

3.2.3. Wing Taper Ratio

λ is varied between 0.1 and 1.0 . The same M a range as in the previous sections is applied. Variations in Q a v do not exceed ± 2 % with slight advantages for the non-tapered wings ( λ = 1.0 ). The aforementioned effect of increasing flow length is positive for heat transfer of tapered wings near the wing tip but negative near the root, which leads to its equalization after integration over the entire span. As with the A R sensitivity, the effect is too small to be further considered in this work.

3.2.4. Fuselage Slenderness Ratio

For a fuselage with A w e t = 1600 m 2 , Λ is varied from 5 to 15 within the same M a range as the previous sensitivity analysis. Regardless of M a , the change in Q a v from the lowest to the highest Λ value is around −8%, again due to the increasing flow length with increasing Λ . The effect is also within the expected precision of this study. For further investigations, Λ = 12 is used, which is conservative as it is one of the highest Λ values found in today’s aircraft for example, for the Airbus A340-600.

3.3. Drag

For any aircraft component, which contributes to the aircraft’s drag, local surface temperature can influence the aerodynamics of air passing the component surface at a certain velocity and with certain fluid characteristics. The two main occurring effects depending on the fluid’s initial state are:
  • Transition delay of initially laminar flow
  • Drag alteration of fully turbulent flow
As the skin friction coefficient ( c f ) is significantly smaller in laminar than in turbulent flow, total skin friction drag ( D f ) of a surface can be decreased by moving the transition location downstream that is, by increasing the laminar length. During the last centuries, laminar flow control approaches have been studied intensively as a means to decrease drag. As such, surface temperature alteration can be employed to decrease the growth rate of unstable disturbances in the fluid and thus, to repress transition from laminar to turbulent flow [27]. The application of this method was shown in experiments by for example, References [27,28]. Two different approaches apply [29]:
  • Heating/cooling of the whole wetted surface area
  • Strategic heating/cooling of a part of the wetted surface area
In the two-dimensional case, Tollmien-Schlichting instabilities, which dominate the laminar boundary layer, are mitigated by cooling of the near wall boundary layer. In accordance with theory, flat plate experiments showed that the cooling of a surface leads to an increase of R e x , c and a downstream movement of x c [28]. The effect is reversed when the surface is heated: the destabilizing effect of the temperature increase in the boundary layer dominates and x c moves upstream [27].
However, the stabilizing effect of cooling can also be utilized when a portion of the surface is heated at strategic locations. For a two-dimensional case, it was shown that heating a portion of a surface where stable laminar flow is present (preferably the leading edge) followed by a cool that is, unheated, “relaxation” surface downstream can lead to a preferable downstream movement of x c . The heated wall has to be situated in the region where Tollmien-Schlichting waves start to develop in the laminar boundary layer. The temperature of the near wall boundary layer is increased and when the fluid reaches the cooler wall further downstream, the temperature of the boundary layer is higher than the wall temperature. The boundary layer is cooled down and the growth rate of the unstable disturbances is decreased. The transition point moves downstream. If the surface is heated in an unstable flow region, the effect is reversed [27,29,30].
In three-dimensional airflows, however, cross-flow instabilities determine the boundary layer. Dovgal et al. showed that in this case, a temperature increase of the near wall boundary layer fosters cross-flow instabilities no matter if the whole surface or only a part of the surface is heated. The transition location moves upstream resulting in an increased D f [27,30]. Thus, for any three-dimensional aircraft component, localized and global surface heating in the laminar flow region facilitates laminar to turbulent transition and increases D f .
In contrast, when the boundary layer is fully turbulent, different mechanisms govern the flow: Heating of the near wall boundary layer reduces the turbulent D f . Kramer et al. conducted wind tunnel experiments and flight tests in 1999. They found that an increase of the near wall boundary layer temperature leads to a decrease of R e x , which in turn leads to a reduced local skin friction force [31]. For a body similar to a fuselage, they showed that the heating of the fore body leads to a higher drag reduction than the heating of the aft body, whereas the heating of the whole body has the highest drag reduction potential. The findings are supported by a numerical evaluation of the effect of heating on the turbulent boundary layer flow over slender and bluff fuselage-like bodies conducted by Lin and Ash in 1986 [32]. The following theoretical deviation of D f as a function of wall heating for a smooth flat plate is based on the deviation proposed by Reference [31].
The length Reynolds number is defined as:
R e x = ρ · v · x μ
For R e x = 10 6 10 8 , the turbulent c f for a flat plate of length x can be expressed with K = 0.036 , m = 6 by Reference [33]:
c f = K R e x 1 m
Total skin friction drag of a flat plate with the length x and total area A for a turbulent boundary layer is defined as [33]:
D f = c f · 1 2 · ρ · v 2 · A = 0.036 2 · ρ ρ 1 6 · v 2 v 1 6 · x 1 6 · μ 1 6 · A .
Assuming a constant heated surface temperature ( T h ) along x, the temperature ratio of unheated air ( T u ) and T h is defined as:
T R = T h T u
Applying the ideal gas law leads to ρ = f ( 1 / T ) and the dynamic viscosity of air can be simplified to μ = f ( T ) . Thus:
ρ h ρ u = T u T h = 1 T R
μ h μ u = T h T u = T R
R e x , h R e x , u = ρ h · v h · μ u ρ u · v u · μ h = 1 T R 2
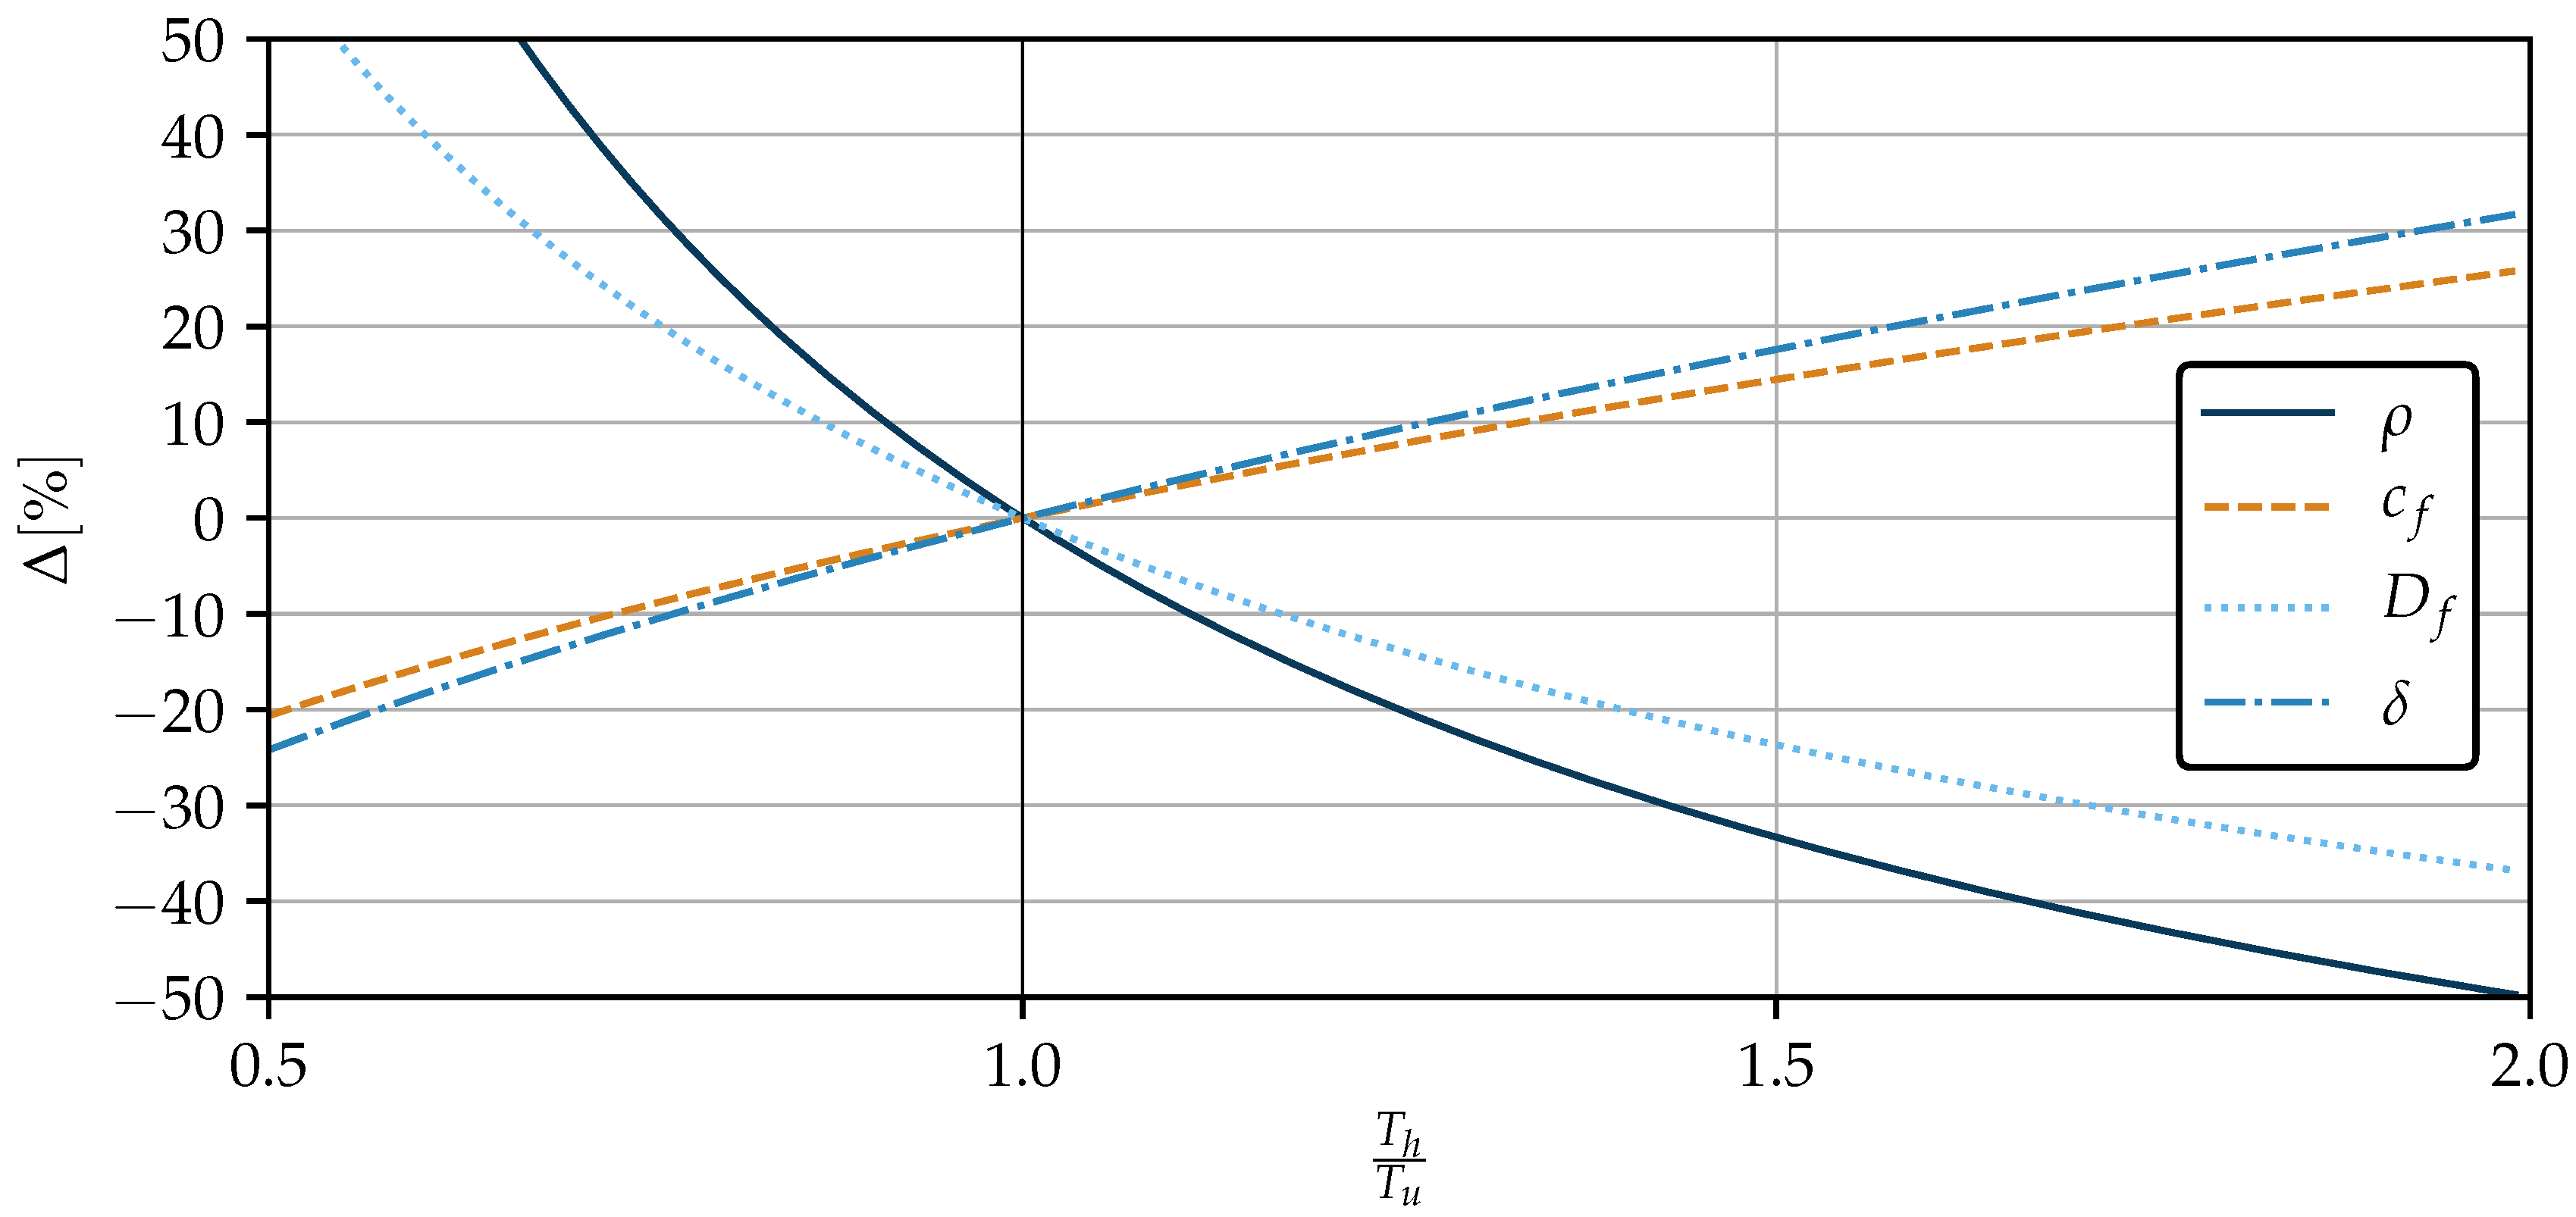
When the wall is heated ( T R > 1 ), R e x decreases with increased temperature. In consequence, c f increases. However, the change in ρ has a larger effect on D f than the change in c f :
D f , h D f , u = ρ h 5 6 ρ u 5 6 · μ u 1 6 μ h 1 6 = 1 T R 5 6 · T R 1 6 = 1 T R 2 3
and therefore if T h > T u D f , h < D f , u . The higher the wall temperature compared to the ambient temperature, the higher the drag decreasing potential. All simplified relations are depicted in Figure 6.
Wall heating not only has an impact on skin friction drag but also effects the pressure drag. The turbulent boundary layer velocity profile thickens, because [34]:
δ = 0.37 x R e x 1 5 .
For a flat plate, the pressure gradient is zero at all locations. For a slender body (fuselage) or lifting surface (wing, tail planes), however, the pressure gradient varies in stream wise direction. Therefore, for a three-dimensional curved body, the heating of the wall has an effect on the (not-separated) pressure drag as shown by Lin and Ash. The heating of the wall increases the turbulent displacement thickness ( δ * ), which in turn leads to a slight increase in pressure drag [32]. In addition, the boundary layer shape factor is increased. Thus, the adverse pressure gradient is increased, causing an earlier flow separation [32,35]. The effect of wall heating on pressure drag is small compared to the effect on skin friction drag [32].
In summary, in regions in which the boundary layer is laminar, an increased temperature leads to an earlier transition and, thus, to an increase in total D f . To make use of the beneficial effect of wall heating on the turbulent drag force, the surface of aircraft components should preferably be heated only in regions in which a fully turbulent boundary layer is present. This means that for example, the fuselage nose (cockpit area) or wing leading edge (slats etc.) should not be used for heat disposal. For aircraft concepts that unite different technologies, which emit excessive heat and aim at an increased laminar flow control, detailed studies have to be conducted, compromising excessive heat disposal and drag reduction approaches.

4. Surface Cooling Potential

For the following studies the simple correlations derived in Section 2 and Section 3 are combined to estimate Q a v depending on M T O W . The calculated A w e t is reduced for each component to account for more realistic cases with unusable surface area in each component. These reductions are based on observations and estimations from drawings in manufacturer’s documents such as in References [18,19].

4.1. Area Reduction Assumptions

In Section 3.3 it was shown that heating surfaces underneath laminar flow has a negative effect on aircraft drag. Therefore, areas at the front of each component are avoided as locations for surface heat exchangers. Independent of the size of the aircraft, the first 4 m of the fuselage are not used because cockpit, sensors and nose landing gear bay are located here. In addition, the contraction of this part is responsible for the overestimation of A w e t of the fuselage in Section 2. The rear 15 % of the fuselage length are also not used because of the tail plane attachments, the auxiliary power unit (APU) and again the contraction that lead to an overestimation of A w e t . For the remaining fuselage middle section, a stripe of 0.5 m width is spared on both sides to account for the windows. Another 10 % is subtracted from the total middle section area to account for passenger doors, cargo doors and landing gear doors as well as sensors and air openings. The wing leading edge and trailing edge ( 20 % chord length each) cannot be used as a heat sink due to slats, flaps and other control surfaces. Only the forward 50 % of the nacelle length is used to account for possible thrust reversers installed in the back. The rear 33 % of the horizontal and vertical tail plane’s chord length are not used because of the installed control surfaces. In the following, all remaining surfaces are employed for heat rejection.

4.2. Cooling Potential for Typical Operating Points

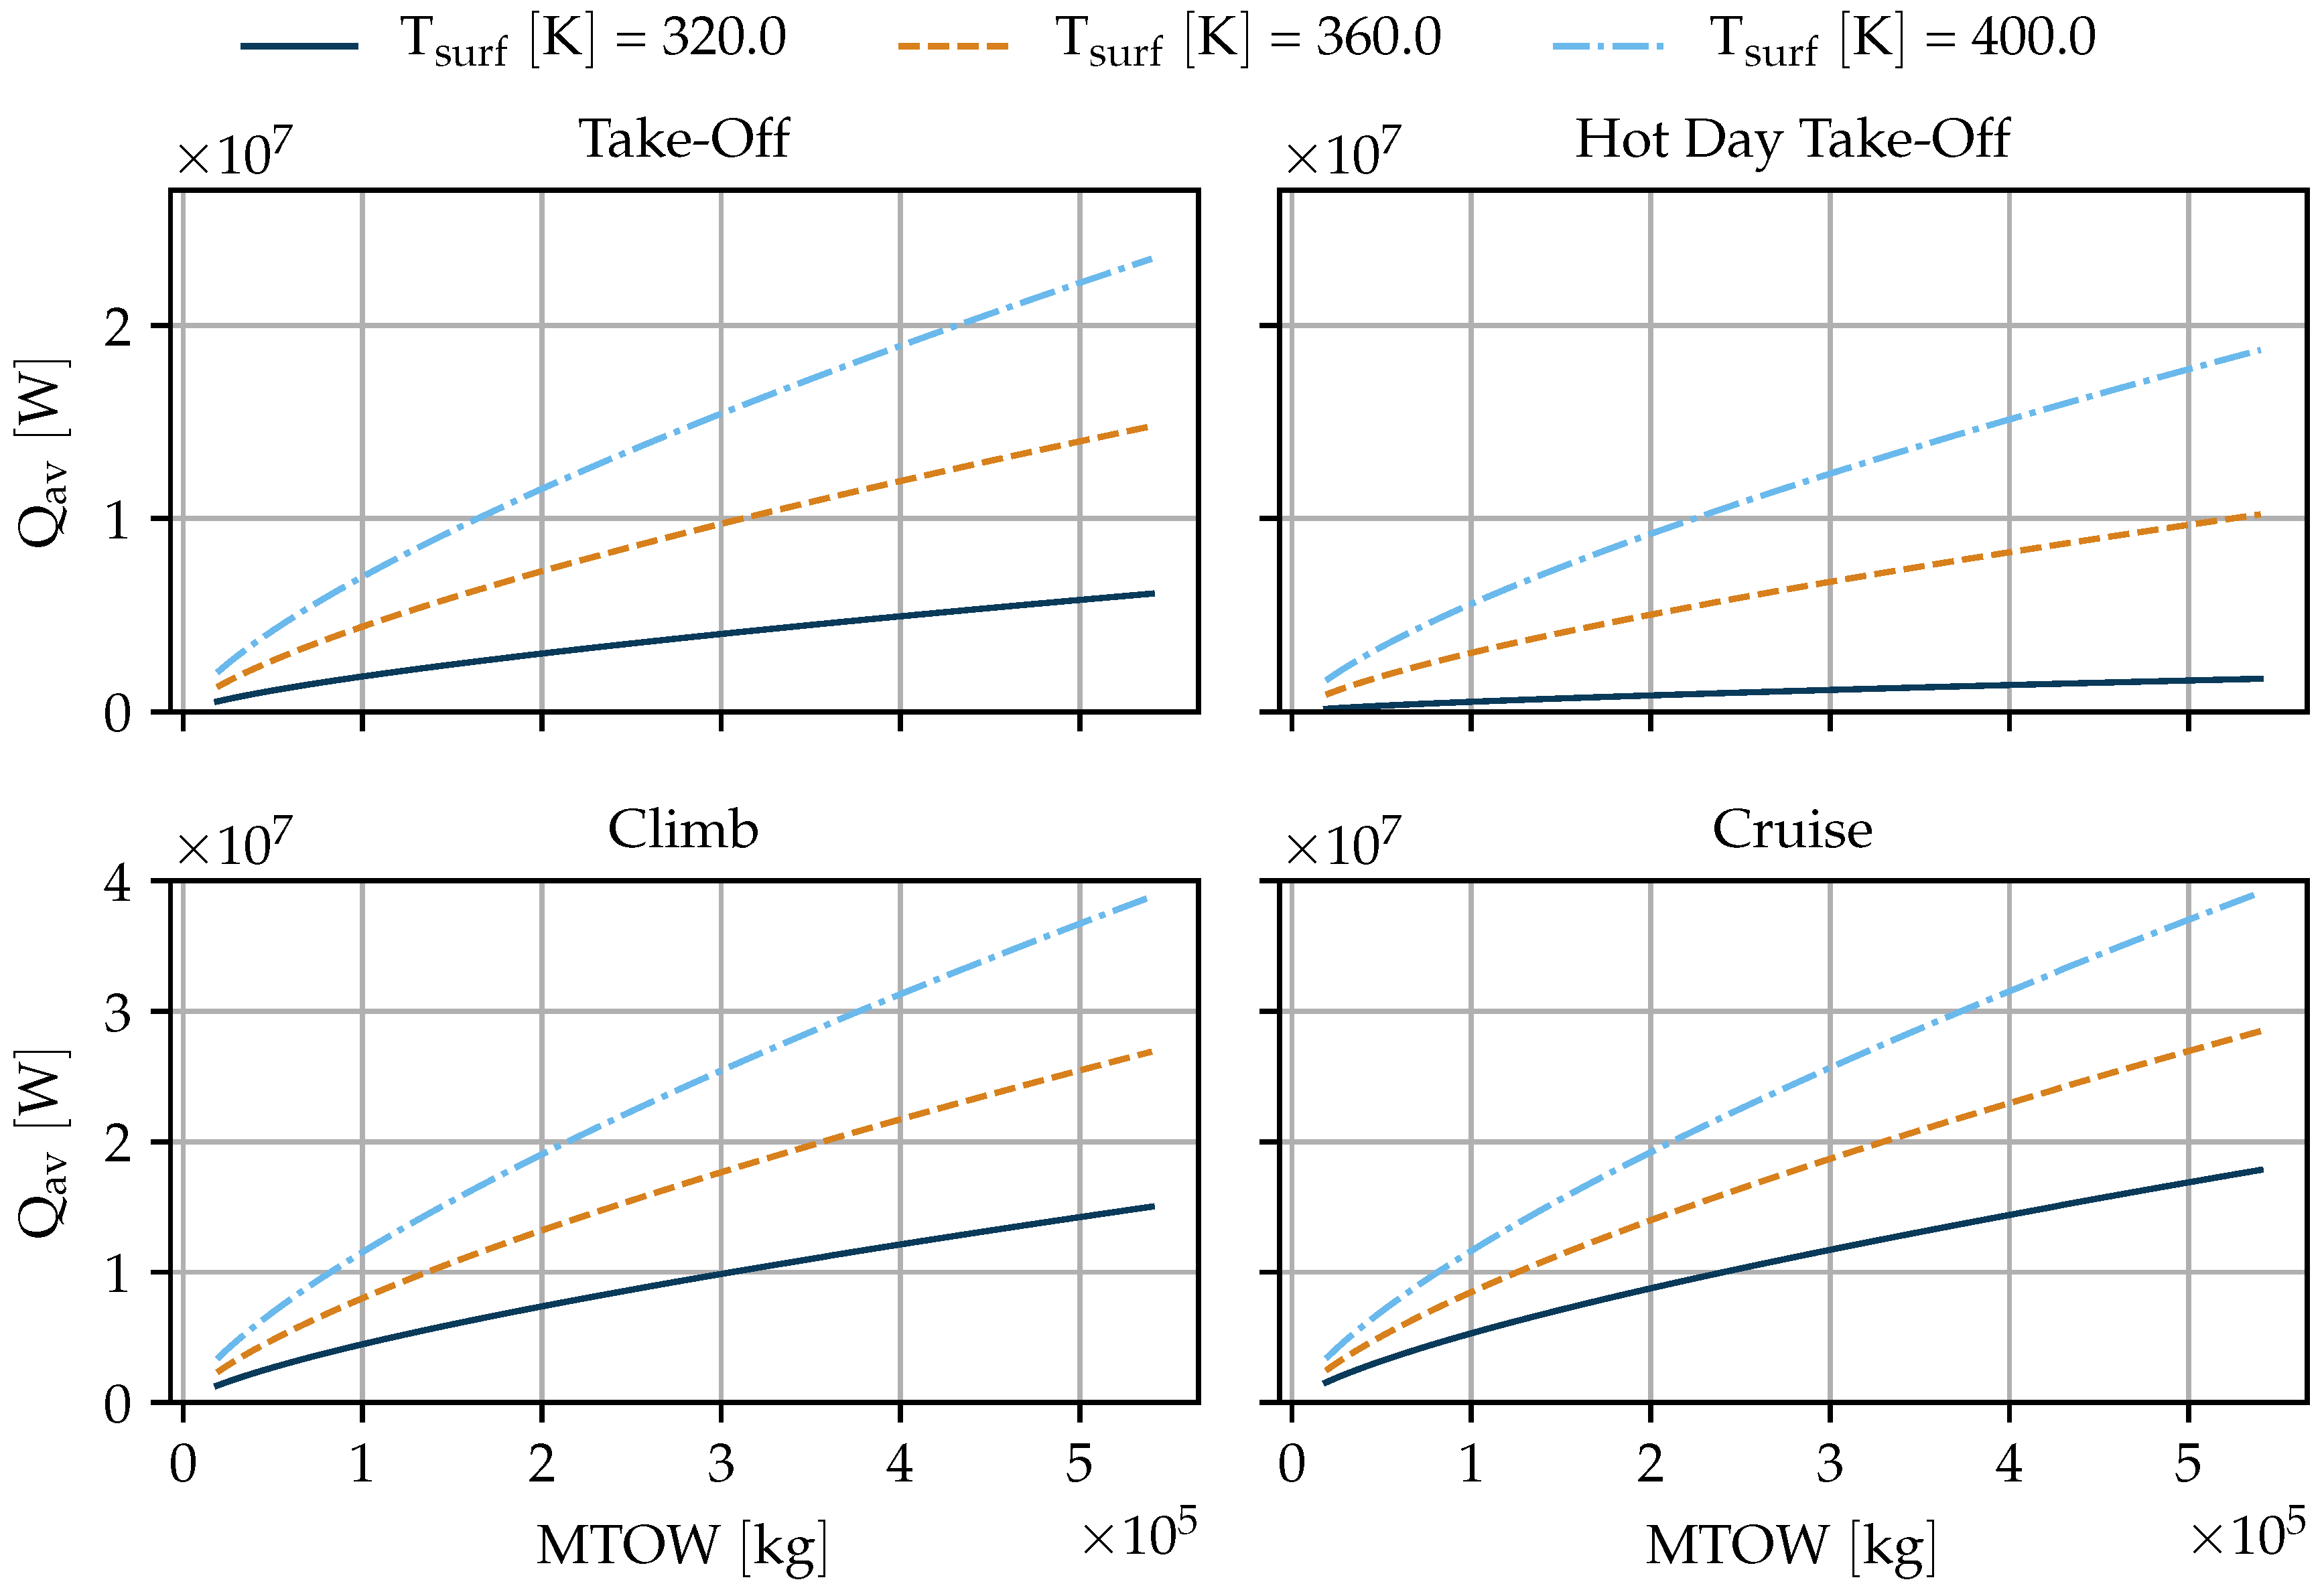
Q a v is investigated in multiple typical operating points: TO, HTO, CL and Cruise CR. The atmospheric conditions ( M a , a l t and d T I S A ) of each operating point are listed in Table 5. The design space includes M T O W over the entire range of the database used in Section 2.1 as well as T s u r f ranging from 320 K to 400 K. T s u r f has to be lower than the maximum allowed operating temperature of electric components, which for motors can be up to 180 C [36] but are significantly lower for batteries. The actual T s u r f depends on the installed drive train and the hot side of the cooling system. This study shows Q a v for a wide range of T s u r f in Figure 7.
Figure 7 can be used to estimate Q a v of any tube and wing aircraft with known M T O W . For example, the A320 sized aircraft from Section 2.2 has an M T O W of 71,000 kg. Assuming T s u r f of 360 K an estimated Q a v of approximately 250 kW in HTO—the most critical condition—results. In contrast, the same aircraft with the same T s u r f would be able to reject about 7 MW of heat in CR. In all operating points, Q a v increases with M T O W , because A w e t increases. The slope of Q a v decreases with M T O W , because the M T O W A w e t correlation is weakly logarithmic and because aircraft with higher M T O W have increased flow lengths on all surfaces, which results in lower α x towards their rear ends (cf. Section 3.2). Q a v also increases with increasing T s u r f due to the higher temperature difference to the ambient. In the HTO case, Q a v is about five times as large for T s u r f = 360 K than the value corresponding with T s u r f = 320 K over the entire M T O W range. The high sensitivity is due to a relatively high ambient temperature ( T a m b ), resulting in an increase of heat transfer driving temperature difference ( Δ T ) from Δ 12 K to Δ 52 K (roughly factor five). For CL and CR the relative T s u r f sensitivity is not as strong because T a m b is lower. Over the entire M T O W range, Q a v is about twice as large for CR and CL compared to TO. The ratio even increases when comparing CR and CL to HTO. The reasons for this large difference are the lower T a m b in CL and CR compared to TO and HTO as well as the higher M a that increases convection. The difference in Q a v between CL and CR is approximately 10 % over the entire M T O W range for T s u r f = 320 K. The difference is less for higher T s u r f and hardly noticeable for the largest T s u r f of 400 K. CR has a lower T a m b than CL which results in a larger Δ T . The relative difference between Δ T C L and Δ T C R decreases with increasing T s u r f . Also, for heat transfer, the total T a m b is relevant and due to the increased M a in CR it is not smaller by the same ratio compared to CL as the static T a m b . The increased flight speed should additionally result in higher N u in CR but the effect is reduced by the lower ρ a m b . More elaborate studies on the dependence of forced convection on flight conditions can be found in [16].

4.3. Hot Day Take-Off Performance

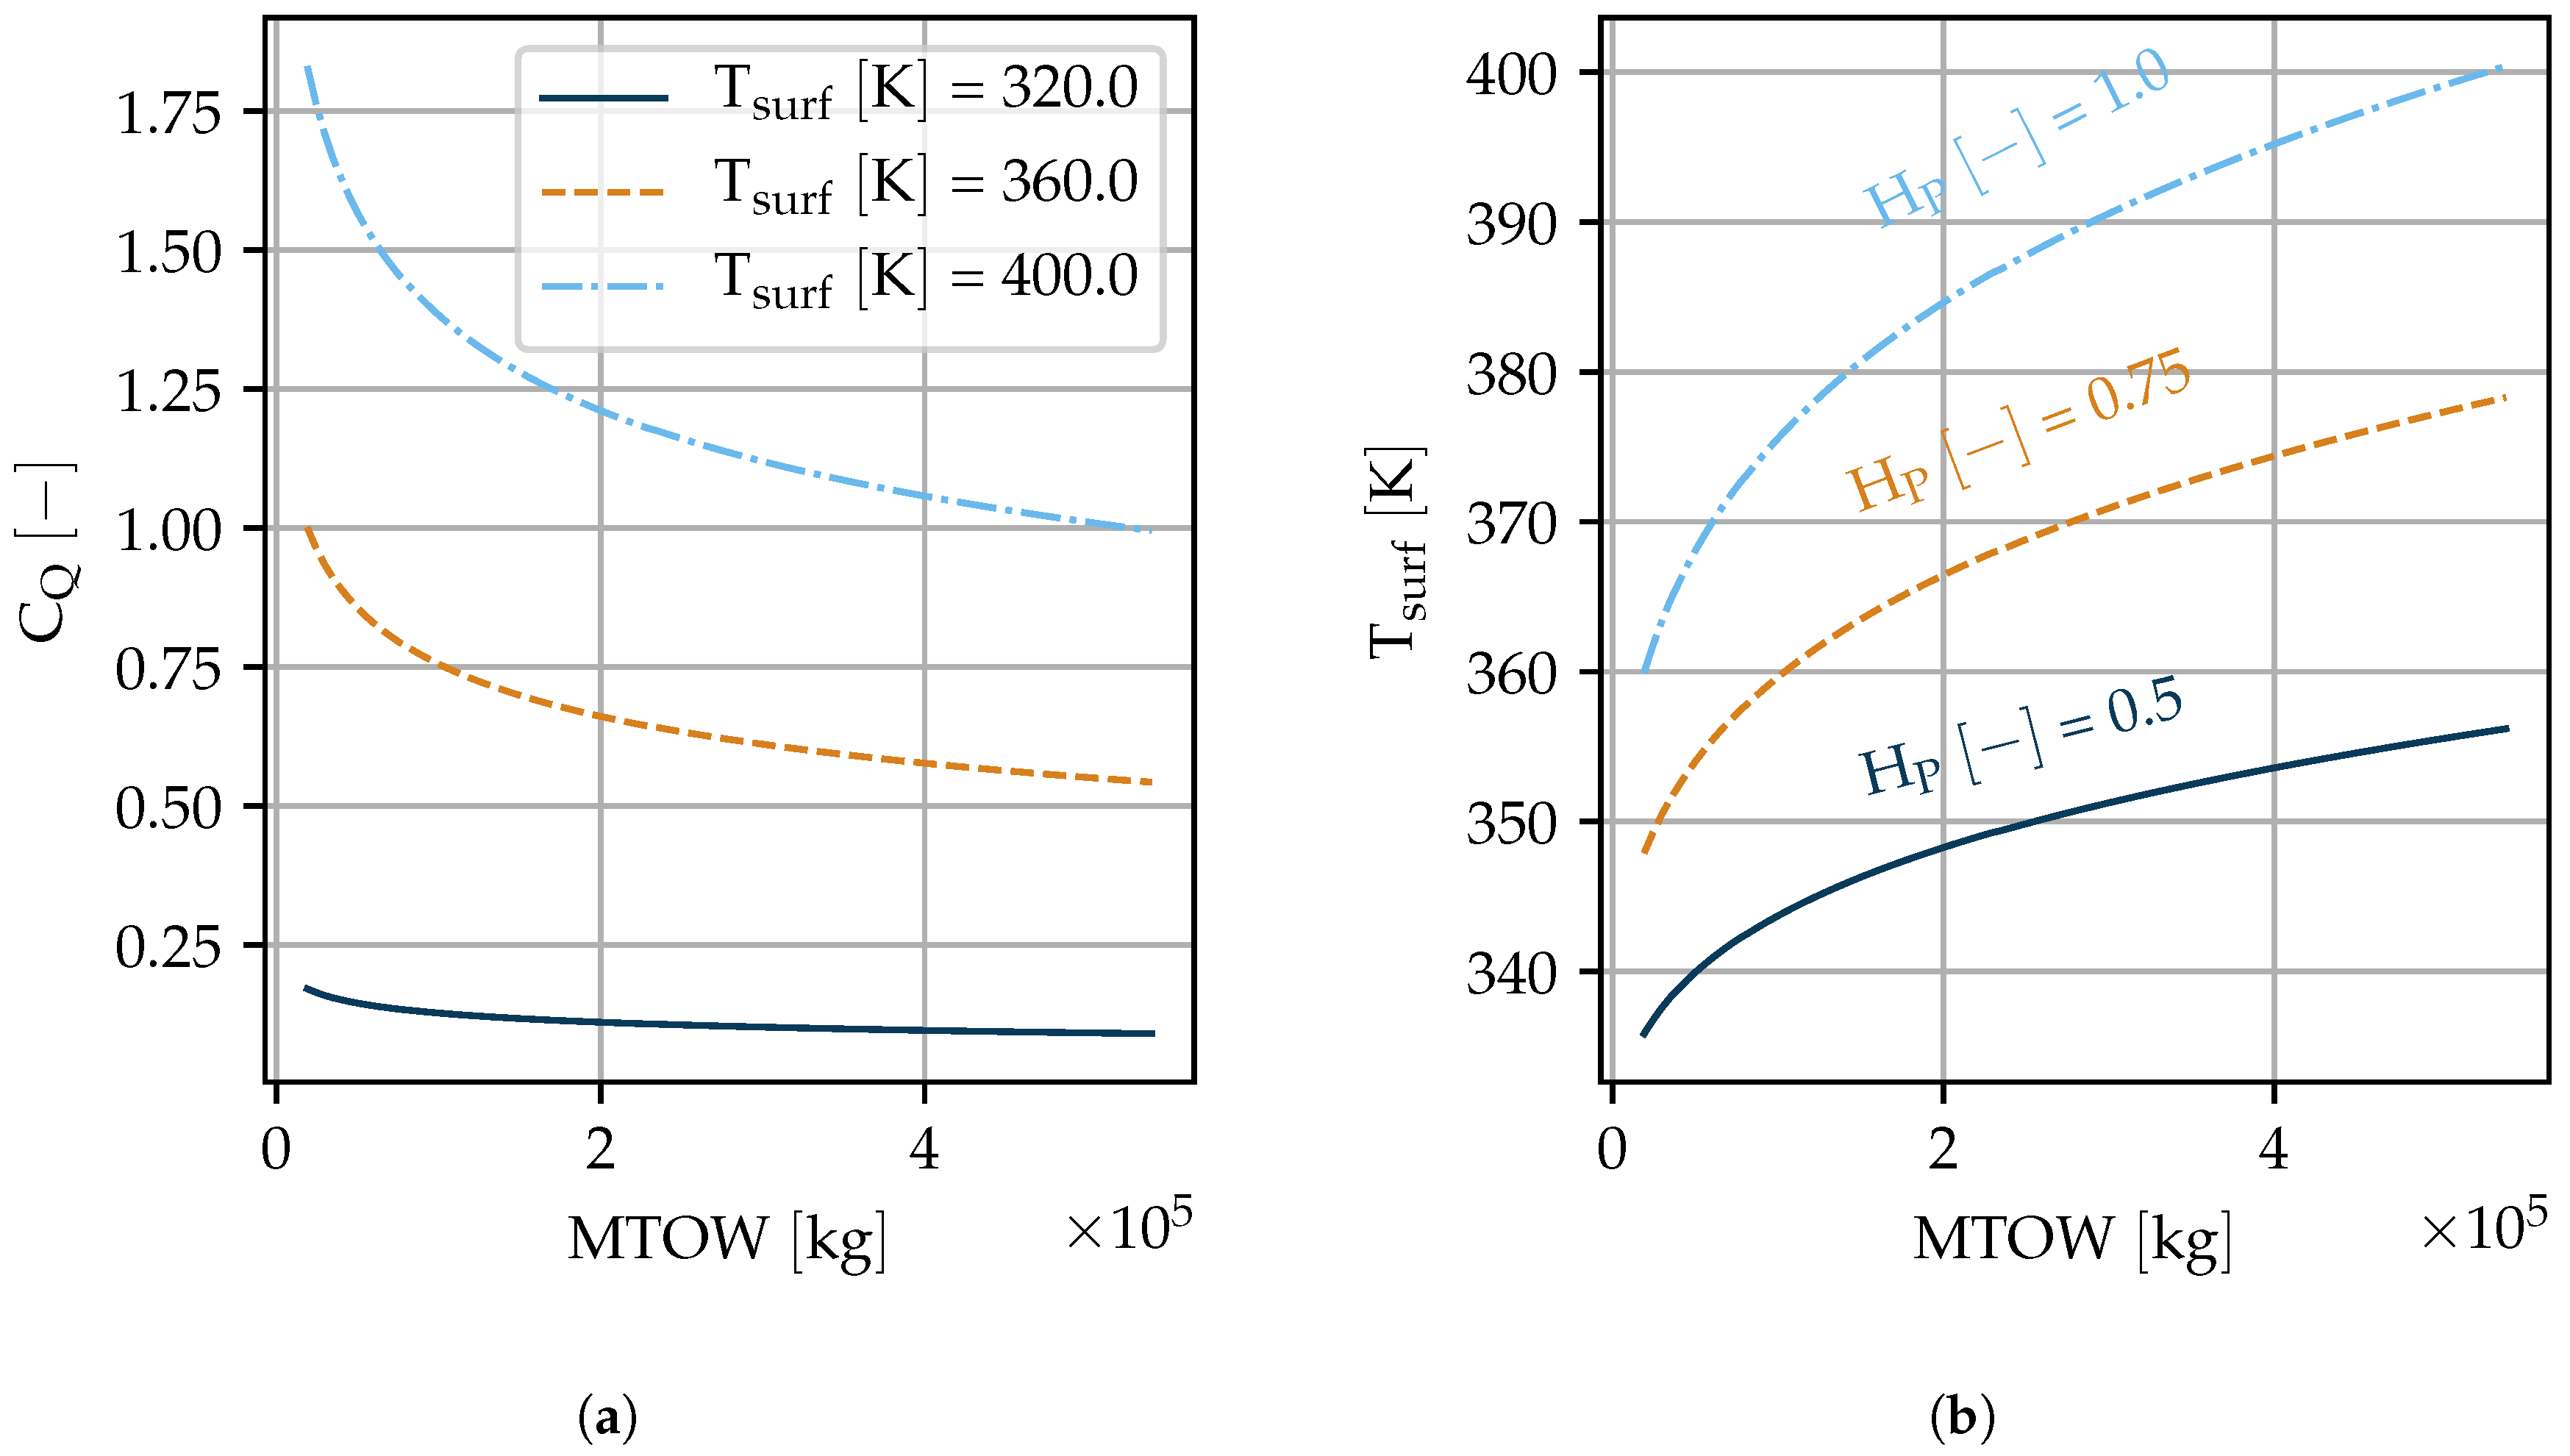
Results from the previous section indicate that HTO is the condition with minimum Q a v . Additionally, the propulsive power is usually at its maximum during TO, which means Q r q is at its maximum as well. For an aircraft application, the most relevant metric is the ratio of Q a v to Q r q ( C Q ). The following study is conducted for HTO conditions. Q r q differs depending on the electric architecture and the mission profile amongst others. For the first part of this study a fully power hybridized aircraft ( H P = 1 ) is assumed with estimated values for the efficiencies required by the methods shown in Section 2.3 listed in Table 6. The effect of varying M T O W over the entire range of the database (cf. Section 2.1) as well as T s u r f ranging from 320 K to 400 K is investigated. The results are shown in Figure 8a. For the second part of the study different H P values are assumed and the required T s u r f to achieve C Q = 1 that is, a Q a v that matches Q r q is investigated. Figure 8b shows the results.
A first observation is that Q a v and Q r q are within the same order of magnitude during HTO. Within the used parameter ranges values above and below unity exist for C Q . C Q is decreasing linearly with T s u r f and hyperbolically with M T O W . Smaller aircraft have a favourable C Q . This is mainly due to the increased flow length on all surfaces of larger aircraft but also due to the weakly logarithmic behaviour of the M T O W A w e t correlation. For the smallest considered aircraft, C Q ranges between 0.2 and 1.8 depending on T s u r f . In contrast, the C Q range for the largest considered aircraft is between 0.1 and 1.0. In Figure 8b the required T s u r f during HTO to achieve C Q = 1 is depicted for different H P . T s u r f grows linearly with H P because Q r q increases proportionally to H P . T s u r f grows logarithmically with M T O W , which is expected from Figure 8a: Smaller aircraft have an advantage over large aircraft with regards to potential cooling via existing aircraft surfaces. Taking the A320 sized aircraft from Section 2.1 ( M T O W = 71,000 kg) as an example again with H P = 1 , Figure 8b shows that T s u r f of about 370 K would be required during HTO to provide enough cooling power for the waste heat load of the drive train. Heating up the surface to an average T s u r f of 370 K is going to be challenging in an application with low grade waste heat potentially involving artificial measures such as vapour compression cycles to increase the temperature at which heat is rejected. However, such systems add weight and need power, which might diminish the benefits from a surface cooling system on aircraft level. A comparison of a conventional cooling system with a surface cooling system on aircraft level will be performed in future studies. The results shown in Figure 8 are for steady state cooling in the most adverse conditions. A dynamic model might reveal that requiring steady state cooling during TO is unnecessary because thermal inertia of components and fluids can cope with temporarily high heat loads that is, Q r q > Q a v . The dynamic behaviour of surface cooling systems will also be part of future work. The feasibility of using surface heat exchangers for cooling highly depends on Q r q and the requirements for T s u r f are more relaxed for H P < 1 . For the aforementioned example reducing H P to 0.5 results in a 30 K decrease in required T s u r f to about 340 K. Thus, surface cooling might be a viable option for aircraft with lower H P or can be used in combination with a conventional cooling system for aircraft with large electrification to reduce heat exchanger size and drag.

5. Conclusions and Outlook

The potential of using the existing aircraft surfaces as heat sink for the waste heat of a (hybrid-) electric drive train was investigated. First, empirical correlations were derived to predict an aircraft’s wetted area ( A w e t ) from its maximum take-off weight ( M T O W ). The database included aircraft ranging from small regional aircraft to large twin aisle aircraft. The chosen correlation was a fit of the log-log scaled data that had a coefficient of determination ( r 2 ) of 0.986. To assess the ratio of available cooling power to required cooling power ( C Q ), a simple estimation of the waste heat based on take-off thrust was used. Heat transfer from wetted surfaces was modelled via flat plate correlations. To apply them, the total A w e t was divided into five component groups: fuselage, wing, nacelles, horizontal tail and vertical tail. The mean of the relative area share was calculated for each component.
Sensitivities of the heat transfer model were studied. The flow transition had a considerable impact on the predicted heat flow. The applied methods in this work did not include accurate transition prediction. The detailed analysis of the heat transfer potential of surfaces with large laminar shares are part of future work while the results of this study may be used for concepts where turbulent flow dominates. Other sensitivities investigated were wing taper ratio and aspect ratio as well as fuselage slenderness ratio. Their impact was too small to be further considered because it was below the expected uncertainty level from the modelling simplifications. A qualitative assessment of the impact of surface heating on the aircraft’s drag was performed. When heat is added to a laminar flow region an increase in skin friction drag is expected. The opposite is true for fully turbulent flow regions where heat addition reduces skin friction drag. A quantification of the expected effects is part of future work. Combining the findings for the drag with the flow transition sensitivity of the heat transfer leads to the conclusion that surface heat exchangers should only be installed in fully turbulent flow regimes to avoid a negative impact of surface heating on the aircraft aerodynamics.
Additional area reductions to account for unusable surface area for example, windows, landing gear doors and cockpit were applied and available cooling power ( Q a v ) were calculated for a range of M T O W over the entire database and average surface temperatures ( T s u r f ) between 320 K and 400 K. Q a v was evaluated in four operating points: Take-off (TO), Hot Day Take-off (HTO), Climb (CL) and Cruise (CR). Q a v was largest in CR with about 7 MW for an A320 size aircraft and a medium T s u r f of 360 K. The most critical operating point was HTO with Q a v of only 0.25 MW for the aforementioned aircraft and T s u r f .
C Q was calculated in HTO. The smallest aircraft showed an advantage over larger aircraft with C Q values ranging from 0.2 to 1.8 depending on T s u r f compared to 0.1 to 1.0 for the largest aircraft.
The results of this study may be used to quickly assess the feasibility of a surface cooling concept for a (hybrid-) electric aircraft. Future work will include more detailed models for surface heat transfer. Instead of assuming an average T s u r f , surface heat exchangers with a hot side flow will be modelled. These models that can also be used in a dynamic simulation will allow a more detailed sizing of the thermal management system. To assess heat transfer more precisely in a 3D flow field, numerical methods will be developed Those methods may go beyond the scope of a conceptual aircraft analysis and are part of more in-depth studies later in the design process.
The impact of adding heat to the boundary layer has only been qualitatively assessed in this work. Numerical methods will help to quantify the effect. Together with improved drag predictions, mass and power estimations the concept will be compared to a similar aircraft with a conventional cooling system to quantify its benefits. In addition, structural integration of surface heat exchangers may be a challenge. The concept will be evaluated with regard to maintainability.

Author Contributions

Conceptualization, methodology, simulation, analysis and writing of all aspects of the research except for Section 3.3, H.K.; Conceptualization, methodology, simulation, analysis and writing of Section 3.3, A.L.H.; Supervision, M.H. All authors have read and agreed to the published version of the manuscript.

Funding

This research received funding as part of SynergIE, a research project supported by the Federal Ministry for Economic Affairs and Energy in the national LuFo V program. Any opinions, findings and conclusions expressed in this document are those of the authors and do not necessarily reflect the views of the other project partners.

Acknowledgments

The authors would like to thank Arne Seitz for his continued support of the research, his critical review and many fruitful discussions.

Conflicts of Interest

The authors declare no conflict of interest. The funders had no role in the design of the study; in the collection, analyses, or interpretation of data; in the writing of the manuscript, or in the decision to publish the results.

Abbreviations

SRIAStrategic Research and Innovation Agenda
TMSThermal Management System
ISAInternational Standard Atmosphere
TOTake-off
HTOHot Day Take-off
CLClimb
CRCruise
ACOCAir Cooled Oil Cooler
SACOCSurface Air Cooled Oil Cooler
APUAuxilliary Power Unit
MTOWMaximum Take-off Weight
MPLMaximum Payload
Roman Symbols
AArea
d T Temperature deviation
TTemperature
a l t Altitude
M a Mach number
QHeat rate
nNumber
RRange
r 2 Coefficient of determination
HDegree of Hybrdization
PPower
FThrust
vVelocity
N u Nusselt Number
R e Reynolds Number
A R Aspect Ratio
lLength
dDiameter
xCoordinate in flow direction
cCoefficient
DDrag Force
T R Temperature Ratio
C Q Ratio of Heat Rates
Greek Symbols
σ Standard deviation
δ Boundary layer thickness
Δ Difference
η Efficiency
α Heat transfer coefficient
λ Wing taper ratio
Λ Slenderness ratio
ρ Density
μ Dynamic Viscosity
Subscripts
w e t wetted
r q required
e x p exposed
s i m simplified
a c t actual
m a x maximum
d e s design
t o t total
a v available
t r a n s transmission
e c electric
r a d radiation
s u r f surface
ccritical
m i n minimum
ffriction
hheated
uunheated
a m b ambient

References

  1. Advisory Council for Aviation Research and Innovation in Europe. Strategic Research and Innovation Agenda: Volume 1: 2017 Update; Advisory Council for Aviation Research and Innovation in Europe: Brussels, Belgium, 2017. [Google Scholar]
  2. Yakinthos, K.; Donnerhack, S.; Misirlis, D.; Flouros, M.; Vlahostergios, Z.; Goulas, A. Intercooled Recuperated Aero Engine: Early Development Stages and Optimization of Recuperation Based on Conventional Heat Exchangers. In Proceedings of the 2nd ECATS Conference, Athens, Greece, 7–9 November 2016. [Google Scholar]
  3. Kaiser, S.; Kellermann, H.; Nickl, M.; Seitz, A. A Composite Cycle Engine Concept for Year 2050. In Proceedings of the 31st Congress of the International Council of the Aeronautical Sciences, Belo Horizonte, Brazil, 9–14 September 2018. [Google Scholar]
  4. Jacob, F.; Rolt, A.; Sebastiampillai, J.; Sethi, V.; Belmonte, M.; Cobas, P. Performance of a Supercritical CO2 Bottoming Cycle for Aero Applications. Appl. Sci. 2017, 7, 255. [Google Scholar] [CrossRef] [Green Version]
  5. Rosero, J.A.; Ortega, J.A.; Aldabas, E.; Romeral, L. Moving towards a more electric aircraft. IEEE Aerosp. Electron. Syst. Mag. 2007, 22, 3–9. [Google Scholar] [CrossRef] [Green Version]
  6. Pornet, C.; Isikveren, A.T. Conceptual design of hybrid-electric transport aircraft. Prog. Aerosp. Sci. 2015, 79, 114–135. [Google Scholar] [CrossRef]
  7. Schlabe, D.; Lienig, J. Model-Based Thermal Management Functions for Aircraft Systems; SAE Technical Paper Series; SAE International: Warrendale, PA, USA, 2014. [Google Scholar] [CrossRef] [Green Version]
  8. Wang, T.; Britcher, C.; Martin, P. Surface heat exchangers for aircraft applications—A technical review and historical survey. In Proceedings of the 37th Aerospace Sciences Meeting and Exhibit, Reno, NV, USA, 11–14 January 1999; American Institute of Aeronautics and Astronautics: Reston, VA, USA, 1999; p. 245. [Google Scholar] [CrossRef]
  9. Wilkinson, S.P. Interactive wall turbulence control. In Viscous Drag Reduction in Boundary Layers; Bushnell, D.M., Hefner, J.N., Eds.; Progress in Astronautics and Aeronautics; American Institute of Aeronautics and Astronautics: Reston, VA, USA, 1990. [Google Scholar]
  10. Sousa, J.; Villafañe, L.; Paniagua, G. Thermal analysis and modeling of surface heat exchangers operating in the transonic regime. Energy 2014, 64, 961–969. [Google Scholar] [CrossRef] [Green Version]
  11. European Commission. Surface Heat Exchangers for Aero-Engines; European Commission: Brussels, Belgium, 2016. [Google Scholar]
  12. European Commission. Surface Heat Exchangers For Aero Engines 2; European Commission: Brussels, Belgium, 2019. [Google Scholar]
  13. European Commission. Aerodynamic upgrade of Surface Air Cooled Oil Cooler; European Commission: Brussels, Belgium, 2019. [Google Scholar]
  14. Sakuma, Y.; Saito, H.; Watanabe, T.; Himeno, T.; Inoue, C.; Tomida, S.; Takahashi, N. Conjugate Heat Tansfer Analysis on Plate Fin Surface Air Cooled Oil Cooler. In Proceedings of the Shanghai 2017 Global Power and Propulsion Forum, Shanghai, China, 30 October–1 November 2017. [Google Scholar]
  15. Liu, J.; Peck, J.; Yazawa, K.; Fisher, T.S.; Shih, T.I.P. Bypass, Loss, and Heat Transfer in Aircraft Surface Coolers. Front. Mech. Eng. 2019, 5, 219. [Google Scholar] [CrossRef]
  16. Kellermann, H.; Habermann, A.L.; Vratny, P.C.; Hornung, M. Assessment of Fuel as Alternative Heat Sink for Future Aircraft. Appl. Therm. Eng. 2019. under review. [Google Scholar]
  17. Jenkinson, L.; Simpkin, P.; Rhodes, D. Civil Jet Aircraft Design; American Institute of Aeronautics and Astronautics, Inc.: Washington, DC, USA, 1999. [Google Scholar] [CrossRef]
  18. Boeing Commercial Airplanes. 747-8 Airplane Characteristics for Airport Planning; Boeing Commercial Airplanes: Seattle, WA, USA, 2012. [Google Scholar]
  19. Airbus S.A.S. A350 Aircraft Characteristics Airport and Maintenance Planning; Airbus S.A.S.: Blagnac, France, 2016. [Google Scholar]
  20. Torenbeek, E. Synthesis of Subsonic Airplane Design: An introduction to the Preliminary Design of Subsonic General Aviation and Transport Aircraft, with Emphasis on Layout, Aerodynamic Design, Propulsion and Performance; Springer: Dordrecht, The Netherlands, 2010. [Google Scholar]
  21. Pornet, C.; Gologan, C.; Vratny, P.C.; Seitz, A.; Schmitz, O.; Isikveren, A.T.; Hornung, M. Methodology for Sizing and Performance Assessment of Hybrid Energy Aircraft. In Proceedings of the 2013 Aviation Technology, Integration, and Operations Conference, Los Angeles, CA, USA, 12–14 August 2013; American Institute of Aeronautics and Astronautics: Reston, VA, USA, 2013; p. 35. [Google Scholar] [CrossRef]
  22. Lorenz, L.; Seitz, A.; Kuhn, H.; Sizmann, A. Hybrid Power Trains for Future Mobility. In Proceedings of the 62. Deutscher Luft- und Raumfahrtkongress, Stuttgart, Germany, 10–12 September 2013; Deutsche Gesellschaft für Luft- und Raumfahrt: Bonn, Germany, 2013. [Google Scholar]
  23. Haaland, S.E. Simple and Explicit Formulas for the Friction Factor in Turbulent Pipe Flow. J. Fluids Eng. 1983, 105, 89. [Google Scholar] [CrossRef]
  24. Incropera, F.P.; DeWitt, D.P.; Bergman, T.L.; Lavine, A.S. Principles of Heat and Mass Transfer, 7th ed.; International Student Version; Wiley: Singapore, 2013. [Google Scholar]
  25. Schultz-Grunow, F. New frictional resistance law for smooth plates. Luftfahrtforschung 1940, 1940, 239–246. [Google Scholar]
  26. Henninger, J.H. Solar Absorptance and Thermal Emittance of Some Common Spacecraft Thermal-Control Coatings; NASA Goddard Space Flight Center: Greenbelt, MD, USA, 1984. [Google Scholar]
  27. Arnal, D.; Reneaux, J.; Casalis, G. Numerical and Experimental Studies Related to Skin Friction Drag Reduction Problems. Proceedings of the Colloquium Transitional Boundary Layers in Aeronautics. 1996. Available online: https://www.dwc.knaw.nl/DL/publications/PU00011219.pdf (accessed on 19 November 2019).
  28. Reshotko, E. Drag Reduction by Cooling in Hydrogen-Fueled Aircraft. J. Aircr. 1979, 16, 584–590. [Google Scholar] [CrossRef]
  29. Masad, J.A.; Nayfeh, A.H. Laminar flow control of subsonic boundary layers by suction and heat–transfer strips. Phys. Fluids A Fluid Dyn. 1992, 4, 1259–1272. [Google Scholar] [CrossRef]
  30. Dovgal, A.V.; Levchenko, V.; Timopeev, V.A. Boundary Layer Control by a Local Heating of the Wall. In Laminar-Turbulent Transition; Springer: Berlin/Heidelberg, Germany, 1990; pp. 113–121. [Google Scholar]
  31. Kramer, B.; Smith, B.; Heid, J.; Noffz, G.; Richwine, D.; Ng, T. Drag reduction experiments using boundary layer heating. In Proceedings of the 37th Aerospace Sciences Meeting and Exhibit, Reno, NV, USA, 11–14 January 1999. [Google Scholar] [CrossRef]
  32. Lin, J.C.; Ash, R. Wall temperature control of low-speed body drag. J. Aircr. 1986, 23, 93–94. [Google Scholar] [CrossRef]
  33. Hoerner, S.F. Fluid-Dynamic Drag: Theoretical, Experimental and Statistical Information; Hoerner Fluid Dynamics: Bakersfield, CA, USA, 1965. [Google Scholar]
  34. Schlichting, H.; Gersten, K. Boundary-Layer Theory; Springer: Berlin/Heidelberg, Germany, 1979. [Google Scholar] [CrossRef]
  35. Spalart, P.R.; Watmuff, J.H. Experimental and numerical study of a turbulent boundary layer with pressure gradients. J. Fluid Mech. 1993, 249, 337–371. [Google Scholar] [CrossRef]
  36. Ohta, S. Temperature Classes of Electrical Insulators. Three Bond Technical News, 1 December 1985. [Google Scholar]
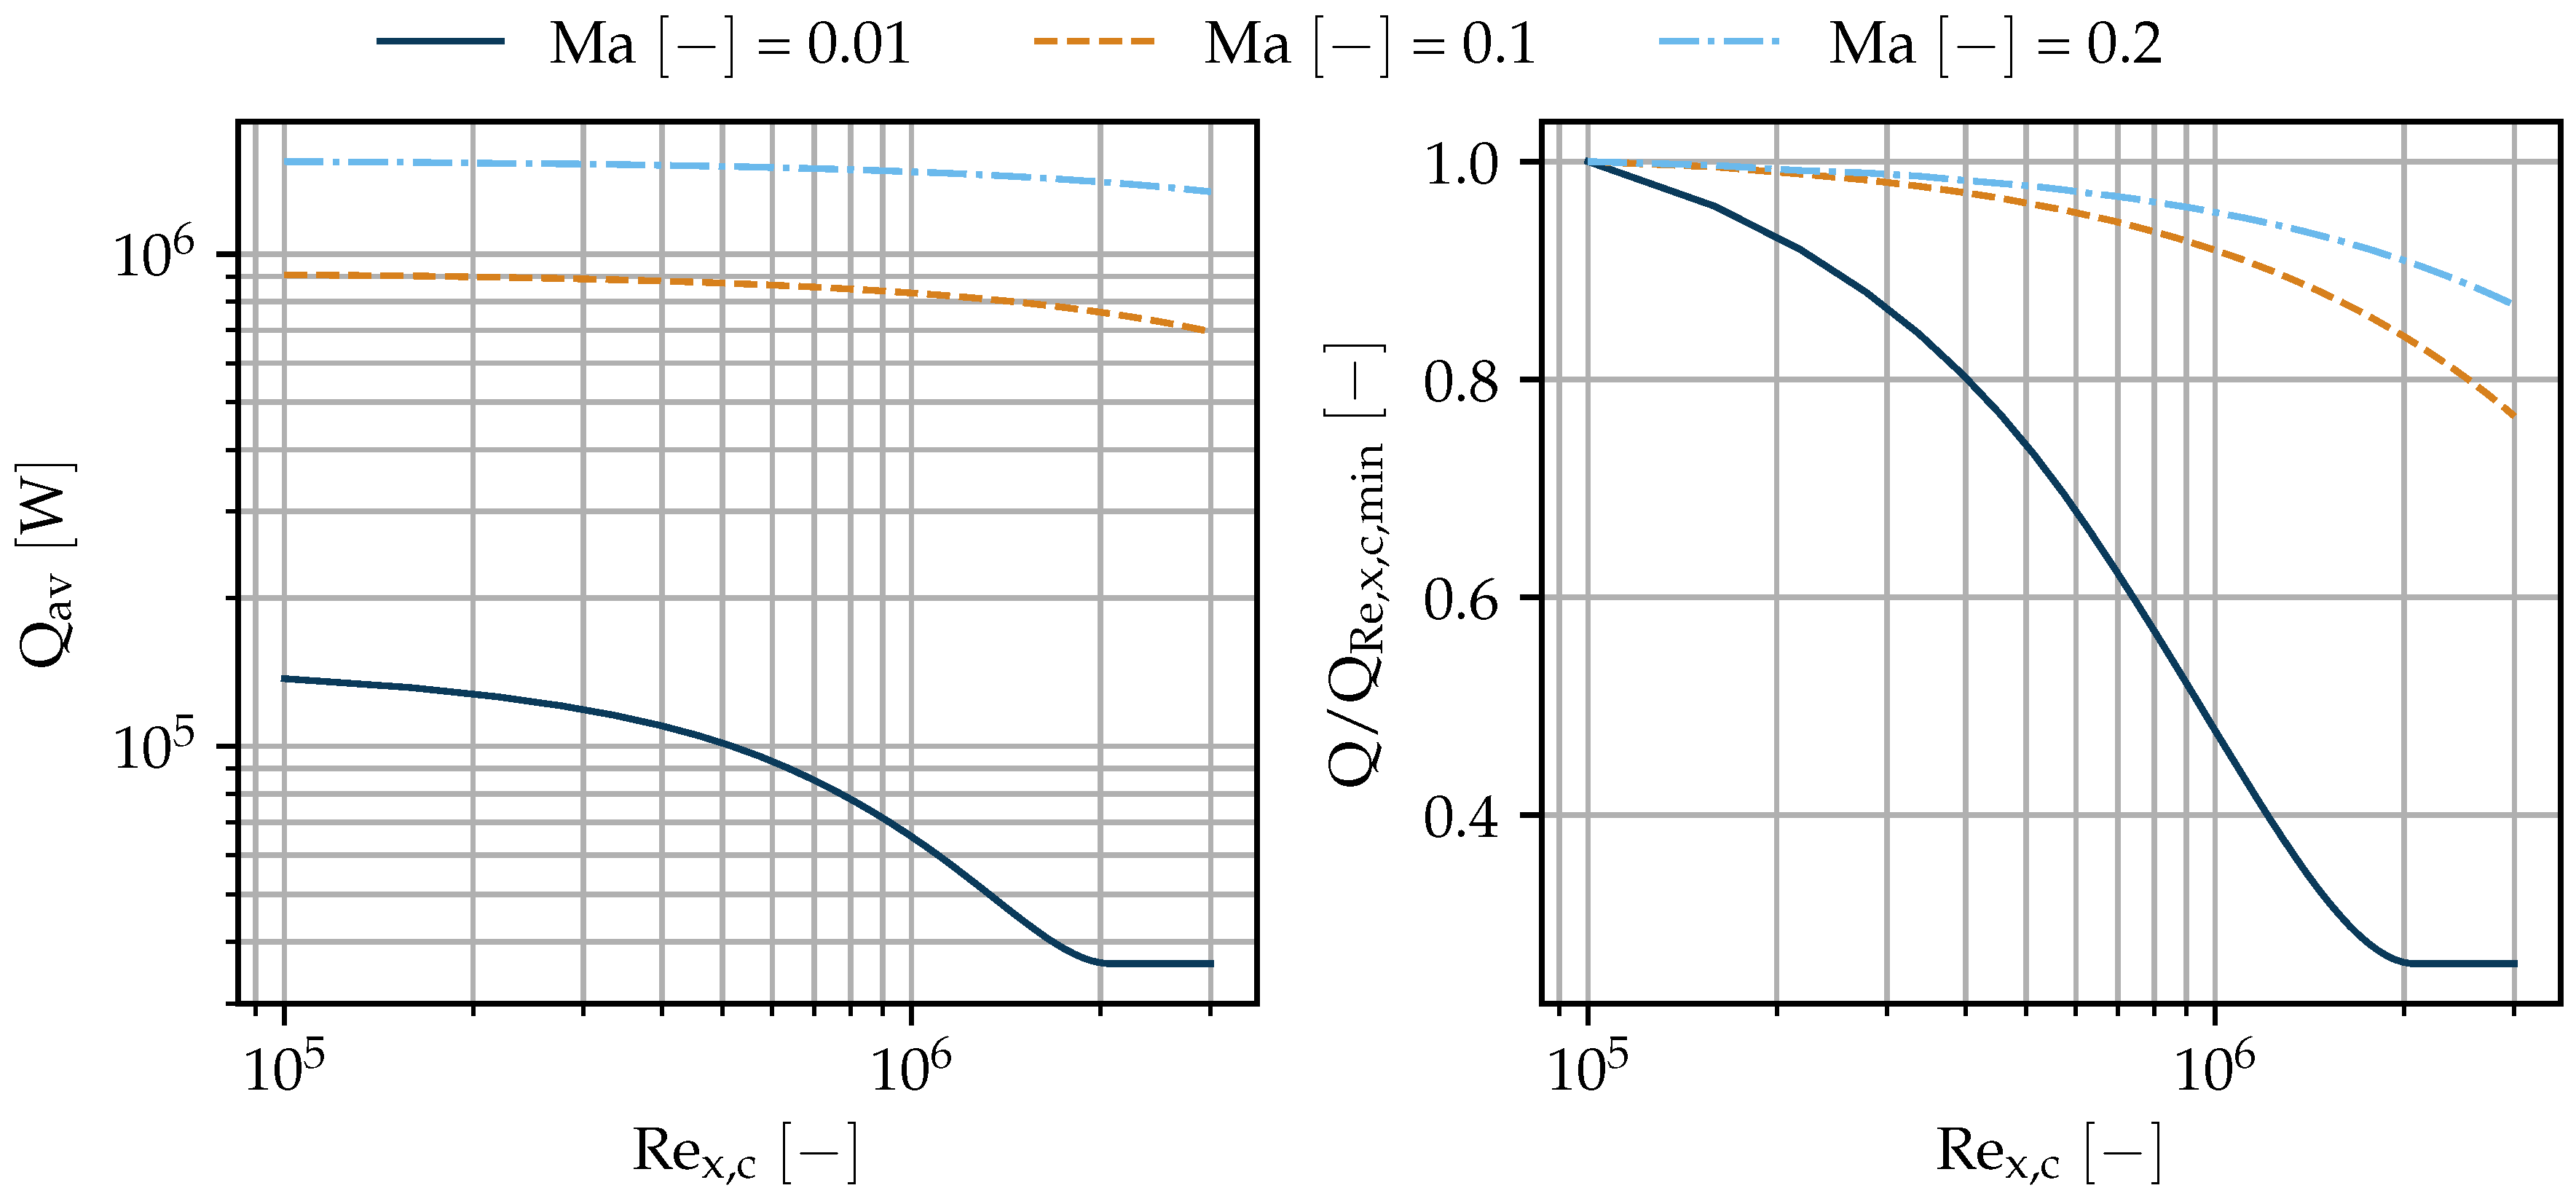
Figure 1. A w e t correlations with data from References [17,18,19].
Aerospace 07 00001 g001
Figure 2. M T O W F T O correlation with data from References [17,18,19].
Aerospace 07 00001 g002
Figure 3. Transitional Reynolds number sensitivity.
Aerospace 07 00001 g003
Figure 4. Wing aspect ratio sensitivity.
Aerospace 07 00001 g004
Figure 5. Local heat transfer coefficient for different Mach number–wing aspect ratio combinations.
Aerospace 07 00001 g005
Figure 6. Theoretical impact of wall heating/cooling on a smooth flat plate turbulent boundary layer density, skin friction coefficient, skin friction drag force and boundary layer 99 % thickness compared to an unheated wall. Valid for R e x = 10 6 10 8 .
Aerospace 07 00001 g006
Figure 7. Q a v in multiple operating points for aircraft equipped with surface heat exchangers.
Aerospace 07 00001 g007
Figure 8. Comparison of Qav and Qrq for hybrid electric aircraft in hot day take-off conditions. (a) Ratio of Qav to Qrq for different Tsurf. (b) Required Tsurf to achieve CQ = 1.
Aerospace 07 00001 g008
Table 1. Comparison of simplified A w e t with actual A w e t .
Component A sim ( m 2 ) A act ( m 2 ) Δ A , wet ( % )
Fuselage478.0412.9+15.8
Wing202.4208.7−3.0
Nacelles55.852.4+6.4
Horizontal tail48.449.6−2.4
Vertical tail42.243.3−2.7
Total826.8766.97.8
Table 2. Coefficients for log-log surface area fits.
xac r 2
M T O W 0.748−0.6890.986
n m a x 0.9400.8870.963
M P L 0.855−0.6680.965
R d e s 0.995−0.4170.859
Table 3. A w e t , i / A w e t , t o t for each component.
Component A wet , i / A wet , tot ( % ) σ ( % )
Fuselage493.80
Wing313.55
Nacelles71.49
Horizontal Tail81.21
Vertical Tail50.83
Table 4. Wing sensitivity study parameters.
ParameterValue
A e x p 200 m 2
A R 12
λ 0.29
R e x , c 5 × 10 5
T s u r f 320 K
Table 5. Investigated operating points.
Opearting Point Ma (-) alt (m) dT ISA (K)
TO 0.2 00
HTO 0.2 0 + 20
CL 0.5 50000
CR 0.8 10,0000
Table 6. Values for the estimation of Q r q .
η t r a n s 0.5
η e c 0.9
H P 1.0
M a T O 0.2