1. Introduction
Design of a turbine stage requires a gap between the non-moving stator wall and the rotating blade disk below the hub endwall surface. Air within the rim seal cavity begins to swirl due to momentum imparted on the fluid through boundary layer interaction with the rotor disk. Turbine flow interactions near rim seals are highly influential in turbomachinery design, affecting the aerothermal performance of the stage. In many designs, additional cooling air to prevent ingestion of the hot main annulus gas into the turbine disc cavity are required. The specific rim seal design may affect the aerodynamic losses associated with interaction of the cooling air and the main turbine gas flow. As the system of swirl develops, a system of high- to low-pressure cells moves within the rim seal cavity. The cells are identified by Cao et al. in a computational and experimental study of a two-stage turbine [
1]. The results conclude that eight unsteady structures are moving at 90% to 97% of the rotor speed. The structures present are independent of blade passing events. A good understanding of the unsteady structures in the rim seal cavity are essential in improving the aero-thermal performance characteristics of an axial flow turbine.
In Phadke and Owen’s three-part investigation into the sealing of gas turbine rotor stator systems, they found two separate mechanisms controlling the ingestion of fluid from the main gas path into the wheel space [
2,
3,
4]. The authors tested simple seal arraignments between a rotating and stationary disk with an empty outer annulus. They had the ability to vary seal geometry, rotor speed, purge flow rate, and annulus flow rate. Additionally, they could create pressure variations in the annulus. Their evaluation included flow visualization, concentration measurements, and pressure measurements. At small values of
Rew/Reθ, where
Rew is the Reynolds number of the annulus flow and
Reθ is the rotational Reynolds number, the required purge flow rate to seal the wheel space increased with increasing
Reθ. At large values of
Rew/Reθ the required purge flow rate to seal the wheel space was independent of
Reθ and was most strongly dependent on the pressure variation in the annulus. The physical mechanisms controlling these two regimes have become known as rotationally induced (RI) and externally induced (EI) ingress, respectively.
Owen et al. [
5] examined the cause of EI ingress with an orifice model and compared the results to experimental data and three-dimensional computational fluid dynamics (CFD). Like Phadke and Owen, they found the pressure differential in the main gas path to have a strong correlation with ingress. Areas with static pressure higher than that of the wheel space caused ingress, while areas with lower static pressure caused egress from the wheel space into the main gas path. The regions of high pressure in the hot gas path are caused by the vane wakes and low static pressure is caused by the clean flow through the vane passages. It was also shown by Owen that the shape of the circumferential pressure variation was of secondary importance to the pattern of ingestion.
Sangan, Lalwani, Owen, and Lock [
6] explained RI ingress using a basic fluid dynamics argument. A rotating disk in a stationary fluid will develop a boundary layer over the disk and fluid will be ejected radially; this is known as disk pumping. Conservation of mass must be satisfied, and to counter the fluid being ejected radially, fluid will be entrained axially towards the rotating disk. In a turbomachinery, opposite the rotating disk would be a stationary disk. Separate boundary layers form on the two disks with a core of rotating fluid between them. The centrifugal force on the core fluid is balanced by a radially inward pressure gradient. The radial pressure gradient is created by core fluid moving slower at a lower radius than at higher radii. Near the stationary wall, the rotation of the fluid is diminished by the no-slip condition, leaving it with lower centrifugal force than that supplied by the radial pressure gradient. The radial pressure gradient thus causes fluid to move down the wall of the stationary disk. This movement of fluid along the stator wall causes ingress of air from the main gas path into the wheel space. Ingress of fluid from the main gas path can be reduced or eliminated by the use of purge flow. Purge flow balances the mass conservation of fluid leaving the wheel space due to disk pumping and prevents fluid from being ingested along the stator wall.
Many studies focus on single radial or axial type rim seals, however, double rim seals are often more engine representative and are capable of sealing the wheel space with less purge flow. Phadke and Owen [
4] showed with flow visualization that flow entering the wheel space of a single rim system was capable of traversing large portions of the wheel space. When a double rim seal was installed, flow entering the wheel space was confined to the outer region and did not cross the second rim seal, as shown in their flow visualization study.
Jakoby et al. [
7] presented comparisons of three different types of computational studies. The test that best represents the structures within the rim seal cavity is a complete 360-degree analysis. The rim seal cavity produced three unsteady structures, and they are moving at 80% of the rotor speed. The geometry does not include the vanes or blades but simulates them by imposing static pressure fields as their boundaries. Four separate models were used. The first two models were 22.5° sector models including nozzle guide vanes (NGV), rotating blades, and additional vanes behind the blades. One modeled both wheel spaces in front of and behind the blade and the second contained only the front wheel space. The other two models contained only the wheel space and an empty portion of the main annulus above the wheel space. Of the two empty annulus models, one was a sector model of 22.5°. The other was a 360° model. The models with blades and vanes most closely matched experimental results for cases with a significant amount of purge flow; static pressures along the stationary walls of the wheel space were used for the comparison. The 360° model most closely matched the experimental results for low purge flow conditions and three low frequency structures rotating at 80 percent rotor speed within the wheel space. Under low purge flow conditions, experimental results with fast response pressure probes showed low-frequency pulsations that were unrelated to blades or vanes. As purge flow was increased, the magnitude of the low-frequency pulsations was reduced and eventually eliminated. The sector model version of the empty annulus model significantly over predicted sealing effectiveness while the 360° model only slightly over predicted sealing effectiveness compared to experimental results. This indicated that the low-frequency rotating structures had a significant impact on ingestion. It was concluded that the sector model, using periodicity, would not be appropriate to capture these low-frequency phenomena found under low purge flow situations.
A computational study performed by Julien et al. [
8] includes a sector model of a model with 44 inlet guide vanes and 58 rotor blades. The model shows about 30 structures within the rim seal cavity; they are moving at 90% of the rotor speed. A variety of purge injection rates in multiple tests showed that increasing the injection rate causes these structures to dissipate. The results are highly dependent on the design of the rim seal cavity.
A full unsteady 360-degree study based on the axial flow turbine test rig at Arizona State by Wang et al. [
9] also has found evidence of the unsteady structures within the rim seal cavity. In this study, the structures are found to correspond with ingress and egress out of fluid from the mainstream to the rim seal cavity. There are 12 cells moving at 87% of the rotor speed. They also observed that the cells dissipate at higher purge flow rates. A criticism by Mirzamoghadam et al. was written claiming that the structures found may be a transient phenomenon that is caused by an insignificant number of revolutions of the rotor performed to resolve the case to a satisfactory solution [
10].
The results concur that the cell size, shape, and speed are dependent on the design of the rim seal cavity and not the number of blades or vanes of the stage. A larger, more unobstructed cavity tends to lead toward larger pressure structures in smaller quantities that each take up greater azimuthal angles within the rim seal cavity. The current design is going toward smaller and more complex cavities than those tested by Cao et al. [
1] and Jakoby et al. [
7]. The new cavity designs have smaller and more numerous structures, each structure taking up a smaller azimuthal angle. These structures can be measured using fast response aerodynamic probes on the surface of the stator wall or the rotor disk, as Palafox et al. have done so [
11]. They can also be simulated using a partial sector of the rim seal cavity if the sector is picked while keeping the number of structures in mind.
Basol et al. [
12] at ETH Zurich studied a complete annulus solution by using a GPU powered unsteady Reynolds-averaged Navier–Stokes (URANS) solver. Two different cases based on experimental geometries were used. In the first case using a 0.4% injection rate, no unsteady structures were found. The injection rate percentage is with respect to the main flow rate. In the case with a higher injection rate (0.9% injection rate) a separation bubble was located inside the cavity. The separation gave rise to unsteady structures within the rim seal cavity.
Additionally, it was found that the magnitude of the sinusoidal static pressure distribution is more significant when a full 360° annular model than a model of 20° sector. Both models correctly predict the correct number of peaks and troughs. Palafox et al. [
13] also made a computational effort for modeling hot gas ingestion in a 1.5-Stage Turbine Wheelspace Hot Gas Ingestion Rig (HGIR).
Beard, Chew, Gao, and Chana [
14] presented results to clarify the flow physics involved in rim sealing flows and to provide high-quality experimental data for use in evaluation of CFD models. Unsteady pressure measurements from radially and circumferentially distributed transducers are presented for flow in a rotor–stator disc cavity and the rim seal without imposed external flow. Distinct frequencies are identified in the cavity flow and detailed analysis of the pressure data associates these with large-scale flow structures rotating about the axis. This confirms the occurrence of such structures as predicted in previously published CFD studies and provides new data for detailed assessment of CFD models.
The goal of this paper is to correctly measure the speed and number of unsteady structures within the rim seal cavity experimentally, using the Axial Flow Turbine Research Facility at The Pennsylvania State University. With reliable data from an experimental rig, the next step is to use the results to guide our computational efforts. The ultimate goal is being able to predict and accurately reproduce measured unsteady structures within the experimental rig with a present computational URANS method.
2. Experimental Setup
2.1. Turbine Research Facility
The current configuration of the Axial Flow Turbine Research Facility (AFTRF) has 29 nozzle guide vanes and 36 blades in its rotor. It is a large-scale (0.916 m (36.08 inches)) diameter, long-duration, low-speed turbine test stage that simulates state-of-the-art turbine blades, nozzle guide vanes, and rim seal cavity flows. A downstream, four-stage axial flow fan system can provide the turbine with 40 inches of water (10,000 Pa) pressure drop and a maximum flow rate of 10 kg/s.
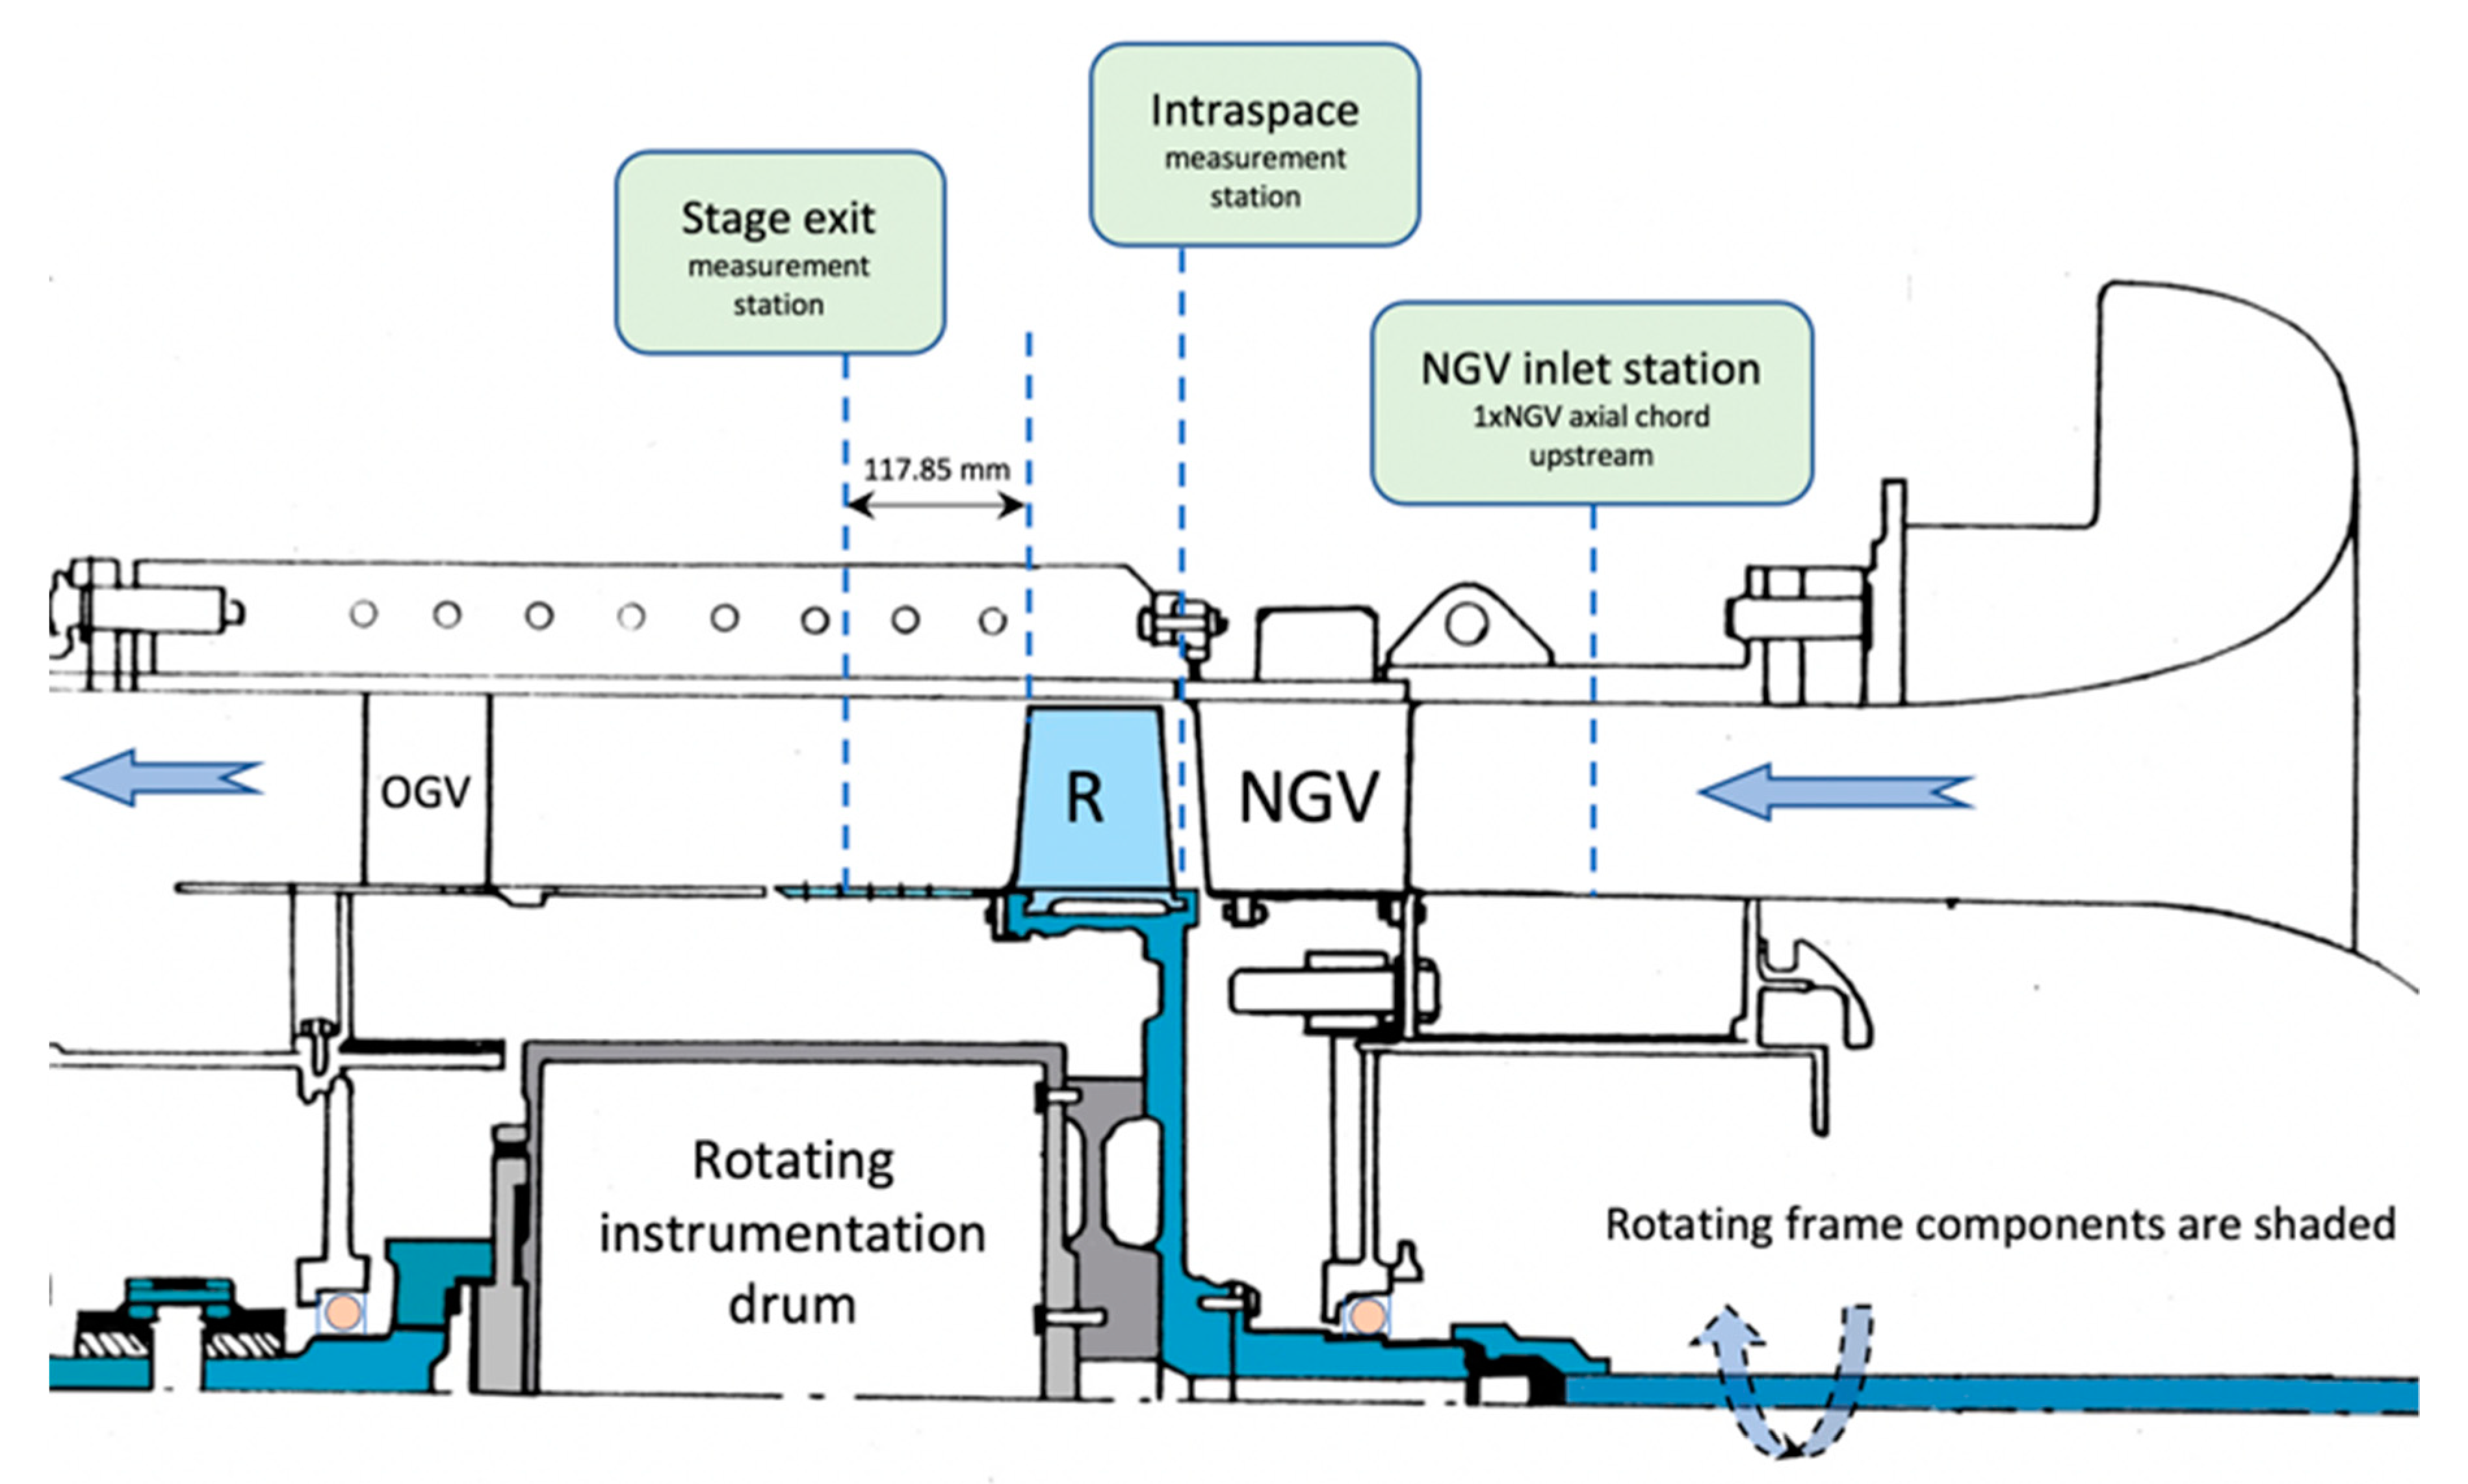
The AFTRF as shown in
Figure 1 is an open-circuit turbine rig of cold flow type with atmospheric inlet temperature and pressure. The bell-mouth type inlet of the facility is followed by the test section containing a single high-pressure (HP) turbine stage. The rotor assembly generates around 80 HP of power with a typical temperature drop of 5–70 K across the turbine stage. A water-cooled eddy current brake (ECB) absorbs the power generated in the turbine rotor. The rotational speed control is as accurate as ±1 rpm. Lakshminarayana, Camci, Halliwell, and Zaccaria [
15], and Town [
16] explain the technical characteristics of the rig in detail.
The inlet characteristics of the flow entering the NGV is reported by Town [
16]. The Reynolds number of the flow based on the nozzle-exit-velocity and the axial-chord is in the range of 900,000 to 1,000,000. For the rotor, the rotor Reynolds number calculated using the relative inlet velocity is in the range of 250,000 to 450,000. The Reynolds numbers in the turbine stage are representative of a modern HP turbine stage, as explained in Camci [
17]. The rotor blades have a span of h = 123 mm with the hub to tip ratio of 0.732. The absolute flow exits the rotor blade tip at an angle of 25.160° measured from the axial direction.
2.2. Aerodynamic Instrumentation
The instantaneous performance of the rotor is monitored with an array of Pitot probes, Kiel probes (United Sensors Corp., Amherst, NH, USA), variable-reluctance transducers (DP15), and multiplexed differential pressure transducers (ZOC22B/32Px-2.5psid) manufactured by Validyne Corp., Northridge, CA, USA. Endevco piezo-resistive unsteady pressure sensors (8507C-1) and Endevco amplifiers (Model 136) are used to monitor the rim seal chamber unsteady pressures that form the current discussions in this paper. The Endevco sensors and amplifiers are manufactured by Meggitt Sensing Systems, Irvine, CA, USA.
2.3. Purge Flow System
A 300 psi compressed air system supplies the rim seal cavity purge flow generator. The purge injection system used in this study required a few minor modifications to the originally designed purge flow generator by McLean. The general characteristics of this system are described in two papers by McLean, Glezer, and Camci [
18,
19]. A fixed-flow type flow regulator varies the amount of air being supplied as purge, and an ASME calibrated orifice measures the purge mass flow rate. All data is recorded using scripts through a LabVIEW interface and Compact-DAQ data acquisition system from National Instruments, Austin, TX, USA. A 16-bit 32-channel analog-to-digital converter from National Instruments (NI 9205) is used to acquire signals from the amplifiers and signal conditioners.
2.4. Unsteady Pressure Measurements in the Rim Seal Cavity
The structures within the rim seal cavity affect ingress and egress patterns. Previous literature has shown that these structures have an alternating pattern of high and low static pressure. It is possible to calculate the speed and the number of structures present at any given time if at least two fast response probes are held at a known distance apart and can take data simultaneously. Two unsteady transducers manufactured by Endevco (8507C-1) are used to measure the unsteady structures.
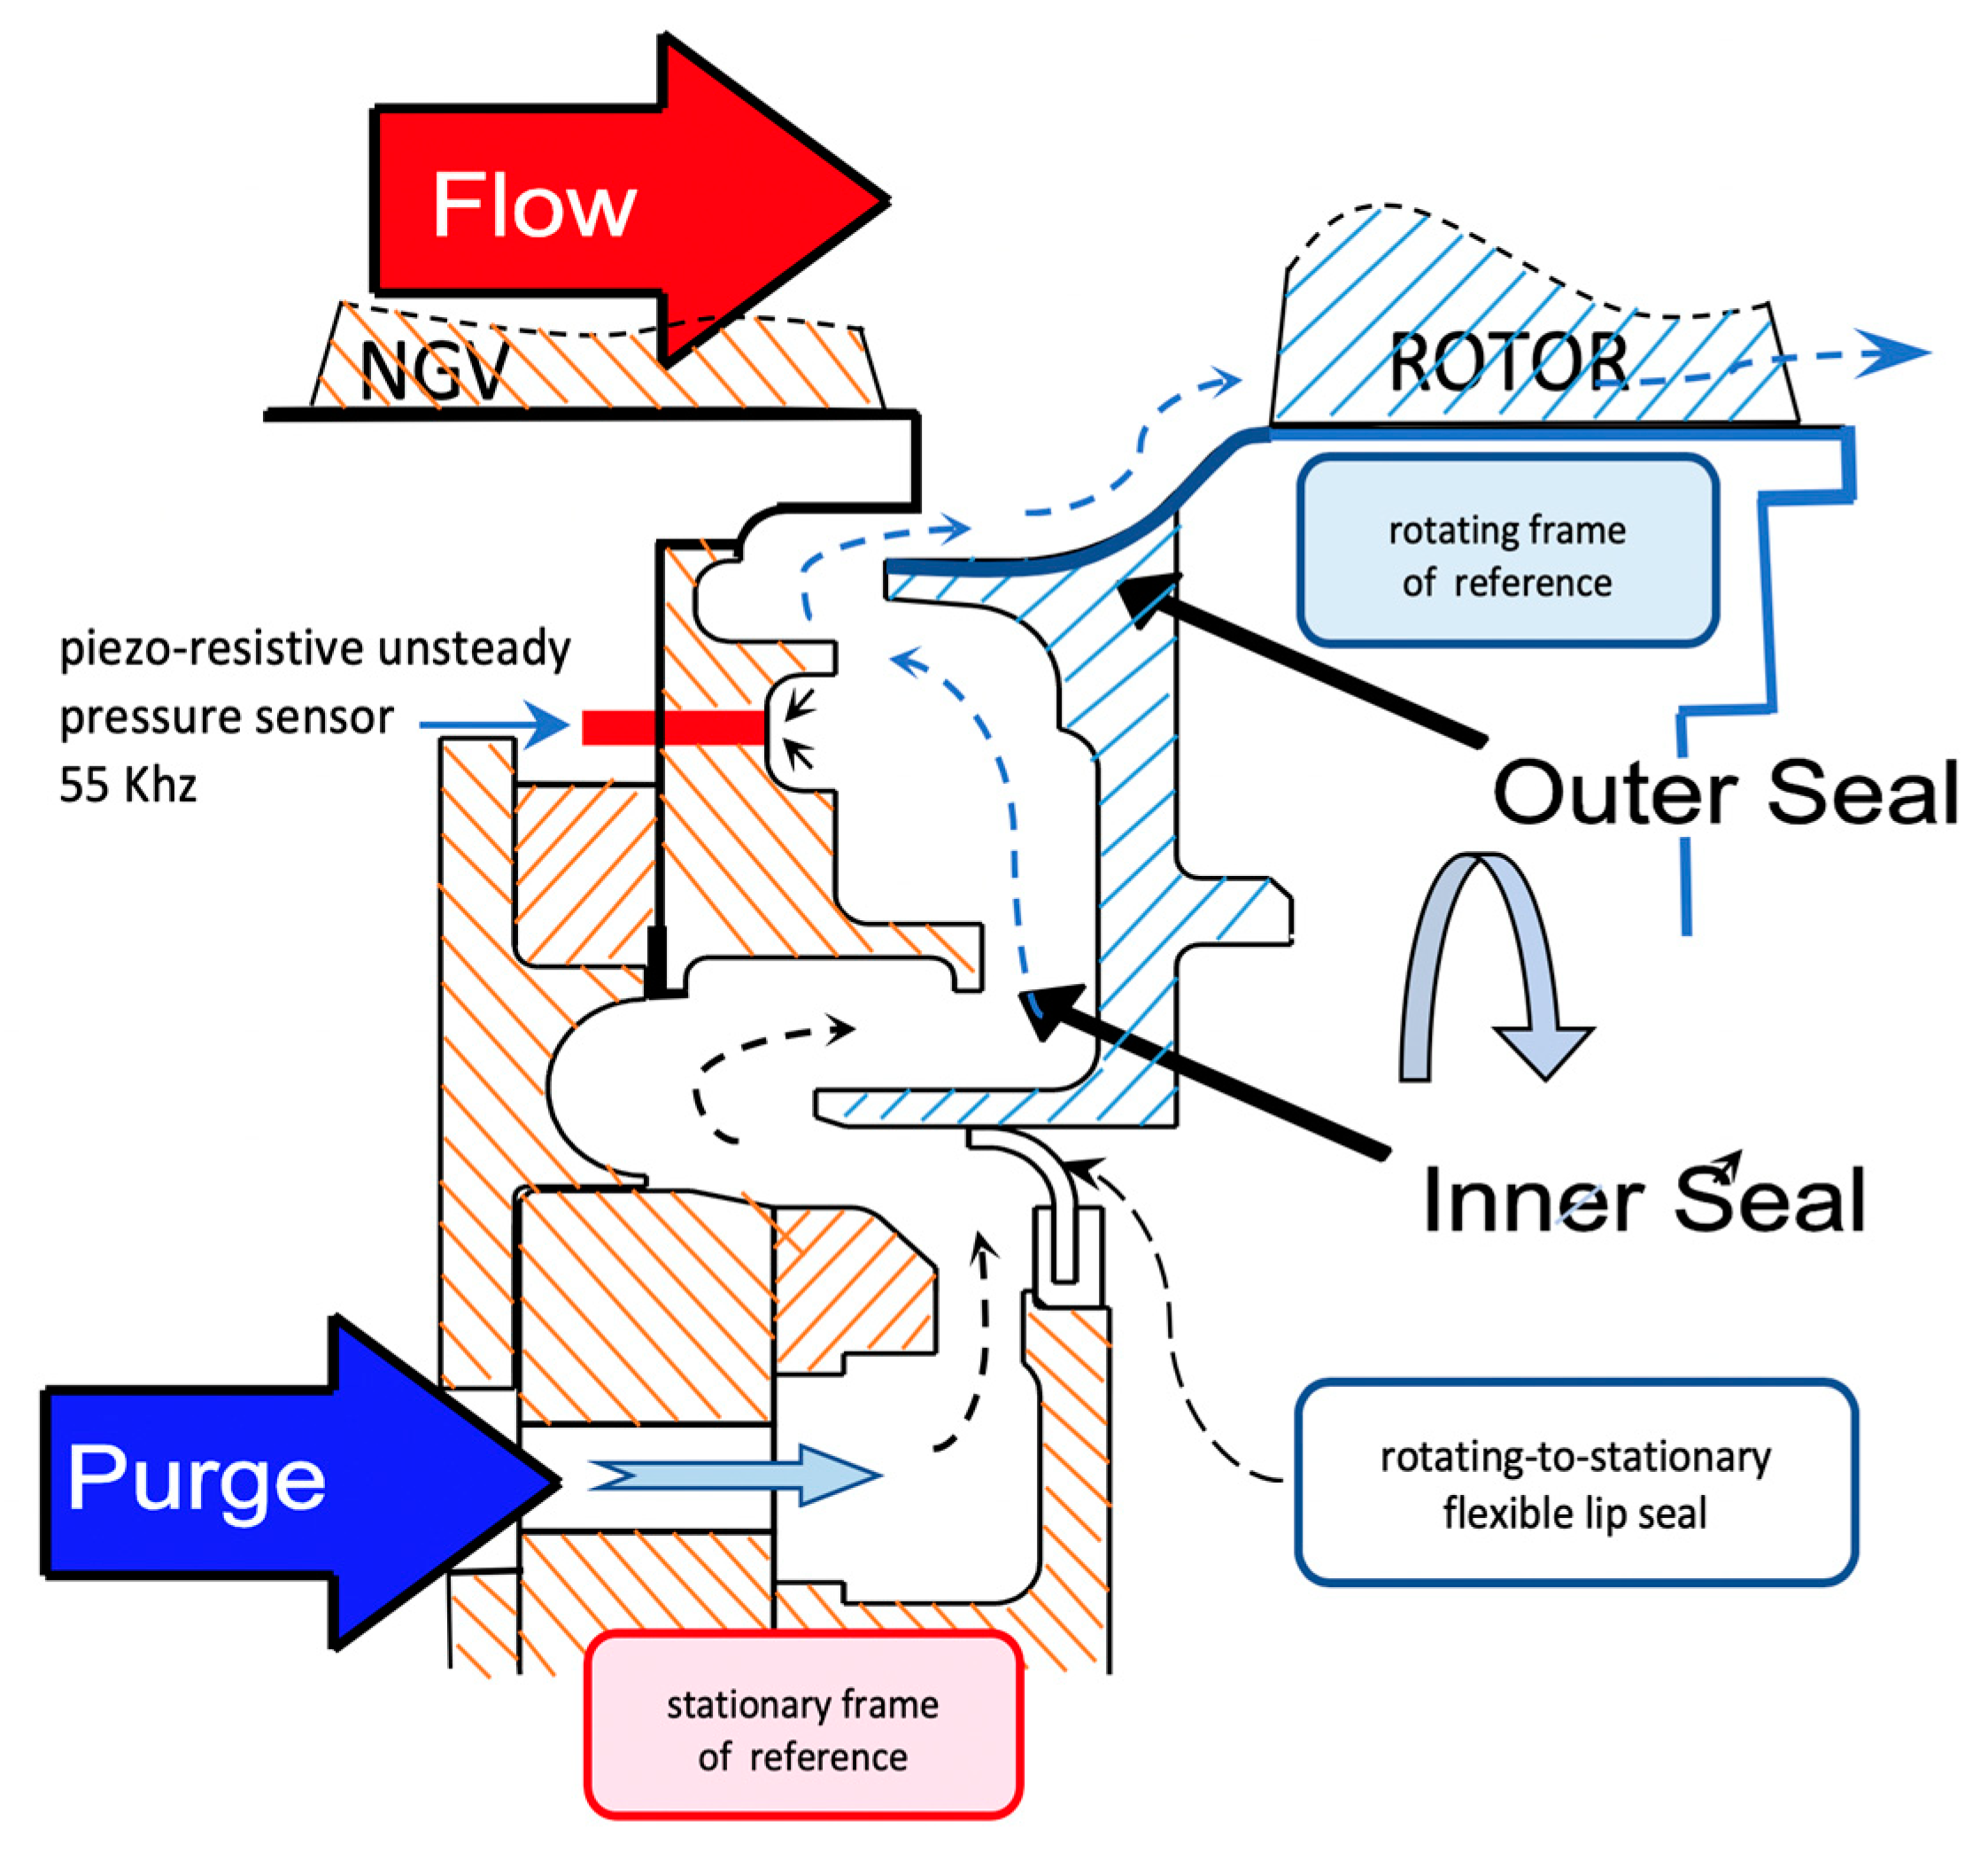
Figure 2 shows a sketch of the rim seal cavity including a double radial seal. The geometry is classified as a double radial seal.
Figure 2 also indicates the radial position of the flush mounted unsteady pressure sensor. The cavity that the red marked transducers in
Figure 2 are located next to is referred to as the buffer cavity, it is located between the outer and inner seals. Below the inner seal is a serpentine path that the injected purge flow must take to the rim seal cavity. This rim seal flow path is designed to fit within our existing experimental rig and is used for flow mixing and settling from the periodic inlets located around the inner perimeter of the annulus. Averbach [
20] explains other pertinent details of the rim seal chamber design.
The two pressure transducers are located 5° apart at the same radial position.
Figure 3 shows the flush-mounted piezo-resistive pressure transducers (Endevco Model 8507C-1) that are marked in red colored circular areas. In using our method, at least two probes that can take data simultaneously are necessary to calculate the speed and number of structures within the rim seal cavity.
2.5. Experimental Uncertainty Estimates
Experimental uncertainty estimates of the measured turbine and rim seal chamber parameters are given in
Table 1. The Endevco probe measures unsteady pressures behind the rotor from the stationary frame. Two ZOC22B/32Px units are used to measure blade and vane loading. The ZOC22B/32Px-1psid unit is used to measure vane loading, and the more robust ZOC22B/32Px-2.5psid unit measures blade loading in the rotating frame of reference. Details of the experimental approach are included in Town [
16] and Averbach [
20].
2.6. Unsteady Flow Structures in the Rim Seal Cavity
The unsteady structures in the rim seal cavity each have a unique pressure peak that must shift across the transducers at different times. The modern data acquisition system is set to take data from both piezo-resistive pressure probes simultaneously. A prescribed sample rate controlled by the internal clock of the data acquisition device is set so that a time difference can be calculated. The time difference is set by identifying the peak pressure of each unsteady structure and calculating the time difference via the number of samples taken for that peak to pass from one transducer to another. This time difference can be used to calculate the fractional speed at which the structures are moving within the rim seal chamber as shown in Equation (1). In our case,
is a known value of 5°.
Unsteady structures will rotate at a fraction of the rotor’s angular velocity. Additionally, the number of structures can be obtained by dividing the number of structures that pass by the transducer each second and dividing it by the estimated frequency at which each unique structure passes by the transducer. Equation (2) defines the number of structures as follows:
3. Experimental Results
Table 2 shows the two experimental test cases along with target speed and purge flow rate. The rotor speed is a corrected value based on the current atmospheric temperature. Typically, the laboratory reached thermal equilibrium when the rotor was near 1430 rpm. Purge mass flow injection rate (
) is defined as the mass rate of the fluid being injected into the rim seal cavity externally. Two cases were set, one where no purge flow is used and the rate is at 0.00% of the main gas path flow rate. The target was at 0.25% of the main gas path flow rate. However, a rate of 0.28% was more convenient to set experimentally. Measurements were performed at 100,000 samples per second for 60 s to achieve a statistically significant number that can later be compared to the results from the computational RANS-based solution.
The test “Case 2”, where the purge flow injection rate was held at 0.00% of the inlet mass flow to the turbine, did not produce results that could be separated from the noise in the signal. As such, the results discussed in this paper will not include “Case 2”.
Experimental results were processed in the frequency spectrum. MATLAB employs transformations to convert the pressure signal into the frequency domain using fast Fourier transform (FFT) functions. Results are given as a function of occurrences per rotor revolution (
); the transformation is given below.
The current FFT approach quickly completes the transformations by reducing the complexity of the equation. The fast Fourier transformation was accomplished by adding zeros to the end of the equation until the length is a power of two. The total number of samples for a 60-s run at 100,000 samples per second amounts to 6,000,000 samples. An optimization routine in the current transformation increases the length of the samples to 223, or 8,388,608 samples.
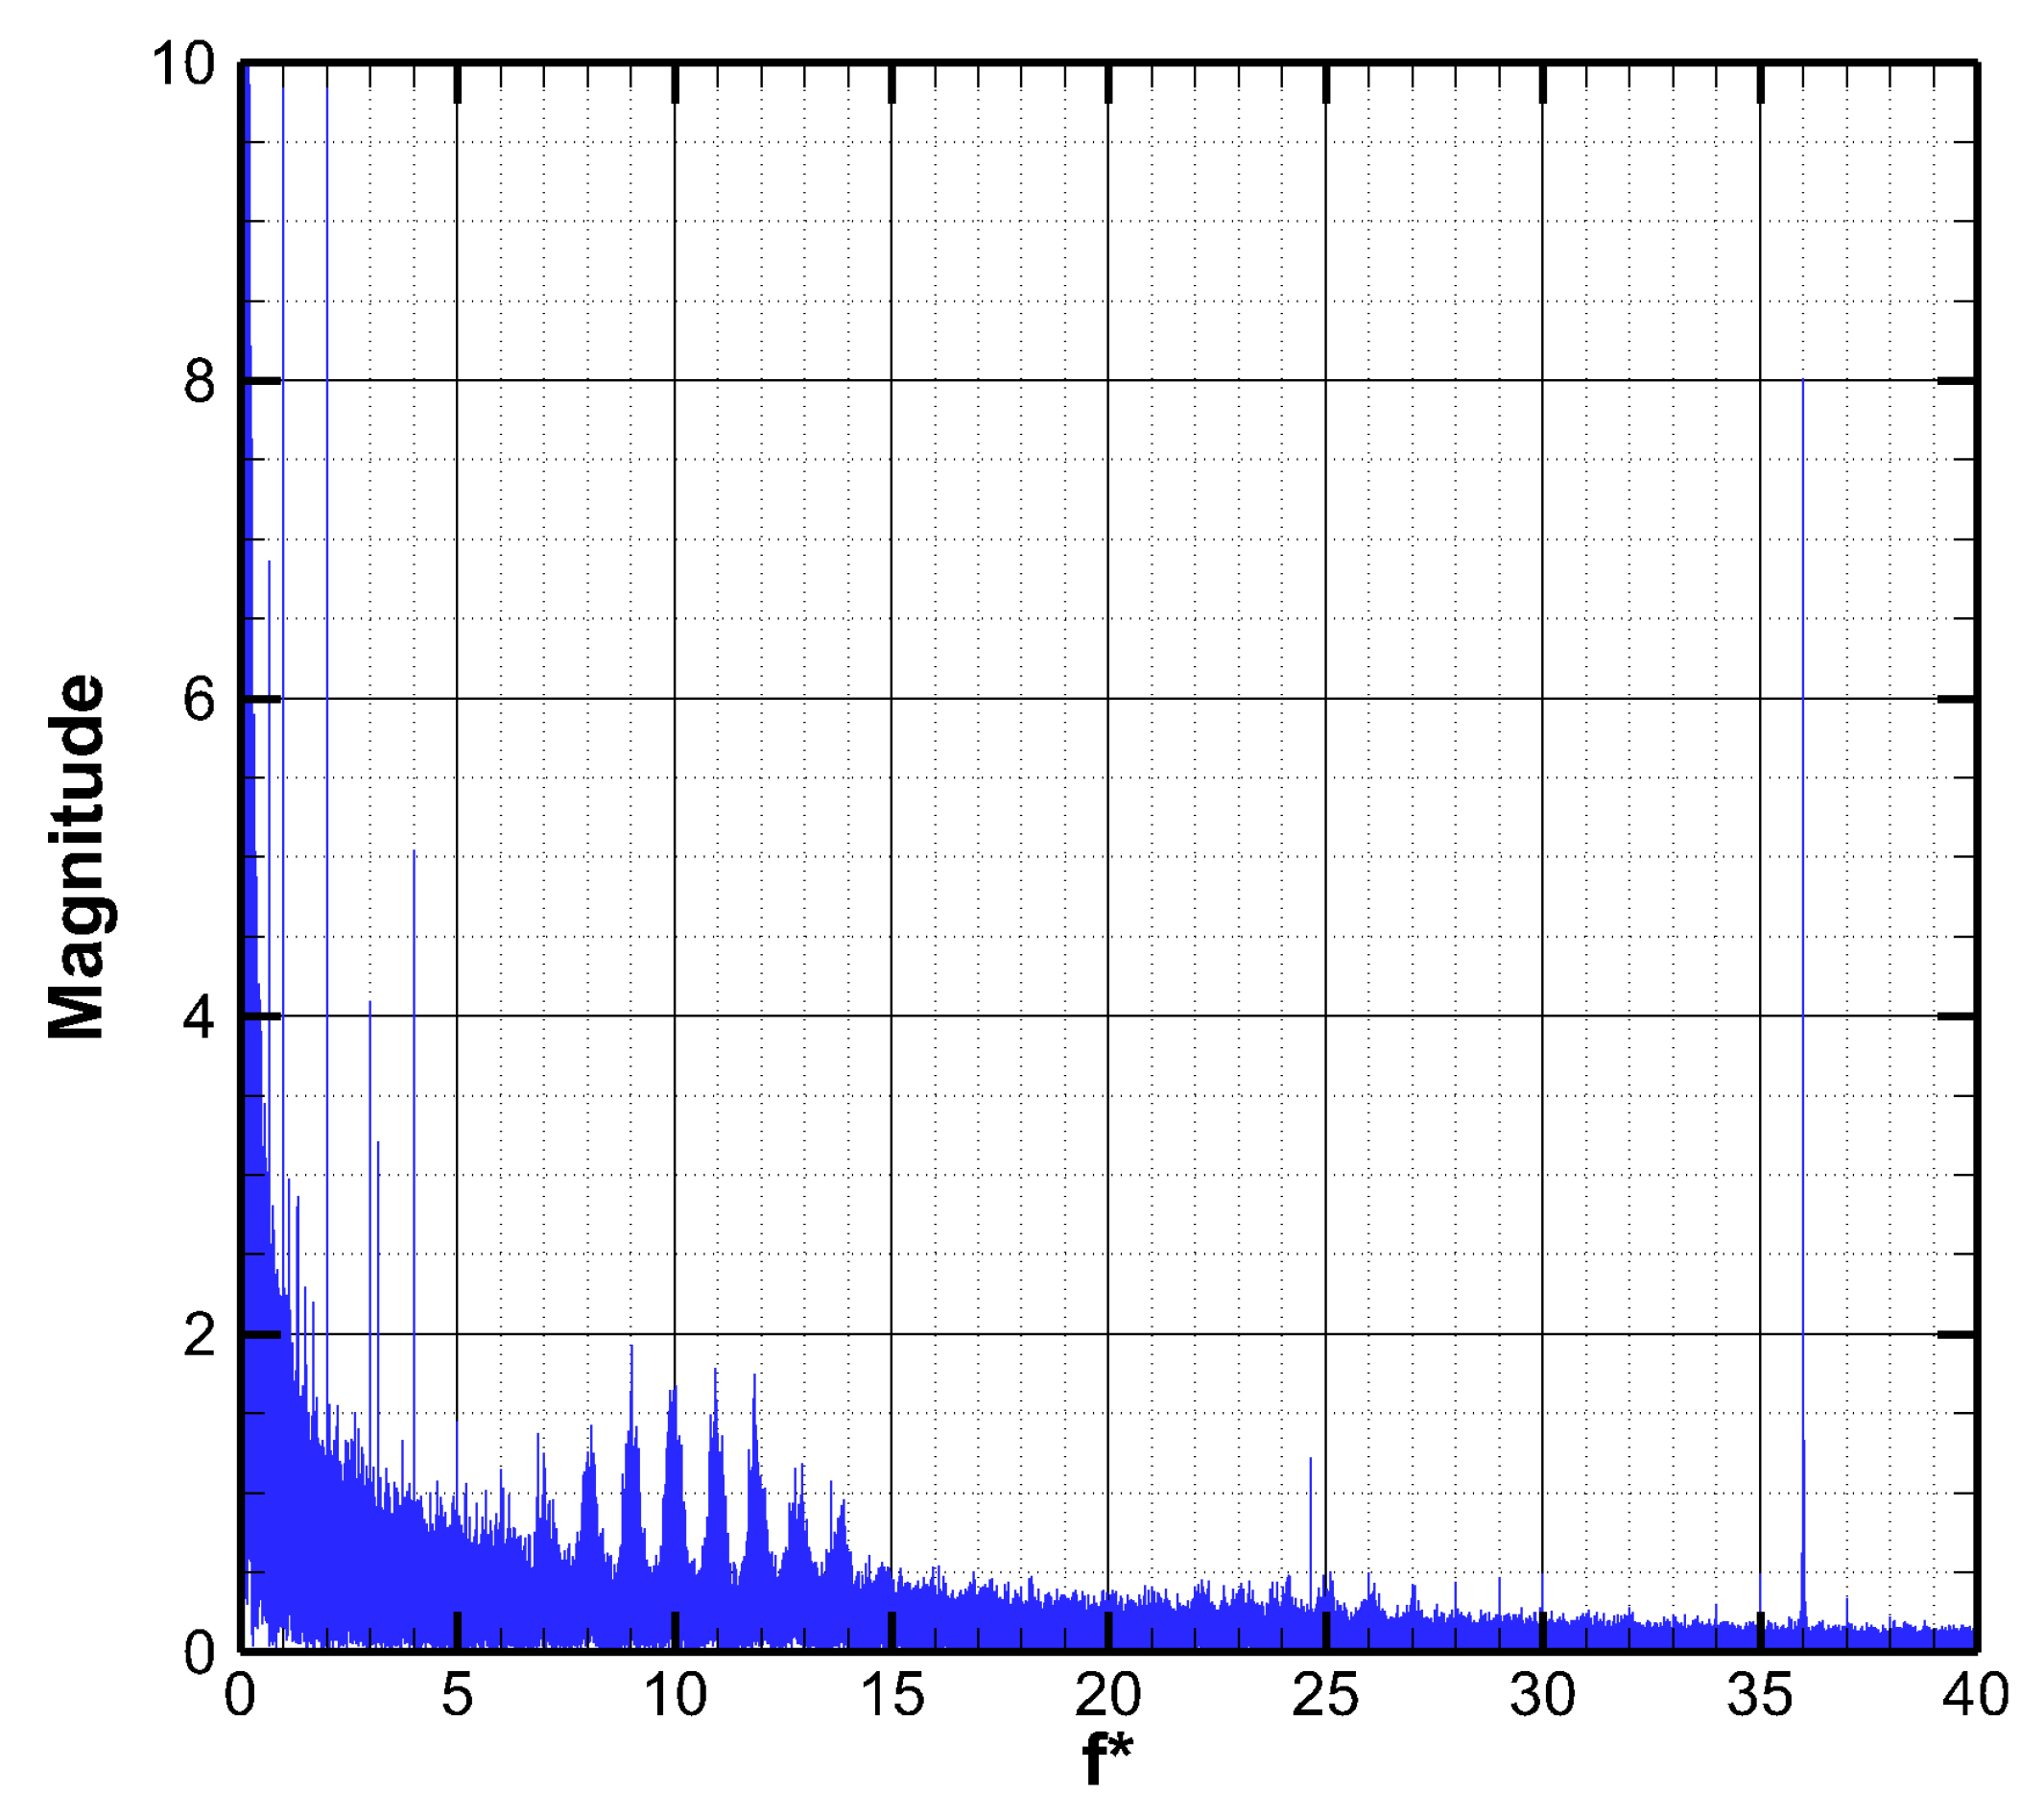
Figure 4 presents the frequency domain results for a rotor speed of 1433 rpm and a purge mass flow rate of 0.28% of the main gas path for “Transducer 1”. A large-magnitude spike was recorded at
. This number is equal to the number of rotor blades and is also the same as the blade-passing frequency. The results indicate that the transducer is in an area of ingress. Thus, it is more apt to measure the pressure-field disturbances caused by the rotor blades as they pass. Frequencies below five occurrences per revolution were understood to be noise.
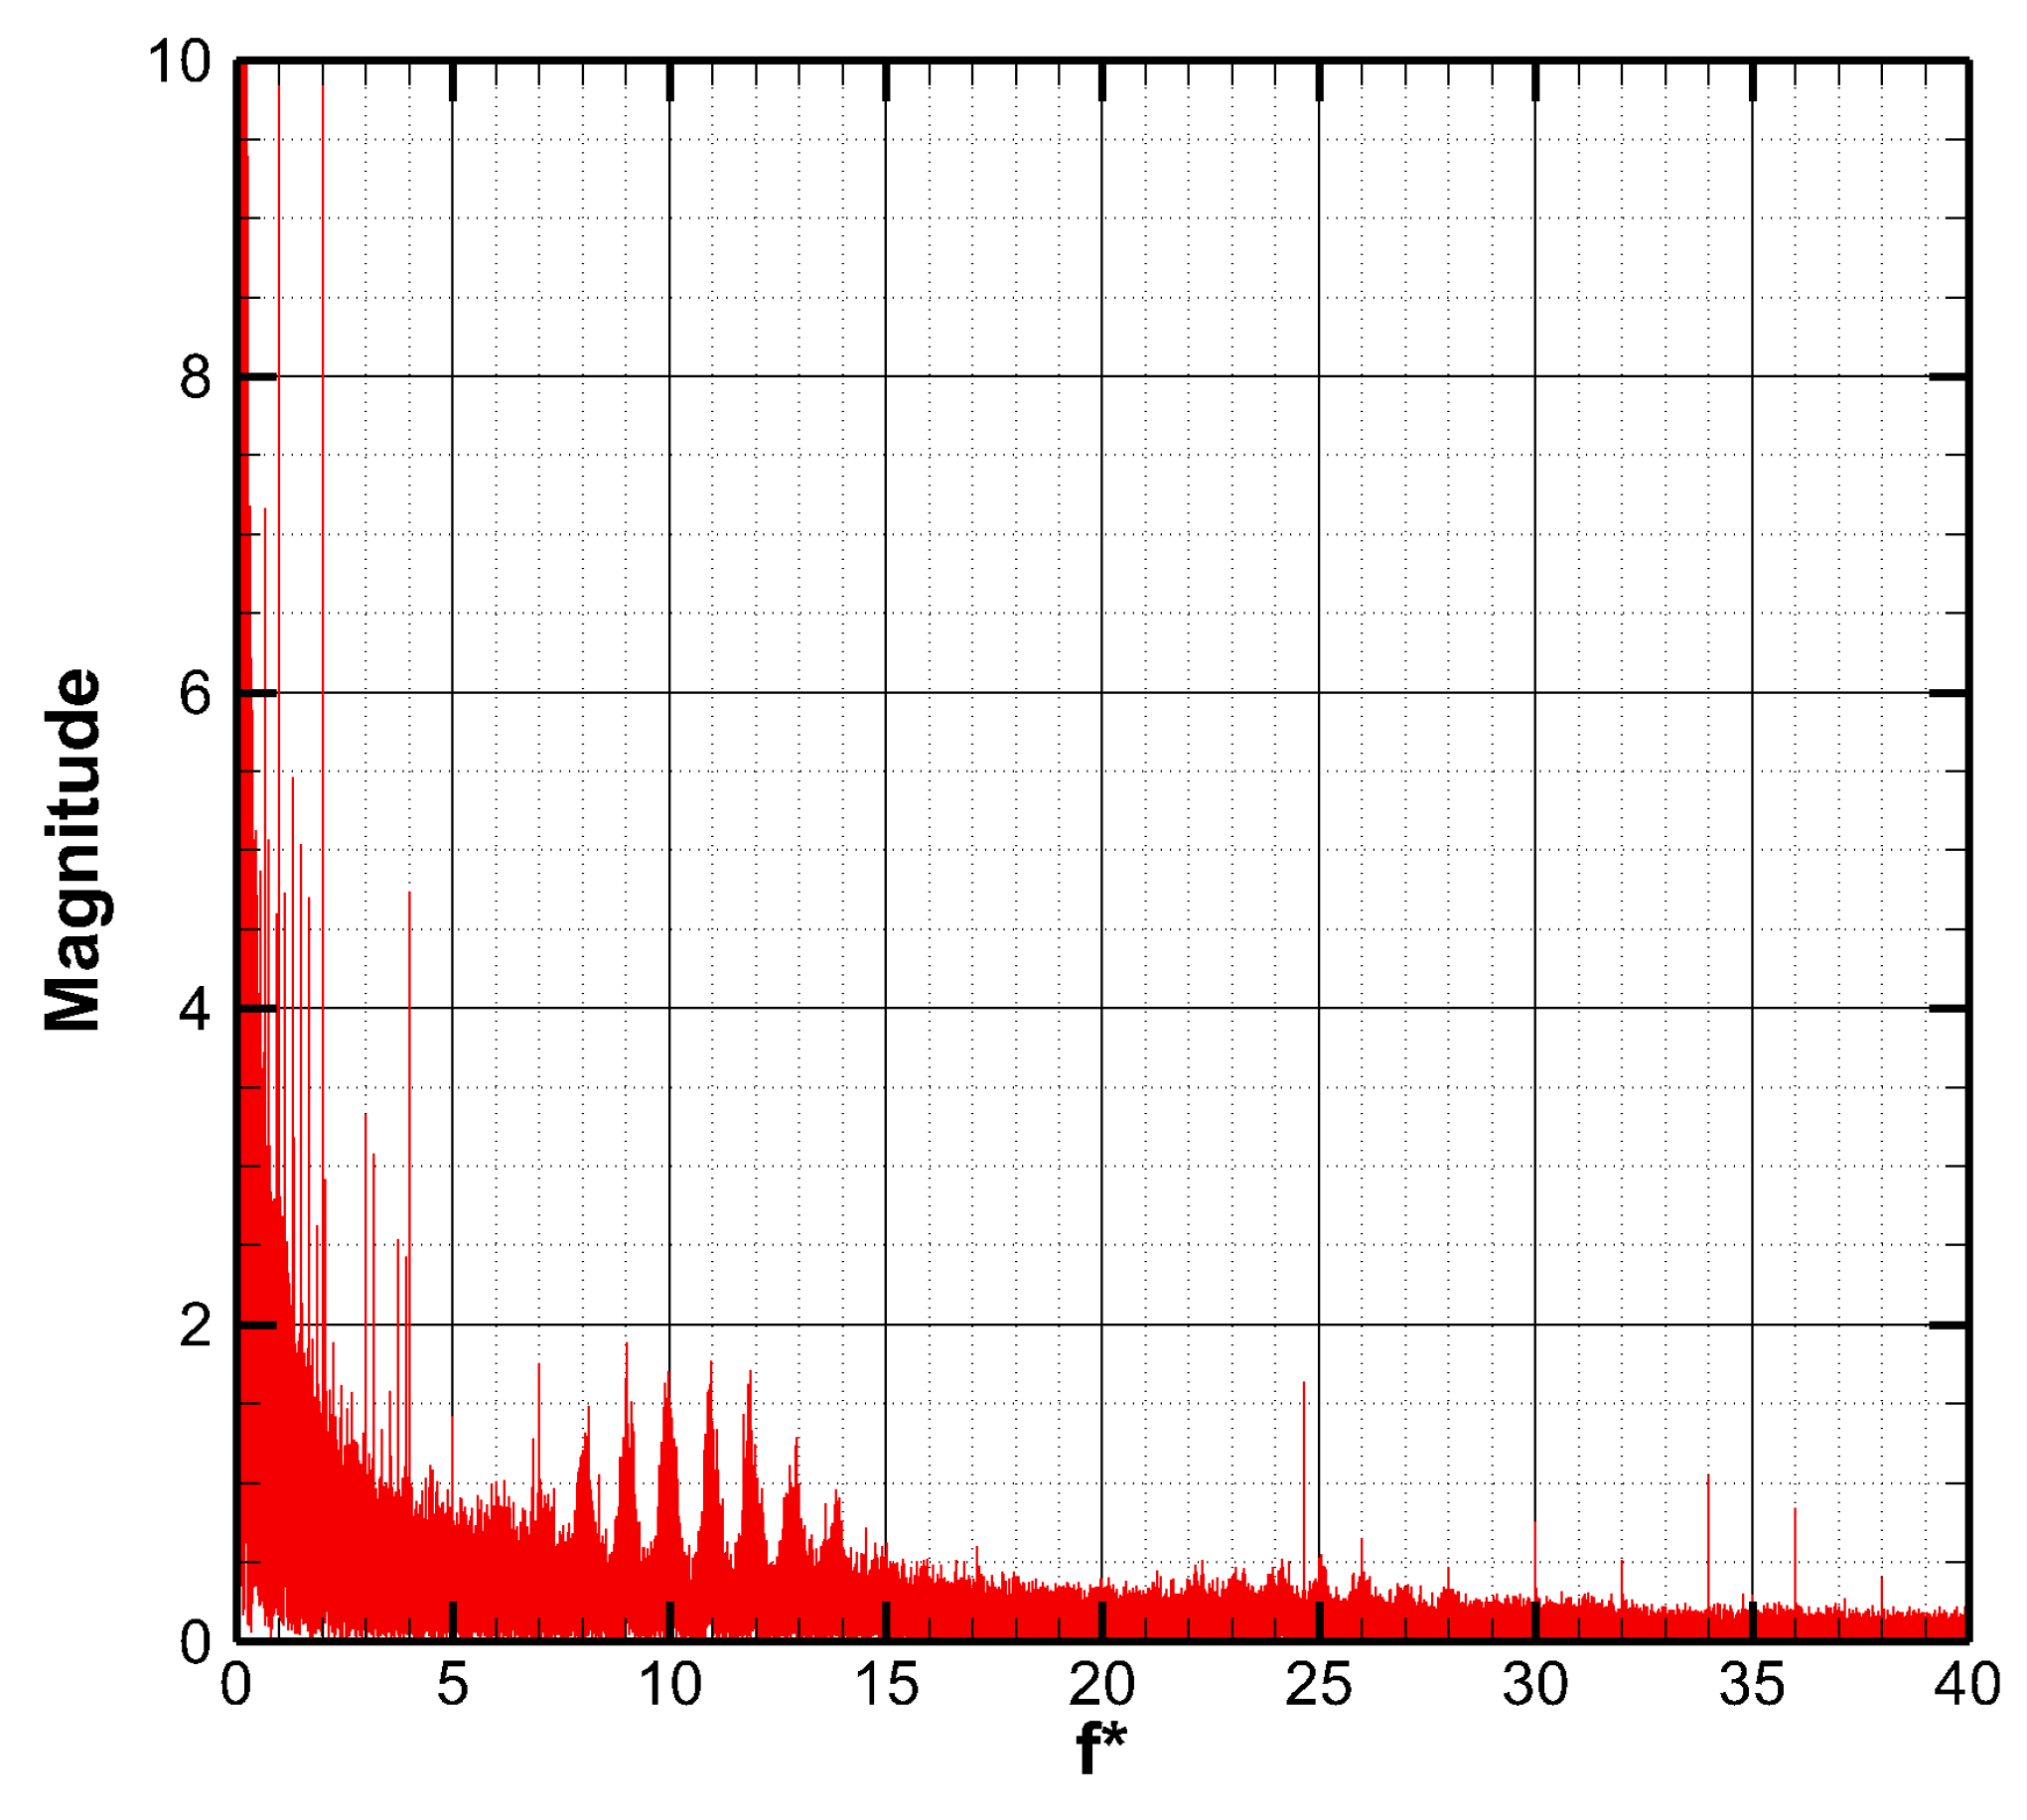
The second transducer’s frequency spectrum results are shown in
Figure 5. The blade-passing frequency of 36 is not as pronounced as the first location results. The second transducer was not in a location of constant ingress, and the upstream rotor blade pressure field does not affect it as much. Frequencies below five occurrences per revolution were once again considered noise.
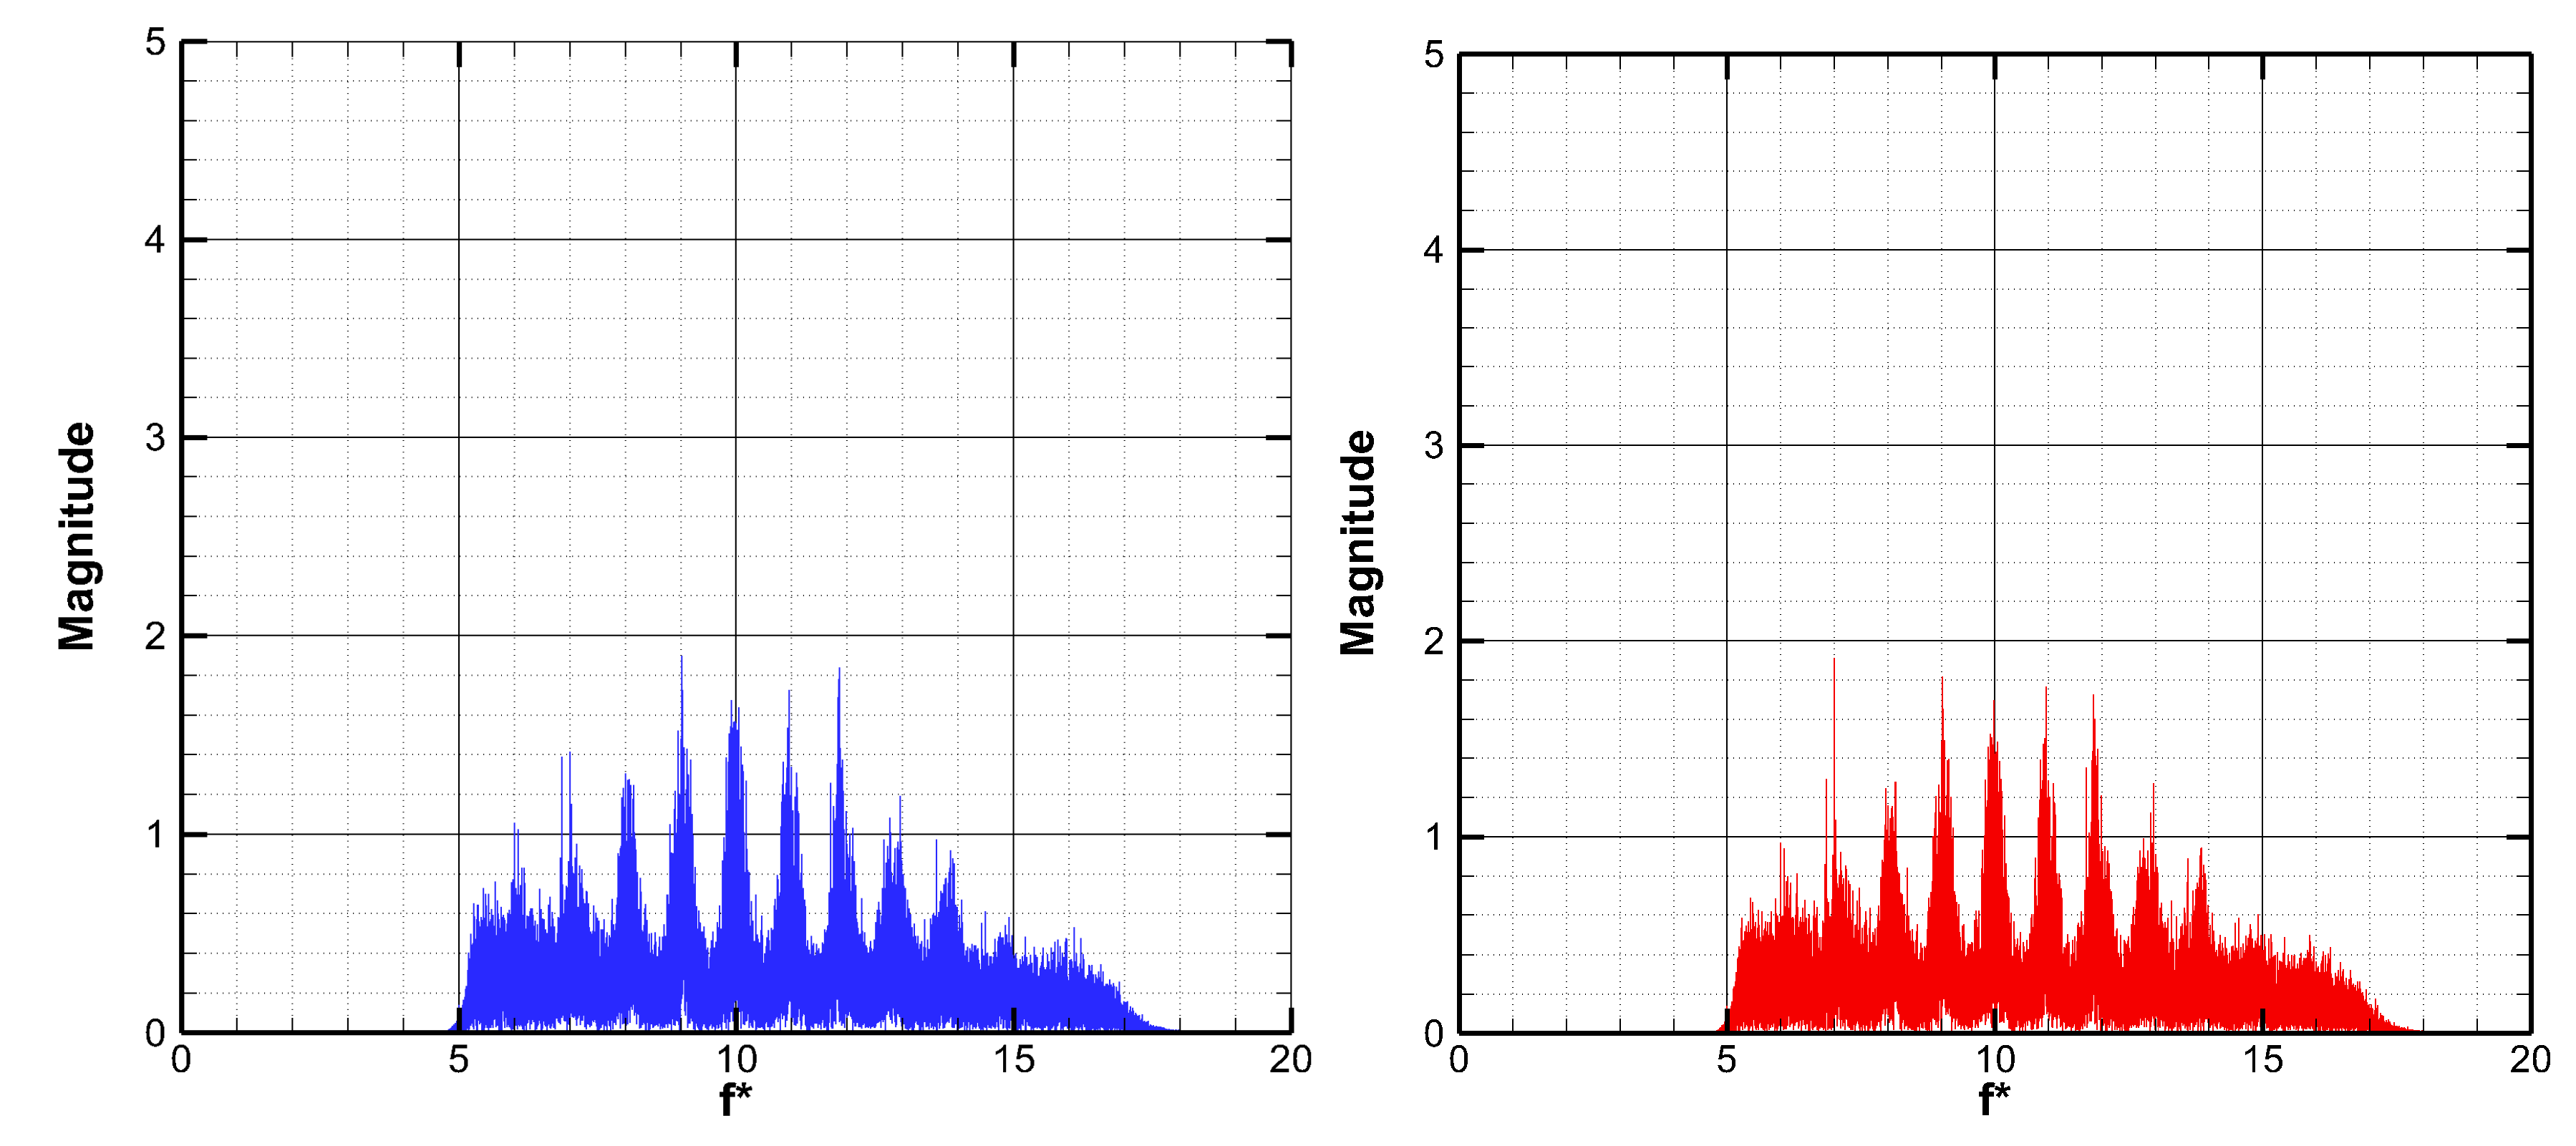
An enlarged version of each graph for the frequency range of 5 to 15 occurrences per revolution is shown in
Figure 6. The signals that fall within this range were identified as belonging to the low-frequency unsteady structures within the rim seal cavity. A range of frequencies was identified as the unsteady structures because the structures may change shape, size, speed, and periodicity during operation. Additional investigation into how these evolve over time and further analysis of the data will reveal that the structures are unsteady even after a system reaches equilibrium.
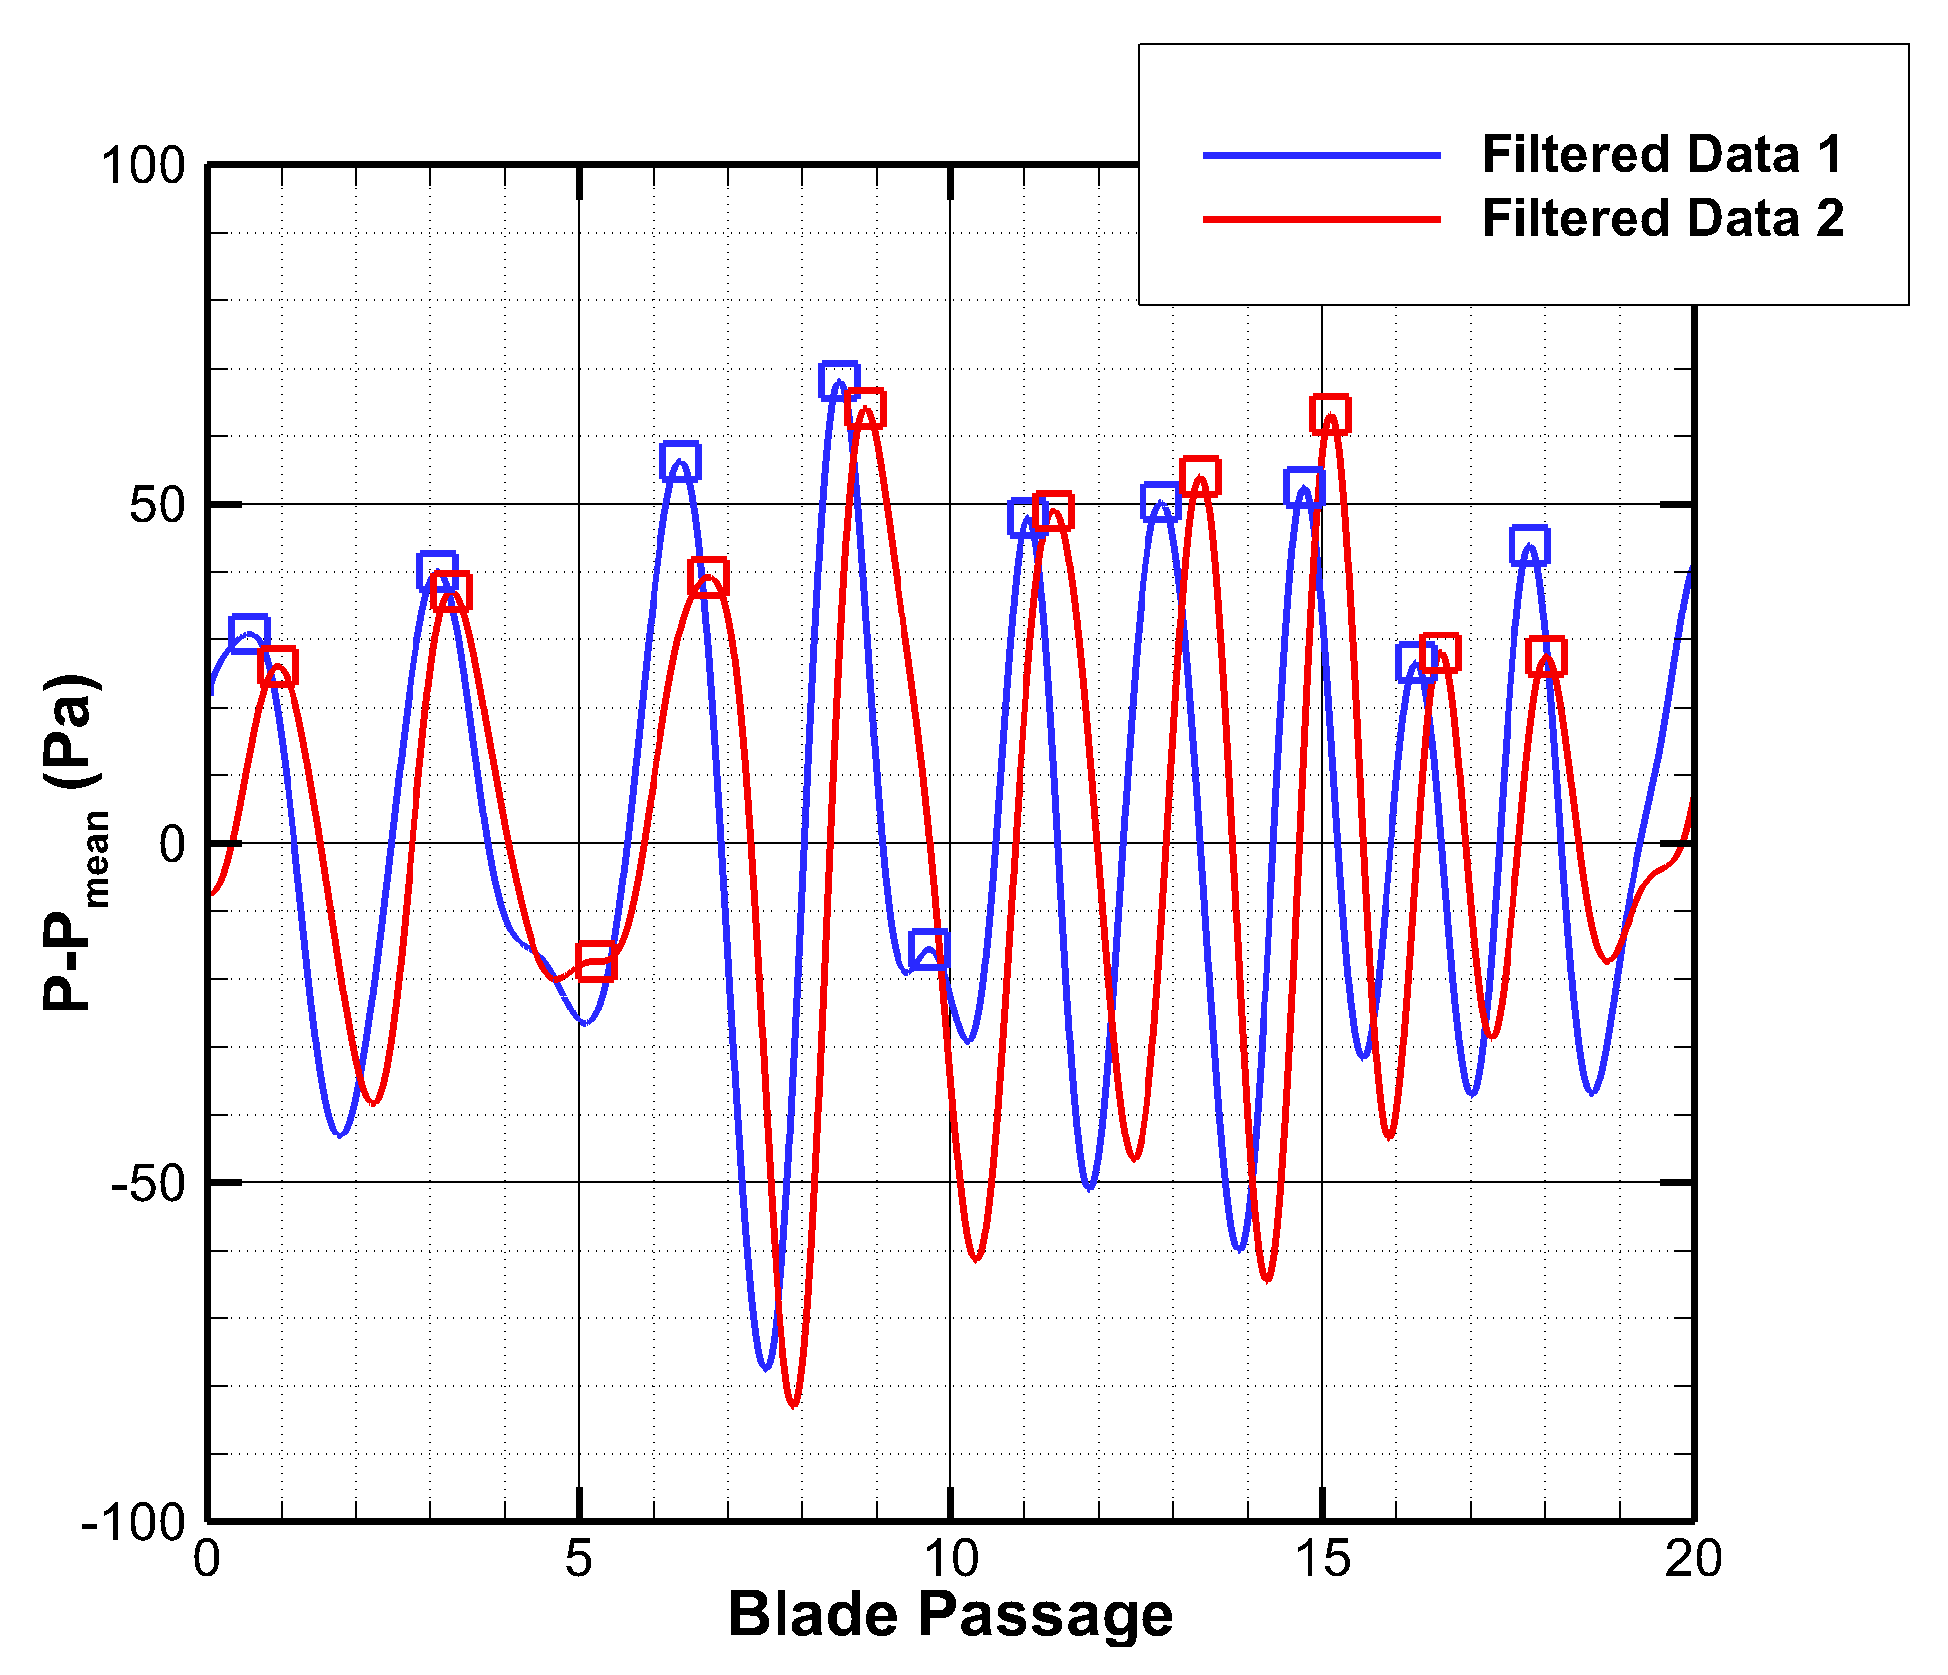
A Butterworth-type bandpass filter with cutoff frequencies of 5.25 and 16.75 occurrences per revolution was used to isolate the unsteady structure signals from the rest of the measurements. The filtered results of the first case are presented in
Figure 7. The signal from “Transducer 1” is in blue on the top, and the signal from “Transducer 2” is in red on the bottom. For “Case 1”, a clear set of similar signals is measured by each transducer. The signals are not caused by the blade or vane pressure fields (36 or 29, respectively). They are identified as unsteady flow structures within the rim seal cavity. Calculating the rotational speed and the number of unsteady flow structures was performed by using Equations (1) and (2). What is needed from the filtered data is the number of peaks present in the signal of each transducer and the time it takes for one peak to traverse between the two transducers. The location and number of peaks were found using the MATLAB function “findpeaks”. The function checks to see if a number is higher than a specified range of the immediate numbers around it. The range is set so that the five numbers ahead and behind a value is checked to see which is greater. If the value is greater than all the numbers it is checked against, the value is identified as a peak.
A sample of the data consisting of approximately 20 blade passings is shown in
Figure 8. The results show an instantaneous pressure value subtracted by the average value. The function “findpeaks” identified 16,547 peaks in “Transducer 1” and 16,585 peaks in “Transducer 2”.
Identifying the peaks can be used to calculate the time it takes to move from one pressure port to another. The pressure peaks traverse from “Transducer 1” to “Transducer 2”. There are 10 microseconds between each sample. Taking the number of samples between each peak and multiplying it by 10 microseconds results in the amount of time it takes for a pressure point to move between the two transducers.
The current code looks for a pressure peak in the signal of “Transducer 1”, and when found, it calculates the number of samples and the time it takes for the same peak to occur in the signal of “Transducer 2”. This calculation is not without flaw. For example, in
Figure 8, a peak was identified at 9 blade passings for “Transducer 2”. There is not a corresponding peak in the pressure signal for “Transducer 2”. The code calculates the time difference between the peak at 9 blade passings from “Transducer 1” and the peak at 13 blade passings from “Transducer 2”. This approach creates a large time difference and can skew the results to structures that are measured toward more slowly-moving results. The second peak in “Transducer 1” at 13 blade passings also uses the same peak at 13 blade passings in “Transducer 2”.
A histogram of the time it takes to traverse from the first transducer to the second is shown in
Figure 9. The red represents the average of all the results; it is approximately 1000 microseconds to move between the two transducers. The average results are skewed by the code that cannot account for the missing pressure peaks in the second signal. The mode of the time difference is 750 microseconds. The mode is the value that is used for the calculation of the speed and the number of structures. A more refined code will be able to reduce the data further.
The fractional speed at which the structures are rotating in the rim seal cavity is calculated using Equation (1). The structures were found to be rotating at 77.5% of the rotor speed. This fractional speed is close to the value of 80% reported by Jakoby et al. [
7]. It is slower than the rotational speeds recorded by Julien et al. [
8] and 87% by Wang et al. [
9]. The speed at which the structures rotate is dependent on the geometry of the rim seal cavity and is always recorded as a significant fraction of the rotor speed, but never faster than the rotor rotational speed.
Equation (2) determines the number of structures within the rim seal cavity. The number of structures found in the rim seal cavity was calculated to be 14.89, which is rounded up to 15. The number of structures is exceedingly dependent on the geometry of the rim seal cavity. A minimum number of three structures were recorded by Jakoby et al. [
7] with a simple axial seal, and a more significant number of 30 structures were recorded by Julien et al. [
8].
4. Computational Approach
To computationally simulate the flow structures found in the rim seal cavity, ANSYS CFX (64-bit, version 15, ANSYS Corp., Canonsburg, PA, USA) was employed as a transient, unsteady, three dimensional, and compressible Reynolds-averaged Navier–Stokes solver. The solver was distributed in parallel mode with as many as 48 licenses used at a time. A comprehensive assessment and validity of the current computational infrastructure and the computer program was reported in a comprehensive report by Turgut and Camci [
21]. Although a direct uncertainty analysis on the computed quantities were not reported, the computational results were compared against carefully measured aerodynamic NGV and rotor quantities. A very good comparison between the measured airfoil loadings, NGV/rotor exit static, and total pressure distributions was reported for the results obtained from the current computational solver.
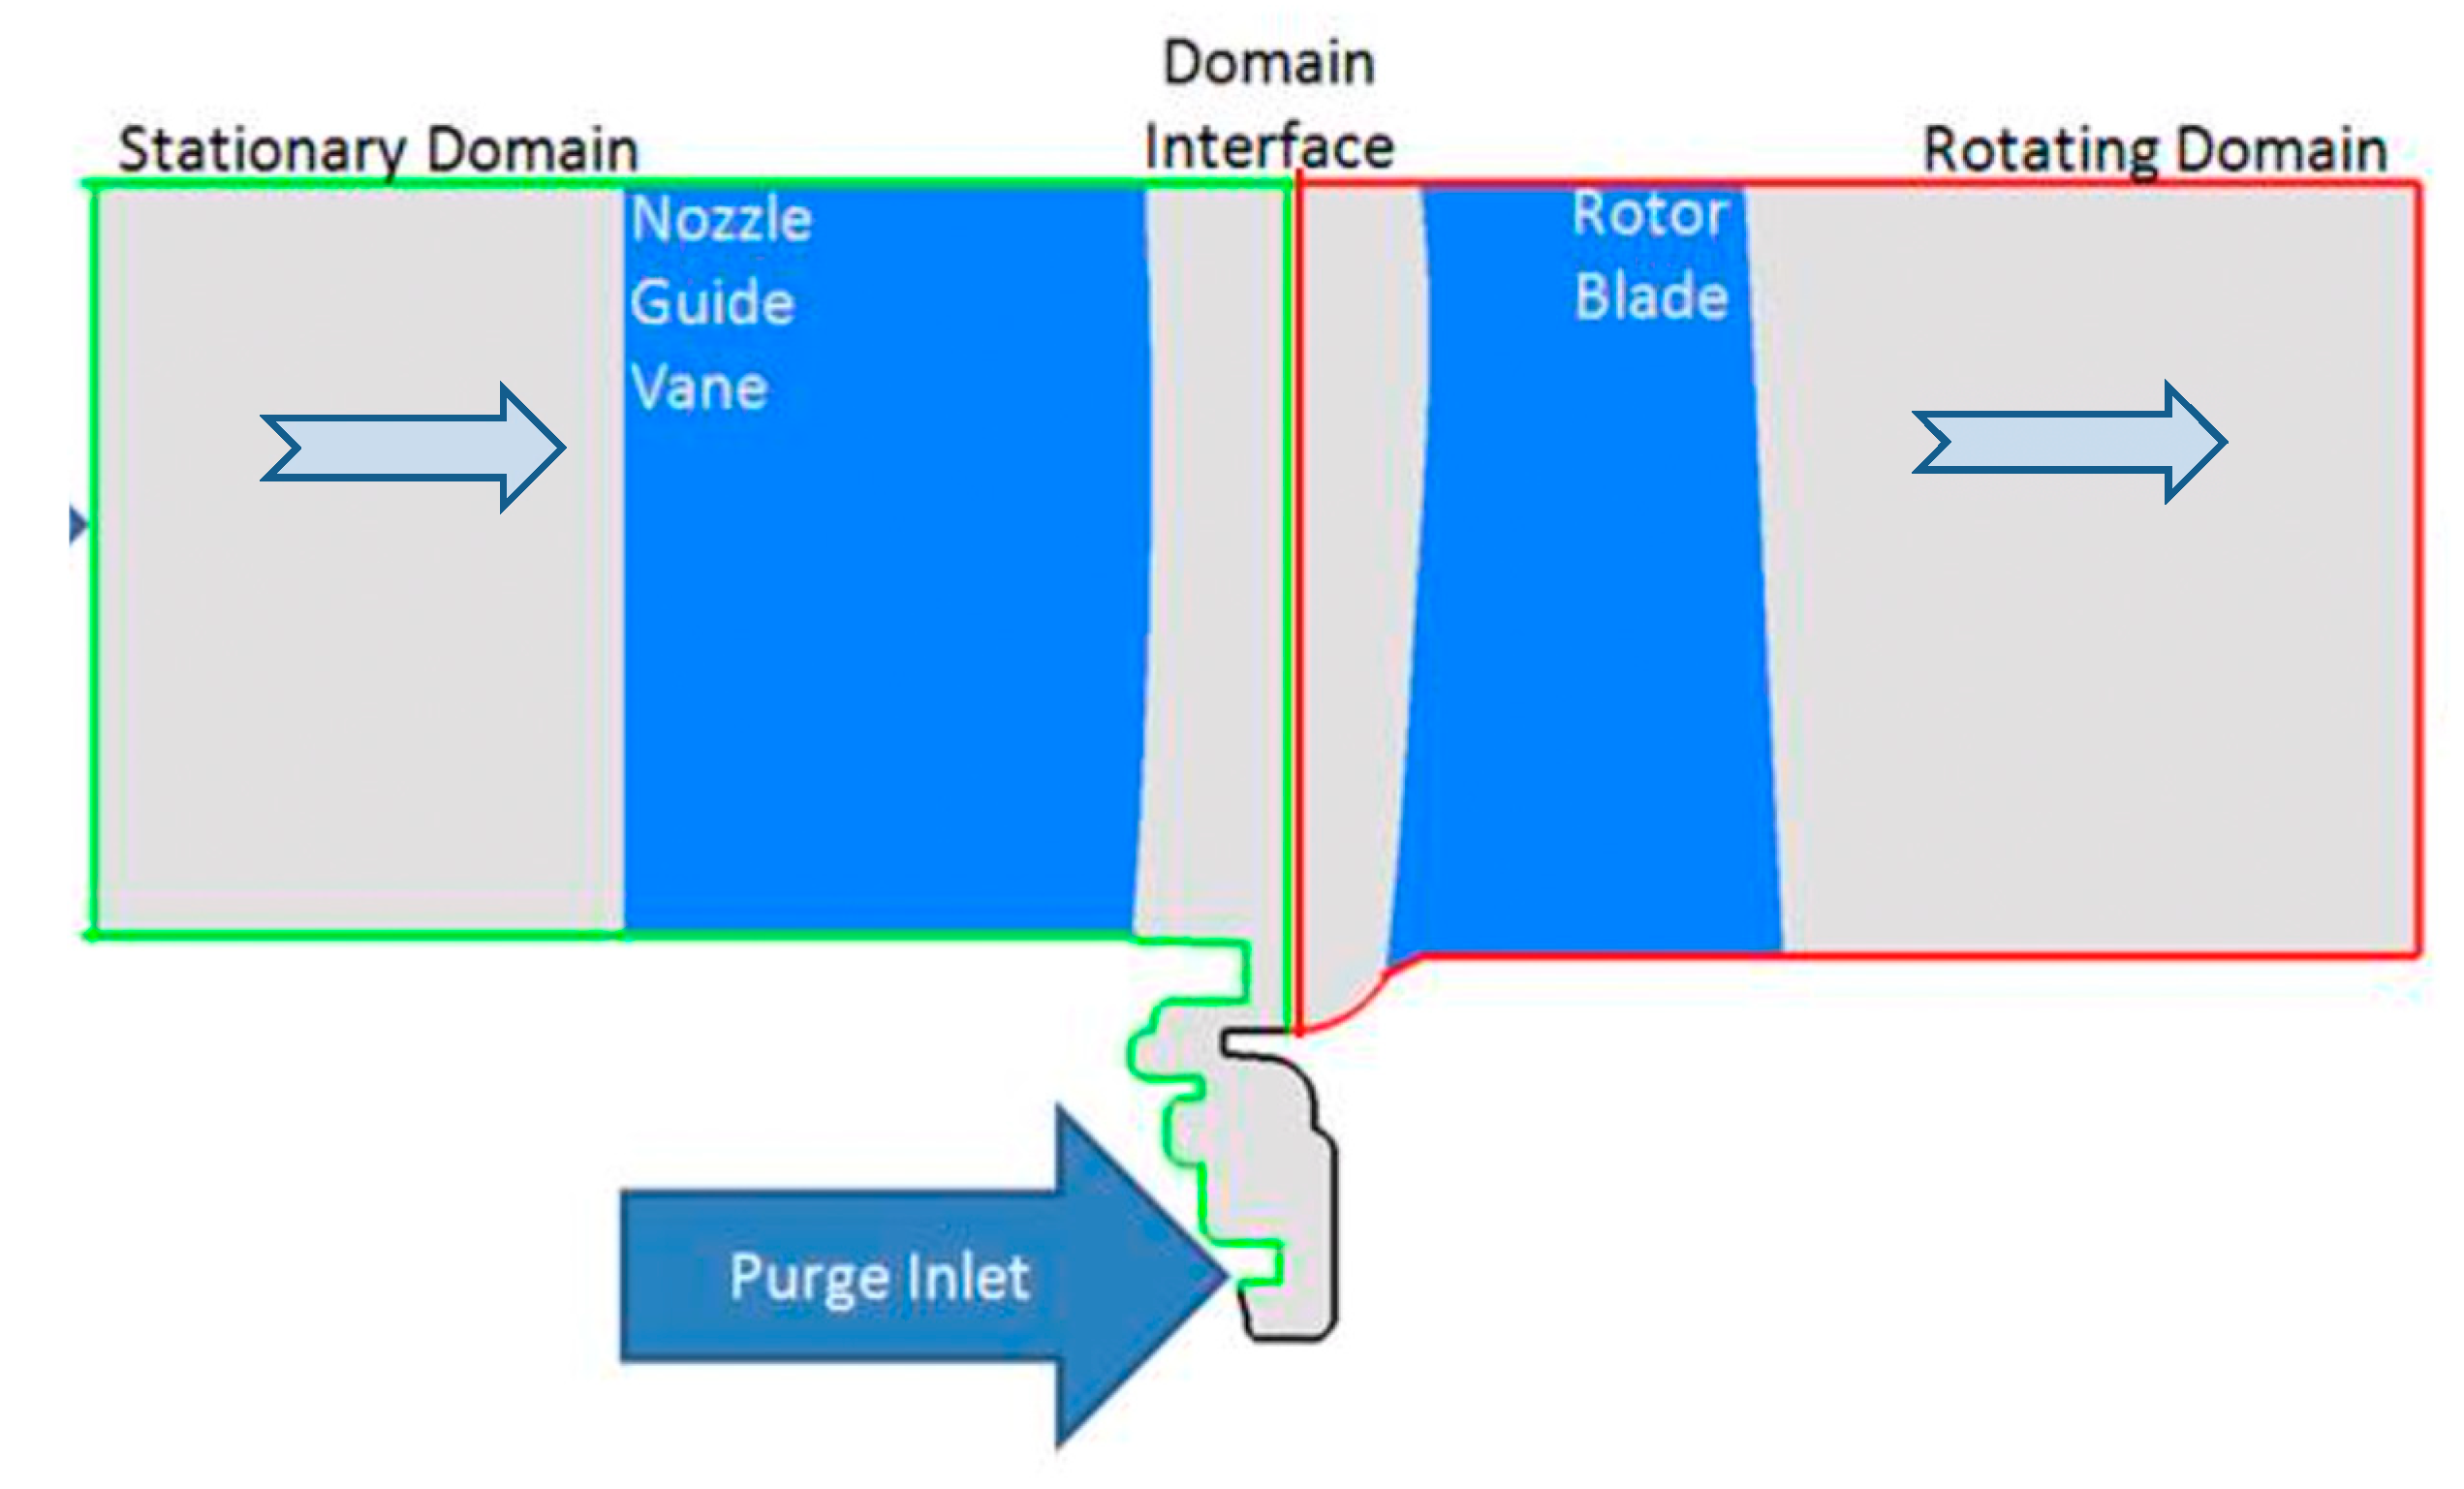
Figure 10 shows the geometry representative of the domains in the meridional view. The domain is divided into two subdomains, the first being a stationary domain containing the nozzle guide vane, the stator hub, the casing, and the rim seal cavity. The inlet is located one axial vane cord upstream of the leading edge.
The second domain is the rotating frame of reference and it contains the rotor blade, rotor blade casing, and rotor hub. The exit is located 1.25 blade axial chords downstream of the trailing edge of the rotor blade. The rotational domain is marked with a red boundary.
Stationary surfaces in the figure include the nozzle casing, nozzle hub, stator side of the rim seal cavity, nozzle guide vane surfaces, and rotor casings (green boundary). The rotating surfaces include the rotor hub, rotor casing, and rotor blade surfaces (red border). The rotor side of the rim seal cavity is shown in black.
Grid generation was completed with GridPro which creates a multiblock, body-fitted, and structured hexahedral grid and uses automated subroutines to improve mesh quality. Boundary layers are only placed on the hub surfaces and within the rim seal cavity. Boundary layers are not included on the blade or the casing surfaces as they do not have a significant effect on the rim seal cavity ingestion and egression. Additionally, no blade tip clearance gap is used for the rotor.
The size and boundary conditions of the computational domain along with a grid dependency study is recorded in more detail in Averbach [
20]. A brief overview of the grid dependency results for the first location, the NGV hub surface, is given here. All of the four grids evaluated properly capture the periodic nature of the flow behind the stator vanes with four visible peaks matching the four vanes in the domain. The largest difference in grids was seen where pressure is lowest. The coarsest Grid A produced visibly different results when compared to the denser grids. Differences between the three other grids were difficult to distinguish. Grid B can be seen to be slightly different, in the low-pressure region, than the two remaining denser grids. Grid C and D appeared to produce identical results.
The computational infrastructure required to complete a full-rotor simulation was not available. There were 29 vanes and 36 blades, a ratio of 0.8056:1. A sector model of 8 vanes and 10 blades was used corresponding to a ratio of 0.80:1. The calculated pitch ratio between the sector model and the actual stage was 0.9931. A domain of sufficient size must be used to correctly capture the unsteady structures within the rim seal cavity. From the experimental results, we expect there to be approximately 15 structures. Each structure would be 24° apart from the next structure. The current rim seal cavity simulation contains 99.31° of space and would have the ability to capture 4 of the structures within it.
The unsteady analysis was started by completing a frozen rotor run with stage averaging, which then stepped into the transient simulation. A time step of the required time to move the rotor one-eighth of a blade pitch was chosen, or 1.4481 × 10⁻⁴ s for the first half of a rotor revolution. Afterward, a finer time step of one-sixteenth of a blade pitch movement time, or 7.4405 × 10⁻⁵ s, was used for data gathering. Four blade pitch passages or 64 time steps were completed with 15 inner loops for each time steps. These four-pitch passages were used for transient results. A convergency level of 10−4 was maintained throughout the computations.
5. Computational Results
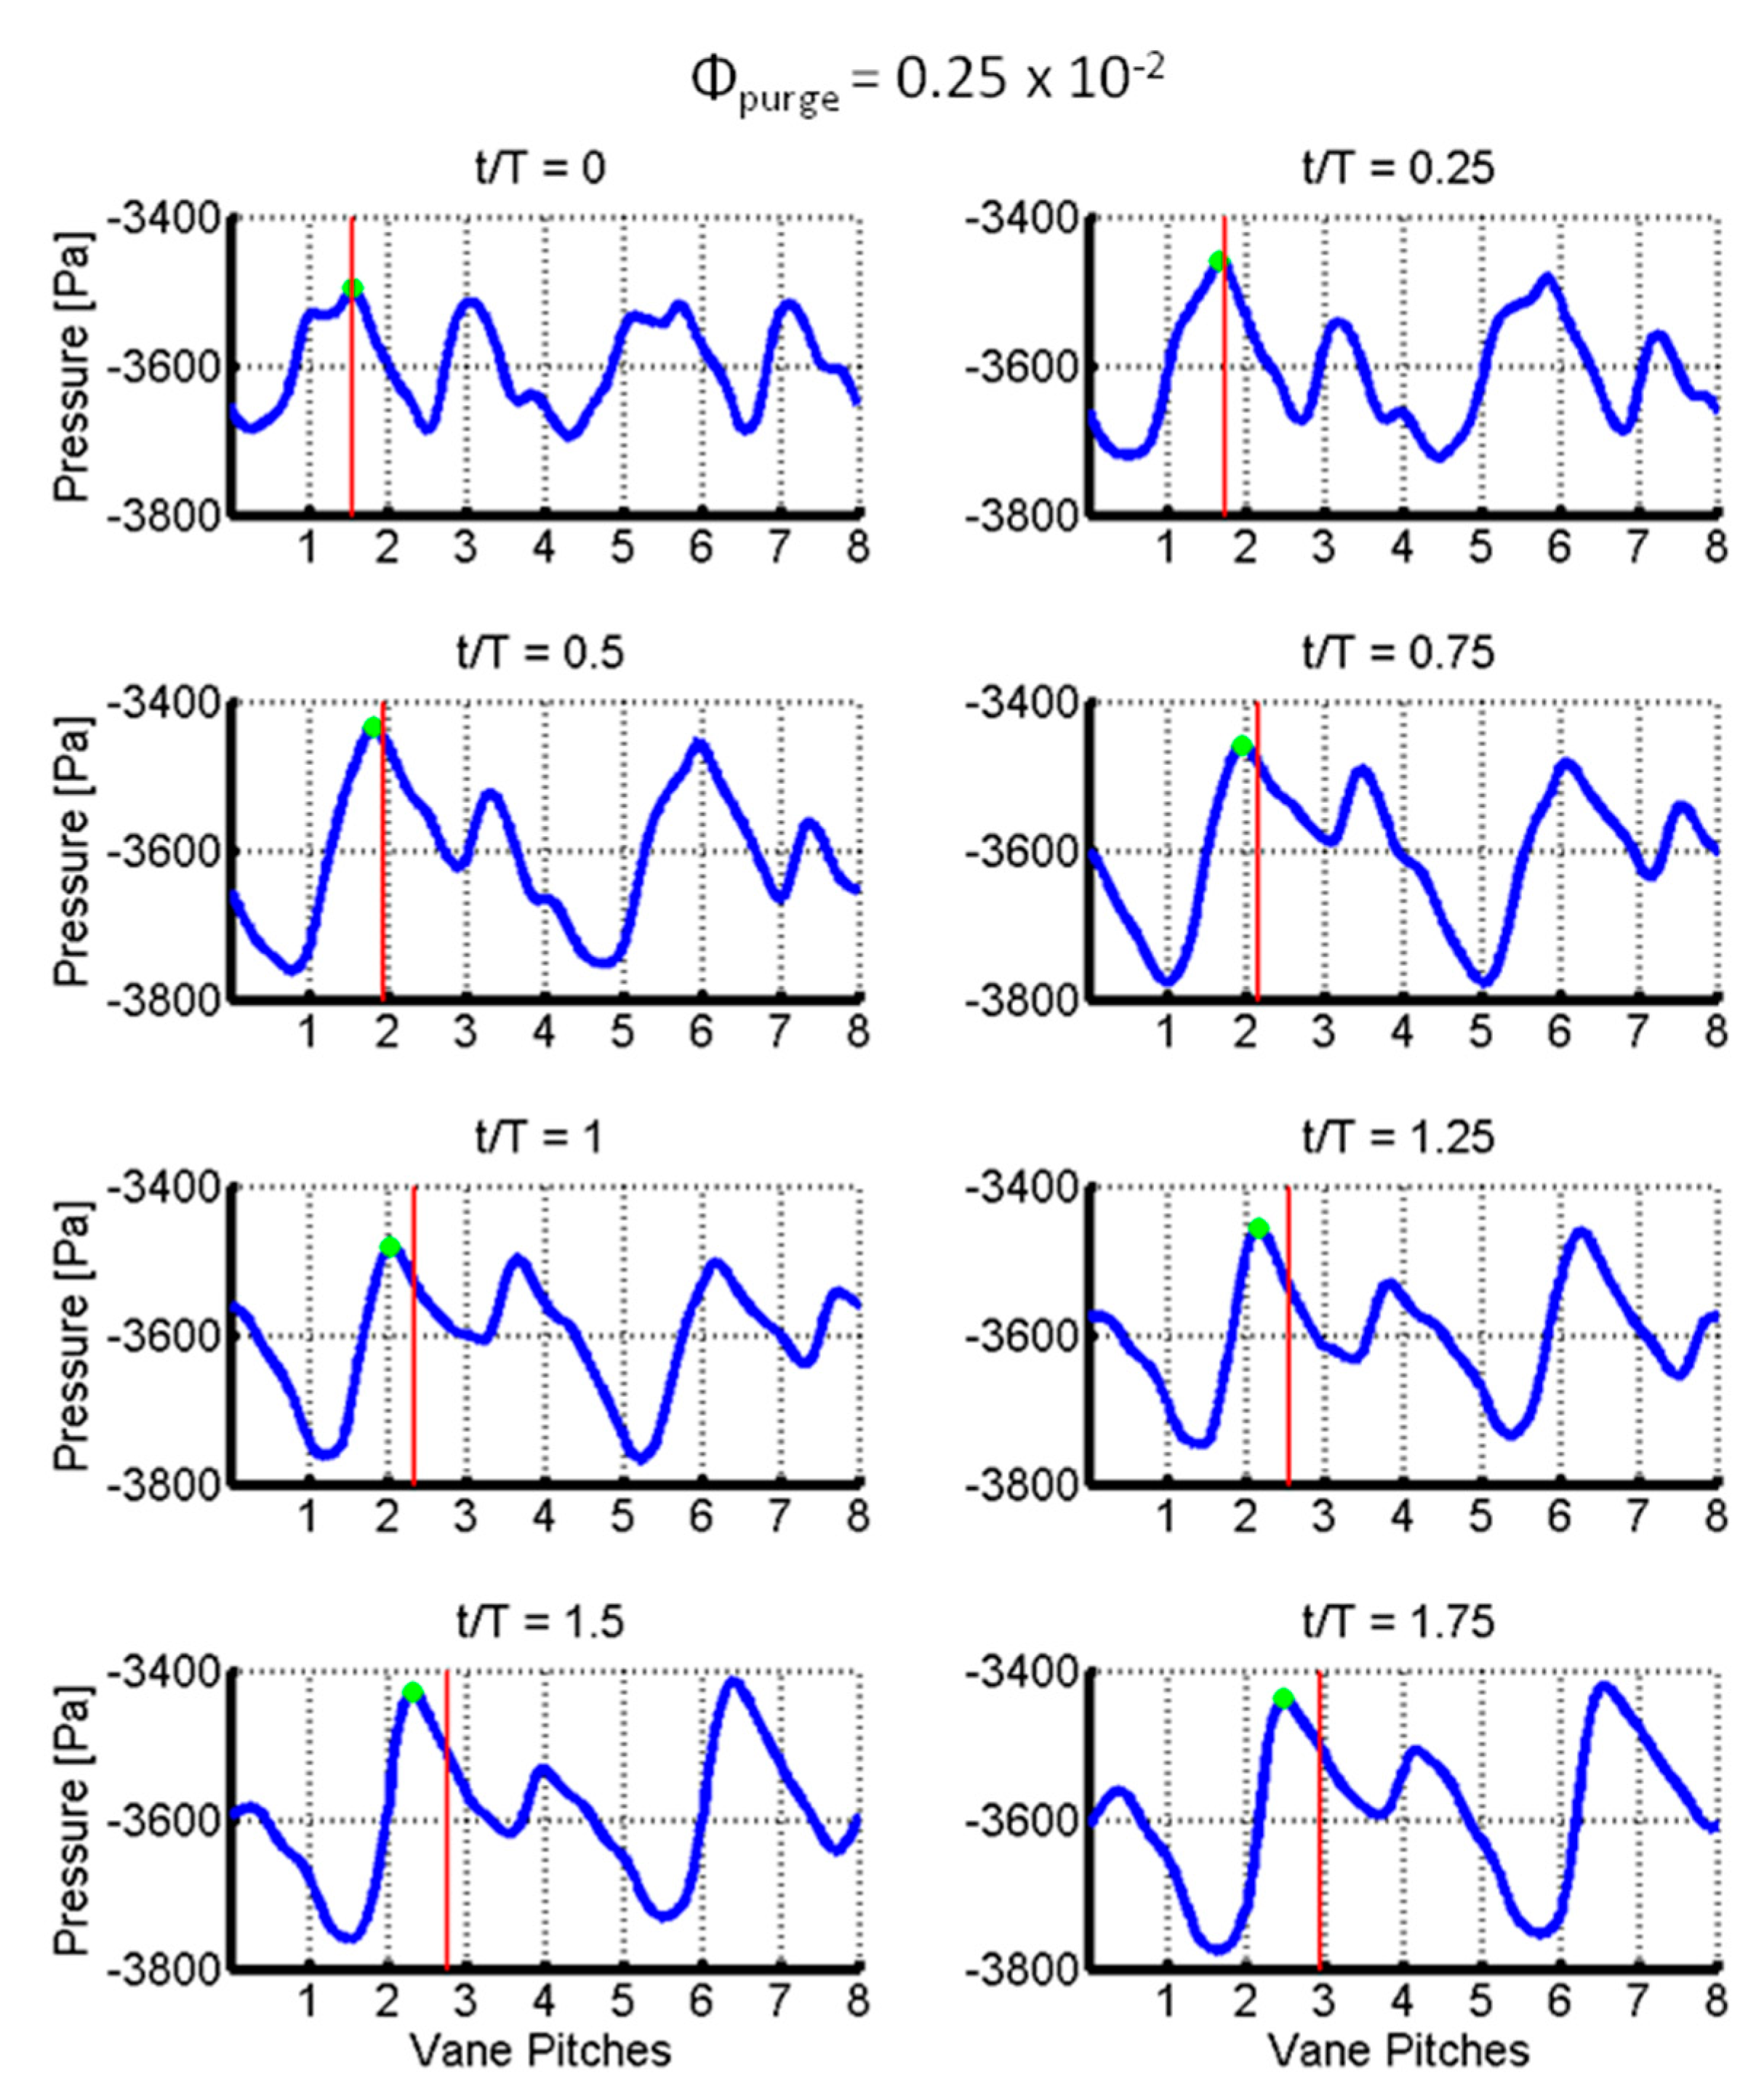
Static pressure in the computational simulation was monitored at the same radial location as the piezo-resistive pressure transducers as shown in
Figure 2 and
Figure 3. Results of the static pressure across the rim seal cavity surface of the first eight vanes are shown in
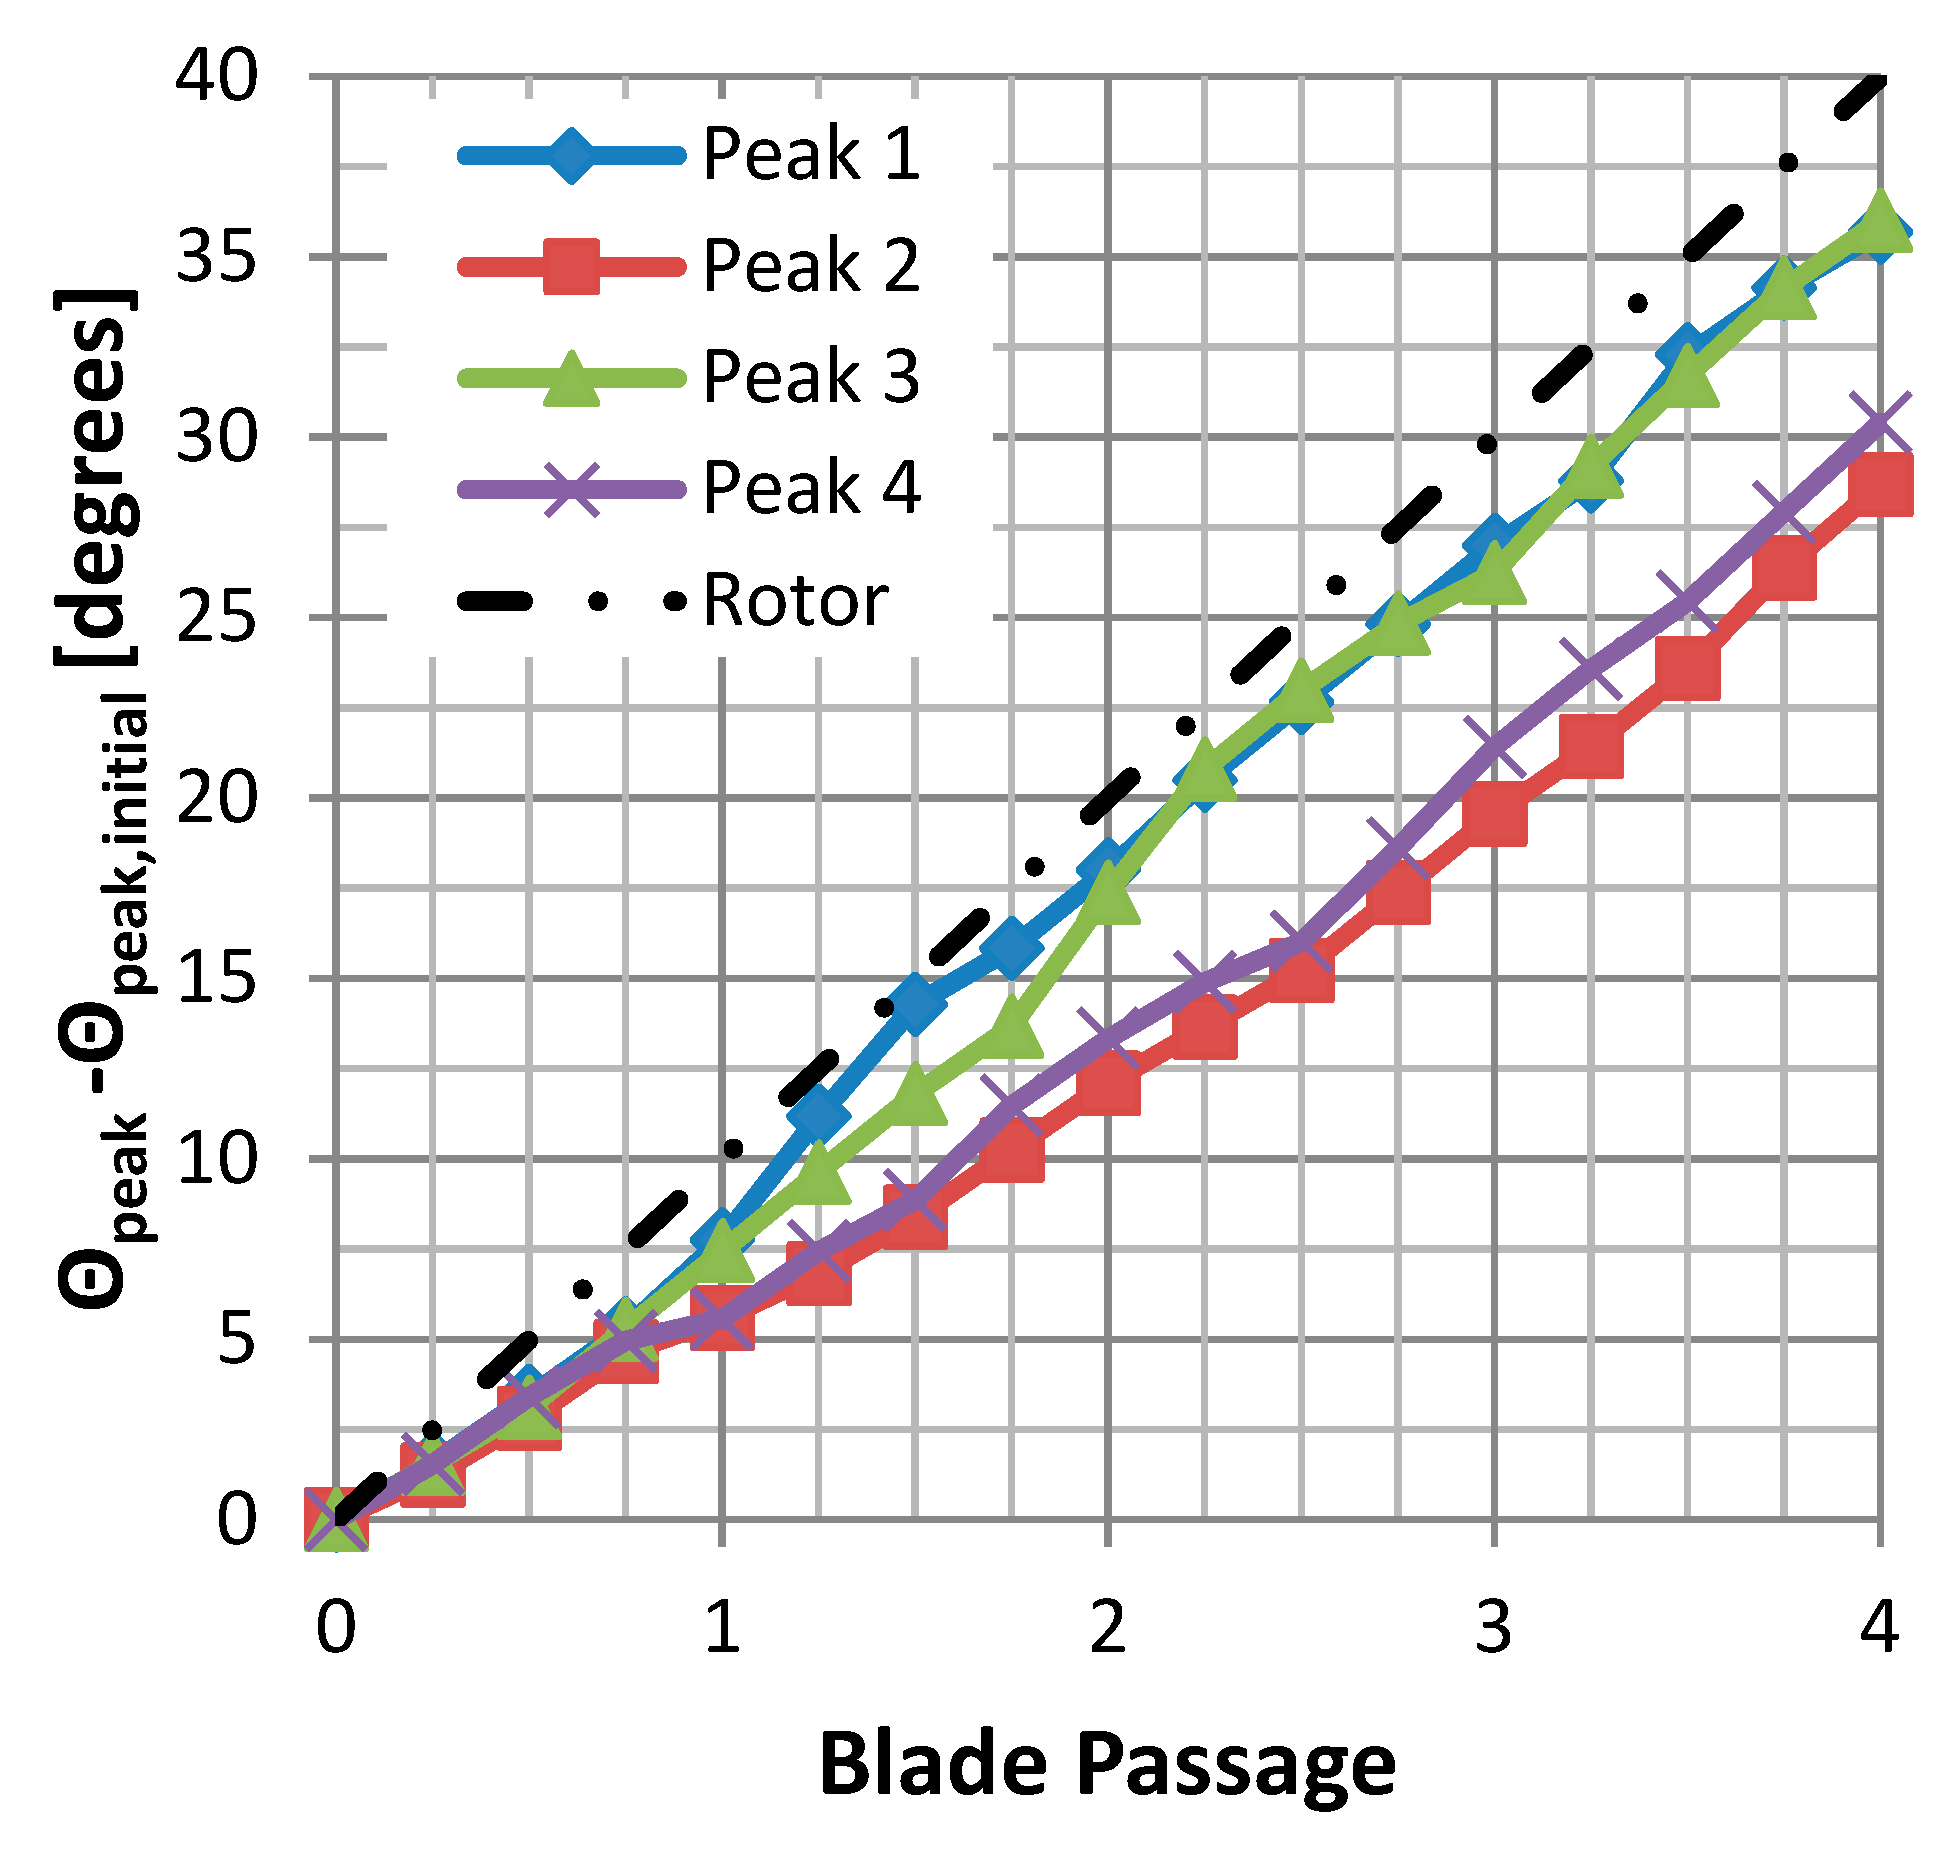
Figure 11 where a green dot represents a single peak. The red line represents the movement of the rotor. The variable
t represents the current time, while
T represents the time it takes for the rotor to move one blade pitch. At
t/T = 0, both the green dot and the red line are at the same position. The distance between the green dot and the red line becomes greater as time steps move on. The pressure peak was moving more slowly than the rotor, as expected. Four pressure peaks were also readily identified in the results. Knowing the numbers of the vanes in the domain (8) and the number of the vanes in the full stage (29) makes it possible to find the total number of structures in the computationally simulated turbine stage. The current calculation shows that there are 14.5 unsteady structures in the simulated stage.
Table 3 provides a comparison of the computed and experimental results for the number of unsteady flow structures and the relative speed of these structures with respect to the rotor speed. Further details on counting the number of structures can be found in reference [
20].
The speed at which the structures rotate can be calculated using Equation (4). The rotor speed, along with the time step, is set with the initial conditions of the simulation. The four peaks observed in
Figure 11 are mapped for the time step and recorded in
Figure 12. The figure shows the rotor moving (black dot-dash line) at a constant speed which is greater than the speed of all peaks. The four peaks do not move uniformly and have variance in speed from one step to another. The peaks could be inherently unsteady, or an insufficient number of rotor rotations were used during the simulation before data was collected. The authors’ opinion is that the structures are, and will continue to be, unsteady during the simulation. The average speed for which the peaks are moving is 81.7% of the rotor speed. This is also the rotational speed at which the unsteady structures are moving.
6. Conclusions
A test to compare the experimental and computational results for the fractional speed of the rim seal cavity flow structures is proposed and executed. To the authors’ knowledge, there has been no such experimental analysis using piezo-resistive pressure transducers to investigate unsteady cells within the rim seal cavity.
The number of cells was due to the way the rim seal cavity is dependent on the number of vanes used in the simulation (8) and the total number of vanes in the stage (29). There are a prime number of vanes which helps to eliminate vibrations in the system at the cost of increased complexity for the computational analysis.
The structures in the rotor were measured experimentally to be moving at 77.5% rotor speed, while the structures in the computational study were found to be moving at 81.7% rotor speed. The computational fractional speed results of the cavity flow structures were found to be within a good agreement with the current turbine stage experiments.
The computational results would benefit from a full-rotor simulation with an increased number of revolutions during the transient phase. The larger domain would allow more structures to develop. The increased number of revolutions would allow the structures to develop more and settle.
The experimental results would benefit from increased scrutiny into the measured data sets. The averaged results compare favorably to the URANS code. However, URANS by definition will average, the structures may be inherently unsteady and could never settle down to a steady state solution.
A more in-depth look into the results from the piezo-resistive transducers may reveal that the structures are changing in size, shape, and periodicity, even after a steady state operation of the turbine has been reached.
Author Contributions
M.A. executed the URANS runs in a large-scale computing platform provided by the Dept. of Aerospace Engineering at the Pennsylvania State University. He was responsible for the grid generation, boundary condition specification, and post-processing of the computational results. J.T. prepared and operated the axial flow turbine research facility AFTRF for the current rim-seal chamber experiments. His contribution to the installation, calibration, and operation of the various AFTRF systems, including all sensors, was significant. C.C. directed the overall research program and the operation of the experimental and computational facilities used in this research. He closely monitored the experimental program, data acquisition, error estimates, post-processing, and interpretation of the current results.
Funding
This research received no external funding. Michel Averbach’s research assistantship was paid through a fund provided by the Department of Aerospace Engineering.
Acknowledgments
The authors would like to thank Özhan Turgut for his guidance in computational meshing and CFD operation. Harry Houtz and Nick Doroschenko is acknowledged for their expertise in all things related to the unsteady probe and mechanical, systems. Kirk Heller and Mark Catalano’s support for the operation of the large-scale computing platform is appreciated.
Conflicts of Interest
The authors declare no conflict of interest.
Nomenclature
| AFTRF | Axial Flow Turbine Research Facility |
| NGV | Nozzle guide vane |
| Difference in degrees between transducers |
| Difference in time between each peak across each transducer |
| Rotor speed in radians per second |
| Total number of structures identified |
| Total sample time in seconds |
| Speed of the structure in radians per second |
| The frequency at which a structure passes by a transducer |
| Number of structures |
| Number of structures that pass by the transducer per second |
| Occurrences per rotor revolution |
| Frequency in Hertz |
| Mass flow rate injected into the rim seal cavity |
| Mass flow rate though the main gas path |
| Rotor speed in rotations per minute |
| T | Time to rotate the rotor one blade pitch |
| t | Elapsed time from start |
| Peak location at time step |
| Peak location at next time step |
| Computational time step |
References
- Cao, C.; Chew, J.W.; Millington, P.R.; Hogg, S.I. Interaction of Rim Seal and Annulus Flows in an Axial Flow Turbine. ASME J. Eng. Gas Turb. Power 2004, 126, 786–793. [Google Scholar] [CrossRef]
- Phadke, U.P.; Owen, J.M. Aerodynamic Aspects of the Sealing of Gas-Turbine Rotor-Stator Systems. Part 1: The Behavior of Simple Shrouded Rotating-Disk Systems in a Quiescent Environment. Int. J. Heat Fluid Flow 1988, 9, 98–105. [Google Scholar] [CrossRef]
- Phadke, U.P.; Owen, J.M. Aerodynamic Aspects of the Sealing of Gas-Turbine Rotor-Stator Systems. Part 2: The Performance of Simple Seals in a Quasi-Axisymmetric External Flow. Int. J. Heat Fluid Flow 1988, 9, 106–112. [Google Scholar] [CrossRef]
- Phadke, U.P.; Owen, J.M. Aerodynamic Aspects of the Sealing of Gas-Turbine Rotor-Stator Systems. Part 3: The effect of nonaxisymmetric external flow on seal performance. Int. J. Heat Fluid Flow 1988, 9, 113–117. [Google Scholar] [CrossRef]
- Owen, J.M.; Zhou, K.; Pountney, O.; Wilson, M.; Lock, G. Prediction of Ingress through Turbine Rim Seals Part 1: Externally-Induced Ingress. ASME Turbo Expo. 2010, GT-2010–23346, 1217–1234. [Google Scholar] [CrossRef]
- Sangan, C.M.; Lalwani, Y.; Owen, J.M.; Lock, G. Experimental Measurements of Ingestion Through Turbine Rim Seals. Part 5: Fluid Dynamics of Wheel-Space. ASME Turbo Expo. 2013, GT2013–94148, V03AT15A003. [Google Scholar] [CrossRef]
- Jakoby, R.; Zierer, T.; Lindblad, K.; Larsson, J.; deVito, L.; Bohn, D.E.; Funcke, J.; Decker, A. Numerical Simulation of the Unsteady Flow Field in an Axial Gas Turbine Rim Seal Configuration. ASME IGTI 2004, GT-2004–53829, 431–440. [Google Scholar]
- Julien, S.; Lefrancois, J.; Dumas, G.; Boutet-Blais, G.; Lapointe, S.; Caron, J.-F.; Marini, R. Simulations of Flow Ingestion and Related Structures in a Turbine Disk Cavity. ASME IGTI 2010, GT-2010–22729, 1071–1080. [Google Scholar]
- Wang, C.Z.; Johnson, B.V.; Mathiyalagan, S.P.; Glahn, J.A.; Cloud, D.F. Rim Seal Ingestion in a Turbine Stage from 360-Degree Time-Dependent Numerical Simulations. ASME Trans. ASME J. Turbomach. 2013, 136, 031007. [Google Scholar] [CrossRef]
- Mirzamoghadam, A.V.; Kanjiyani, S.; Riahi, A.; Vishnumolakala, R.; Gundeti, L. Unsteady 360 CFD Validation of a Turbine Stage Mainstream/Disc Cavity Interaction. ASME IGTI 2014, GT-2014–25466, 011008. [Google Scholar]
- Palafox, P.; Ding, Z.; Bailey, J.; Vanduser, T.; Kirtley, K.; Moore, K.; Chupp, R. A New 1.5-Stage Turbine Wheelspace Hot Gas Ingestion Rig (HGIR)—Part I: Experimental Test Vehicle, Measurement Capability and Baseline Results. ASME IGTI 2013, GT-2013–96020, V03AT15A021. [Google Scholar]
- Basol, A.M.; Raheem, A.; Huber, M.; Abhari, R.S. Full-Annular Numerical Investigation of the Rim Seal Cavity Flows Using GPU’s. ASME IGTI 2014, GT-2014–26755. [Google Scholar] [CrossRef]
- Palafox, P.; Ding, Z.; Moore, K.; Chupp, R.; Kirtley, K. A New 1.5-Stage Turbine Wheelspace Hot Gas Ingestion Rig (HGIR)—Part II: CFD Modeling and Validation. ASME IGTI 2013, GT-2013–96021, V03AT15A022. [Google Scholar]
- Beard, P.F.; Chew, J.; Gao, F.; Chana, K.S. Unsteady Flow Phenomena in Turbine Rim Seals. ASME IGTI 2016, GT-2016–56110, 032501. [Google Scholar]
- Lakshminarayana, B.; Camci, C.; Halliwell, I.; Zaccaria, M. Design, Development, and Prediction of a Turbine Research Facility to Study Rotor Stator Interaction Effects. Int. J. Turbo Jet Engines 1996, 13, 155–172. [Google Scholar] [CrossRef]
- Town, J. An Investigation of Rim Seal/Disk Cavity Flow and Its Interaction with High Pressure Turbine Rotor Flows. Ph.D. Thesis, The Pennsylvania State University, University Park, PA, USA, 2015. [Google Scholar]
- Camci, C. A Turbine Research Facility to Study Tip Desensitization Including Cooling Flows. In Turbine Blade Tip Design and Tip Clearance Treatment; Von Karman Institute Lecture Series; VKI-LS 2004-2; Von Karman Institute for Fluid Dynamics: Rhode Saint Genese, Belgium, 2004; pp. 1–26. ISBN 2-930389-51-6. [Google Scholar]
- McLean, C.; Camci, C.; Glezer, B. Mainstream Aerodynamic Effects Due to Wheelspace Coolant Injection in a High-Pressure Turbine Stage: Part I—Aerodynamic Measurements in the Stationary Frame. Trans. ASME J. Turbomach. 2001, 123, 687–696. [Google Scholar] [CrossRef]
- McLean, C.; Camci, C.; Glezer, B. Mainstream Aerodynamic Effects due to Wheel Space Coolant Injection in a High-Pressure Turbine Stage, Part-II Rotational Frame Measurements. Trans. ASME J. Turbomach. 2001, 123, 697–703. [Google Scholar] [CrossRef]
- Averbach, M. Simulation and Experimental Validation of the Wheel Space of the Axial Flow Turbine Research Facility Under Low Purge Flow Conditions. Master’s Thesis, The Pennsylvania State University, University Park, PA, USA, 2014. [Google Scholar]
- Turgut, H.Ö.; Camci, C. Factors Influencing Computational Predictability of Aerodynamic Losses in a Turbine Nozzle Guide Vane Flow. ASME J. Fluids Eng. 2016, 138, 051103–051113. [Google Scholar] [CrossRef]
Figure 1.
Cross-sectional view of the Axial Flow Turbine Research Facility (AFTRF).
Figure 1.
Cross-sectional view of the Axial Flow Turbine Research Facility (AFTRF).
Figure 2.
Rim seal cavity geometry and unsteady sensor location. NGV refers to nozzle guide vane.
Figure 2.
Rim seal cavity geometry and unsteady sensor location. NGV refers to nozzle guide vane.
Figure 3.
Flush-mounted piezo-resistive pressure transducers in rim seal cavity, 5° apart.
Figure 3.
Flush-mounted piezo-resistive pressure transducers in rim seal cavity, 5° apart.
Figure 4.
Fast Fourier transform (FFT) of pressure signals from Transducer 1, Case 1 ( is 0.28%).
Figure 4.
Fast Fourier transform (FFT) of pressure signals from Transducer 1, Case 1 ( is 0.28%).
Figure 5.
FFT of pressure signals from Transducer 2, Case 1 ( is 0.28%).
Figure 5.
FFT of pressure signals from Transducer 2, Case 1 ( is 0.28%).
Figure 6.
Enhanced view of pressure signals Transducer 1 (left, blue) and Transducer 2 (right, red).
Figure 6.
Enhanced view of pressure signals Transducer 1 (left, blue) and Transducer 2 (right, red).
Figure 7.
Butterworth bandpass-filtered pressure signals Transducer 1 (left, blue) and Transducer 2 (right, red).
Figure 7.
Butterworth bandpass-filtered pressure signals Transducer 1 (left, blue) and Transducer 2 (right, red).
Figure 8.
Filtered pressure history with identified peaks.
Figure 8.
Filtered pressure history with identified peaks.
Figure 9.
Time for an unsteady structure to traverse from Transducer 1 to Transducer 2, histogram.
Figure 9.
Time for an unsteady structure to traverse from Transducer 1 to Transducer 2, histogram.
Figure 10.
Meridional view of the computational domain, stationary domain (green), and rotating domain (red).
Figure 10.
Meridional view of the computational domain, stationary domain (green), and rotating domain (red).
Figure 11.
Static pressure across the NGV side rim seal cavity at varying time. The variable t represents the current time, while T represents the time it takes for the rotor to move one blade pitch.
Figure 11.
Static pressure across the NGV side rim seal cavity at varying time. The variable t represents the current time, while T represents the time it takes for the rotor to move one blade pitch.
Figure 12.
Static pressure peak location.
Figure 12.
Static pressure peak location.
Table 1.
Experimental uncertainty estimates of the measured rim seal chamber and turbine parameters.
Table 1.
Experimental uncertainty estimates of the measured rim seal chamber and turbine parameters.
| Measurement | Uncertainty |
|---|
| Validyne DP15-30 | ±5 Pa |
| K-Type Thermocouple | ±0.2 K |
| Atmospheric Pressure | ±25 Pa |
| Endevco Model 8507C-1 | ±5 Pa |
| Validyne ZOC22B/32Px-1psid | ±5 Pa |
| Validyne ZOC22B/32Px-2.5psid | ±15 Pa |
Table 2.
The two experimental test cases along with target speed and purge flow rate.
Table 2.
The two experimental test cases along with target speed and purge flow rate.
| Test Case | | |
|---|
| Target | 1430 | 0.25% or 0% |
| Case 1 | 1433 | 0.28% |
| Case 2 | 1433 | 0.00% |
Table 3.
The results of experimental and computational analysis of unsteady cells within the rim seal cavity. CFD refers to computational fluid dynamics.
Table 3.
The results of experimental and computational analysis of unsteady cells within the rim seal cavity. CFD refers to computational fluid dynamics.
| Quantity Compared | Experimental | CFD |
|---|
| Number of Cells | 15 | 14.5 |
| Cell Speed/Rotor Speed | 77.5% | 81.7% |
© 2019 by the authors. Licensee MDPI, Basel, Switzerland. This article is an open access article distributed under the terms and conditions of the Creative Commons Attribution (CC BY) license (http://creativecommons.org/licenses/by/4.0/).


