Article

Computational Analysis of Compressed Stiffened Composite Panels with Impact Damage

by
Alexander A. Ryabov
1,
Evgeny E. Maslov
1,
Dmitry Y. Strelets
2,* and
Vladimir G. Slobodchikov
3
1
Sarov Engineering Center, Nizhny Novgorod Region, Techno-Park «Sarov» 607328, Russia
2
Moscow Aviation Institute, National Research University, Moscow 125993, Russia
3
Joint-Stock Company, Aero Composite, Moscow 125284, Russia
*
Author to whom correspondence should be addressed.
Aerospace 2019, 6(3), 25; https://doi.org/10.3390/aerospace6030025
Submission received: 15 November 2018 / Revised: 9 February 2019 / Accepted: 15 February 2019 / Published: 27 February 2019
(This article belongs to the Special Issue Structural Stability of Aerospace Structures)

Abstract

:
A complex modeling technique is presented in this paper for a numerical analysis of compressed stiffened composite panels with impact damage. The numerical technique is based on the LS-Dyna code application, which simulates both the dynamic deformation of the panel subjected to a local impact and the quasi-static uniform compression of the panel within the local damage zone. The technique has been validated by both impact and compression experimental tests of the stiffened composite panel. The obtained numerical results show that impact damage to the composite panel can reduce the carrying capacity in more than 50% of damaged panels compared to undamaged panels.

Graphical Abstract

1. Introduction

Fiber reinforced polymer (FRP), which has high strength characteristics, is widely used in aerospace, shipbuilding, and other industries. Scientific investigations of composite structures have been carried out over several decades [1,2,3,4,5,6,7,8,9,10,11,12]. General aspects of the numerical modeling of deformations and failure of aircraft structures, made of composite materials are presented in [12]. This paper points out that the increased use of FRP presents new difficulties for stress analysis due to the complicated structure and highly complex failure modes of composite materials. When solving problems with composite materials it is necessary to take into account physical nonlinearity, large displacements, and contact interactions of layers and fibers of FRP laminates. It is important for correct predictions of reciprocal action of the possible buckling and instability of loading process and damage growth, reducing residual strength of composite structure. It is well known that composite plates and shells are very sensitive to local dynamic loads, such as the hail, and the impact of small stones from the runway. It is noted in [11] that, with relatively low levels of kinetic energy, impact damage appears inside composite materials and can be invisible on the external surface of the structure. The experimental results show that the damage occurs within a conical contact zone with the apex at the point of impact [13]. A real damage zone also includes broken fibers, matrix cracks, and delamination of plies. In the compression of thin panels, this local damaged zone with delamination allows the fibers to buckle at much lower strains than in an undamaged region. Therefore, predicting delamination growth due to buckling is very important.
Some results of numerical simulations of the post-buckling delamination growth in compressed composite plates and shells are presented in [14,15,16,17]. A finite-element nonlinear analysis of the post-buckling behavior of a compressed rectangular plate with circular delamination was conducted in [15] with the ABAQUS code and validated by experimental data. There was a discrepancy within 10% between the predicted load for delamination growth and the values measured from the tests. In general, the “compression after impact” problem remains for composite materials, limiting allowable compressive strains, often as low as ε = 0.3%.
Different approaches for numerical simulations of impulse dynamic loading, predicting impact damage of composite structures and analysis of experimental data, are described in [18,19,20,21,22,23,24,25,26]. Most of the numerical test results presented in these papers have been obtained on coupons with an impact velocity of less than 5 m/s and a mass of less than 5 kg. The tests [18,19] show that the damage caused by the low-velocity impact with kinetic energy of Ek ~60 J can reduce the compressive properties of coupons by up to 50% and reduce the compressive properties of stringer stiffened panels by as much as 20% [21]. A series of carbon composite thin plates were tested in the range of impact energy Ek = 0.60–9.34 J in [20] and compared with numerical results obtained with finite-element impact code FE77 with explicit solver and the LS-Dyna code. The developed modeling technique has worked well for carbon composites and allowed the predication of the force history and the onset of delamination. Additionally, different composite plates and stiffened panels subjected to impacts with an energy of Ek = 13–25 J were studied in [22]. It is noted in this paper that the debilitating effects on compression strength limit the permissible design strain levels to 0.3–0.4%. A modeling technique based on the LS-Dyna code was developed in [23] using single-layer shell elements to predict both the in-plane damage and delamination. This technique was applied to a stiffened composite plate loaded with Ek ~ 15 J and validated by comparing the numerical and test results of [21], with differences of 16% for force–time response and 20% for damage area being obtained. Delamination threshold load assessment was studied in [24] for 100 × 100 mm square samples of glass–carbon–epoxy composite. It was experimentally found that there was a threshold impact energy of Ek = 1.5 J independent of the glass fiber stacking sequence. Moreover, 150 × 100 mm rectangular plates of carbon fiber–epoxy were tested in [26] with low-velocity impacts in the range of Ek = 15–35 J. It is pointed out in this paper that delamination area and its shape depend on the stacking sequence.
A brief literature survey shows that all observed publications can be divided into two separate groups: the first one includes investigations of damage in composite structures subjected to local dynamic loading, and the second one presents an analysis of the post-buckling behavior of the initially damaged structures to predict load for delamination growth. In the present paper, an attempt has been made to develop a modeling tool and conduct complex analysis simulating both stages on the base of one platform using the LS-Dyna code: dynamic loading by impactor and static compression of stiffened panel with impact damage obtained in the first stage.
All new aircrafts have to meet very stringent requirements of national and international aviation rules. A designer must demonstrate the static strength and carrying capacity of the units made of composite materials, preliminarily subjected to local dynamic loading with kinetic energy of Ek = 135 J [11]. This impulse is transmitted by an impactor with a spherical end. Such loading conditions are investigated here.

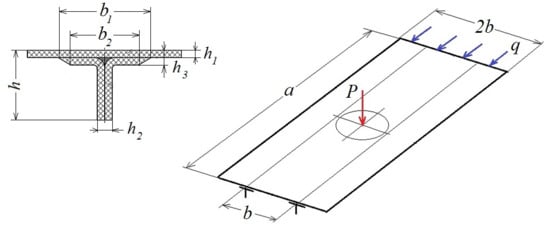
2. Statement of Work and Governing Equations

Deformations of a thin-walled stiffened panel are described according to the Lagrange approach [27]. There are two coordinate systems: the first one is a fixed rectangular Cartesian coordinate system, X = [ X 1 X 2 X 3 ] , and the second one is a local coordinate system, x = [ x 1 x 2 x 3 ] , with directional cosines n i j :
x i = n i j X j ,   i , j = 1 , 3 ¯ .
The origin of the local coordinates is located at a midsurface of the panel, axis x 3 is a normal to the midsurface, and x 1 ,   x 2 are orthogonal to x 3 . We assume that transverse shear deformations are small, which allows us to suppose that the local basis is orthogonal during all the process of deformation. The velocity–strain components in the local basis ε ˙ i j are defined by velocity–strain components in the general basis e ˙ i j :
ε ˙ i j = n i m n j k e ˙ m k ,
Velocity–strain components e ˙ i j are defined in a current state metrics:
e ˙ i j = ( U ˙ i , j + U ˙ j , i ) / 2 ,     ( i , j = 1 , 3 ¯ ) X i = X i |   t = 0 + 0 t U ˙ i d t
where displacements U i are defined in Cartesian coordinate system X, comma means a space derivative, and a superposed dot denotes a time derivative.
The equation of motion is written in the form of the variation principle of balance of virtual powers of work [28,29]:
Ω σ i j δ ε ˙ i j d V + Ω ρ U ¨ i δ U ˙ i d V = Γ p P i δ U ˙ i d γ + Γ q P i q δ U ˙ i d γ ,     ( i , j = 1 , 3 ¯ )
where: σ i j —components of stress tensor, ρ —density, P i q —contact pressure, Pi—distributed load, Ω —volume of structure, Γq—contact surface, Γp—surface of external pressure is applied, δ ε ˙ i j , δ U ˙ i —variations of ε ˙ i j , and U ˙ i at the surface with given boundary conditions δ U ˙ i = 0 .
Equations of state for polymer composite material with sandwich structure of fiber plies are formulated as for orthotropic material model Chang-Chang [30], which can be written for 2D in-plane state of stress, typical for layers of stiffened panel, in the following form:
ε 11 = 1 E 1 ( σ 11 ν 1 σ 22 ) ε 22 = 1 E 2 ( σ 22 ν 2 σ 11 ) 2 ε 12 = 1 G 12 τ 12 + α τ 12 3
where: E1, ν1—elastic moduli and Poisson ratio, respectively, in the longitudinal direction; E2, ν2—elastic moduli and Poisson ratio, respectively, in transverse direction; and G12—shear modulus of monolayer. The third equation in (4) defines the nonlinear shear-stress parameter α. A fiber matrix shearing term augments each damage mode:
τ ¯ = τ 12 2 2 G 12 + 3 4 α τ 12 4 S 12 2 2 G 12 + 3 4 α S 12 4 ,
which is the ratio of the shear stress to the shear strength S12. The failure criteria for matrix cracking Fmatrix, compression Fcomp, and fiber breakage Ffiber are given by the following equations:
F m a t r i x = ( σ 22 S 2 ) 2 + τ ¯ ,
F c o m p = ( σ 22 2 S 2 ) 2 + [ ( C 2 2 S 12 ) 2 1 ] σ 22 C 2 + τ ¯ ,
F f i b e r = ( σ 11 S 1 ) 2 + τ ¯ ,
where: S1, S2—longitudinal and transverse tensile strength, S12—shear strength, and C2—transverse compressive strength. Failure is assumed if any criteria Fmatrix, (comp, fiber) > 1 and constants E1, E2, G12, ν1, and ν2 are set to zero.
Modeling of delaminations: In the suggested approach, every composite layer is simulated as a separate domain. For every pair of adjacent domains, the specific contact algorithm, CONTACT...TIEBREAK [31], is applied. Delamination between domains appears if:
( σ n N F L S ) 2 + ( σ S S F L S ) 2 1
where: σn, σs—normal and shear stresses in the connection, respectively NFLS, SFLS—ultimate normal and shear stresses, respectively. If delamination appears between domains, usual contact interaction is applied for further simulation.
An explicit scheme for time discretization and the finite element method [28] are used to numerically solve Equations (1)–(10).
The problem of local dynamic loading and consequent uniform static compression of the stiffened composite rectangular flat panel of constant thickness h1 with sizes of a × 2b is considered in this paper (see Figure 1). At the first stage, the panel is locally impacted by dynamic force P caused by steel impactor. Then, at the second stage, the panel is statically loaded by longitudinal compression applied as uniform displacements at the free edge of the panel. The opposite edge of the panel is rigidly restrained, and symmetrical boundary conditions are applied at the side edges of the panel.
The panel is made of carbon/epoxy FRP with laminate stacking sequence (+45°, 0°, −45°, 0°, 90°, 0°, −45°, 0°, and +45°)3s. The normalized dimensions of the panel are presented in Table 1.

3. Local Dynamic Deformation of the Panel

The finite-element model based on 8-node brick elements SOLID_ORTHO [31] was developed to simulate dynamic deformation of the panel subjected to local impact. In this computing model, every fiber layer is simulated by a separate layer of solid finite elements (Figure 2). The number of finite elements in this model is about 1.25 million.
The weight M and initial velocity V of the dropping pin impacting the panel between stringers with kinetic energy Ek = 140 J are presented in Figure 2. Some results of numerical simulations obtained with LS-Dyna code are shown in Figure 3 and Figure 4. A comparison of contact interaction force P between rod and panel via time obtained in experiment (curve 1) and in simulation (curve 2) is shown in Figure 3. A Dynatup INSTRON 9250 HV (Instron, High Wycombe, UK) pile driver with vertical dropping pin, having a spherical end with a diameter of 25.4 mm, was used to inflict impact damage. It can be seen that there is a small reduction of the contact force at Pexp ~ 6.5 kN and t1 ~ 0.6 ms in the experiment, perhaps due to partial failure of fibers and matrix. The numerical curve also demonstrates some reduction of the contact force at Pnum ~ 12.3 kN at t2 ~ 1.2 ms. In general, numerical and experimental force time histories are close to each other when they grow. At the same time, the maximal level of the numerical force, Pnum max ~ 19.3 kN, exceeds the experimental level, Pexp max ~ 16.1 kN, by ~ 20%. The numerical duration of the impulse also exceeds the experimental one. There is one more curve 3 in Figure 3, obtained for the same level of kinetic energy, Ek = 140 J, and impactor weight of M = 1.7 kg. It can be seen from Figure 3 that the same level of kinetic energy provides a different impulse of the contact force.
Figure 4 shows delamination zones defined with acoustic ultrasonic control in four tests (curve 1) and corresponding numerical damage zones obtained for an impactor of M = 15.8 kg (curve 2) and for an impactor of M = 1.7 kg (curve 3). The quantity b is the distance between stringers. A comparison of the test sizes and numerical dimensions of the damage zones are presented in Table 2.
Curves of dimensionless stresses in the longitudinal direction alone fibers ( σ ¯ 1 ) and in the transversal direction ( σ ¯ 2 ) in the top monolayer (dotted line) and bottom monolayer (solid line) are shown in Figure 5 for two impacts with the same kinetic energy, Ek = 136 J, for two impactors having masses of M1 = 1 kg (curve 1) and M2 = 10 kg (curve 2). Top and bottom points in which stresses have collected are located on the axis of impact. Dimensionless stresses are normalized with corresponding ultimate stresses of tension (+) and compression (−) of fibers and matrix. Numerical results show that bottom fibers maintain strength and top fibers do not for both impactor masses. Failure of the top compressed fibers for both masses begins at approximately t ~ 0.4–0.5ms. Stress σ ¯ 2 in the matrix of the top monolayer does not reach limit stress of compression, however in the bottom monolayer it exceeds this limit slightly only for mass M2 = 10 kg.
Due to impact loading damage appears in the layers of fibers and between layers. Any fibers can be ruptured due to tension or destroyed by bending and compression in the layers, and the matrix also can be damaged. Modeling technique allows the prediction of sizes of damage zones for both matrix failure and delamination of layers.
Cross-sections of calculated impact damage zones in the longitudinal direction are presented in Figure 6. The dimensionless sizes of the damage zones are normalized by the distance between stringers—b. It can be seen that loading with the same kinetic energy, Ek = 136 J = const., in two loading cases with rod masses M1 = 1 kg and M2 = 10 kg provides different sizes of damage zones, with the impact of the heavy rod causing an increase of damage areas of 15–20%.

4. Quasi-Static Compression of the Panel

The impact damage zone is specified as a delaminated area with contact interaction between composite layers with overall sizes preliminarily defined by numerical simulations and ultrasonic control of the panel. The broken fibers and matrix cracks in layers are not included in the computing model. Solving of the problem is carried out with explicit method [27] by slow growing of the edge uniform displacements to exclude dynamic effects. Some numerical results are presented in Figure 7, Figure 8 and Figure 9.
Dimensionless load–displacement curves are shown in Figure 7 for undamaged panel (curve 1) and for the panel with impact damage (curve 2). The dimensionless load q ¯ is normalized with a critical level of compressive load and dimensionless displacement is normalized with the thickness of the plate. The maximal displacement of the undamaged panel grows monotonically. In the panel with local impact damage, displacement demonstrates complicated behavior, caused by the local buckling in the damage zone. As can be seen from Figure 7 and Figure 8, weak bending of the layers with small hardening occurs in the damage area at a load of about q ¯ = 0.4 . General delamination of the layers and separation of the stringers begin at a load of q ¯ = 1.0 , and it follows to the formation of general transversal buckling folding and defines a carrying capacity of the damaged panel.
The level of the load at which the ultimate compression stress of the fibers is reached in the undamaged panel, q ¯ = 2.2 , is marked by a small cross on curve 1. It can be concluded that the local impact damage zone reduces the carrying capacity of composite panel by more than 50%.
The curves of longitudinal strains specific points on the external surface of the panel near the impact damage zone are shown in Figure 9. The numbers of the curves corresponding to the point numbers are presented in Figure 9. The panel is compressed along the line crossing gauges located at points 4–7. Numerical results show that deformations at all points grow nearly linearly to a level of ε ~ 0.26–0.27%, up to a load of q ¯ = 0.4 0.45 . Then, the deformations are changed significantly with load growing up to the level of q ¯ = 1.0 . Gauge 2 is located just on the top of the buckling fold crossing the panel in the transverse direction (see Figure 7). That is why, due to extensive bending compression, strain at point 2 is reduced rapidly, passing into tension deformation. A small reduction of compression strains takes place at points 5 and 6 closing to the damage delaminated zone. In the adjacent points 4 and 7 located at the same axis, compression deformations remain close to the constant level by the load of q ¯ = 1.0 . Compression strains at points 1 and 3 continue to grow due to additional bending during the formation of the buckle fold.
A comparison of the obtained numerical results and experimental data is presented in Table 3. Compression tests of the panels were implemented with MTS500 automatic hydraulic test bench (PCE Group CO KG, Meschede, Germany) with a maximal load of 5000 kN and measuring accuracy of 1%. Strain measurement was conducted with CTMM strain gage equipment.
One can see that the calculated strains agree with measured ultimate deformations corresponding to the carrying capacity level of the damaged panel.

5. Conclusions

  • A complex modeling technique has been developed on the basis of the LS-Dyna code for the prediction of local impact damage and its influence on the carrying capacity of a compressed flat stiffened composite panel. The numerical analysis shows that local buckling of delaminated fibers in impact damage zone is one of the main reasons for a significant reduction of the carrying capacity of the compressed FRP stiffened panel.
  • The validity of the modeling technique was confirmed by the agreement between the numerical and experimental results. The maximal dynamic force and impulse duration in the simulation of local impact exceed experimental data by no more than ~20%. The numerical and experimental sizes of the impact damage zone are ~0.7b and close to each other. These predictions could be quite acceptable for preliminary engineering analysis.
  • The fixed level of the kinetic energy of Ek = const. is not a fully correct measure of local damage for FRP stiffened panel, since the decrease of the impactor weight and keeping Ek = const. cause decreasing sizes of damage zone.
  • Quasi-static simulation of the damaged panel at the stage of longitudinal compression allows the prediction of the ultimate longitudinal strains near the impact damage zone: εnum = −0.25 to −0.48%, which are close to the experimental levels: εexp = −0.27% to −0.45%, corresponding to the carrying load of the FRP panel.
  • The obtained numerical results show that the local impact damage zone can reduce the carrying capacity of the compressed composite panel by more than 50% compared to the undamaged composite panel.

Author Contributions

Conceptualization, A.A.R., D.Y.S. and V.G.S.; Methodology, A.A.R.; Validation, E.E.M.; Formal Analysis, D.Y.S. and V.G.S.; Investigation, A.A.R. and E.E.M.; Writing-Original Draft Preparation A.A.R.; Writing-Review & Editing, A.A.R.

Funding

This research received no external funding.

Acknowledgments

The authors thank for experimental results kindly provided by Russian Federal Central Aero-Hydrodynamic Institute.

Conflicts of Interest

The authors declare no conflict of interest.

References

  1. Bolotin, B.V.; Novichkov, Y.N. Mechanics of Multilayers Structures; Mashinostroenie: Moscow, Russia, 1980. (In Russian) [Google Scholar]
  2. Vasiliev, V.V.; Morozov, E.V. Mechanics and Analysis of Composite Materials; Elsevier Science Ltd.: Amsterdam, The Netherlands, 2001. [Google Scholar]
  3. Abrosimov, N.A.; Bazhenov, V.G. Nonlinear Problems of Dynamics of the Composite Structures; NNSU: Nizhny Novgorod, Russia, 2002; 400p. (In Russian) [Google Scholar]
  4. Ladeveze, P.; Le Dantec, E. Damage modeling of the elementary ply for laminated composites. Compos. Sci. Technol. 1992, 43, 257–267. [Google Scholar] [CrossRef]
  5. Kenane, M.; Benzeggagh, M.L. Mixed-mode delamination fracture toughness of unidirectional glass/epoxy composites under fatigue loading. Compos. Sci. Technol. 1997, 57, 597–605. [Google Scholar] [CrossRef]
  6. Zinoviev, P.A.; Grigoriev, S.V.; Lebedeva, O.V.; Tairova, L.P. The strength of multilayered composites under a plane-stress state. Compos. Sci. Technol. 1998, 57, 1209–1223. [Google Scholar] [CrossRef]
  7. Camanho, P.P.; Da’vila, C.G.; Pinho, S.T.; Iannucci, L.; Robinson, P. Prediction of in situ strengths and matrix cracking in composites under transverse tension and in-plane shear. Compos. Part A Appl. Sci. Manuf. 2006, 37, 165–176. [Google Scholar] [CrossRef] [Green Version]
  8. Da´vila, C.; Camanho, P.P.; Turon, A. Effective simulation of delamination in aeronautical structures using shells and cohesive elements. J. Aircr. 2008, 45, 663–672. [Google Scholar] [CrossRef]
  9. Krueger, R.; Ratcliffe, J.G.; Minguet, P.J. Panel stiffener debonding analysis using a shell/3D modeling technique. Compos. Sci. Technol. 2009, 69, 2352–2362. [Google Scholar] [CrossRef] [Green Version]
  10. Gutkin, R.; Pinho, S.T.; Robinson, P.; Curtis, P.T. On the transition from shear-driven fiber compressive failure to fiber kinking in notched CFRP laminates under longitudinal compression. Compos. Sci. Technol. 2010, 70, 1223–1231. [Google Scholar] [CrossRef]
  11. Backer, A.; Dutton, S.; Kelly, D. Composite Materials for Aircraft Structures, 2nd ed.; American Institute of Aeronautic and Astronautic, Inc.: Reston, VA, USA, 2004. [Google Scholar]
  12. Ostergaard, M.G.; Ibbotson, A.R.; Le Roux, O.; Prior, A.M. Virtual Testing of Aircraft Structures. CEAS Aeronaut. J. 2011, 1, 83–103. [Google Scholar] [CrossRef]
  13. Clark, G.; Saunders, D.S. Morphology of Impact Damage Growth by Fatigue in Carbon Fiber Composite Laminates. Mater. Forum 1991, 15, 333–342. [Google Scholar]
  14. Naganarayana, B.P.; Atluri, S.N. Computational Model for Analysis Interactive Buckling and Delamination Growth in Composite Structures. Sadhana Acad. Proc. Eng. Sci. 1996, 21, 547–575. [Google Scholar]
  15. Reeder, J.R.; Kyongchan, S.; Chunchu, P.B.; Ambur, D.R. Postbuckling and Growth of Delaminations in Composite Plates Subjected to Axial Compression. In Proceedings of the AIAA 2002-1746, 43rd AIAA/ASME/ASCE/AHS/ASC Structures, Structural Dynamics, and Material Co-Located Conferences, Denver, CO, USA, 22–25 April 2002. [Google Scholar]
  16. Patel, B.P.; Gupta, A.K. An investigation on nonlocal continuum damage models for composite laminated panels. Compos. B Eng. 2014, 60, 485–494. [Google Scholar] [CrossRef]
  17. Wan, Y.; Sun, B.; Gu, B. Multi-scale structure modeling of damage behaviors of 3D orthogonal woven composite materials subject to quasi-static and high strain rate compression. Mech. Mater. 2016, 94, 1–25. [Google Scholar] [CrossRef]
  18. Cantwell, W.; Morton, J. An assessment of residual strength of an impact damaged carbon-fiber reinforced epoxy. Compos. Struct. 1990, 14, 303–317. [Google Scholar] [CrossRef]
  19. Hull, D.; Shi, B.Y. Damage mechanism characterization in composite damage tolerance investigations. Compos. Struct. 1993, 23, 99–120. [Google Scholar] [CrossRef]
  20. Davies, G.A.; Zhang, X. Impact Damage Predictions in Carbon Composite Structures. J. Impact Eng. 1995, 16, 149–170. [Google Scholar] [CrossRef]
  21. Greenhalgh, E.; Bishop, S.M.; Braz, D.; Hughes, D.; Lahiff, S.; Millson, B. Characterization of impact damage in skin-stringer composite structures. Compos. Struct. 1996, 36, 187–207. [Google Scholar] [CrossRef]
  22. Zhang, X. Impact Damage in Composite Aircraft Structures—Experimental Testing and Numerical Simulation. J. Aerosp. Eng. 1998, 212, 245–259. [Google Scholar] [CrossRef]
  23. Rajbhandari, S.P.; Scott, M.L.; Thomson, R.S. An Approach to Modelling and predicting Impact Damage in Composite Structures. In Proceedings of the ICAS 2002 Congress, Toronto, ON, Canada, 8–13 September 2002. [Google Scholar]
  24. Imielinska, K.; Wojtyra, R.; Kozlowski, M. On Delamination Threshold Loads in Low Velocity Impact on Glass-Carbon/Epoxy Composites. Kompozyty (Compos.) 2005, 5, 69–74. [Google Scholar]
  25. Olsson, R. Modelling of impact damage zone in composite laminates for strength after impact. Aeronaut. J. 2012, 116, 1349–1365. [Google Scholar] [CrossRef]
  26. Al-Hadrayi Ziadoon, M.R.; Zhou, C. Effect the Stacking Sequences of Composite Laminates under Low Velocity Impact on Failure Modes by Using Carbon Fiber Reinforced Polymer. Int. J. Eng. Sci. (IJES) 2016, 5, 53–62. [Google Scholar]
  27. Bazhenov, V.G.; Demareva, A.V.; Zhestkov, M.N.; Kibets, A.I. Special features of numerical simulation for elastic-plastic buckling of hemispherical shells under loading with the rigid indenter. PNRPU Mech. Bull. 2016, 2, 22–33. [Google Scholar] [CrossRef]
  28. Belytschko, T.; Liu, W.K.; Moran, B. Nonlinear Finite Elements for Continua and Structures; John Wiley & Sons: New York, NY, USA, 2000; 600p. [Google Scholar]
  29. Washizu, K. Variational Methods in Elasticity and Plasticity; Pergamon Press: Oxford, UK, 1982. [Google Scholar]
  30. Chang, F.K.; Chang, K.Y. A progressive damage model for laminated composites containing stress concentrations. J. Compos. Mater. 1987, 21, 834–855. [Google Scholar] [CrossRef]
  31. Hallquist John, O. LS-DYNA Theory Manual LSTC; Livermore Software Technology Corporation: Livermore, CA, USA, 2017. [Google Scholar]
Figure 1. Stiffened panel with impact damage. a—panel length; b—half panel width or the distance between the stringers; h1—the composite plating thickness; b1, b2, h2—the stringer geometric parameters; h3—the sum of the stringer shelf thickness and the composite plating thickness; h—the sum of stringer height and the composite plating thickness; P—force caused by impactor.
Aerospace 06 00025 g001
Figure 2. Fragment of the panel finite-element model. V—the impactor initial velocity, M—the impactor weight.
Aerospace 06 00025 g002
Figure 3. Contact force between impactor and panel. P—force caused by impactor; t—time; Ek—kinetic energy.
Aerospace 06 00025 g003
Figure 4. Experimental and numerical damage zones.
Aerospace 06 00025 g004
Figure 5. Stresses in fibers ( σ ¯ 1 ) and matrix ( σ ¯ 2 ).
Aerospace 06 00025 g005
Figure 6. Impact damage zones in the longitudinal direction. M1, M2—the weights of different impactors; L1—the size of matrix damage area; L2—the size of delamination area.
Aerospace 06 00025 g006
Figure 7. Displacements of undamaged and damaged panels. q ¯ —dimensionless load; U ¯ —dimensional displacement; σf—actual compression stress in the fibers, [σc]—ultimate compression stress of the fibers.
Aerospace 06 00025 g007
Figure 8. Post-buckling deformations of the panel in the transversal and longitudinal directions near the damage area.
Aerospace 06 00025 g008
Figure 9. Strains in tested points near impact damage zone.
Aerospace 06 00025 g009
Table 1. Main normalized dimensions of the carbon/epoxy fiber reinforced polymer pane 1.
hh2h3abb1b2
7.52.02.06623.317.011.4
1 Dimensions are normalized by h1 value.
Table 2. The sizes of the damage zone.
ResultsExperimentSimulation *
Size in X direction0.64–0.75b0.65b
Size in Y direction0.63–0.70b0.88b
* Simulations with M = 15.8 kg.
Table 3. Longitudinal strains ε near damage zone ( q ¯ —dimensionless load).
Load q ¯ Points Experimental ε, %Numerical ε, %
1.01 −0.45−0.44
3−0.48−0.45
4−0.26−0.25
7−0.30−0.27

