1. Introduction
Various efforts have always been made to improve the ability of a fighter. A critical fighter capability is to make maneuvering movements at high angles of attack (AoA) and using small rotation angles. The wings limitations when facing high AoA is defiance to developing a suitable wing configuration to avoid stall conditions while flying. The aerodynamic design of an aircraft has continued to progress since its introduction in the 1920s. Previous research activities on aircraft strategies aiming to reduce drag usually focus on wing design, lift surface forces, and especially on airfoil design. However, at high-speed conditions, precise aircraft design is significant to reduce the total drag of an aircraft and improve flight performance [
1]. Airplane performance, such as maximum flight speed or fuel consumption, can be improved with better aerodynamic design [
2,
3]. Aircraft have a minimum safe speed for certain conditions, such as asymmetrically loaded combat airplane, unbalanced flight conditions, and a single propeller airplane for flight safety [
4,
5,
6]. In general, dogfighting techniques are carried out by flying at a slow speed and within a short range.
In the beginning, the most widely known fighter energy dynamics transfer is the rolled-up vortex (RuV) effect, such as above the wings, Leading Edge Extension (LEX), and canard. The rolled-up vortex is the trailing vortex wake behind the lifting wing or delta wing, which is the natural tendency of free vortices’ shear layers to roll up into well-defined vortices with the essentially inviscid outer flow rotating around an inner viscous core. Computational fluid dynamics (CFD) or mathematical analysis is the means for calculating the characteristics of the complete flow field over the wing or delta wing, as well as its wake and the rolled-up tip vortices. It is renowned that the vortex layer, formed by the union of upper and lower wing surface boundary layers, behind the trailing edge of a running and delta wing, rolls up into two vortex cores.
Several scientists have explored the rolled-up vortex effect on different wings. Sohn et al. [
7] have investigated the effect of a center body on the vortex flow of a double-delta wing with leading edge extension. Heyes and Smith have studied, in depth, the modification of a wing tip vortex by vortex generators [
8]. Niu et al. have examined numerical research on the effect of variable droop leading edge on oscillating NACA 0012 airfoil dynamic stall [
9], and Abene and Dubois have observed essential pieces of the cones vortex flow [
10]. In using an experimental method for measuring details on an airfoil, it is necessary to develop new wall corrections and combine all the factors that have an impact on the quality and accuracy of the wind flow section of the tunnel test, so as to contribute to the accuracy of measured aerodynamic values [
11].
One of the essential items in the aerodynamic design of a plane is the meeting between the wing and body. This meeting has been identified as a body relationship with different aircraft components. This meeting induces interactions between components, fuselage effects and, especially, the combined layer boundary, which causes flow phenomena to be complicated to explain and simulate [
1]. The fuselage effects receive little attention, chiefly, the effects of the blended wing body, the blended canard body, including the effect of the bulge of the head and the neck, canard, wing’s height difference, planar distance, and the flat horizontal wing surface from head to tail. Due to the head protrusion, the head, as it has an airfoil-like cross-section, gives a fuselage effect, and airfoil lift, as the air flow above the head is much faster than that at the base.
A part of the fuselage effect is also the interaction between the main wing and the body. Fuselage body influences vortex dynamics and lifts force generation. Some researchers observed the fuselage to have influenced vortex dynamics. Researchers have also observed the effect of the maneuvering parts, main wing, and canard, and the effect of the fuselage on vortex canard formation on J-10 aircraft models [
12]. The research results have shown that the more the negative pressure of the fuselage models, the higher the efficiency of the canard wing interaction. Sutrisno et al. have reported the performance and canard and fuselage visualization effects on stream format around a fighter with straight-body-type-fuselage (SBTF) in water tunnels [
13]. The formation of the fuselage vortex on the X-31 plane model has also been observed [
14]. The interaction between vortex core forebody and LEX in the F-18 plane model has been investigated as well [
15,
16]. According to the fuselage effect theory, fighters’ fuselage configurations result in different spreading effects on the fighter wing, determining the lift force generated [
12].
Adding a forewing to an aircraft such as LEX and canard will produce a strong vortex that will interact and affect flow over the main wing [
17]. This influence will be used to modify the flow so that the aircraft has better flight performance. When the flow above the wing has begun to experience turbulence, the vortex core from the forewing will hit the flow above the wing and make it re-streamline. Forewing configuration will affect changes in vortex structure that occur. Canard has a more flexible configuration due to the ability to adjust the deflection angle.
Several previous researchers have observed many fuselage effects on the types of straight type aircraft body models, such as Chengdu, X-31, and F-18. On the other hand, the fuselage on a curved aircraft body model of the Sukhoi Su-30MKI has admirable maneuverability in high attack angle conditions. Sukhoi Su-30MKI has a unique canard wing configuration, adding the canard in the same height and near the main wing, while most other aircraft use a canard configuration above and in front of the main wing. This high agility allows the aircraft to release weapons in all directions, due to the dynamics of vortices formed on the canard, wings, and body of the aircraft. Therefore, analyzing the occurrence of vortex dynamics becomes a crucial factor indicating lift force at a high attack angle of attack. Thus, flow visualization method is an effective way of determining the phenomenon of vortex dynamics.
Boelens et al. have executed geometry and computational grids with structured grids, and unstructured grids were used in a cranked-arrow wing aerodynamics project [
18]. Lofthouse and Cummings have conducted numerical simulations at flight-test conditions using delayed detached-eddy simulation [
19]. Some simulations at flight conditions using hybrid near-body computational fluid dynamics have also been carried out [
20]. Some research related to interconnected aerodynamic mechanisms has focused on 3D separation and its control [
21]. An experimental investigation has found the flow mechanisms responsible for the aircraft loss of static directional stability [
22]. The method of three-dimensional measurements of vortex breakdown has gained more focus on vortex dynamics mechanism [
23]. Nevertheless, the algorithm application of the Q-criterion algorithm so far has not been mixed with the track of the flowline for the vortex growth, to examine the vortex dynamics of the comprehensive picture. There are many previous studies that explain the effect of canard on the main wing for various configurations using experiments and CFD, but these studies have not been able to explain, significantly, the stall delay in the maximum AoA [
24,
25,
26,
27].
Further studies in future aircraft design, including for military purposes, could advance aircraft technology. Flight physical aspects and methods of future military aircraft designs have been thoroughly explored [
28]. Schminder has carried out a feasibility study of different methods for the use in aircraft conceptual design [
29]. Vortices and turbulent structures for an aircraft at drift angle 0°, 12°, and 30° degrees have been learned [
30]. A study of an asymmetric vortices synergy over chinned forebody/wing configuration at high angles of attack (AoA) has shown that forebody vortices can postpone breakdown of wing vortices [
31]. At the critical attack angle, it is necessary to pay attention to the air flow conditions (airfoil shapes, dynamics of the transition of angles of attack, description of the flow around the airfoil with increasing the angle of attack upon reaching a critical value, the effect of roughness of airfoil surfaces at critical angles of attack, and turbulence) [
32]. In experiments, it is necessary to deeply consider tool factors, such as tool holders. Experimental results compared to CFDs will help in getting accurate results [
33]. Zhang et al. have investigated, numerically, the characteristics between the canard and wing of the canard-forward swept wing aircraft configurations at different canard [
34]. The research report above needs further investigation of the vortex dynamics, implementing the Q-criterion algorithm and the footprint of the vortex development streamline to analyze a more detailed manner to identify the undesirable results of fuselage effects.
The field data show that Rafale and Eurofighter are well known to have very high dogfighting abilities [
35]. However, there are still more opportunities to strengthen their agility and maneuverability which, in principle, is increasing their lift coefficients at high AoA. This requires in-depth research on the fighter vortex dynamic, which will determine the role of the RuV effect and the role of vortex cores in generating negative surface pressure distributions (SPD) on the right surface and reducing the losses of the lift coefficient of the fighter. In this case, the role of Q-criterion is critical.
Several eminent scientists have explored numerical investigation to some fighters. Boelens have conducted CFD analysis of the flow around the X-31 aircraft at a relatively high angle of attack [
36]. Chen et al. have studied the sideslip effect on high AoA vortex stream over a certain configuration of wing canard [
37]. Ghoreyshi et al. have performed simulation validation of static and forced motion flow physics of a canard-configured TransCruiser [
38]. Ghoreyshi et al. have learned transonic aerodynamic load modeling of X-31 aircraft pitching motions [
39]. Schütte and Rein have examined experimental and numerical aspects of simulating unsteady flows around the X-31 configuration [
40]. In the current study, the Q-criterion algorithm in CFD models is employed, so that the 3D vortex visualization, flowline track, pathline for the whirlpool growth, and the wall shear is combined to demonstrate the complete picture of the vortex dynamics.
The Q-criterion describes a vortex as a “connected fluid region with a positive second invariant of
∇u”, i.e.,
Q > 0, vortices of an incompressible flow.
∇u =
S +
Ω,
S is the strain rate tensor, and
Ω is the vorticity tensor. This criterion also adds a secondary condition on the pressure, requiring it to be lower than ambient pressure in the vortex. Looking at the definition of the second invariant, one could learn that
Q represents the local balance between shear strain rate,
S, and vorticity magnitude,
Ω, defining vortices as areas where the vorticity magnitude is greater than the magnitude of the rate of strain. From Vivian Holmen [
41], in order to distinguish between vorticity structures and shear flows, an additional vortex detection algorithm, the Q-criterion, has been put to use. Hunt et al. first suggested that a vortex could be characterized based on the second invariant of the deformation tensor [
42]. The criterion is based on the ability to decompose the deformation tensor
∇u into symmetrical and antisymmetrical parts,
S = 0.5(
∇u +
∇uT) and
Ω = 0.5(
∇u −
∇uT) (
T is the transpose), defining the rate of strain and vorticity tensors, respectively. If
Q = 0.5(∥
Ω∥
E2 − ∥
S∥
E2) > 0; such that ∥.∥
E represents the Euclidean norm, rotational effects dominate, and a vortex is said to be identified. Further details on the ”Q-Criterion” can be found in Jeong and Hussain [
43]. Holmen also describe other similar vortex detection algorithms, namely, delta criterion, lambda-2 criterion, swirling strength criterion, and enhanced swirling strength criterion [
41].
According to Stefan Gortz, one could summarize that i) the vortex breakdown over delta wings is practically an inviscid phenomenon [
44] and the Euler and Navier–Stokes equations predict the same breakdown location; ii) the nonlinear interaction between a forebody vortex and a burst wing leading-edge vortex can be predicted using the Navier–Stokes equations; iii) computations of vortex flows, especially vortex breakdown, are highly sensitive to local grid resolution; iv) detached-eddy simulations (DES) were shown to be promising for time accurate viscous computations of separated flows, in general, and vortex breakdown; and v) vortex flows at high incidence are inherently unsteady and require accurate time computations, especially for predicting the vortex breakdown location.
The use of a water tunnel will make it easier to reveal the phenomena that occur. For a long time, many studies have used water tunnels to visualize flow testing on moving objects or fluid flow, especially around fighter aircraft. The vortex phenomenon of breakdown location that occurs on the aircraft based on delta wing has been observed using water tunnels [
16,
45,
46,
47,
48,
49]. In addition, water tunnels have also been widely used to observe the phenomenon of vortex dynamics above the LEX wing and the close coupled canard in aircraft models by some researchers [
13,
46,
50,
51,
52,
53]. The use of water tunnels is perfect for studying flow visualization because it has a higher density and a lower mass diffusion than air [
54].
This study focuses on observing the effect of canard deflection angles and fuselage variations on aerodynamic performance and vortex dynamics in fighter models, similar to the Sukhoi Su-30-like using CFD simulation and GAMA water tunnel. Combination of CFD methods with water tunnel visualization is used to explain dynamic vortex more comprehensively. The results of CFD by visualizing vortex cores from water tunnels would give processes validation as well. The purpose of this paper is to analyze canard deflection angles influence on aircraft fighter designs employing structured logarithmic mesh, applying numerical simulation methodology, to maintain the accuracy of the turbulent boundary layer on the Kolmogorov microscale. In general, dogfighting techniques are carried out by flying the fighter at slow speed and short range.
2. Materials and Methods
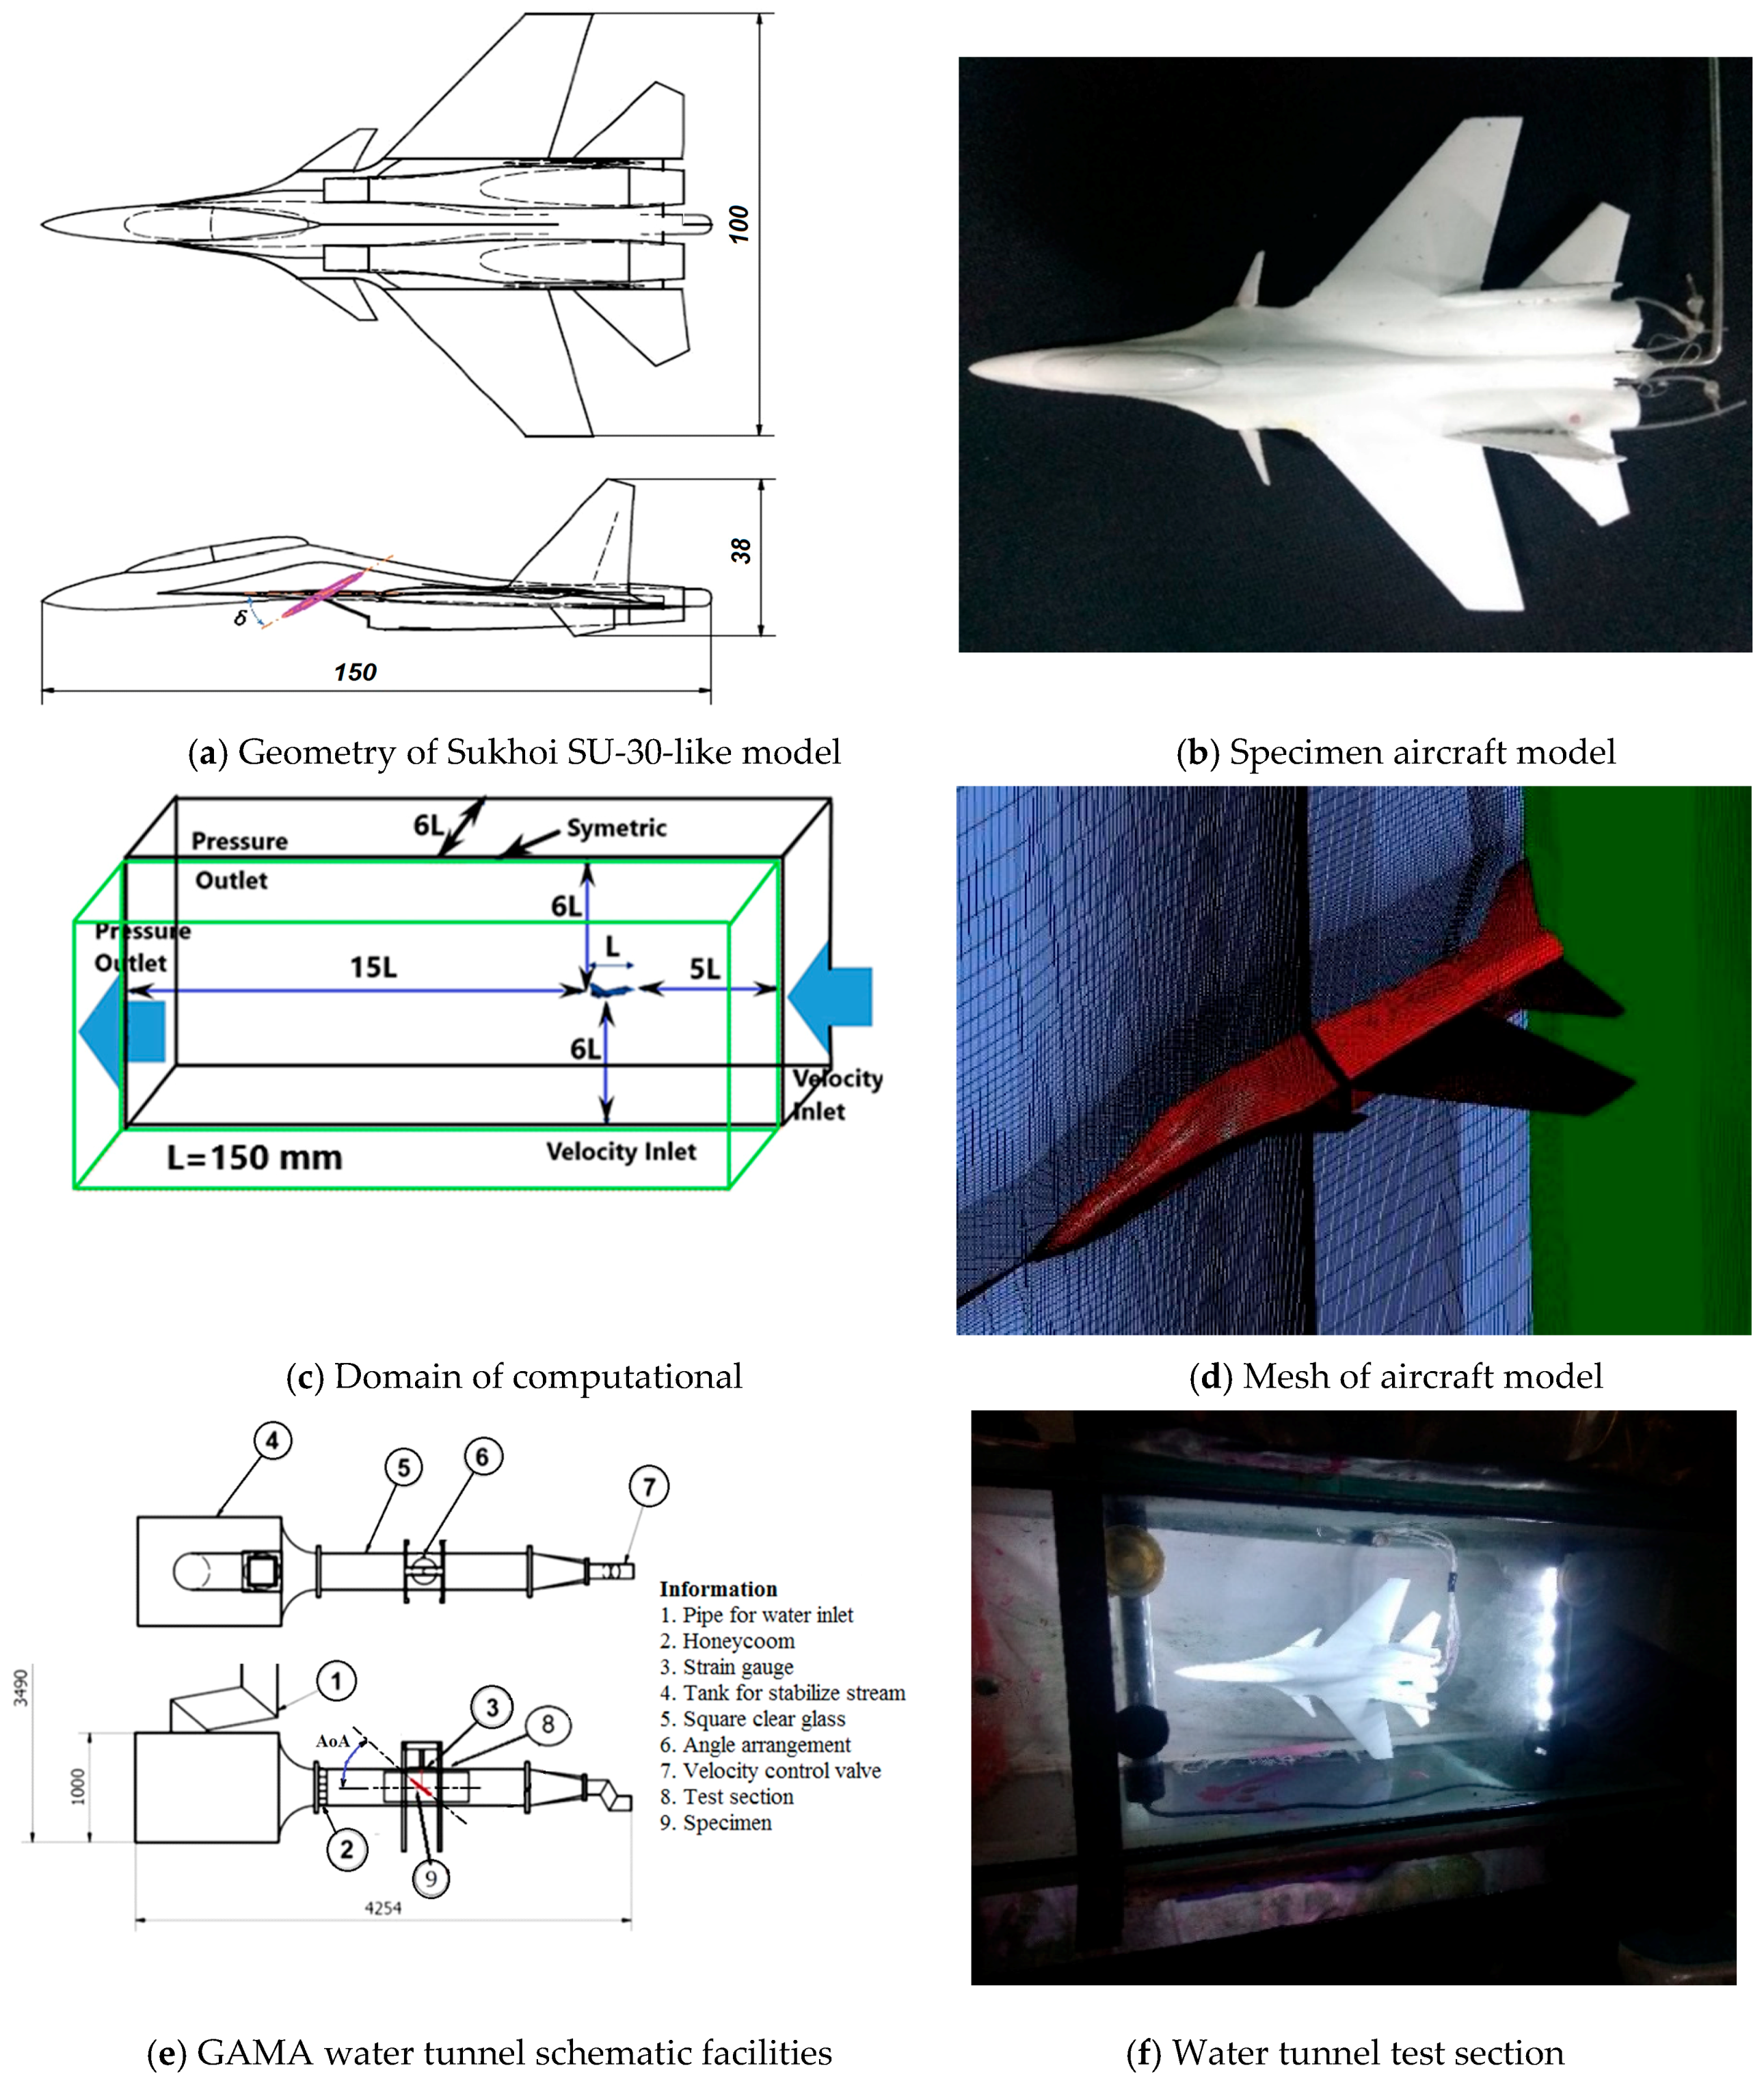
In this research, we studied the effects of canard deflection angle application on the aerodynamic performance of combat aircraft. The use of flow visualization methods was essential to studying the flow patterns along the plane prototypes. Visualization testing was carried out using CFD and experiments in a water tunnel.
The test parameters were adjusted to the conditions at the GAMA water tunnel test facility which had a 350 × 350 mm
2 test section. The use of GAMA water tunnels has often been used to test visualization and flow characteristics on aircraft, and has been compared with other references with good results [
13,
49]. The research used the Sukhoi SU-30-like model with a 1/72 scale, which referred to the dimensions of the water tunnel experiment. The experiment was done by altering the amount of deflection angle (δ) of canard with values 0°, 10°, 20°, 30°, 40°, and 60°, as shown in
Figure 1a.
The meshing process was carried out on the model by making blocks on parts of the aircraft model and dividing them into small sizes. The type of mesh used was H-mesh structured grid, as shown in
Figure 1d. Based on previous research, the number of cells needed to obtain an independent mesh was greater than 5 million cells, while the smallest size of mesh close to the wall followed a dimensionless wall distance (
y+) with a value less than 4 [
55]. Therefore, in this study, the number of mesh had been determined to be 6.8 million, with the smallest cell value 1.4 × 10
−4 m (
y+ = 2). The changing mesh structure, from the wall to the outside, followed the logarithmic model. Computational domains were made so large that the computational boundaries did not interfere with the flow of the aircraft model as shown in
Figure 1c. Simulation with CFD was done by solving the Navier–Stokes equation.
To solve the set equation, the finite volume method (FVM) was used. The discretization model of coupling pressures used Pressure-Implicit with Splitting of Operators (PISO), and convection rates used QUICK (quadratic upwind interpolation for convective kinematics), and pressure rates employed a second-order scheme. Meanwhile, the turbulence model used the Delayed Detached Eddy Simulation (D-DES) model, which would provide very good results in characterizing the vortex core flow in the fighter model [
56]. The D-DES model was a combination of the use of hybrid Reynolds Averaged Navier–Stokes and Large-Eddy Simulation (RANS-LES) based on turbulent length scales in areas near the wall, or even farther away. The convergence criterion uses the value of
R < 10
−5 with the number of iterations reaching 4000. The governing equation model was used:
The Q-criterion algorithm in CFD research was applied and mixed with the flowline track for eddy growth, to examine the comprehensive pattern of the eddy dynamics. The measurement results were analyzed. The first result was related to the power of the eddy core, which was the speed of the axial eddy core relative to the local free flow rate
Uc/
U∞(
z) and the coefficient of pressure,
Cp, along the eddy core. We then measured the surface pressure distributions (SPD) at the left and the right fighter wing surfaces. The height of the trajectory and location of the eddy core were then measured. To determine the magnitude and direction of the vortex core, we used the Q-Criterion with the equation:
According to Q-criterion flow identification, vortices of an incompressible flow are identified as connected fluid regions with a positive second invariant of the velocity-gradient tensor
∇u, where
∇u =
S +
Ω. The results were compared with visualization techniques and measurement of water tunnel. The validation process was carried out to compare and test the CFD results with respect to the experimental results. Experiment testing was carried out at water tunnel facilities, and the procedure referred to an earlier study, as presented in
Figure 1e,f [
49]. The test model was made using a 3D printer with the same dimensions as the CFD model in
Figure 1b. In some specific locations at the aircraft wings, ink injection holes were placed to obtain visualization of the flow along the fuselage. The ink that has flowed showed the formation of the vortex core, which looks like a solid line. In certain conditions, the ink line would have been damaged, which indicated the occurrence of a vortex breakdown.
Flow velocity was established at 0.23 m/s (
Re = 34.757) with a variation of AoA of 0°–80° with steps of 5 degrees. The strength that occurred in the plane prototype were evaluated using 3 degrees of freedom (DOF) of balance sensor for aerodynamic weights that had been mounted and calibrated in the water tunnel test facility [
57].
3. Results
Figure 2 shows the visualization of the canard vortex core flow and the main wing of the side and top views using computational fluid dynamics (CFD).
Figure 2 shows the formation of the eddy center and the pressure distribution along the vortex core in the standard model (δ = 0°). The flow that occurs from the canard is close enough to the main wing to produce a good interaction for the aircraft model. At AoA 30°, canard vortex stream flows over the wing to the rear. The vortex flow from the main wing flows sideways along the back leading edge, and undergoes vortex core breakdown at
x/L = 0.54. Streamlined wall shear visualization also shows a reversal streamline in that position. A substantial increase in AoA causes the vortex core breakdown location to advance.
At AoA 50°,
Figure 2, there is a considerable fluctuation in the flow that occurs at
x/L = 0.16. The occurrence of vortex core breakdown in the AoA has dominated the overall flow in the main wing of the aircraft. Therefore, in this condition, flow separation has begun, and there is a decrease in lift. Visualization looks good from the pathline flow that displays the flow; streamlined wall shear shows the dominant return line, vortex core breakdown, and partial pressure distribution starts from the front of the main wing. This condition indicates that, at AoA 50°, there has been a complete separation, and a stall has occurred such that a lift drop occurs.
CFD testing also gave streamlined wall shear visualization outcomes. Streamlined wall shear visualization was a projection of flow direction on the body and wings of the aircraft. From the visible lines, it could show how the direction of the current flowed over the wings. Deflection of the flow direction showed that the flow was not streamlined and even had a bend. In the area of the flow reversal indicated that there had been a chaotic flow or vortex breakdown.
The most important part of analyzing flow visualization in fighter planes was the phenomenon of vortex core formation. The vortex core was an area in the center of the rolled-up vortex, it had a very low pressure, and it was at the center of the lifting force on the delta type wing. The vortex core could be identified from the Q-criterion value, the ratio of axial velocity to free velocity, and pressure distribution. The stronger the formation of the vortex nucleus, the higher the lift force that occurred. This condition could be observed based on how the pressure distribution and velocity along the vortex core characterized. Under certain conditions, the vortex core would weaken until the breakdown occurred, at that time the lift force begins to decrease and continues to disappear. When there was a breakdown of the vortex core, it was referred to as a vortex breakdown. Vortex breakdown could also be identified through Q-criterion, the comparison of the axial velocity to free speed, and its pressure distribution.
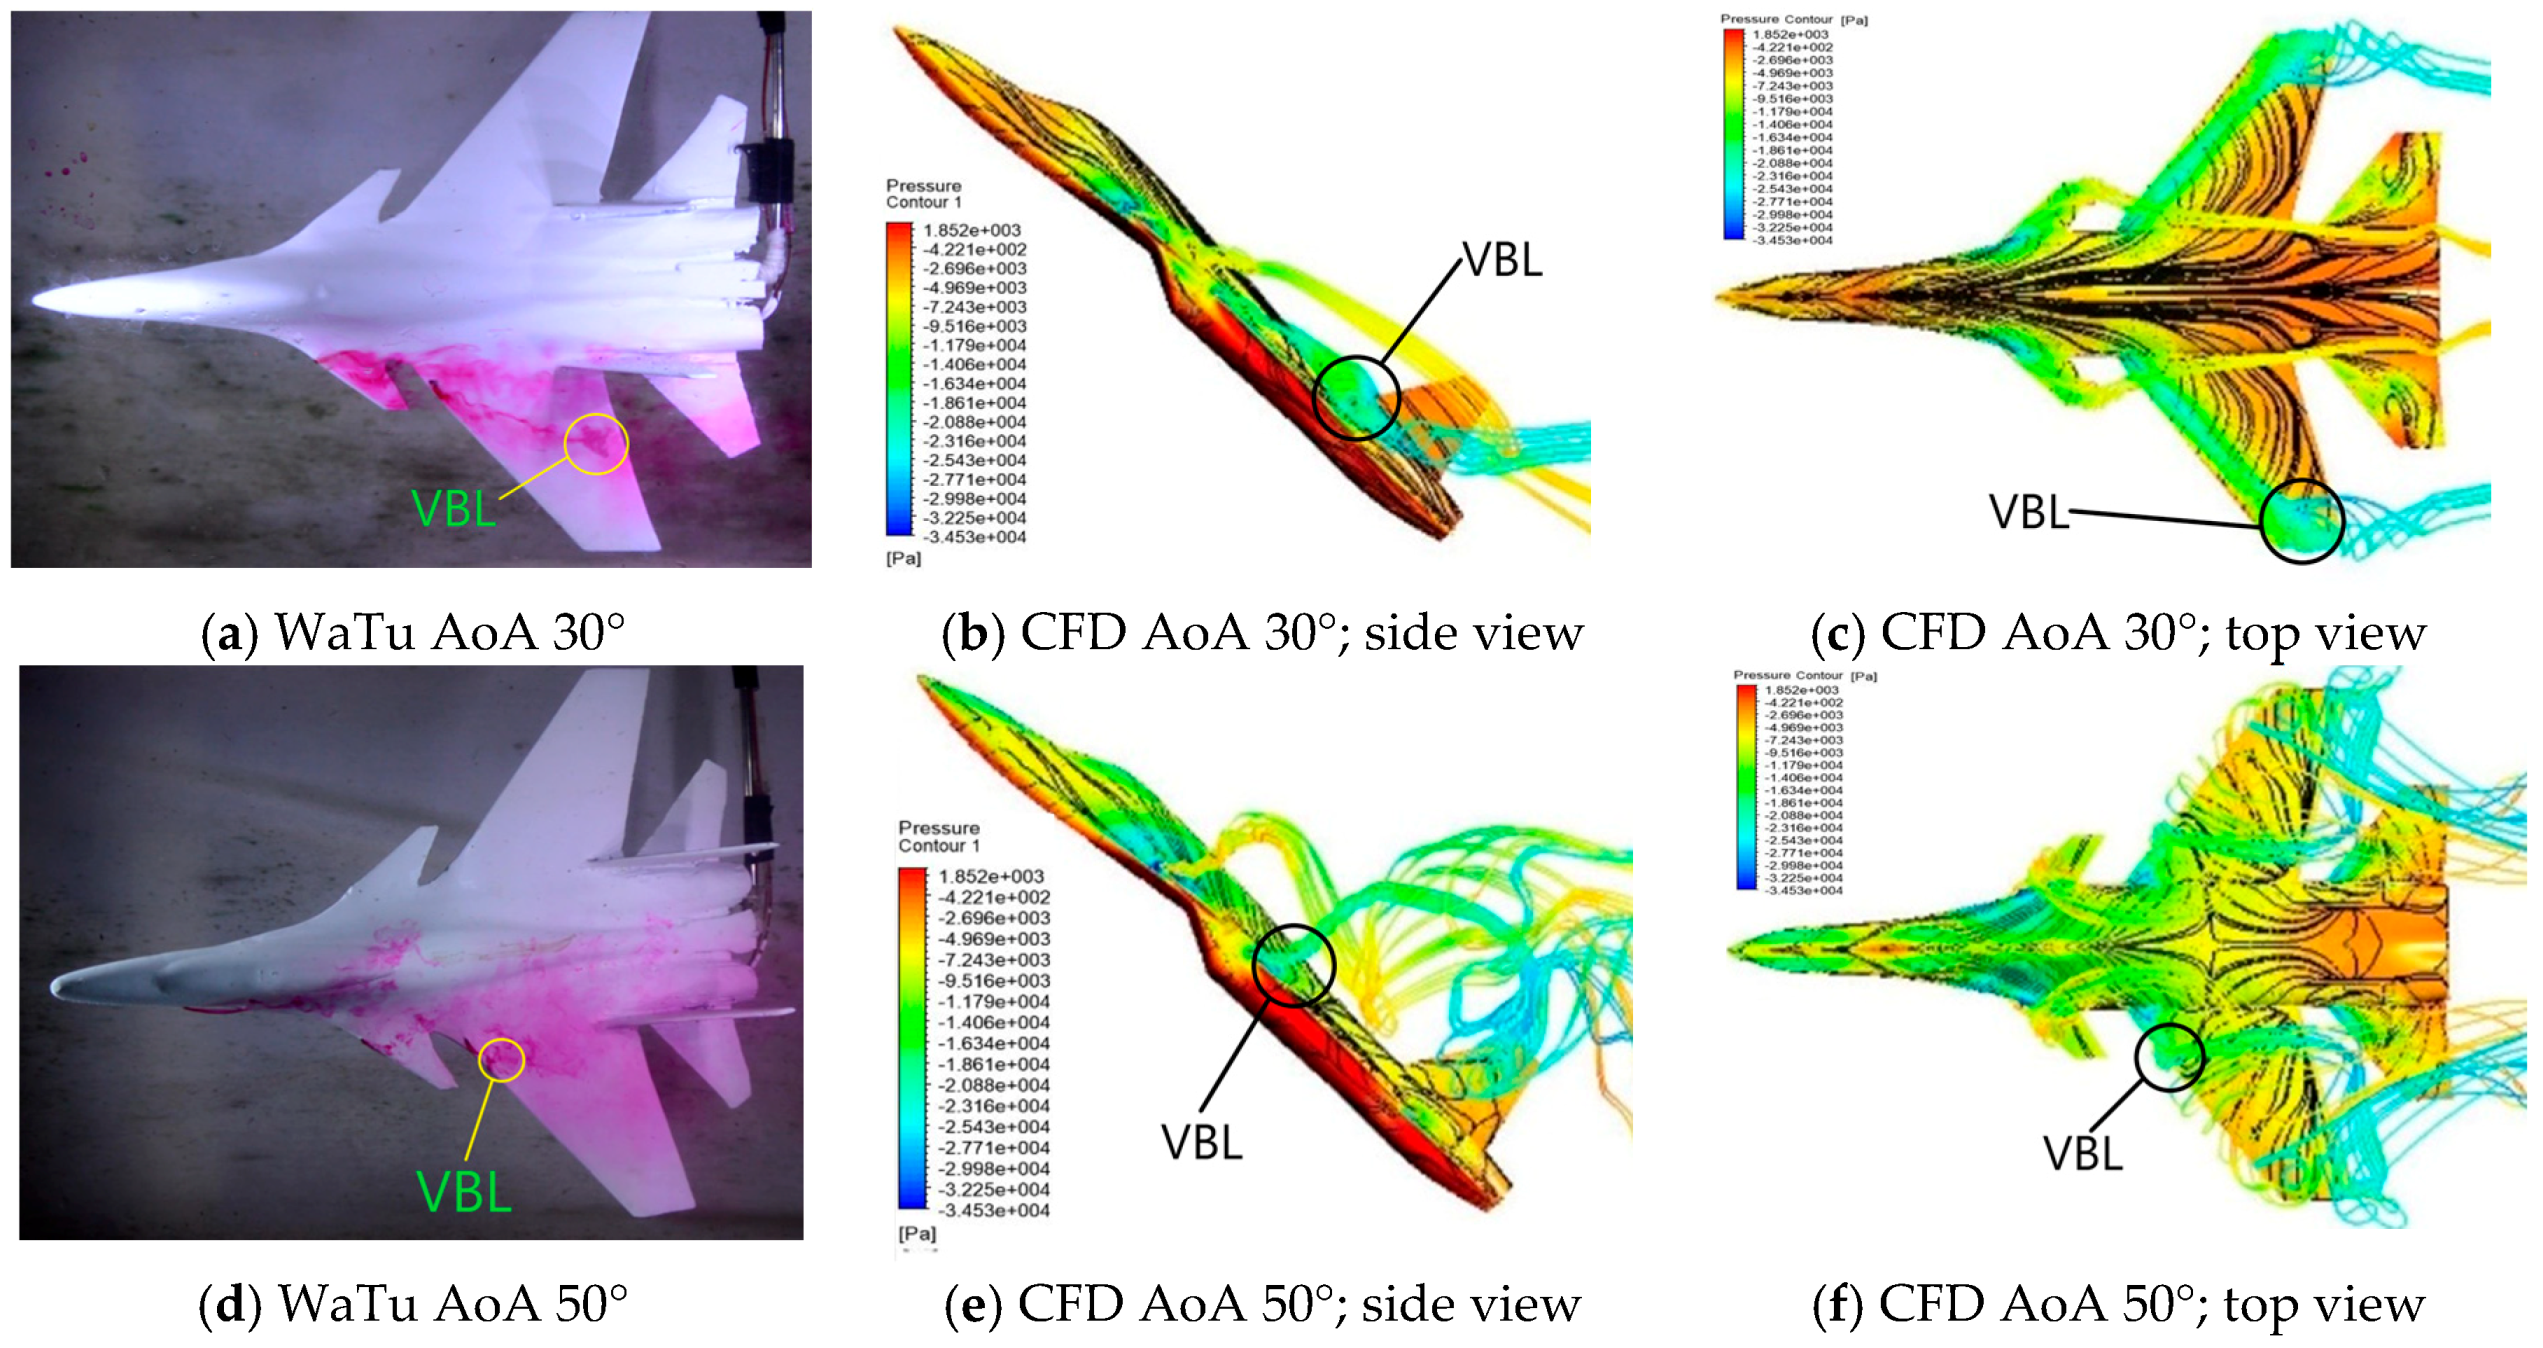
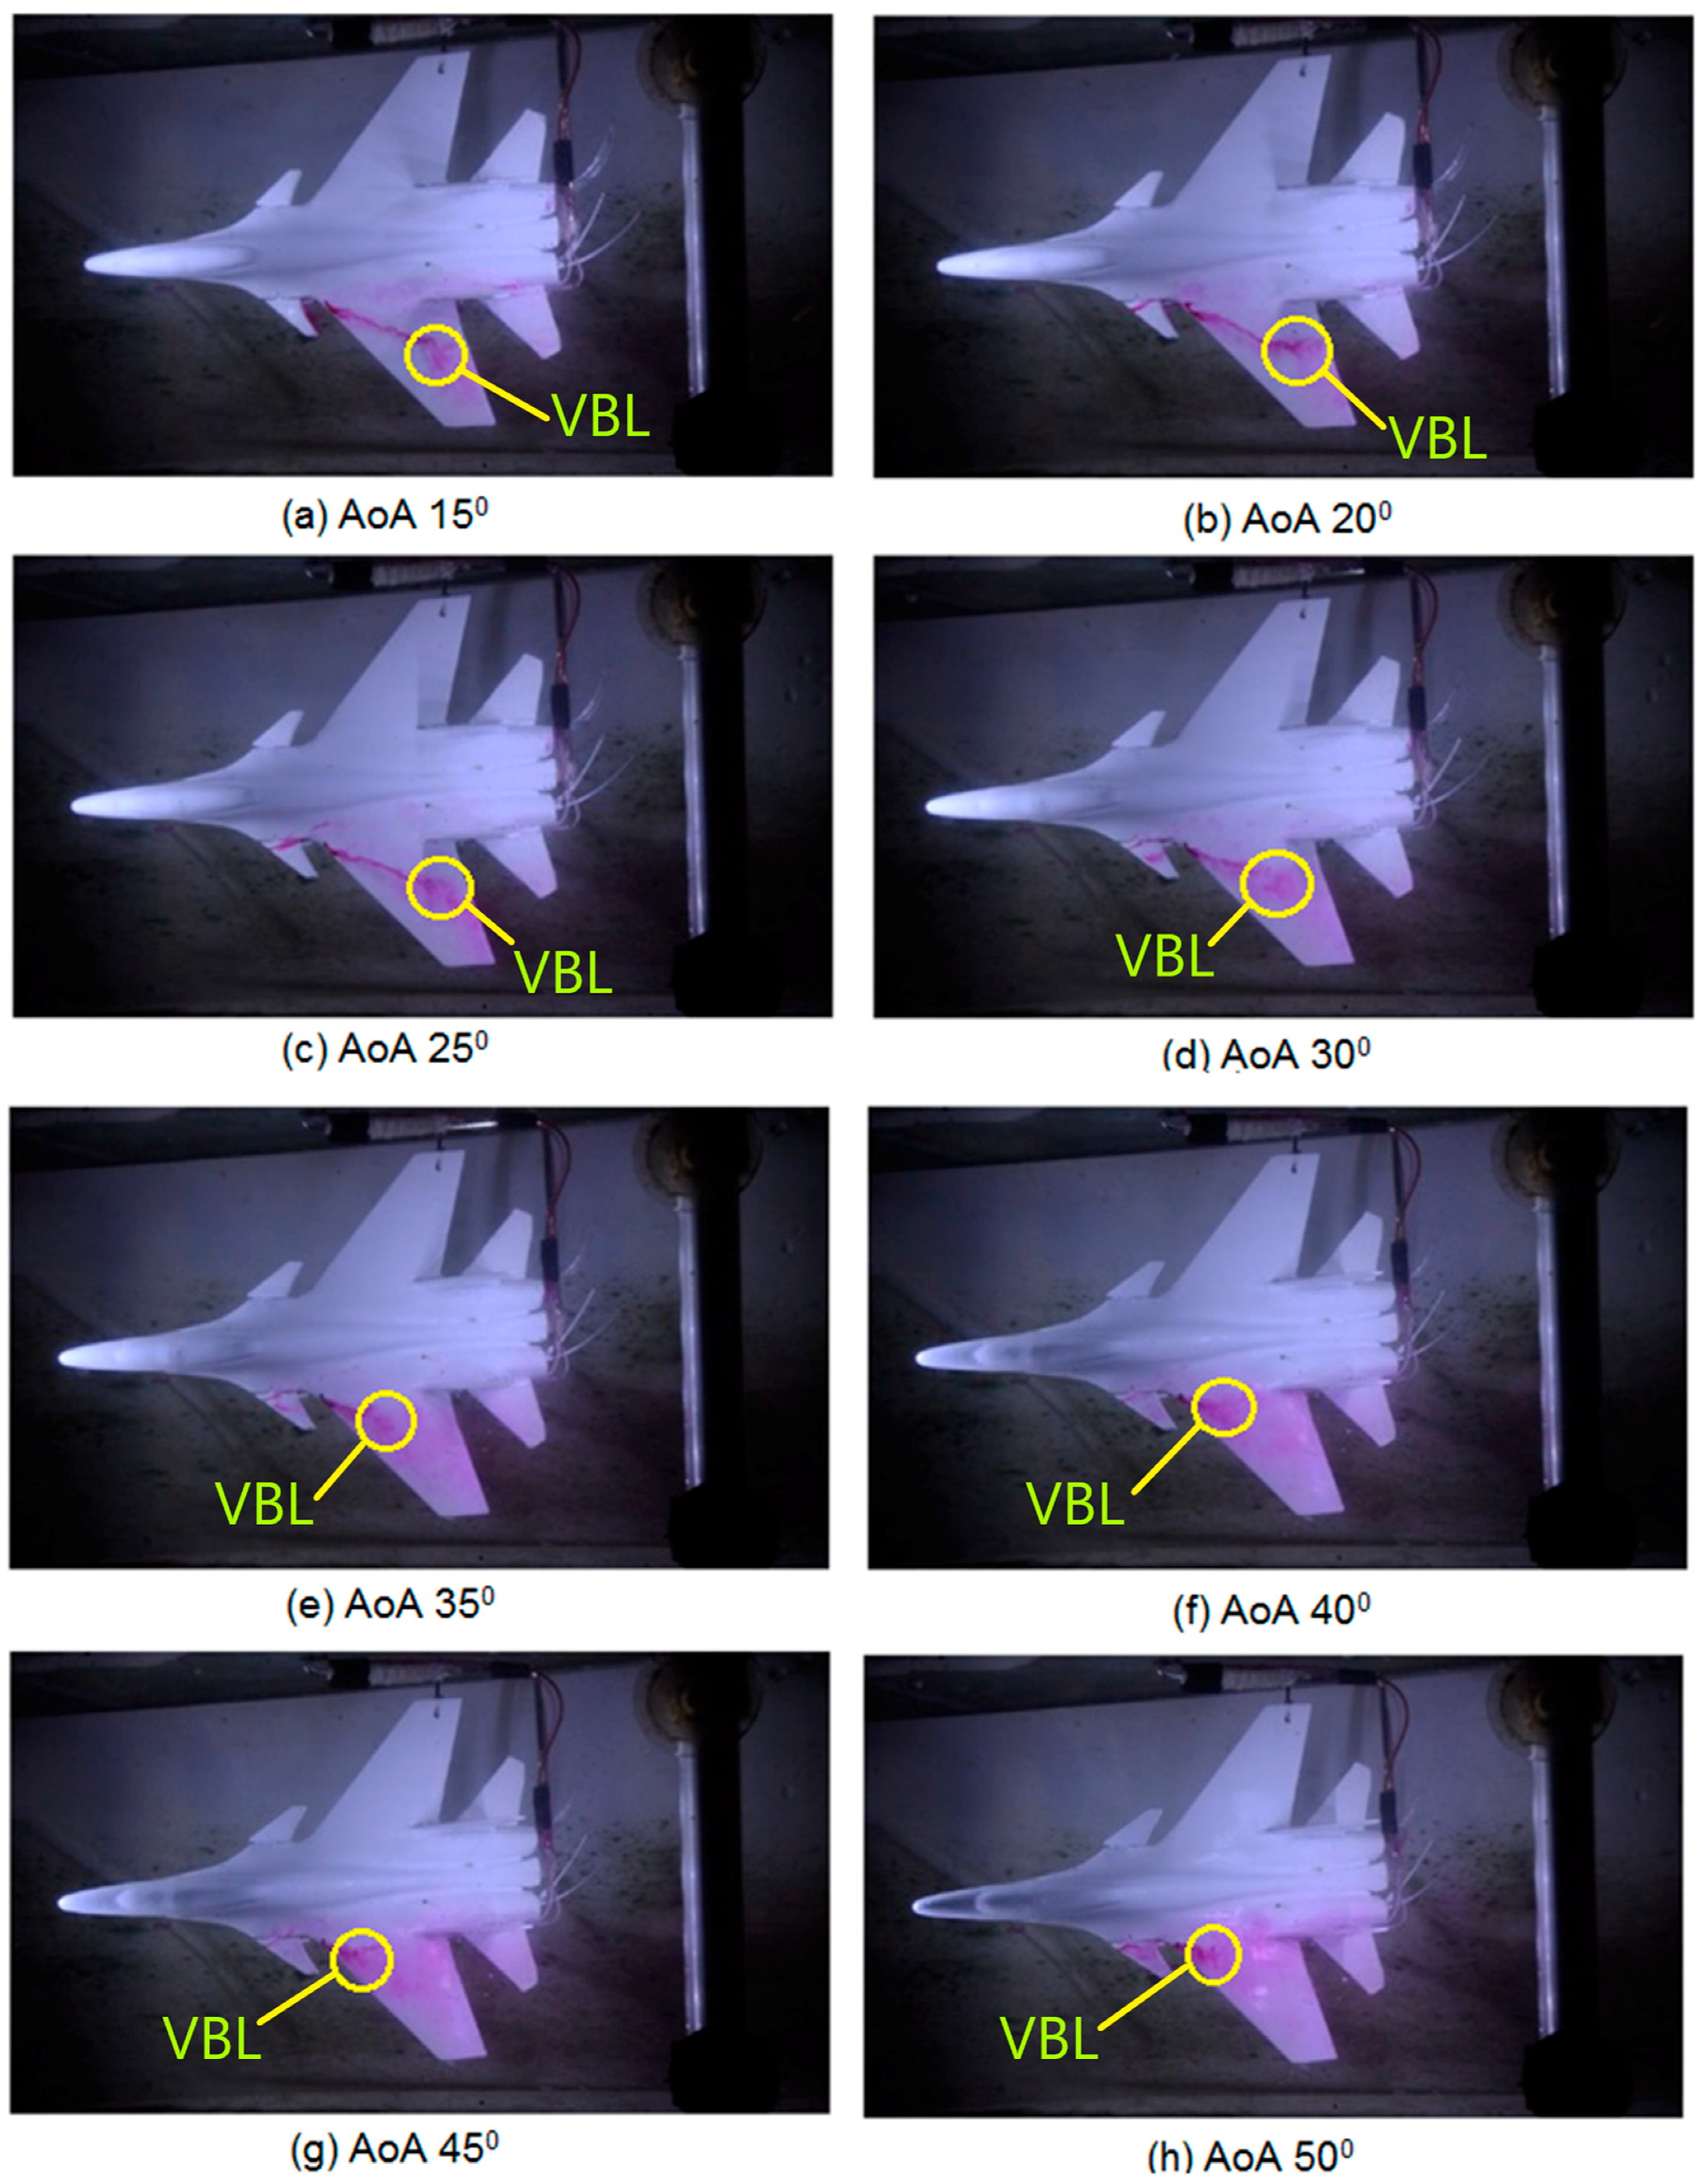
Figure 3 shows the vortex core formation visualization, using the water tunnel experiment method, on a plane model with canard δ = 20° deflection angle. In the picture, the results of the ink injection from the front end of the canard and the aircraft wing are observed as an identification of the formation of vortex nuclei. The results of the visualization of the water tunnel indicate that the vortex core formation is clearly visible with the ink flow line reaching the back of the wing until it experiences vortex core breakdown. As the AoA rises, the vortex breakdown location is also shifted forward toward the front of the wing. The existence of vortex core formation in visualization is still visible up to AoA 50°, as in
Figure 3h. The location of the vortex breakdown in the visualization results of the water tunnel is marked by the ink flow line breakdown above the wing of the aircraft.
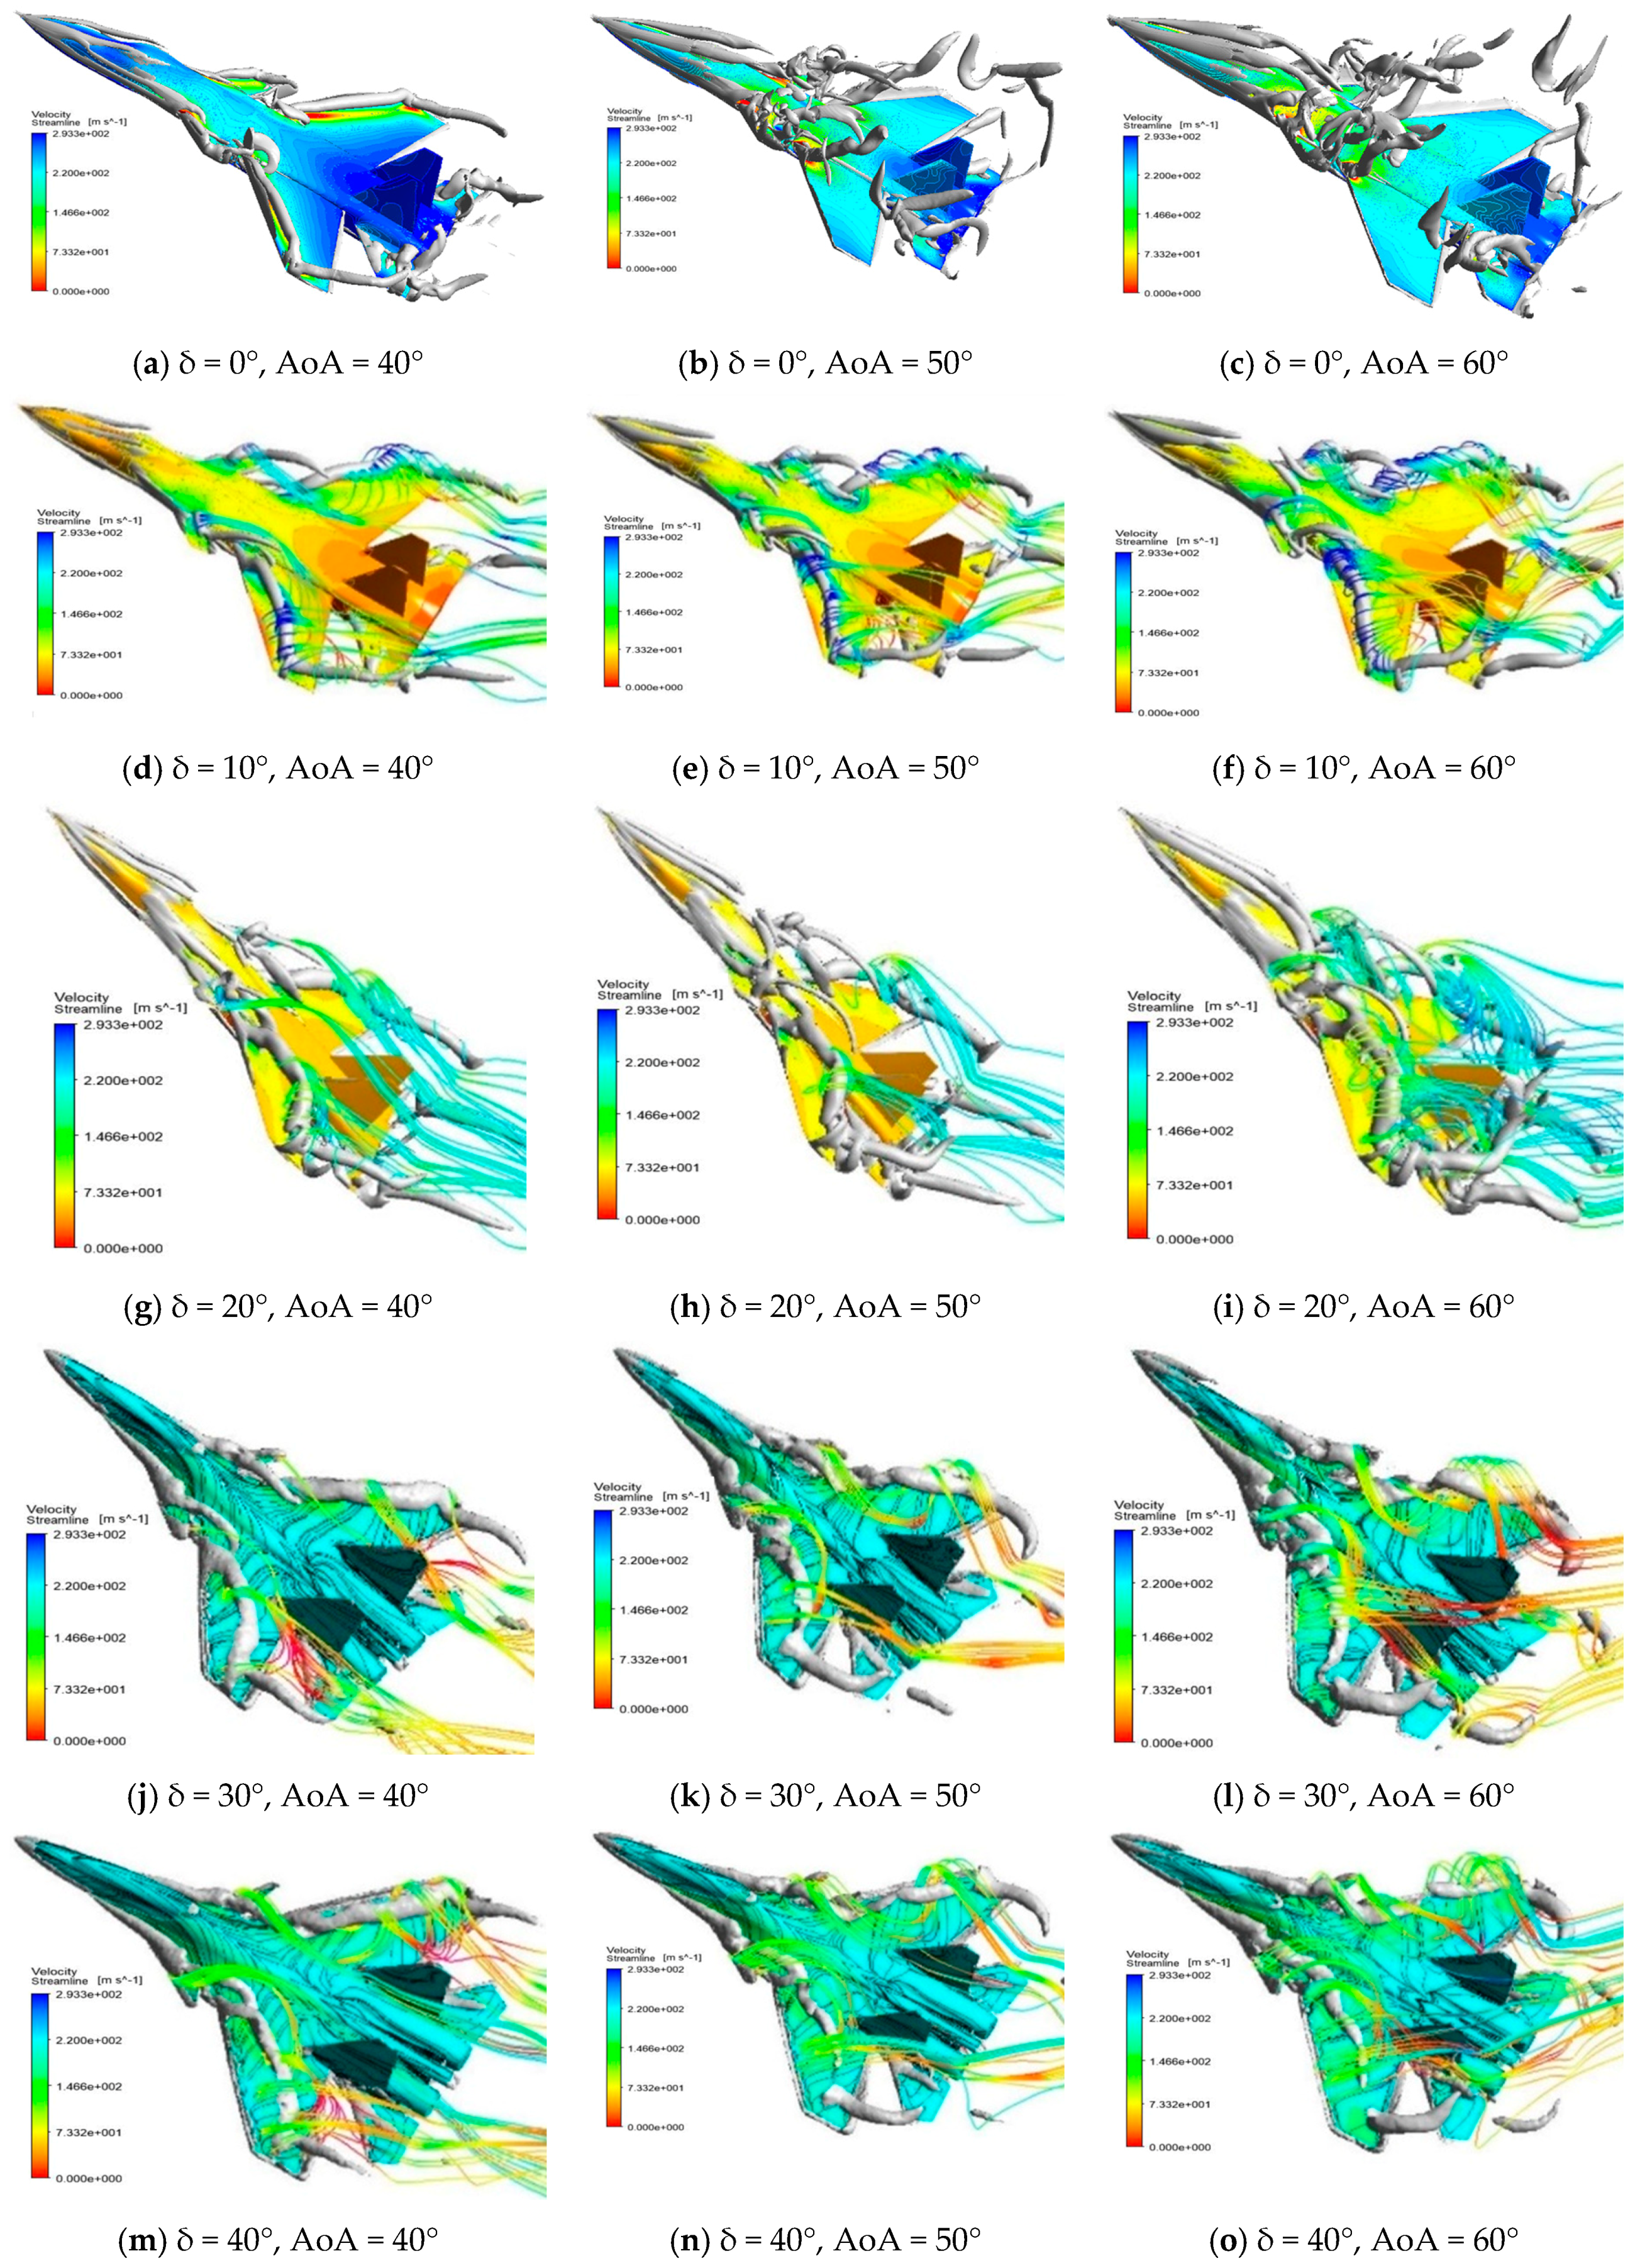
Figure 4a–o show the flow visualization presented in the form of pathline flow, pressure distribution on the surface, wall stream shear on the surface, and the formation of a vortex core based on Q-criterion above the wing for each canard deflection condition δ = 0°, 10°, 20°, 30°, and 40°, for AoA = 40°, 50° and 60°. The results of this visualization were used to analyze the form of flow that occurred, the interaction between flow from canard and wing, the process of forming vortex nuclei, and identification of the vortex breakdown location. In canard deflection of standard conditions (δ = 0°), vortex cores appear to have risen and broken since AoA 50° while, in deflection configurations vortex cores tend to stick to the wing surface.
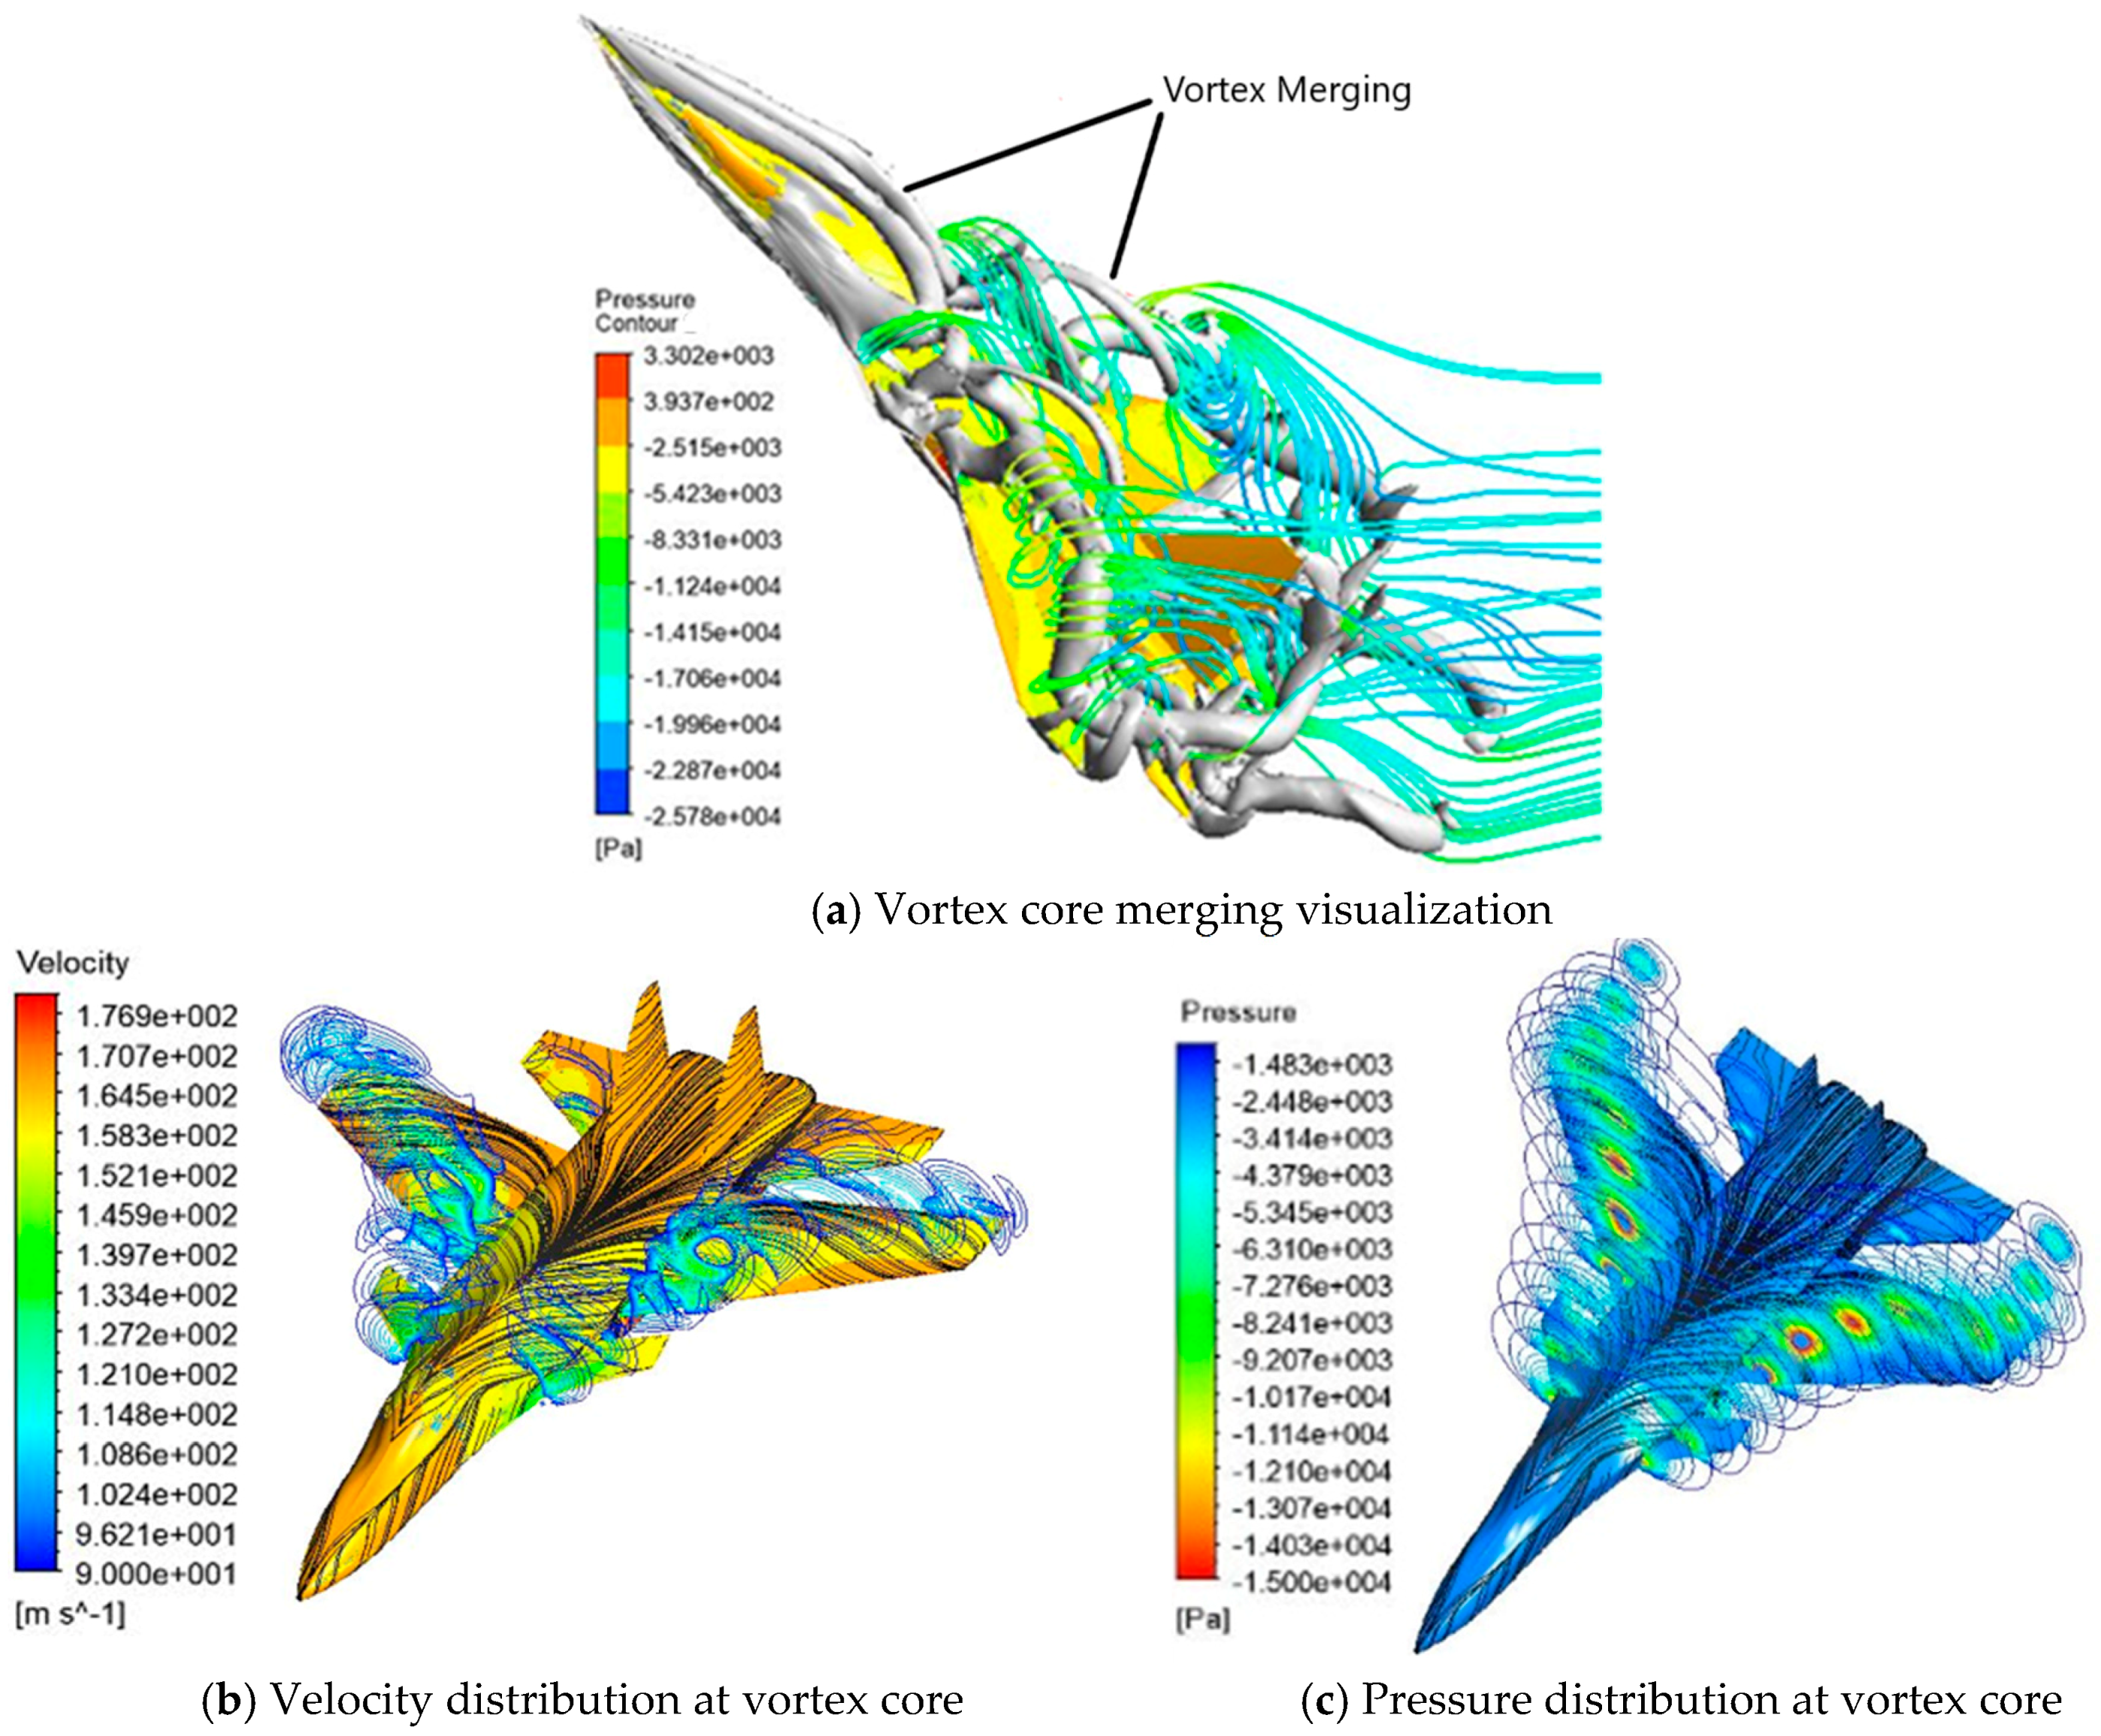
In
Figure 5a–c, visualization of CFD flow is presented in the form of pathline flow, pressure distribution on the surface, wall stream shear on the surface, the formation of a vortex core based on Q-criterion, and pressure and velocity distribution at vortex core. One could perfectly see the vortex merging formation above the fighter heads. One can learn, from
Figure 5a, that there is a vortex merging formation, and two vortex core lines are curved through above the fighter’s head, indicating that a vortex trajectory was tightening above the fighter’s head and the presence of excessive negative pressure and extra lift force above the fighter’s head.
Figure 5b,c show the pressure and velocity distribution layers that describe the location of the vortex core. The vortex core area has very low pressure as a result of lift generation.
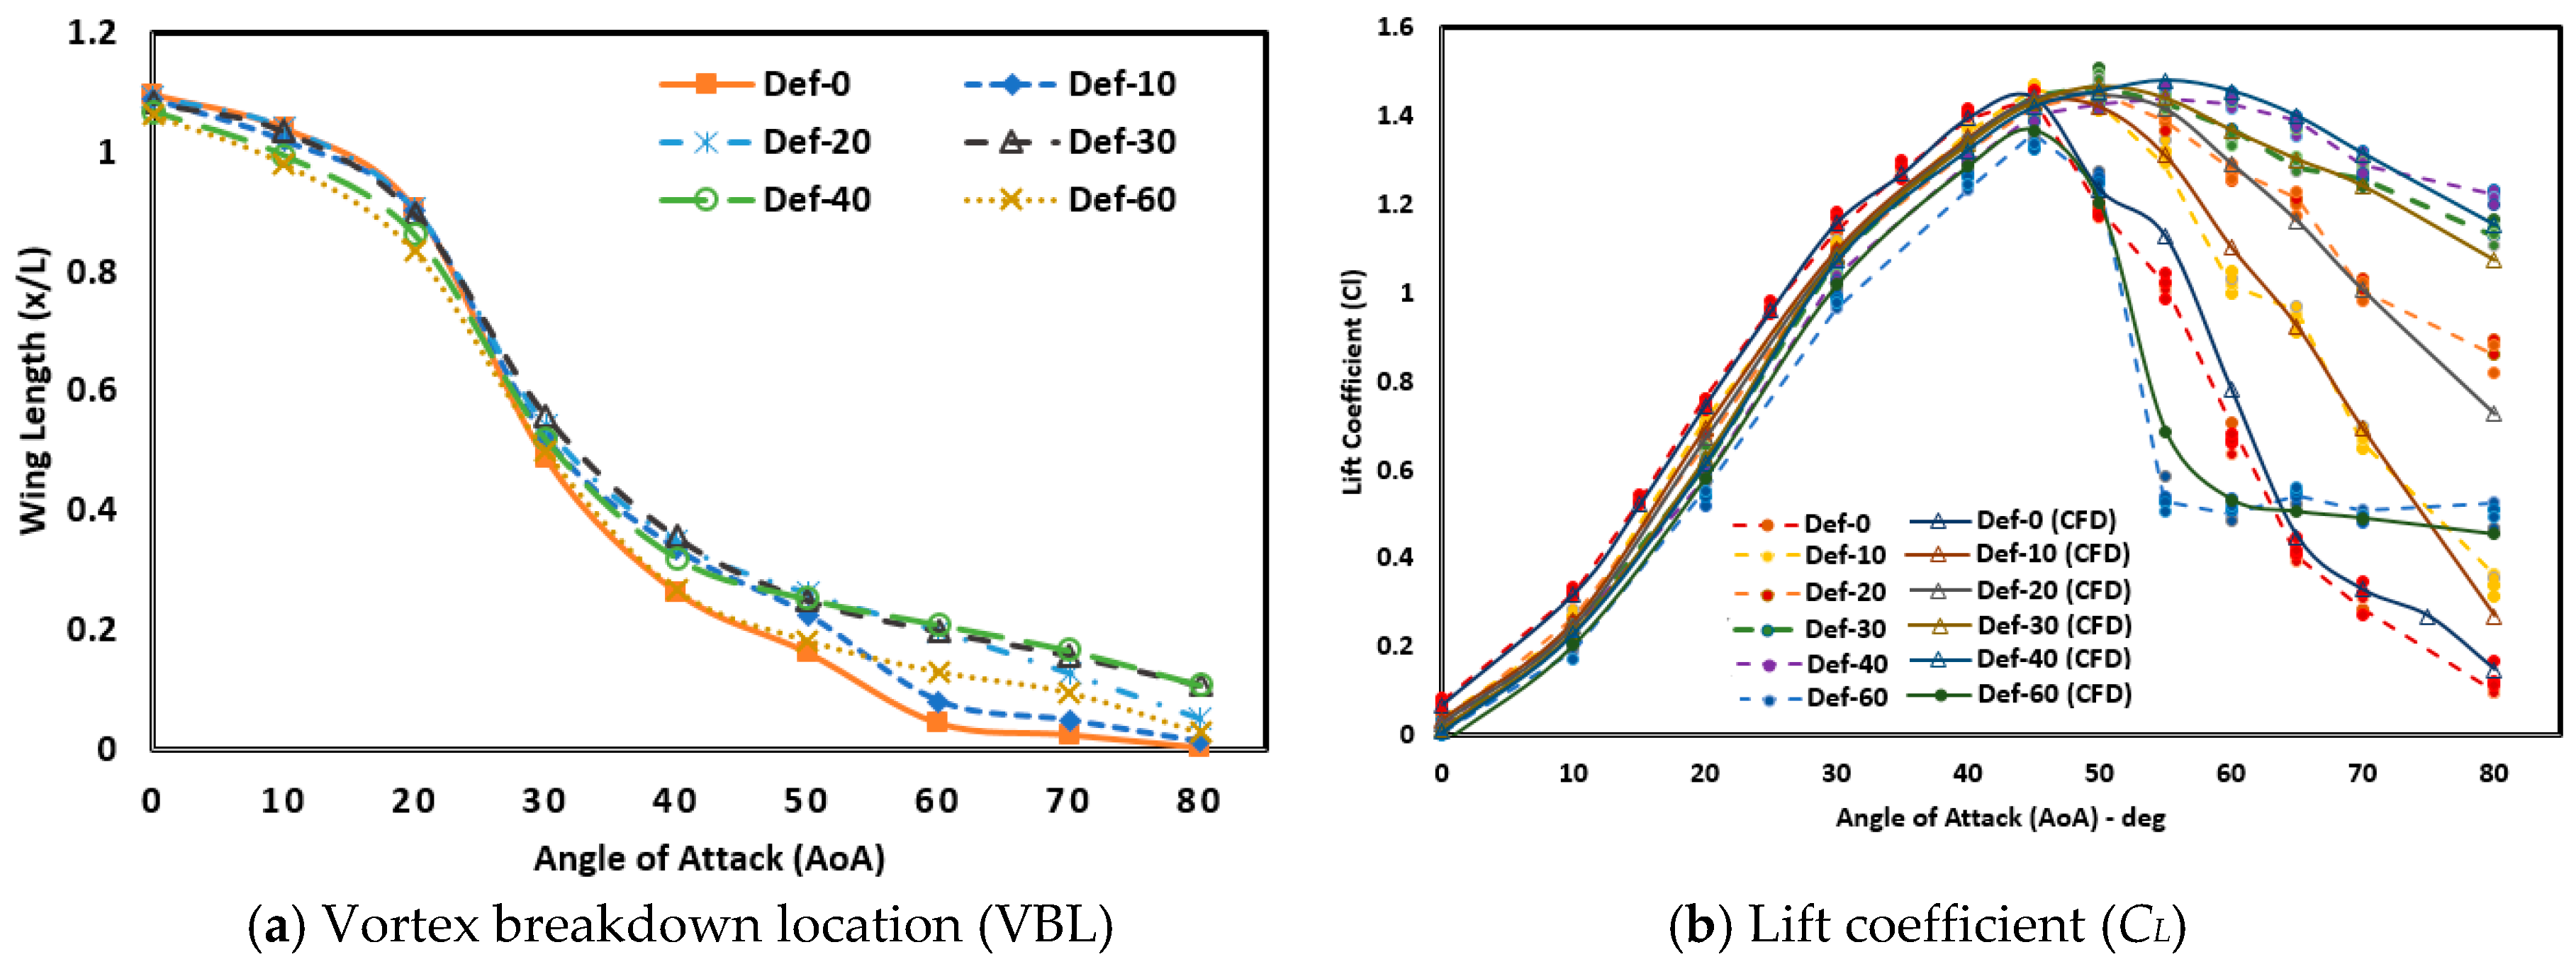
Figure 6a shows the vortex breakdown location with respect to the AoA for various canard deflection angles (δ). At low AoA, below 20°, the location of vortex breakdown is the same for each mode, namely, in the area behind the wing. The higher the AoA, the further the vortex breakdown location will be. At high AoA, >40°, for standard canard configurations, the vortex breakdown location approaches the leading edge, meaning that it is increasingly towards the stall point and the coefficient of lift is getting smaller while, at a negative deflection angle, the standard canard condition, δ = 0°, is still lower than the position of the vortex breakdown. At very high AoA, >60°, the location of the back vortex occurs at the deflection angles of δ = 30° and 40° while, in the standard configuration, 10° and 60°, vortex breakdown locations are at the front end of the wing. This condition shows that the deflection configuration δ = 30° and 40° still has a lift force while, in the standard configuration, 10° and 60° have fully stalled.
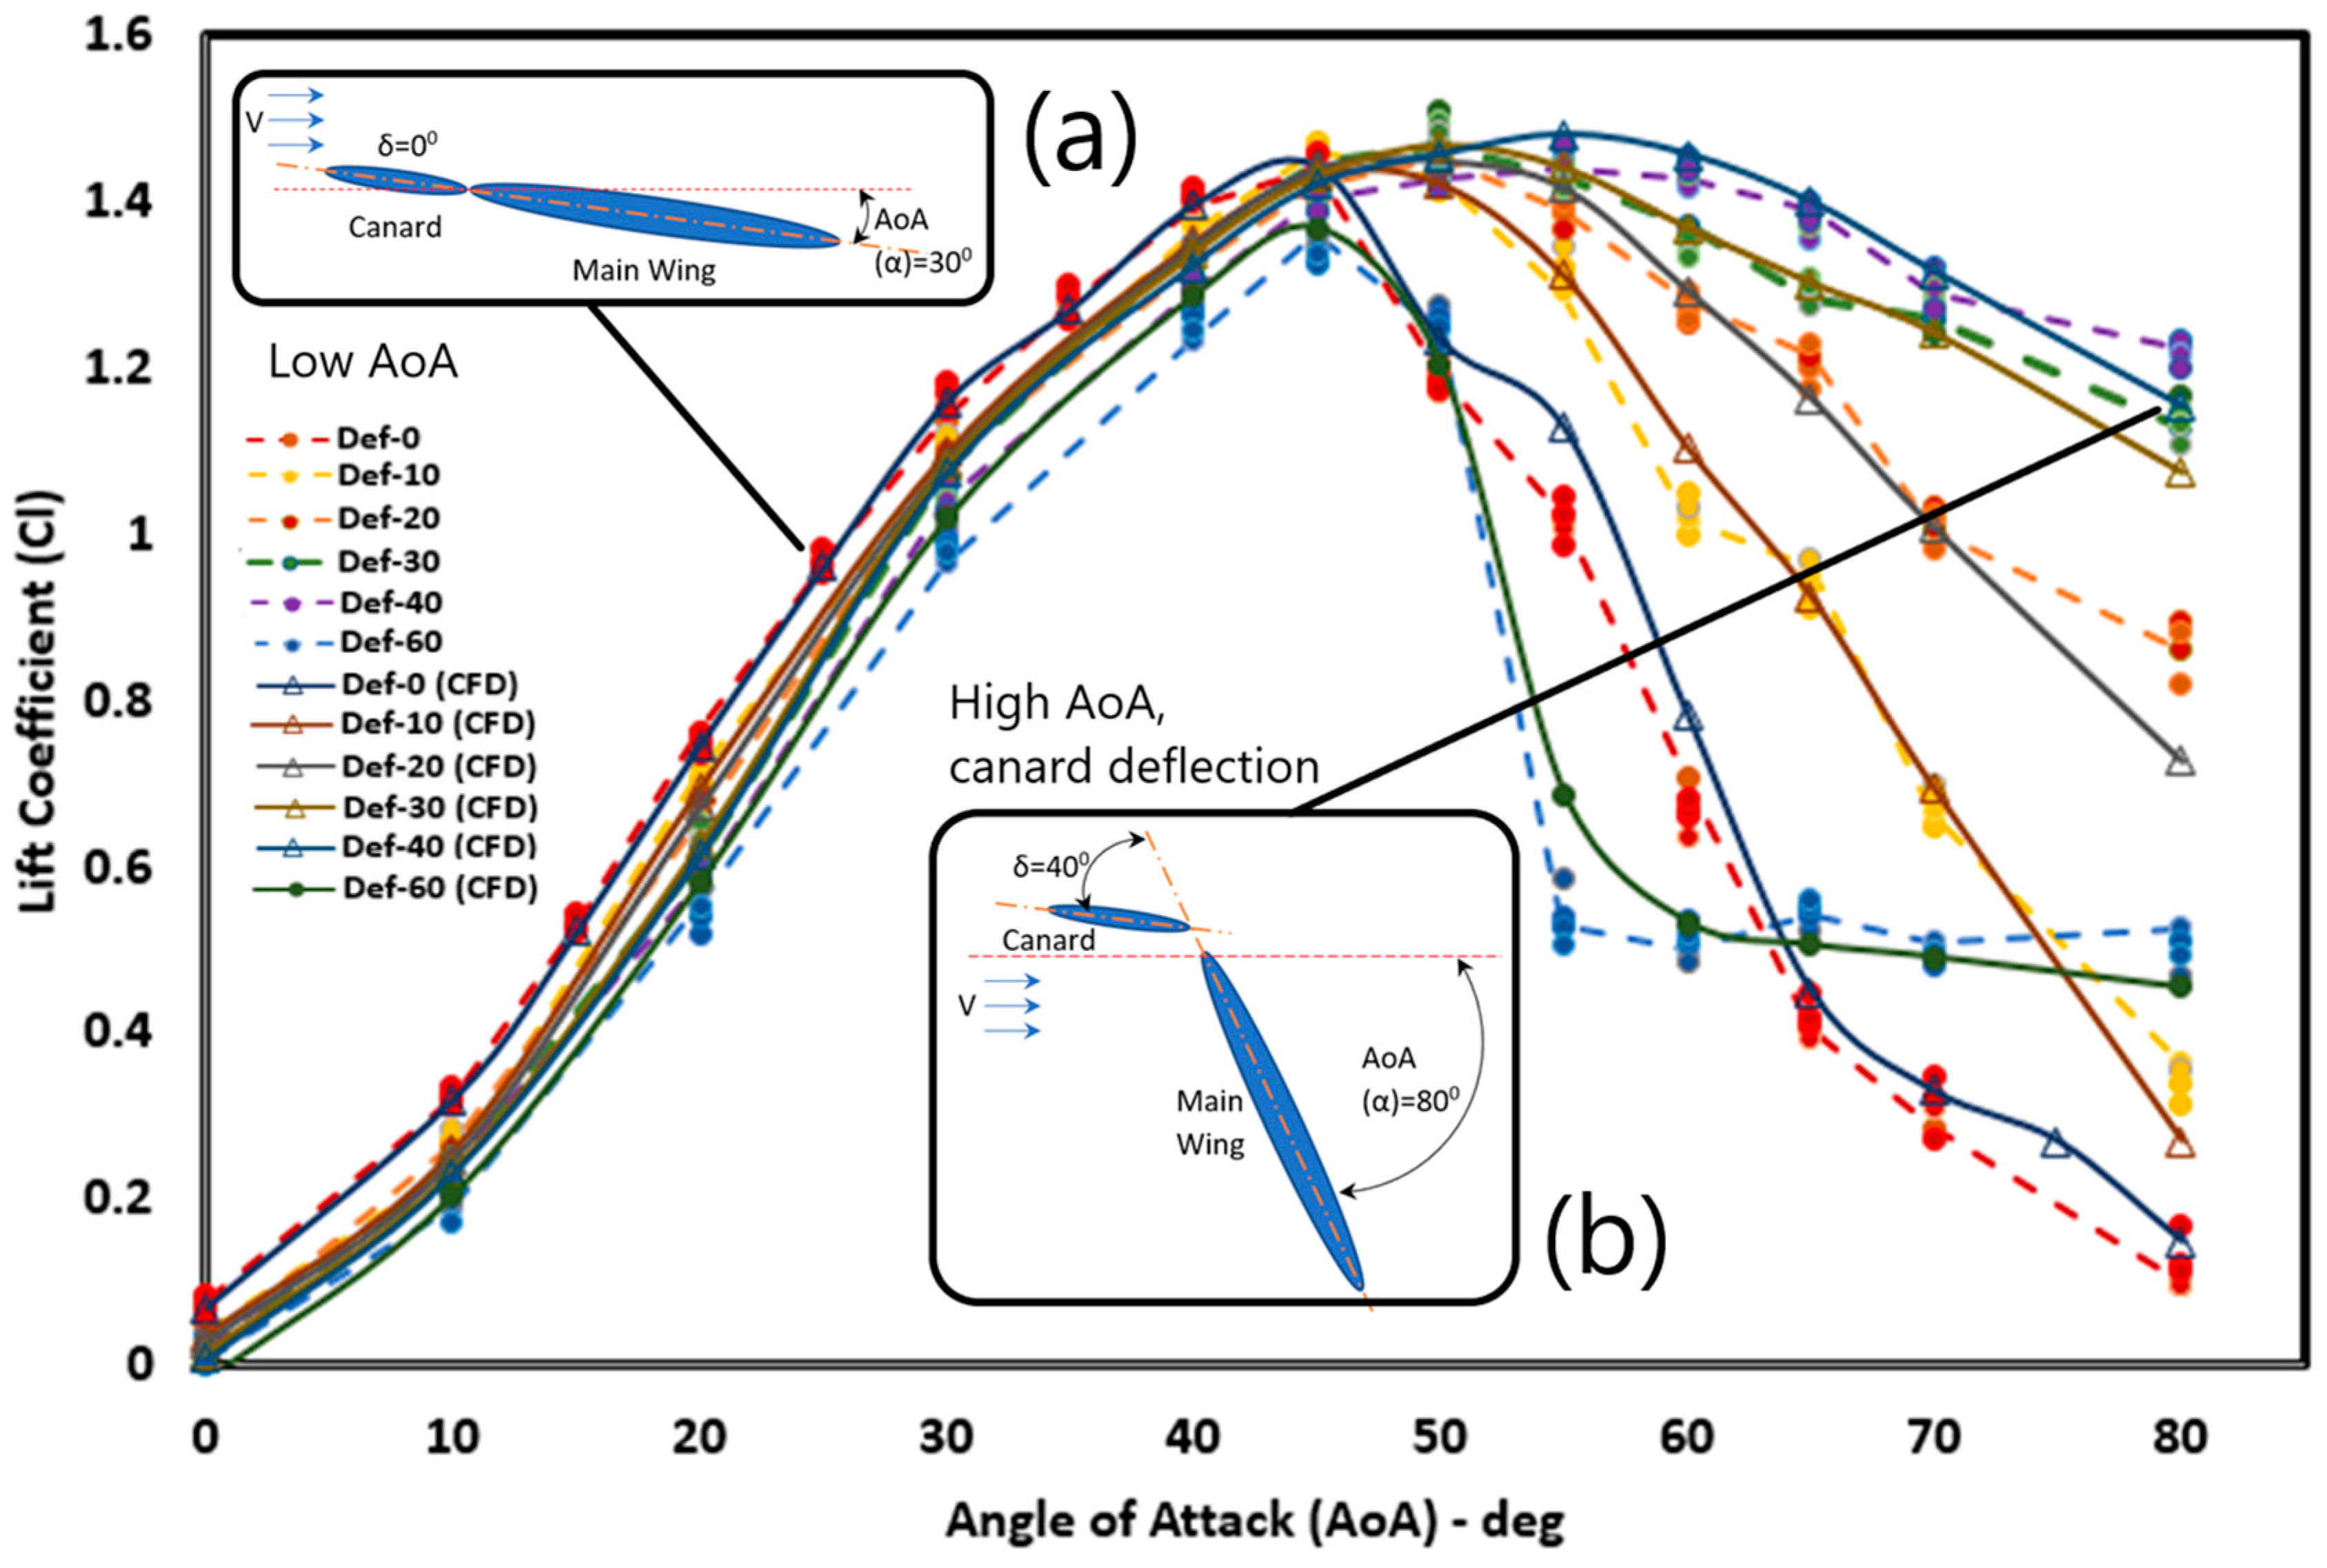
Figure 6b presents the measurement results of the lift coefficient,
CL, using water tunnel, which is compared with the results of CFD with excellent conformability. At low AoA (0°–30°) the best value of
CL occurs at standard conditions, δ = 0°, followed by the case of canard deflection δ = 10°. This is because at low angles of attack, the use of a deflection angle reduces the total lift force. As the AoA rises towards the
CL, max area (40°–50°), the
CL value also rises for all cases. At deflection values 0°, 10°, and 20°, the system has a
CL value that is almost the same at the angle of attack 45°, where the deflection angle δ has begun to affect the magnitude of
CL, especially at low δ values. In the standard deflection model configuration (δ = 0°), the maximum
CL value occurs at AoA 45° of 1.45, and at AoA 50°, has decreased the value of
CL and, likewise, as the increase in AoA becomes more significant, the value of
CL decreases rapidly.
At the δ = 10° deflection angle configuration, the system experiences a maximum value of CL at an angle of 45° with a value of 1.46; then, at a higher AoA, the CL value decreases even though it is not significant compared to the standard conditions. The decrease of the CL value at the angle of attack is higher than 50°, to AoA = 80°; CL still has a value of 0.35. In the configuration of the deflection angle δ = 20°, the lift coefficient is still rising up to AoA 45° of 1.45. Furthermore, the CL value decreased gradually to AoA 80° with a CL value of 0.88. At deflection angle δ = 30° an increase in the value of CL up to AoA 50° is also experienced, with a value of 1.48, and then, also, a decreased value of CL. At the angle of deflection δ = 30°, the decrease in the CL value is very slow with the addition of AoA so that, up to AoA 80°, it still has a high CL value of 1.14. Meanwhile, at the angle of deflection δ = 40°, the increase in the maximum CL value to the AoA = 55° is 1.44, then it decreases slowly. At the AOA = 0° configuration, δ = 40° still has a CL value of 1.23.
The configuration of the deflection angle δ = 60° apparently does not produce a good CL value. At low attack angle, CL value is lower than other arrangements. This is because at low angles, the canard produces a large negative lift force on the canard. The increase in AoA also has an effect on the rise in CL value, with the maximum CL value, occurring at AoA 45°, of 1.34. In AoA 50°, this configuration experienced a significant CL decrease up to AoA 60° of 0.67. With increases of AoA greater than 80°, the resulting CL value tends to be stable with a gradual decline.
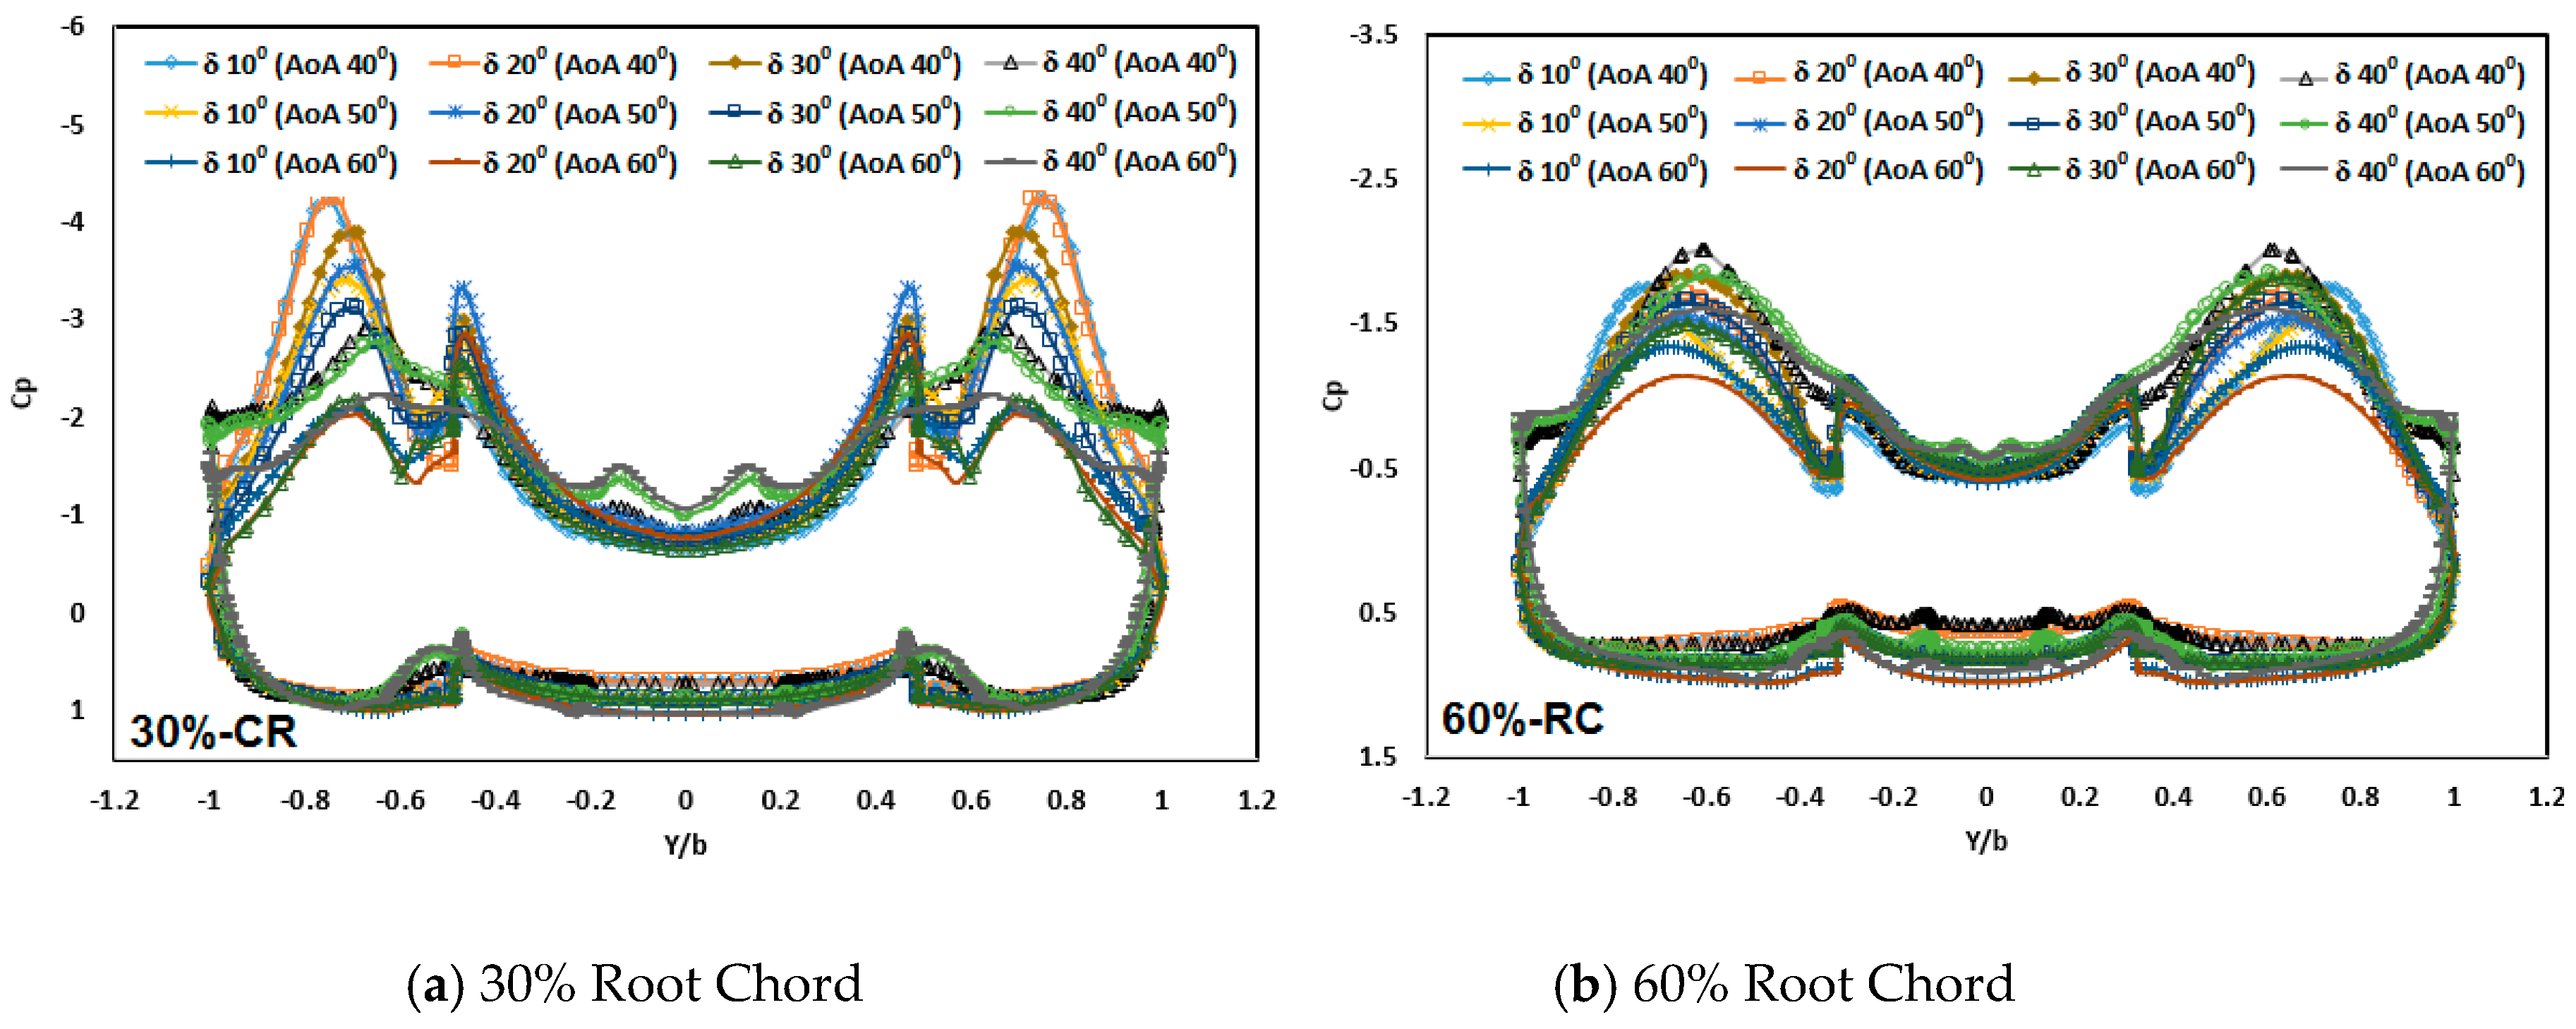
Figure 7 shows the surface pressure distribution (
Cp) on the upper and lower surface of the wing for locations
x/L = 30% and 60% for AoA 40°, 50°, and 60°. The surface pressure distribution profile shows the value of the pressure difference between the upper and lower surfaces of the wing. At the top of the wing is the location of the concentration of negative pressure in the position of the wing intersection. High negative pressure distribution profile shows the intensity of the vortex core as the center of lift in the wing.
Figure 7a shows the surface pressure distribution profile at the root chord (
x/L) = 30% as a description of the condition on the front part of the wing, while
Figure 7b shows the surface pressure distribution on the rear wing for
x/L = 60% Root Chord and δ = 10°, 20°, 30°, and 40° canard deflections. The distribution of pressure on the front part of the wing (
x/L = 30%) has the highest pressure difference at AoA 40°. This condition shows the highest concentration of lifting force occurring above the wing surface. The increase in AoA causes a decrease in the pressure difference on the wing surface. Each canard deflection angle configuration has a different negative pressure value. The deflection configuration at δ = 10° and 20° have the highest negative
Cp at AoA 40° and 50° but, at AoA 60°, the highest negative
Cp value occurs at the canard deflection angle δ = 40°. While on the back of the wing (
x/L = 60%), the distribution of pressure difference indicates the length of the vortex core that forms up to the area behind the wing. A high negative
Cp value indicates that there is still a negative pressure in the area. All attack angle values show that canard δ = 40° followed by 30° deflection configurations have the highest negative
Cp. At the δ = 10° and 20° deflection angle configurations, the system has a lower negative
Cp value.
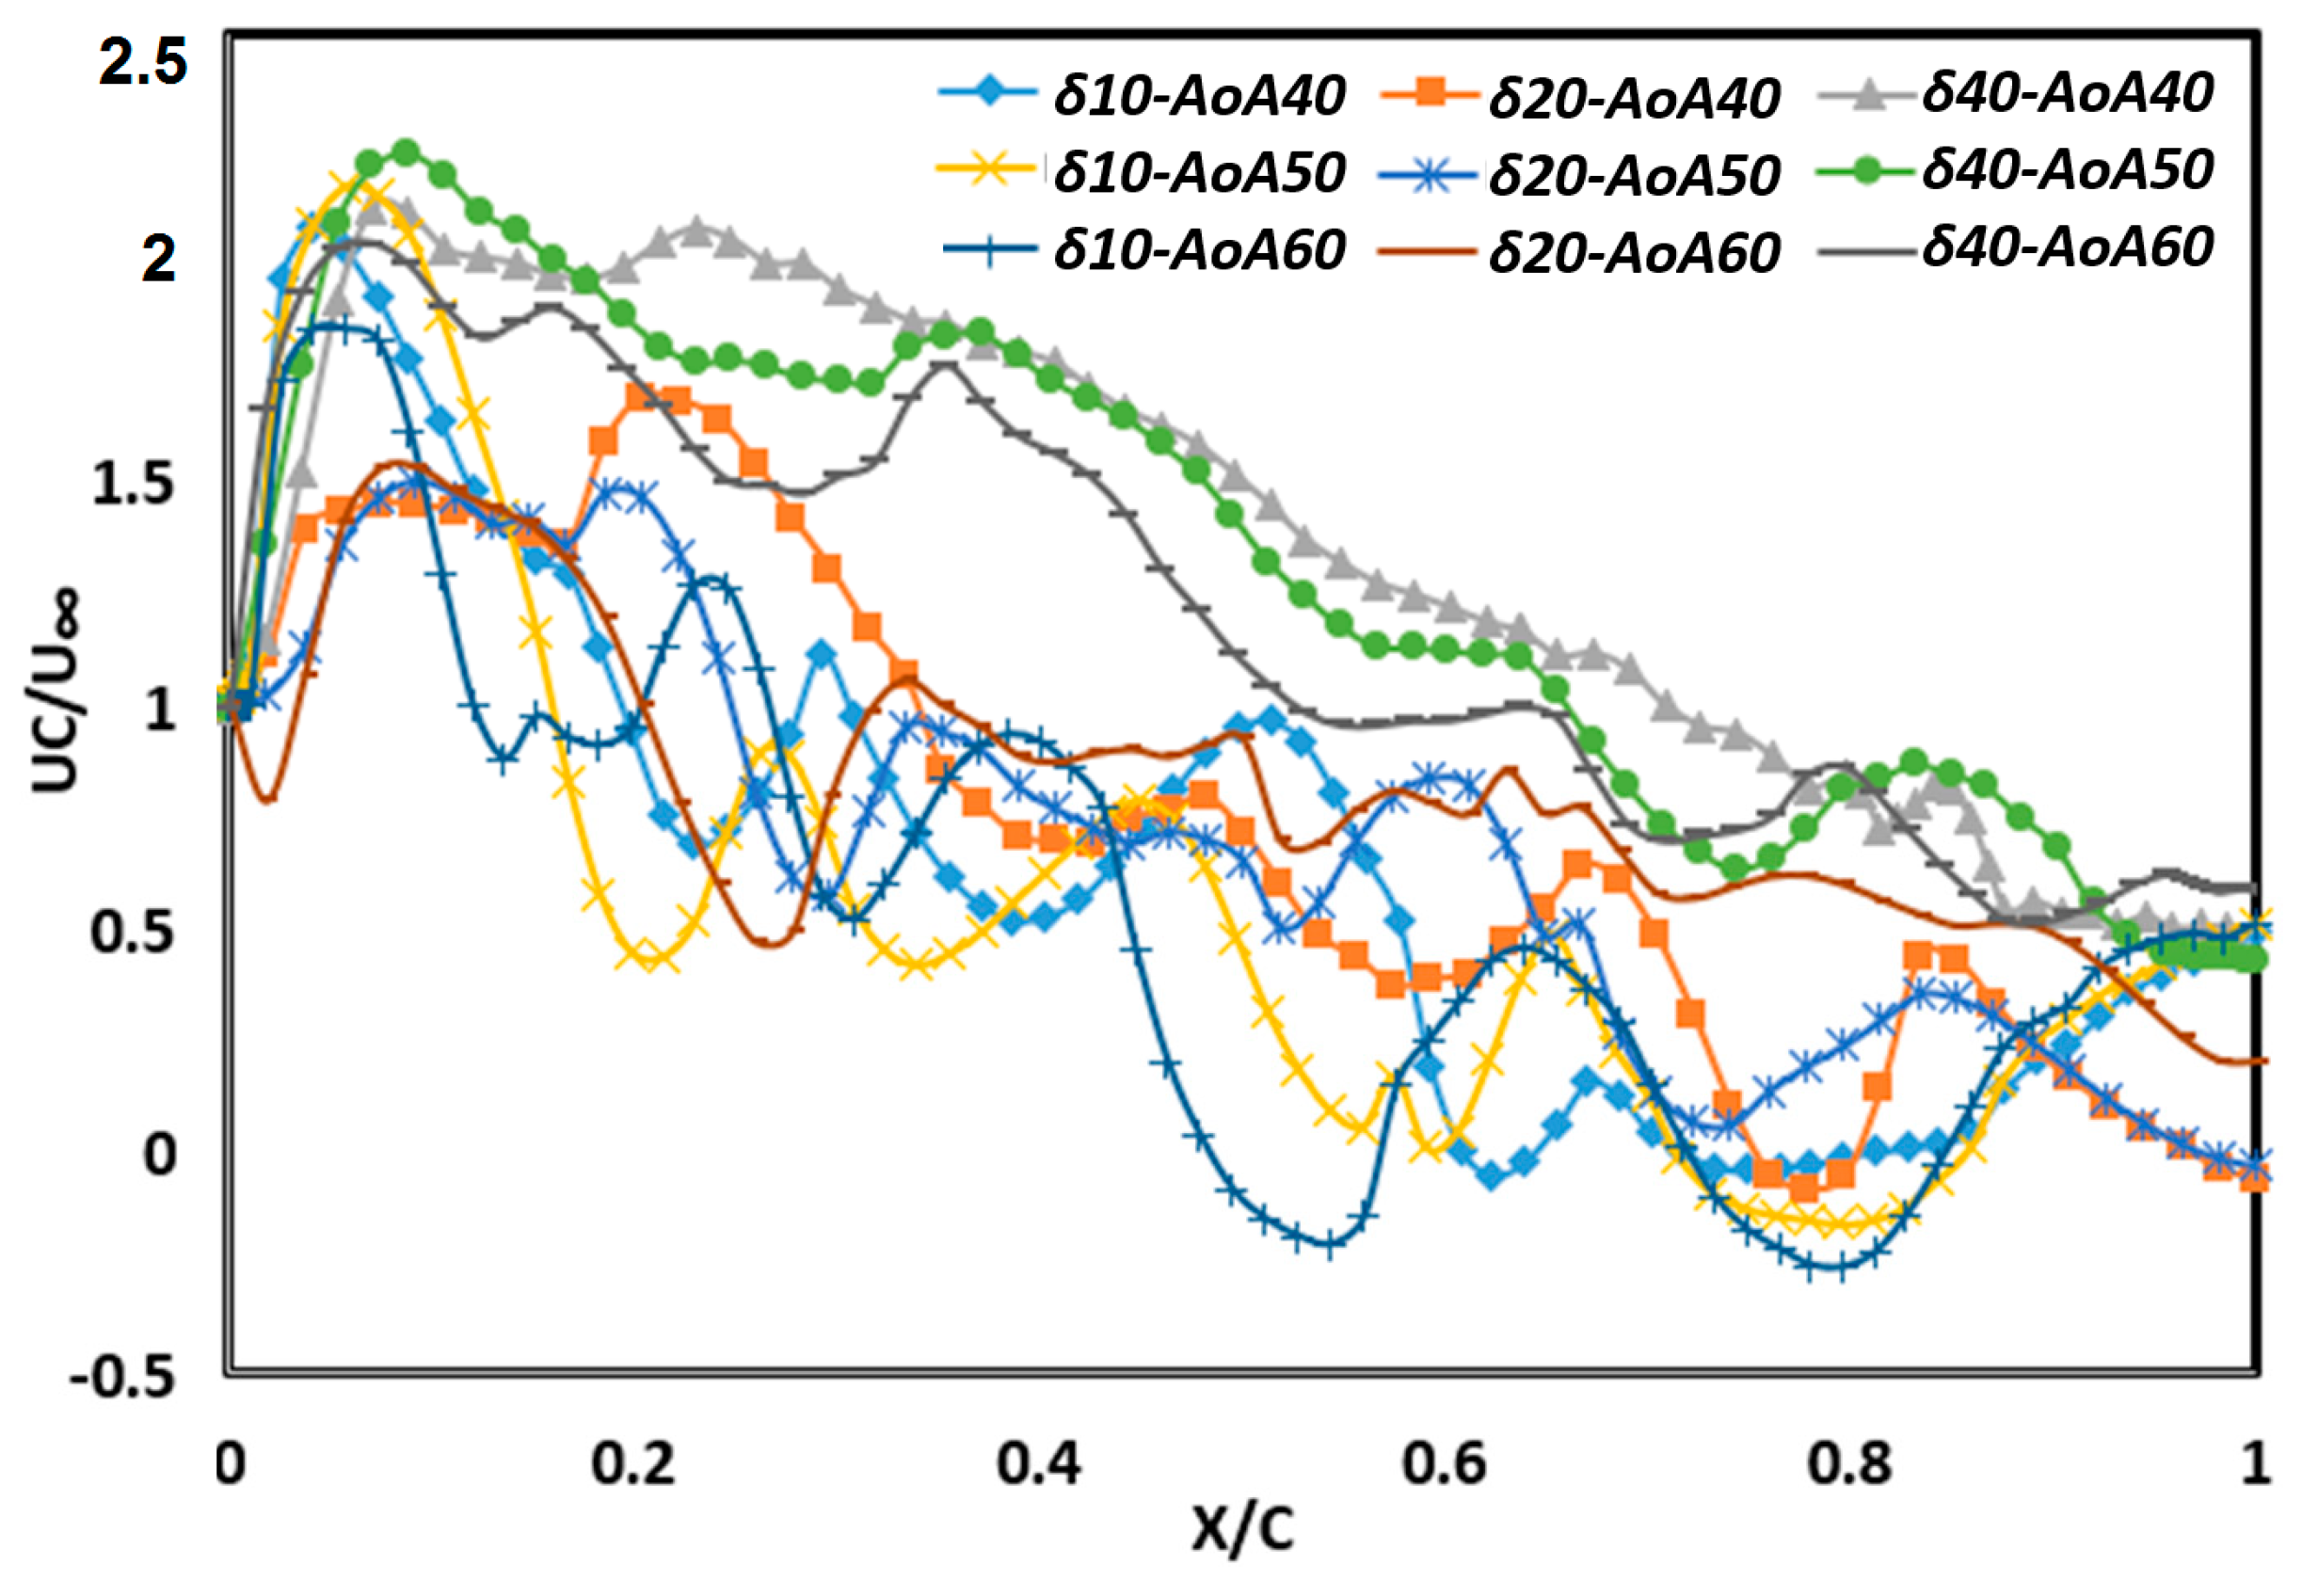
Figure 8 shows the ratio between axial velocity (
Uc) to free stream speed (
U∞) along the vortex core. This graph is used to analyze the core strength of the vortex formed as a result of the rolled-up vortex. The higher axial velocity, compared to the free stream velocity in the vortex core, indicates the strength of the lift force of a vortex core while the low
Uc/U∞ value below one,
Uc/U∞ < 1, shows the axial velocity at the vortex core has been reduced, and this condition states that the vortex core has been damaged, which is referred to as a vortex breakdown. The vortex breakdown,
Uc/U∞ < 1 value is seen at the location of a particular wing length. The farthest location value occurs at the angle of deflection δ = 40°, followed by 20° and 10°.
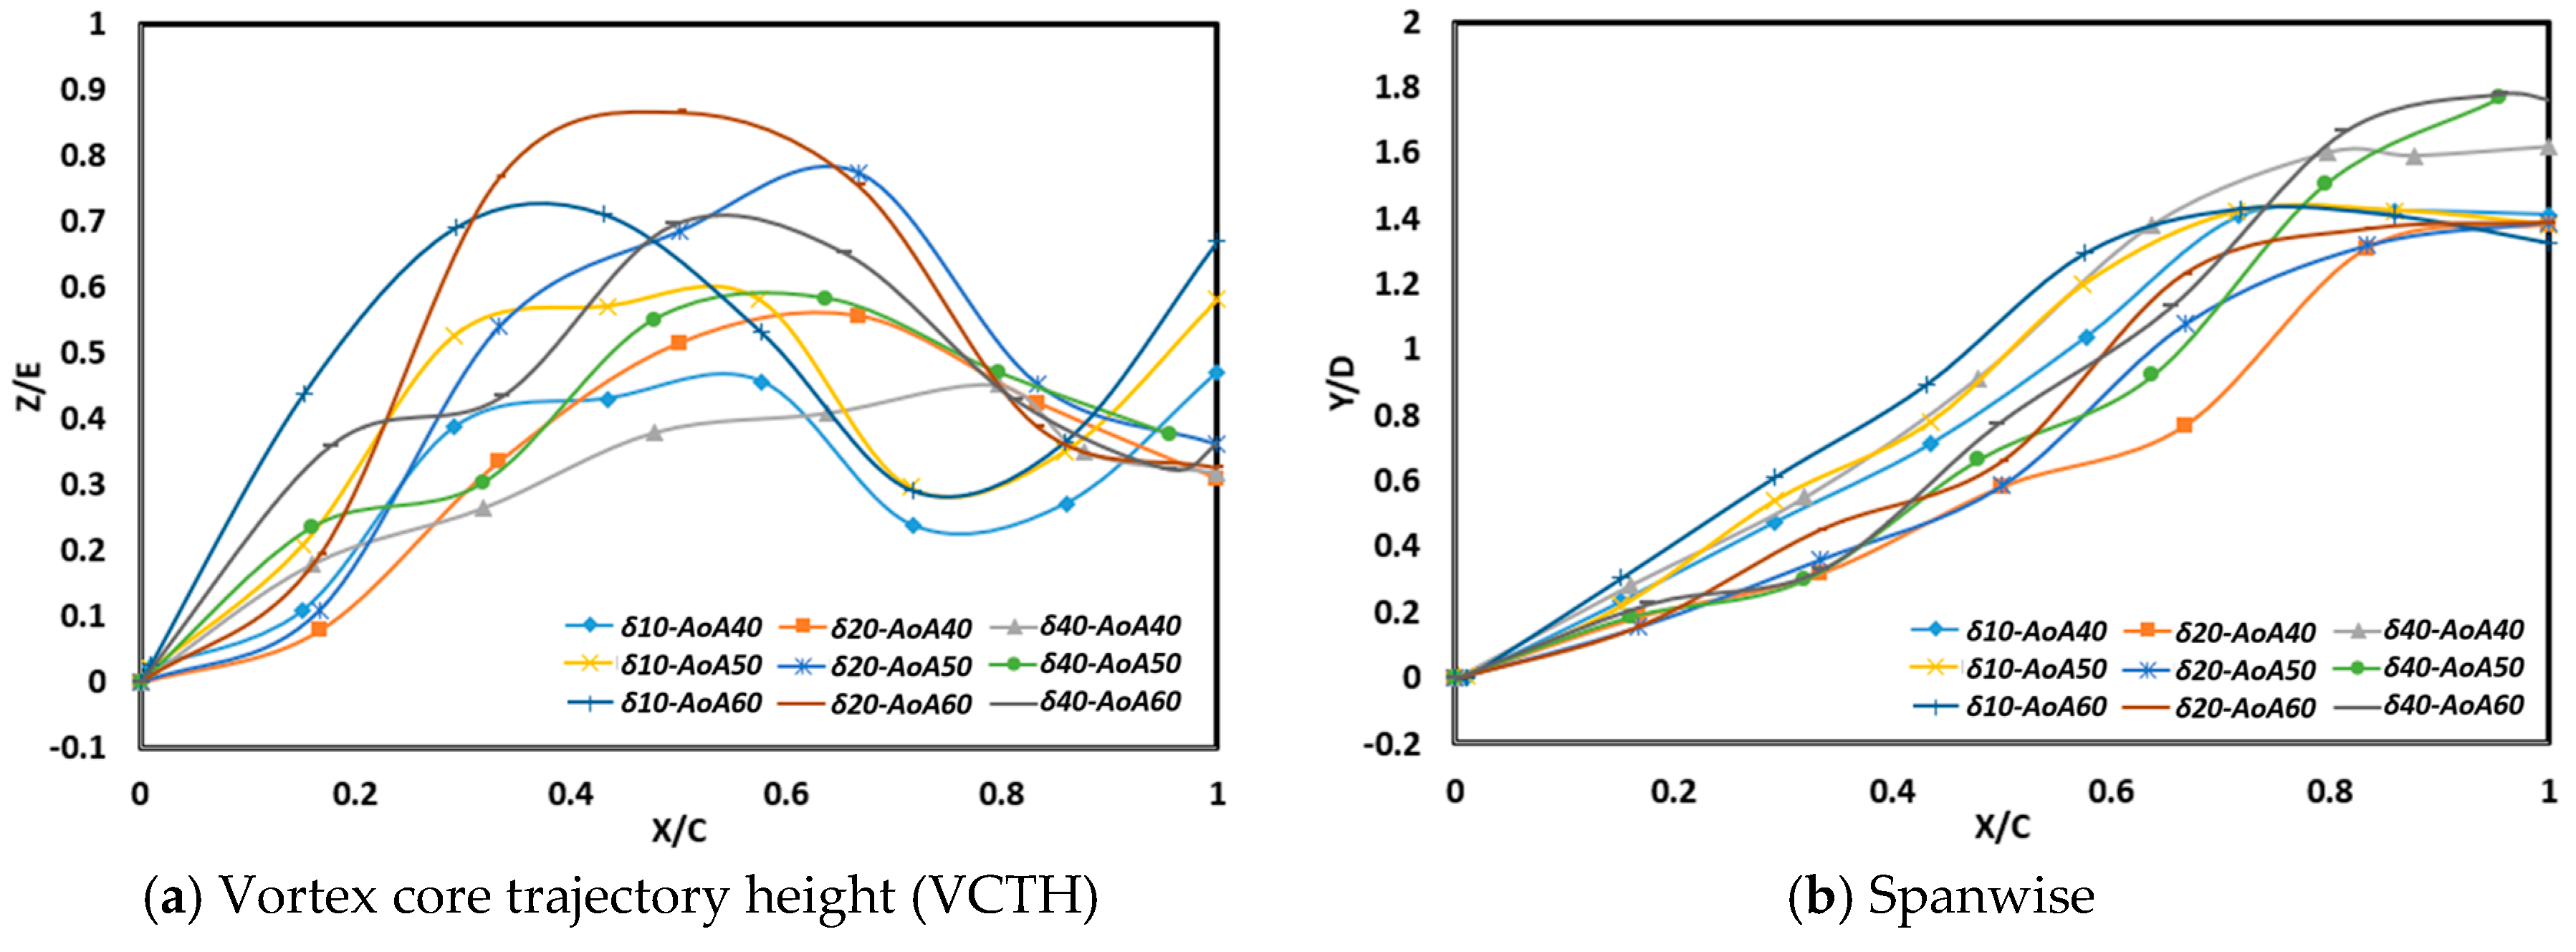
Figure 9 shows the vertical and horizontal trajectories of the vortex core. This graph shows the height of the trajectory and the widening direction of the vortex core generated from the main wing. The direction of the vortex core trajectory from the main wing shows the level of interaction between the formed vortex nuclei. The low trajectory of the vortex core shows the negative pressure area closer above the wing so that it will produce a better lift force while, horizontally, the vortex core trajectory in a span-wise direction shows the concentration of lift force on the main wing. At the position of the vortex core height, as seen in
Figure 9a, it can be seen that the increase in angle of attack (AoA) of 40°, 50°, and 60° cause the vortex’s core trajectory to rise for all deflection angle configurations. The difference in deflection angle will result in a different track height. The δ = 40° canard deflection angle produces the lowest trajectory height, followed by deflections δ = 20° and 10° while, for span-wise vortex core trajectories, the system shows trajectory similarity for each canard deflection configuration.
4. Discussion
The results of flow visualization using a water tunnel are able to show the phenomenon of vortex core formation, interaction of flow, and vortex breakdown that occur for each canard deflection configuration. The vortex core—shown from the formation of the ink injection line—is clearly visible, flowing from the canard and wing ends. This area is a concentration of the lift formation until the ink injection line is broken down. When compared to the standard deflection configuration, the location of ink splitting with the use of deflection is more rearward, toward the back of the wing.
The advantages and the result of implementing Q-criterion to probe vortices is that one could measure the strength and specify the direction of the vortices region precisely. The advantages of using a logarithmic grid to emphasize the microgridding effect of the turbulent boundary layer are that one could minimize the number of cells and still optimize the result by setting the cell size to match the Kolmogorov microscale to effectively catch the turbulent boundary layer effect. Therefore, as one of the advantages of using Q-criterion to probe vortices region, we could specify the detailed quantitative trajectory of the vortex core and explain the development of velocity and wing negative SPD. Furthermore, one could characteristically explain the performance improvement, better lift, agility, and maneuverability of the aircraft.
When compared to the CFD outcomes, the results of this water tunnel visualization have the same flow form. In more detail, the results of CFD will provide additional information regarding the direction of the trajectory, interaction, pressure distribution, and other data hardly observable in wind tunnels. In the CFD results, the flow from the main wing shows an increase of the trajectory direction with the increase in AoA. However, it can be seen that the effect of the flow interaction from the canard causes some of the flow from the main wing to be dragged following the flow from the canard to remain above the main wing. This causes the survival of the trajectory of the main wing vortex core to remain above the wing to produce lift. The lower trajectory of the vortex core formed above the main wing will produce a concentration of lift force on the wing surface.
When compared with canard configurations without deflection, the AoA 30° and 40° still have almost the same flow form. In low AoA with aircraft configurations without deflection canard, vortex nuclei are formed low, above the wing. In this condition, the influence of canard deflection on the flow character is not so different. Similarly, when viewed from the lift coefficient value (see
Figure 3), the conditions of AoA = 30° and 40° for canard deflection conditions do not have many different values. Therefore, in this AoA condition, the influence of deflection has not been seen on the aerodynamic character that occurs.
The flow character in AoA 50° for each canard deflection configuration does not experience a significant difference in flow character. The core form of vortex, both from the results of visualization of the pathline flow, Q-criterion, and the pressure distribution contour, is seen to still flow low above the wing surface, which indicates the center of lift. However, if the AoA 50° is compared with the configuration without canard deflection, then there are some differences in the character of the flow that occurs. At the angle of attack 50°, for the configuration without deflection, the flow from the wing has been released, rising to the top of the temporary wing from the view of the direction the flow has led when approaching the fuselage. This suggests that there is no good relationship between the canard vortex center and the flow from the wing. Meanwhile, in the canard deflection configuration δ on AoA 50°, it is seen that for all the angle deflection conditions, δ, the flow is still low over the wing, and widens behind the leading edge.
Likewise, for the results of visualization of the shape of the vortex core, the configuration without deflection δ = 0° has experienced core damage from the front of the wing while, on the pressure contour, there is also a fluctuation and breakdown of the contour core. From this condition, it is shown that at AoA 50°, there has been a vortex breakdown in the vortex core flow from the front. The effect of vortex breakdown on the front also causes a decrease in lift in these conditions while, in the canard deflection configuration δ, a form of visualization of the vortex core is formed continuously from both the canard and the wing to the AoA 50° as well as pathline flow. The deflection angle of δ = 10° for AoA 50° on the pressure contour image shows the breakdown of the contour core on the back, which shows the start of a breakdown vortex; this is not seen in the other deflection angle configuration.
At high AoA (more than 50°), the difference in flow direction and pattern of the vortex core is evident in the difference for each canard deflection configuration δ. In conditions without deflection δ = 0, at AoA 60° and 70°, the direction of flow from both the canard and the main wing has been released, pointing upward and seen as the flow separation from the main wing. Horizontally, the flow from the wing also leads straight inward, indicating no rolled-up vortex formation and interaction with the flow of the canard. This condition indicates that, starting from AoA 60°, it has been separated and has lost its lift, or stall has occurred while, the canard δ = 10° deflection configuration shows the pathline flow from the wing still interacts with the flow from the canard, the flow still low at AoA 60°. However, it can be seen from the backflow flow direction that the shape of the Q-criterion vortex core, streamlined horizontal wall, and pressure contour distribution show there is damage to the vortex core that is progressing closer to the front of the wing. In deflection configuration δ = 20°, for AoA 60°, streams are still formed, interacting well above the main wing. This condition also has similarities with canard deflection configurations at δ = 30° and 40°. Similarly, the visualization results for vortex core shape and pressure distribution contour. This is an indication of a breakdown of the contour center and damage to the vortex center in the middle of the wing. This shows that there is still lift in AoA 60°.
It is generally seen that, at low attack angles (less than 50°), for all cases, the deflection has the same character. The direction of flow of the canard, visualized from both the pathline and the vortex core, form a low trajectory above the main wing and interacted with the main wing flow. The trajectory of the eddy core from the low formed canard above the main wing will cause strong interactions with the flow above the main wing.
The pressure distribution graph (Cp) shows the lift force on the aircraft model in almost all AoA. AoA 40° produces a large vortex core at the back of the wing. The increase in AoA, which results in a higher pressure difference, indicates that there is still an increase in lift coefficient in these conditions. The maximum CL value depends on the canard deflection configuration. The deflection angle of δ = 30° and 40° is able to give the maximum value of CL at the highest attack angle among other deflection angle configurations. After the AoA condition with a maximum CL value, the magnitude of CL will decrease as the AoA rises. The canard deflection angle is able to withstand the magnitude of the decrease in the CL value, which is seen from the condition of the maximum AoA value which still has a pressure difference. In the canard δ = 40° deflection angle configuration with AoA 60°, it is possible to detect the pressure difference in the rear wing location so that, in this configuration, it is still possible to maintain the presence of lift force on the AoA 60° maneuvering motion. The Uc/U∞ chart will rise for a moment, from the front end of the main wing to a high value. This condition indicates that the front of the wing is a rolled-up vortex with a high axial core velocity. In this area, there is a concentration of forming lift forces on the wing of the aircraft. Towards the rear wing, the axial velocity decreases. The decrease in axial velocity also causes the strength of the lift force to decrease. For low AoA, the decrease takes place slowly, so that it can reach the furthest Uc/U∞ = 1 value. Likewise, the deflection angle configuration δ = 40° at AoA 60° has a slow axial velocity decrease, and reaches the farthest location. This condition shows that deflection 40° is able to maintain the most extended vortex core.
While the location of the vortex breakdown is obtained from the definition of the Uc/U∞ < 1, it is the value which indicates that the axial velocity is not dominant. Thus, it indicates the loss of the vortex core. In this condition, when compared to the results of the visualization of the flow, vortex core damage occurs in the area, or there is a backflow in streamline which indicates the loss of lift. This condition is also in accordance with the reduction of the negative pressure distribution and the decrease in the CL value in the area of vortex breakdown.
It is generally seen that, at low angles of attack (less than 50°), for all cases, deflection has the same character. The direction of flow of the canard, visualized from both the pathline and the vortex core, formed a low trajectory above the main wing and interacted with the flow from the main wing. The trajectory of the eddy core from the low formed canard above the main wing will cause strong interaction with the flow above the main wing.
From the analysis of the lift force coefficient, at low attack angle, the deflection (δ) causes a negative lift which causes the lift coefficient to be smaller than the standard canard condition. Hence, the use of standard canard configuration δ = 0° gives the best CL results whereas, at high AoA, the deflection gives the ability to sustain the vortex center, delay the vortex breakdown location and be able to retain the CL. This occurrence shows that deflection angle (δ) significantly affect the ability of the aircraft to regulate lift and delay the stall.
The overall test shows that the fighter type that employs canard, and the deflection of canard δ will improve the aircraft’s capabilities during the maneuver. Maneuverability is indicated by the ability to withstand stall conditions and the ability to maintain lift at high angles. At low AoA, the deflection configuration does not provide good flow performance, so the use of canard deflection is not recommended, as seen in
Figure 10a. As the AoA value increases, the canard deflection angle to the negative angle is required. At very high angles of attack, a setting with δ = 30°–40° will maintain the lift needed during maneuvering. Therefore, the employment of deflection angles of the canard is suggested for high AoA to delay the stall needed for maneuvering movements. The experiment shows that at canard deflection angles of 30°–40°, it is still possible to form a vortex center that still produces a lift force up to AoA 80°, as seen in
Figure 10b. In that occurrence, the aircraft can maintain its highest
CL and delay the stall up to AoA 80°.
It can be seen in
Table 1 that the canard of the fighter Sukhoi Su-30-like is very close and at the same height with main wing, and the main wing is beside the body, very close and at the same height with the canard. Sukhoi has chosen a unique canard wing configuration that differed from others. Adding a canard deflection mechanism can make the aerodynamic characteristics better.
The main practical applications of this work are in dogfighting. During dogfighting, pilots need a movement that avoids enemy pursuit and switches to chasing enemies with a maneuver like Pugachev’s Cobra. This movement uses a mechanism to lift the nose of the plane up to a very high angle of attack with a low speed, and then return to the normal flight position. Configuring a canard deflection on extra high AoA that produces a high CL value can be used for this maneuvering movement, similar to Pugachev’s Cobra.


