Article

Weather Impact on Airport Performance

1
Institute of Flight Guidance, German Aerospace Center (DLR), 38108 Braunschweig, Germany
2
School of Architecture and Cities, University of Westminster, London NW1 5LS, UK
*
Author to whom correspondence should be addressed.
Aerospace 2018, 5(4), 109; https://doi.org/10.3390/aerospace5040109
Submission received: 7 September 2018 / Revised: 5 October 2018 / Accepted: 8 October 2018 / Published: 15 October 2018
(This article belongs to the Collection Air Transportation—Operations and Management)

Abstract

:
Weather events have a significant impact on airport performance and cause delayed operations if the airport capacity is constrained. We provide quantification of the individual airport performance with regards to an aggregated weather-performance metric. Specific weather phenomena are categorized by the air traffic management airport performance weather algorithm, which aims to quantify weather conditions at airports based on aviation routine meteorological reports. Our results are computed from a data set of 20.5 million European flights of 2013 and local weather data. A methodology is presented to evaluate the impact of weather events on the airport performance and to select the appropriate threshold for significant weather conditions. To provide an efficient method to capture the impact of weather, we modelled departing and arrival delays with probability distributions, which depend on airport size and meteorological impacts. These derived airport performance scores could be used in comprehensive air traffic network simulations to evaluate the network impact caused by weather induced local performance deterioration.

Graphical Abstract

1. Introduction

Future 4D aircraft trajectories demand consideration of economic, environmental and operational constraints. The prediction of aircraft processes along their whole trajectories is required to achieve punctual operations. Uncertainties during the airborne phase of flights represent only a minor impact on the overall punctuality. In the current operational environment, ground tasks gain more relevance. The focus on ground operations will allow the different stakeholders to define and maintain a comprehensive 4D aircraft trajectory over the day of operations. Using a reliable and predictable departure time is one of the main tasks of the ground activities. Mutual interdependencies between airports, as departing delays propagate thought the network, result in system-wide far reaching effects. In 2016, reactionary delays continued to be the main delay cause, followed by turn around delays, accounting for 46% of departure delays [1]. A flight can be seen as a gate-to-gate or as an air-to-air process. The gate-to-gate perspective focuses on the flown part of the trajectory whilst an air-to-air approach would give more relevance to airport ground operations which move the flight from arrival to departure ensuring the adherence to reliable departure times. Typical standard deviations for airborne flights are 30 s at 20 min before arrival [2,3], but could increase to 15 min when the aircraft is still on the ground [4]. As shown in Figure 1a, the average time variability (measured as standard deviation) during the flight phase (5.3 min) is higher than in the taxi-out (3.8 min) and in the taxi-in (2.0 min) phases, but it is still significantly lower than the variability of both the departure (16.6 min) and arrival (18.6 min) phases [1]. The changes experienced during the gate-to-gate phase are comparatively small, leading to a translation of departure variability into arrival one [5]. Thus, the arrival punctuality is driven by the departure punctuality [1]. In addition, 2016 departure and arrival punctualities (defined as not being later than 15 min with respect to the schedule) are shown in Figure 1b. All stakeholders (airlines, airport, network manager, air navigation service providers) play a role on the system punctuality performance.
For example, airlines strategically implement buffers to absorb a part of the delay generated by tactically reducing its propagation and achieving a desired target of punctuality [7,8]. In 2016, only 81% of the flights were punctual with a decreasing trend starting from 84% punctuality in 2013 [1]. According to [1], weather related delays are reported by the flow management positions as the second most common cause of en-route air traffic flow management (ATFM) delays (18%). For airports, the closer they operate to their maximum capacity, the more severe is the impact of a capacity loss due to external events such as weather.
Current research in the field of flight and airport operations addresses economic, operational and ecological efficiency [9,10,11,12,13,14,15,16,17,18,19,20,21,22]. As presented above, the propagation of delay in the network is paramount when assessing the impact of congestion [23,24]. This is particularly critical when estimating the resilience of the Air Traffic Management (ATM) system and the impact of different mechanisms on the expected performances’ variations [25,26,27]. Dynamic traffic situations emerge from traffic flow patterns across Europe and to-from intercontinental flows, military operations [28], volcanic ash eruptions [29], zones of convective weather [30], prevention of contrails [31], consideration of commercial space operations [32] and integration of new entrants [33]. Current research also considers passengers metrics as trade-offs between optimisation of flight performances not possibly being aligned with passengers experience [34]. This can be particularly relevant when optimising arrival flows at airports under uncertainty [35,36]. Thus, delay generation due to weather including location and time of the primary delay generation and its evolution are relevant to capture the complexity of the system dynamics.

Structure of the Document

In this paper, we analyse the correlation of the on-time performance of flight operations with the weather present at airports, taken from the Meteorological Aviation Routine Weather Report (METAR). This approach could be used to predict delay generation and propagation through the network as well as to analyse and implement reliable mitigation strategies.
The document provides a fundamental analysis of the impact of specific weather phenomena on the performance of an airport. In this context, the performance is measured as deviation of actual and schedule timestamps (defined as delay). The weather phenomena are categorized by the ATM Airport Performance (ATMAP) weather algorithm, which aims to quantify weather conditions at European airports [37]. The quantified weather conditions are compared against a comprehensive data set of European flights of 2013 with about 20.5 million flights and are statistically analysed. This analysis results in both a quantification of the individual airport performance and an aggregated performance metric, which could be used in comprehensive air traffic network simulations to evaluate the network impact of local performance deterioration.
In Section 2, the operational data set (flight plan) is introduced, followed by a description of the weather data (Meteorological Aviation Routine Weather Report, METAR). In Section 3, these data are used as input for the airport performance metric and the ATMAP algorithm. Then, an exemplary and detailed analysis of Frankfurt airport is shown to emphasize our general approach of the weather/performance evaluation (Section 4). Finally, a set of parameters for a common evaluation function (Burr distribution) is provided to model the performance behaviour of a categorized airport as a function of weather (Section 5). With Section 6, the document closes with a conclusion and outlook.

2. Data Set

The data set we used for the analysis consists of flight plans and weather data of major European Airports (20.5 million flights, year 2013). The flight data sets include scheduled and actual time stamps of specific aircraft movements, and air traffic relevant weather data are derived from the airport specific METAR data.

2.1. Flight Plan

A flight performance assessment is typically based on a data set of aircraft movements including scheduled and actual timestamps. This flight schedule was derived and aggregated in a local database (see Table 1) using data from online available sources. A single data entry contains the actual/scheduled arrival and departure times, arrival/departure delay, origin and destination airport, aircraft type, and call sign. In Table 1, fields with time stamps can also be filled with coded, qualified statements from the underlying database: on-time (−30,000 = no delay reported) indicates a deviation from the schedule smaller than 15 min, no-time (−31,000 = no value reported) identifies recorded flights without time stamps for actual or scheduled at arrival or departure, and cancel (−32,000) identifies annulled flights.
Concerning the upcoming analysis, recorded flights considering only qualified statements (no-time) are not taken into account for the detailed stochastic analysis, but the on-time statement could be integrated as a measure of punctuality. The data set contains about 20.5 M flights in 2013 between European airports and airports in the world. These flights are not linked to a specific aircraft tail number, which does unfortunately not allow us to analyse the reactionary delays of the European air traffic network. As an example, the data set of Frankfurt airport (ICAO: EDDF, IATA: FRA) contains approx. 440,000 flights, which covers more than 90% of the air traffic (real movements 2013 at Frankfurt airport: 472,692 [38]).

2.2. Weather Data

Current weather conditions are usually recorded at each airport in the form of METARs (Meteorological Aviation Routine Weather Report [39]). METARs are reported in combination with a Terminal Area/Aerodrome Forecast (TAF). While TAF provides forecast values, METAR data are measured values. The unscheduled special weather report (SPECI) is another format representing significant changes in airport weather conditions. The time of update and the update interval of a METAR weather report are not harmonized and implemented differently worldwide. For example, at larger airports in Germany, a METAR is released twice an hour (20 min past and 10 to the full hour) while, at small sized airports like Moenchengladbach (EDLN), a new METAR is available once an hour only during the operating times of the airports. Current and historical METAR and also TAF data are accessible at different public available websites (such as https://www.ogimet.com). In addition to information about the location, the day of the month and the UTC-time (“EDDF 190850Z”), the METAR contains information about wind, visibility, precipitation, clouding, temperature, and pressure that are relevant for the air traffic, especially for the airport operations (see Table 2).
Besides this general weather information, some additional measurements were available related to adverse weather situations, such as information about wind gusts, runway conditions (e.g., ice layer) and thunderstorm related clouds, as well as calculated values of the Runway Visual Range (RVR). The use of METAR weather records for data analysis demands for a detailed analysis, since specific characteristics exist and the data integrity is not assured by the data provider. Typically, data lacks (partial) loss of significant information, such as wind data, dew-point data, or runway condition information (e.g., depth of deposit), variable units of measure, or incomplete information about airport runway conditions. To allow for an appropriate analysis of the weather phenomena, the METAR is decoded stepwise. The information has to be parsed, filtered and transformed to a usable measure in the context of the comparison to the airport performance.
In this paper, METAR data of 84 representative European airports were analysed for the year 2013. Instead of analysing single meteorological elements of METAR, we use the ATMAP algorithm [37], which offers an approach to quantify and aggregate the METAR data focusing on their particular impacts to the air traffic (see following section). This algorithm considers five weather classes (ceiling & visibility, wind, precipitations, freezing conditions, dangerous phenomena) and also considers different degrees of severity per weather class.

3. Performance Metric

The introduced flight plan data and weather data are used as an input for the airport performance and the quantification/categorization of weather phenomena. In this section, the derived metrics will be introduced.

3.1. ATMAP Algorithm

Eurocontrol’s Performance Review Unit (PRU) in consultation with the ATMAP group published an algorithm for a unified evaluation of weather conditions at airports [37]. The ATMAP algorithm quantifies and aggregate major weather conditions at airports, which have significant impact on the airport operations. Thus, the ATMAP group identifies relevant aviation weather factors and considers that these factors are additionally coupled with the availability of local airport technologies (such as precision approaches in poor visibility conditions) and aircraft characteristics (such as defined tolerances for crosswind and tailwind). Furthermore, the ATMAP algorithm weight the different weather factors, that similar ATMAP scores will result in comparable impacts on airport operations, although they are based on different weather events (such as high wind speeds or low visibility conditions).
The following definitions are used in the ATMAP algorithm: weather phenomenon is a single meteorological element which impacts the safety of aircraft during air and ground operations; weather class is a group of one or more weather phenomena affecting the airport performance; severity code is a ranking number of the weather class status (from best to worst); coefficient represents the assignment of a score to a given severity code in order to describe the nonlinear behaviour of various weather phenomena. The algorithm identifies five different weather classes with a significant influence on aircraft and airport operations: (1) ceiling and visibility; (2) wind; (3) precipitation; (4) freezing conditions; and (5) dangerous phenomena. In Table 3, these five different weather classes are shown, described with meteorological conditions, and linked to the associated maximum coefficient defined by the ATMAP-algorithm.
Compared to the other weather classes, dangerous phenomenon have a high particular impact on airport operations which results in the highest coefficients. For both cumulonimbus and towering cumulus clouds, the ATMAP coefficients are ranging from 3 to 10 (TCU) or from 4 to 12 (CB) depending on the cloud coverage (FEW, SCT, BKN, OVC). Showery precipitation and intensive precipitation can lead to a further increase of the coefficient values up to 18 or 24 for TCU as well as CB. Other dangerous phenomena with impact on the safety of aircraft operations can be divided into three groups: 30 points (heavy thunderstorm), 24 points (e.g., sandstorm, volcanic ash), and 18 points (small hail and/or snow pellets). In Table 4, two examples of METARs from Frankfurt Airport (EDDF) and Munich Airport (EDDM) are given to show the transformation from the METAR message to the ATMAP score.
The PRU proposes a multi-step procedure to determine the ATMAP weather score [37]: in a first step, the given METAR observation will be assessed by specifying the severity code and its associated coefficient for each weather class. In a first step, the METAR message is parsed, filtered, and transformed to a quantified measure (coefficient). In a second step, these weather class coefficients are summed up to the corresponding ATMAP score. Finally, for a given time interval (hours of operations), the sum of all ATMAP scores are divided by the number of METAR observations to calculate an average ATMAP score per time interval (e.g., per hour, per day). In this context, the ATMAP algorithm separates days of operations into good and bad weather days, using an average and airport-independent ATMAP value of 1.5 (default European score for bad weather days [37]). On the annual level, the proposed separation value of 1.5 seems not to be an appropriate measure to differentiate between these specific weather days. The analysis of annual ATMAP scores for selected European airports (year 2013) is outlined in Figure 2.
The annual ATMAP scores and the ratio of specific weather classes show significant differences between European airports. In particular, Munich airport (EDDM) and Oslo-Gardermoen airport (ENGM) are frequently affected by significant weather events (indicated by high ATMAP scores). Copenhagen (EKCH) or Schiphol (EHAM) are notably impacted by strong winds, while the airports of Zurich (LSZH) or Paris-Orly (LFPO) are less affected by unfavourable wind conditions.

3.2. Airport Performance
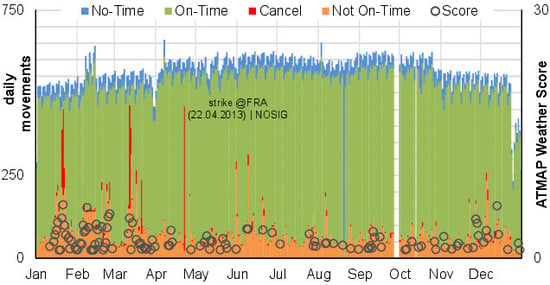
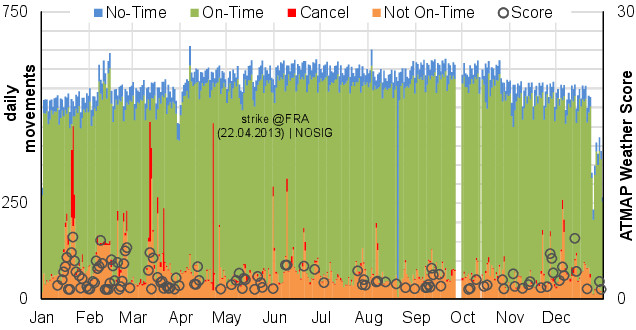
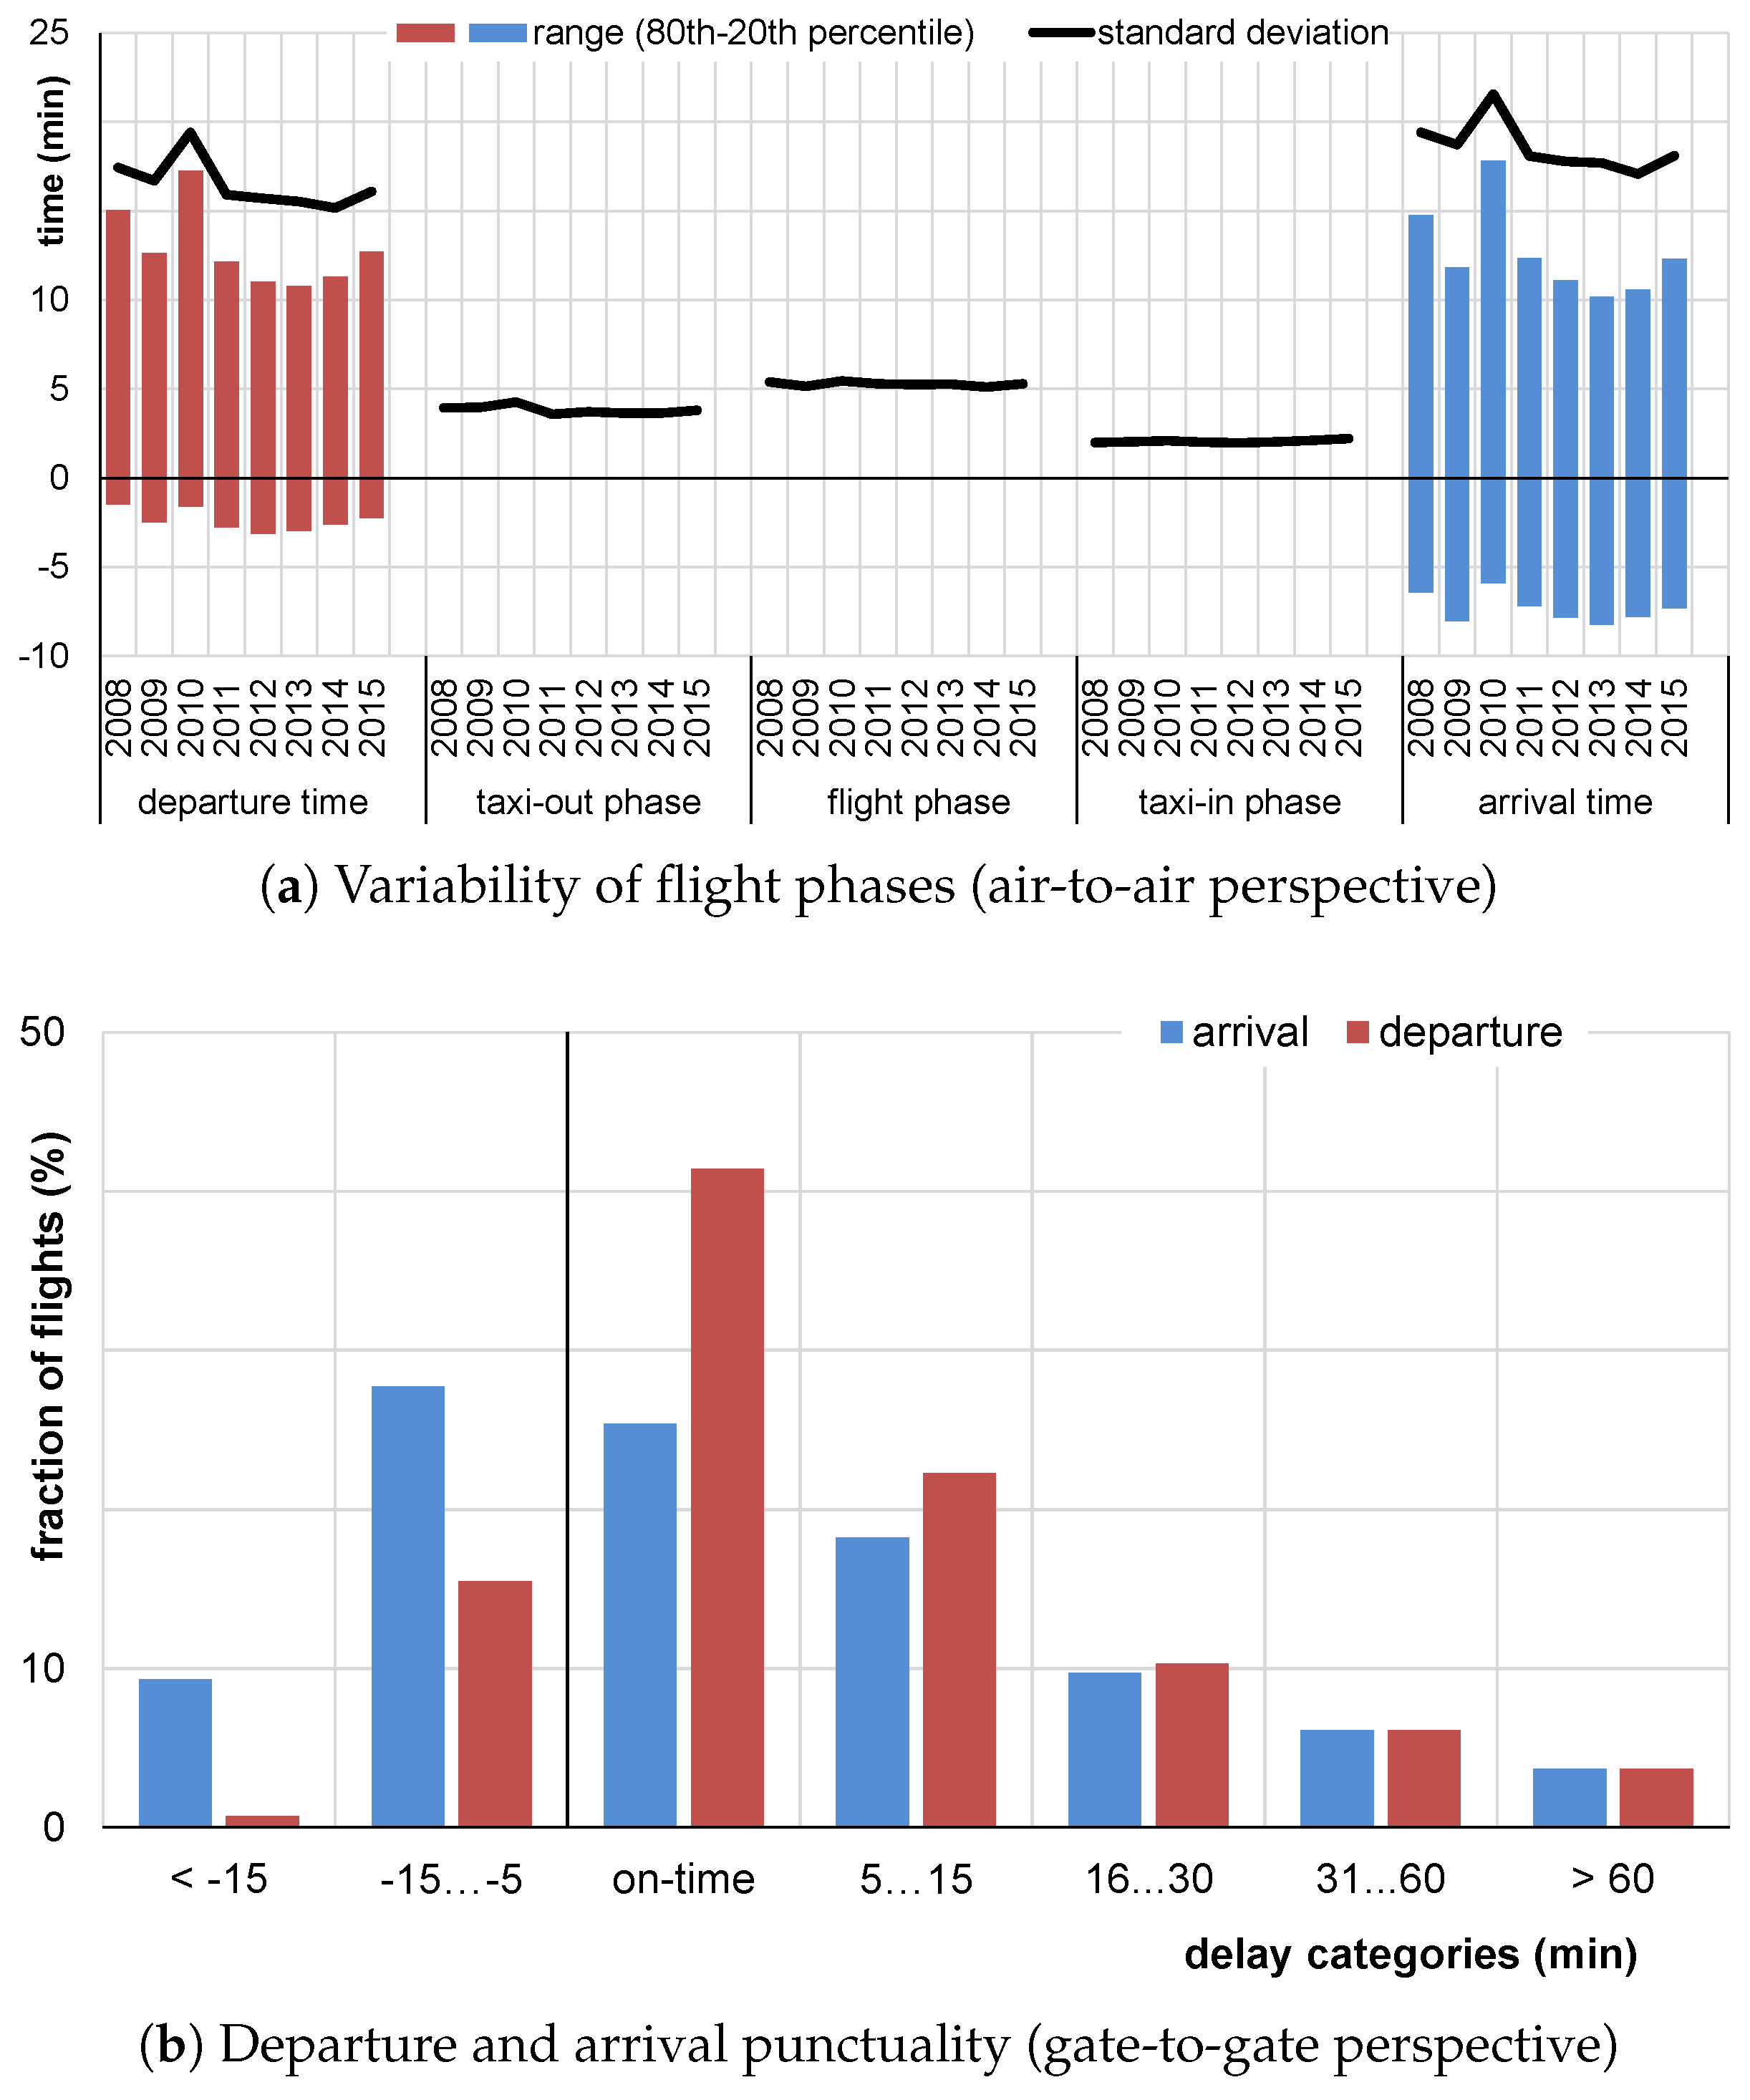
The performance of an airport is mainly related to the number of aircraft movements handled (airport capacity). In this case, the term capacity generally refers to the ability of a given transportation facility to accommodate a traffic volume (e.g., movements) in a given time period (e.g., on hourly, daily, or yearly basis). If the air traffic demand approaches or exceeds the given airport capacity, the congestion of provided infrastructure increases which results in delays and cancellations. This demand–capacity imbalance is a key cause of unpunctual operations and affects different components of the whole airport system on both airside (e.g., runways, taxiways, aprons) and landside (e.g., passenger handling [40,41]). Results of a data analysis from Frankfurt airport show that more than 45% of the variability in daily punctuality are related to local weather impacts [42].

3.2.1. Delay

Flight delays expressed in minutes are defined as the difference between the scheduled and actual times of arrivals and departures. Reference points for flights are usually their on- and off-block times. Punctuality is determined as the proportion of flights delayed less than 15 min, an internationally accepted performance indicator in air traffic. To anticipate the delay in phases of high traffic demand (peak times), airlines apply buffer strategies, to improve punctuality and mitigate tactical delay costs [1,25]. The definition of delay can vary according to the stakeholder so that a lot of terms and definitions have been established, such as acceptable delay, network delay, on-time performance, reactionary delays, delays per flight-gate to gate, arrival delays, departure delays, surface taxiing delays, and passenger delay minutes (cf. [40]).

3.2.2. Cancellations

From a passengers’ point of view, disrupted situations (irregularities) in air traffic comprise various kinds of disorders such as delays, cancellations, diverted flights to alternate airports, or missed connections. Thus, we consider the number of cancelled flights per day also as a prominent impact of weather. The analysis of other types of incidents (e.g., diverted flights or missed connections) is omitted since, at this stage, the information cannot be gained from the recorded data.

4. Airport View

Frankfurt Airport (EDDF) is selected as an example airport to gain a more specific insight into the dependencies between airport performance and local weather events. The analysis of the air traffic movements in 2013 results in an appropriate aggregated set of correlation measures between weather (quantified with ATMAP algorithm) and arrival/departure performance at the airport (measured in deviation from schedule). In Figure 3, the yearly air traffic is aggregated to a 24 h time scale.
The available data sample of EDDF covers about 440,000 flights (472,692 flights operated in 2013 [38]) and will be used to provide a qualitative correlation between weather and airport performance. In Figure 3, the daily values for the ATMAP score (if greater than 1.5) and the corresponding measurements for the airport performance are shown. The not on-time value covers all movements with a delay greater than 15 min. The figure clearly emphasizes that a higher rate of cancellations or delayed flights comes with a higher value of the ATMAP score, as expected. Further on, the number of no-time values is nearly constant over the year, and at four days no data could be recorded.

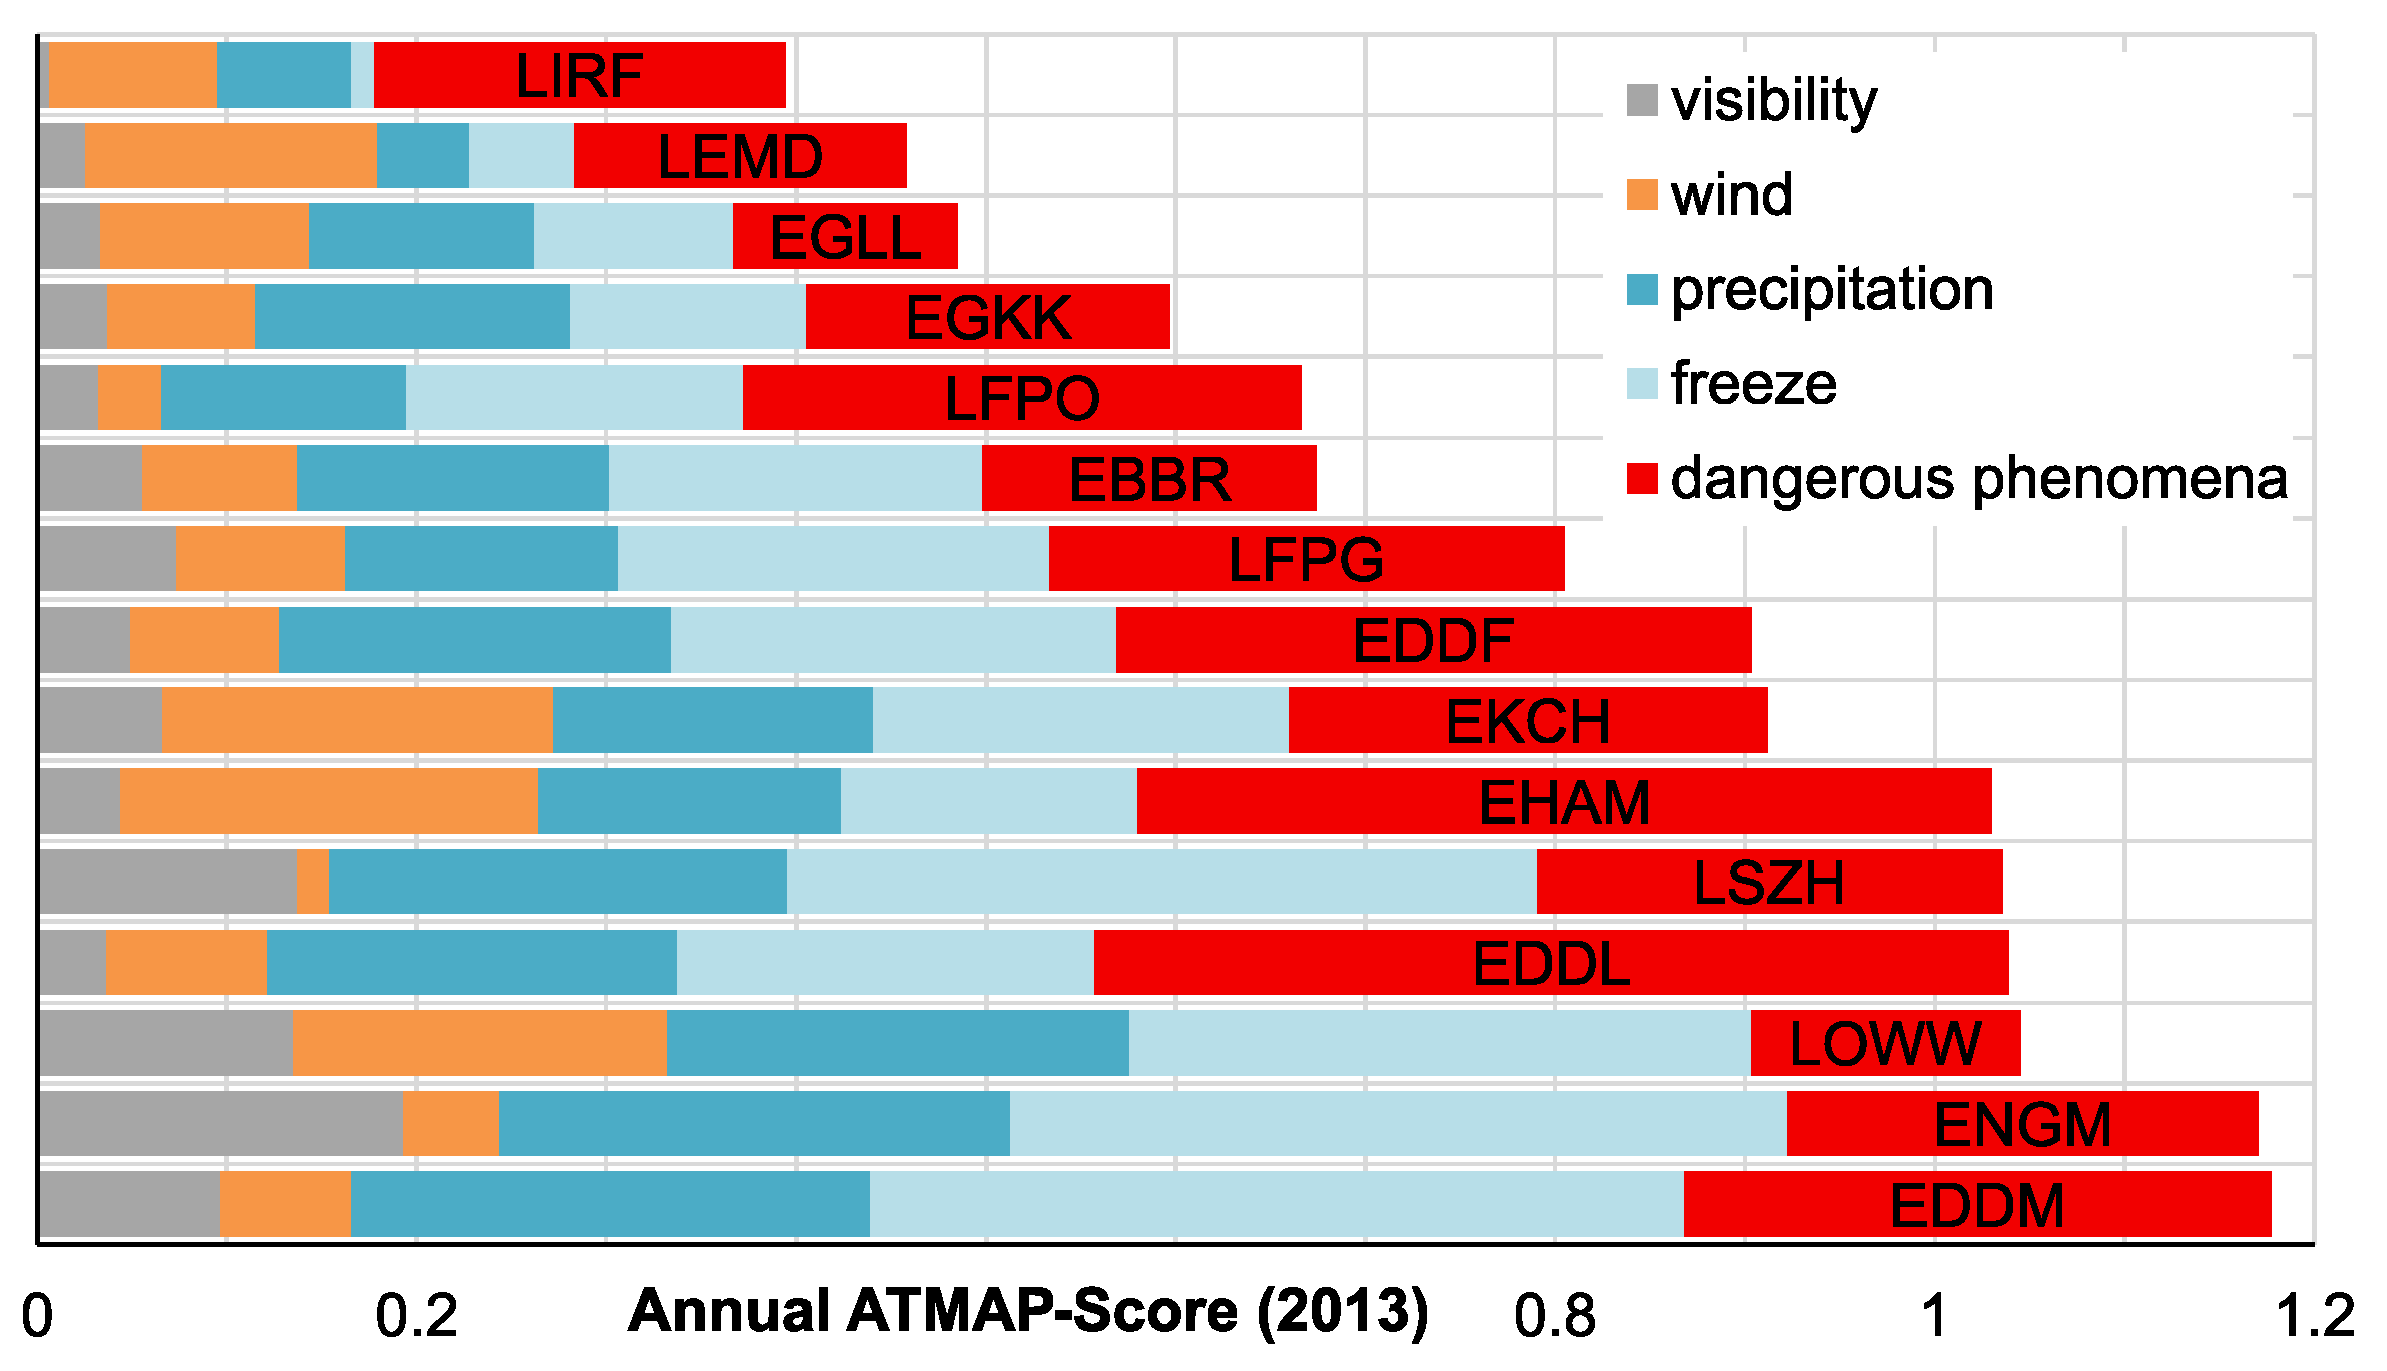
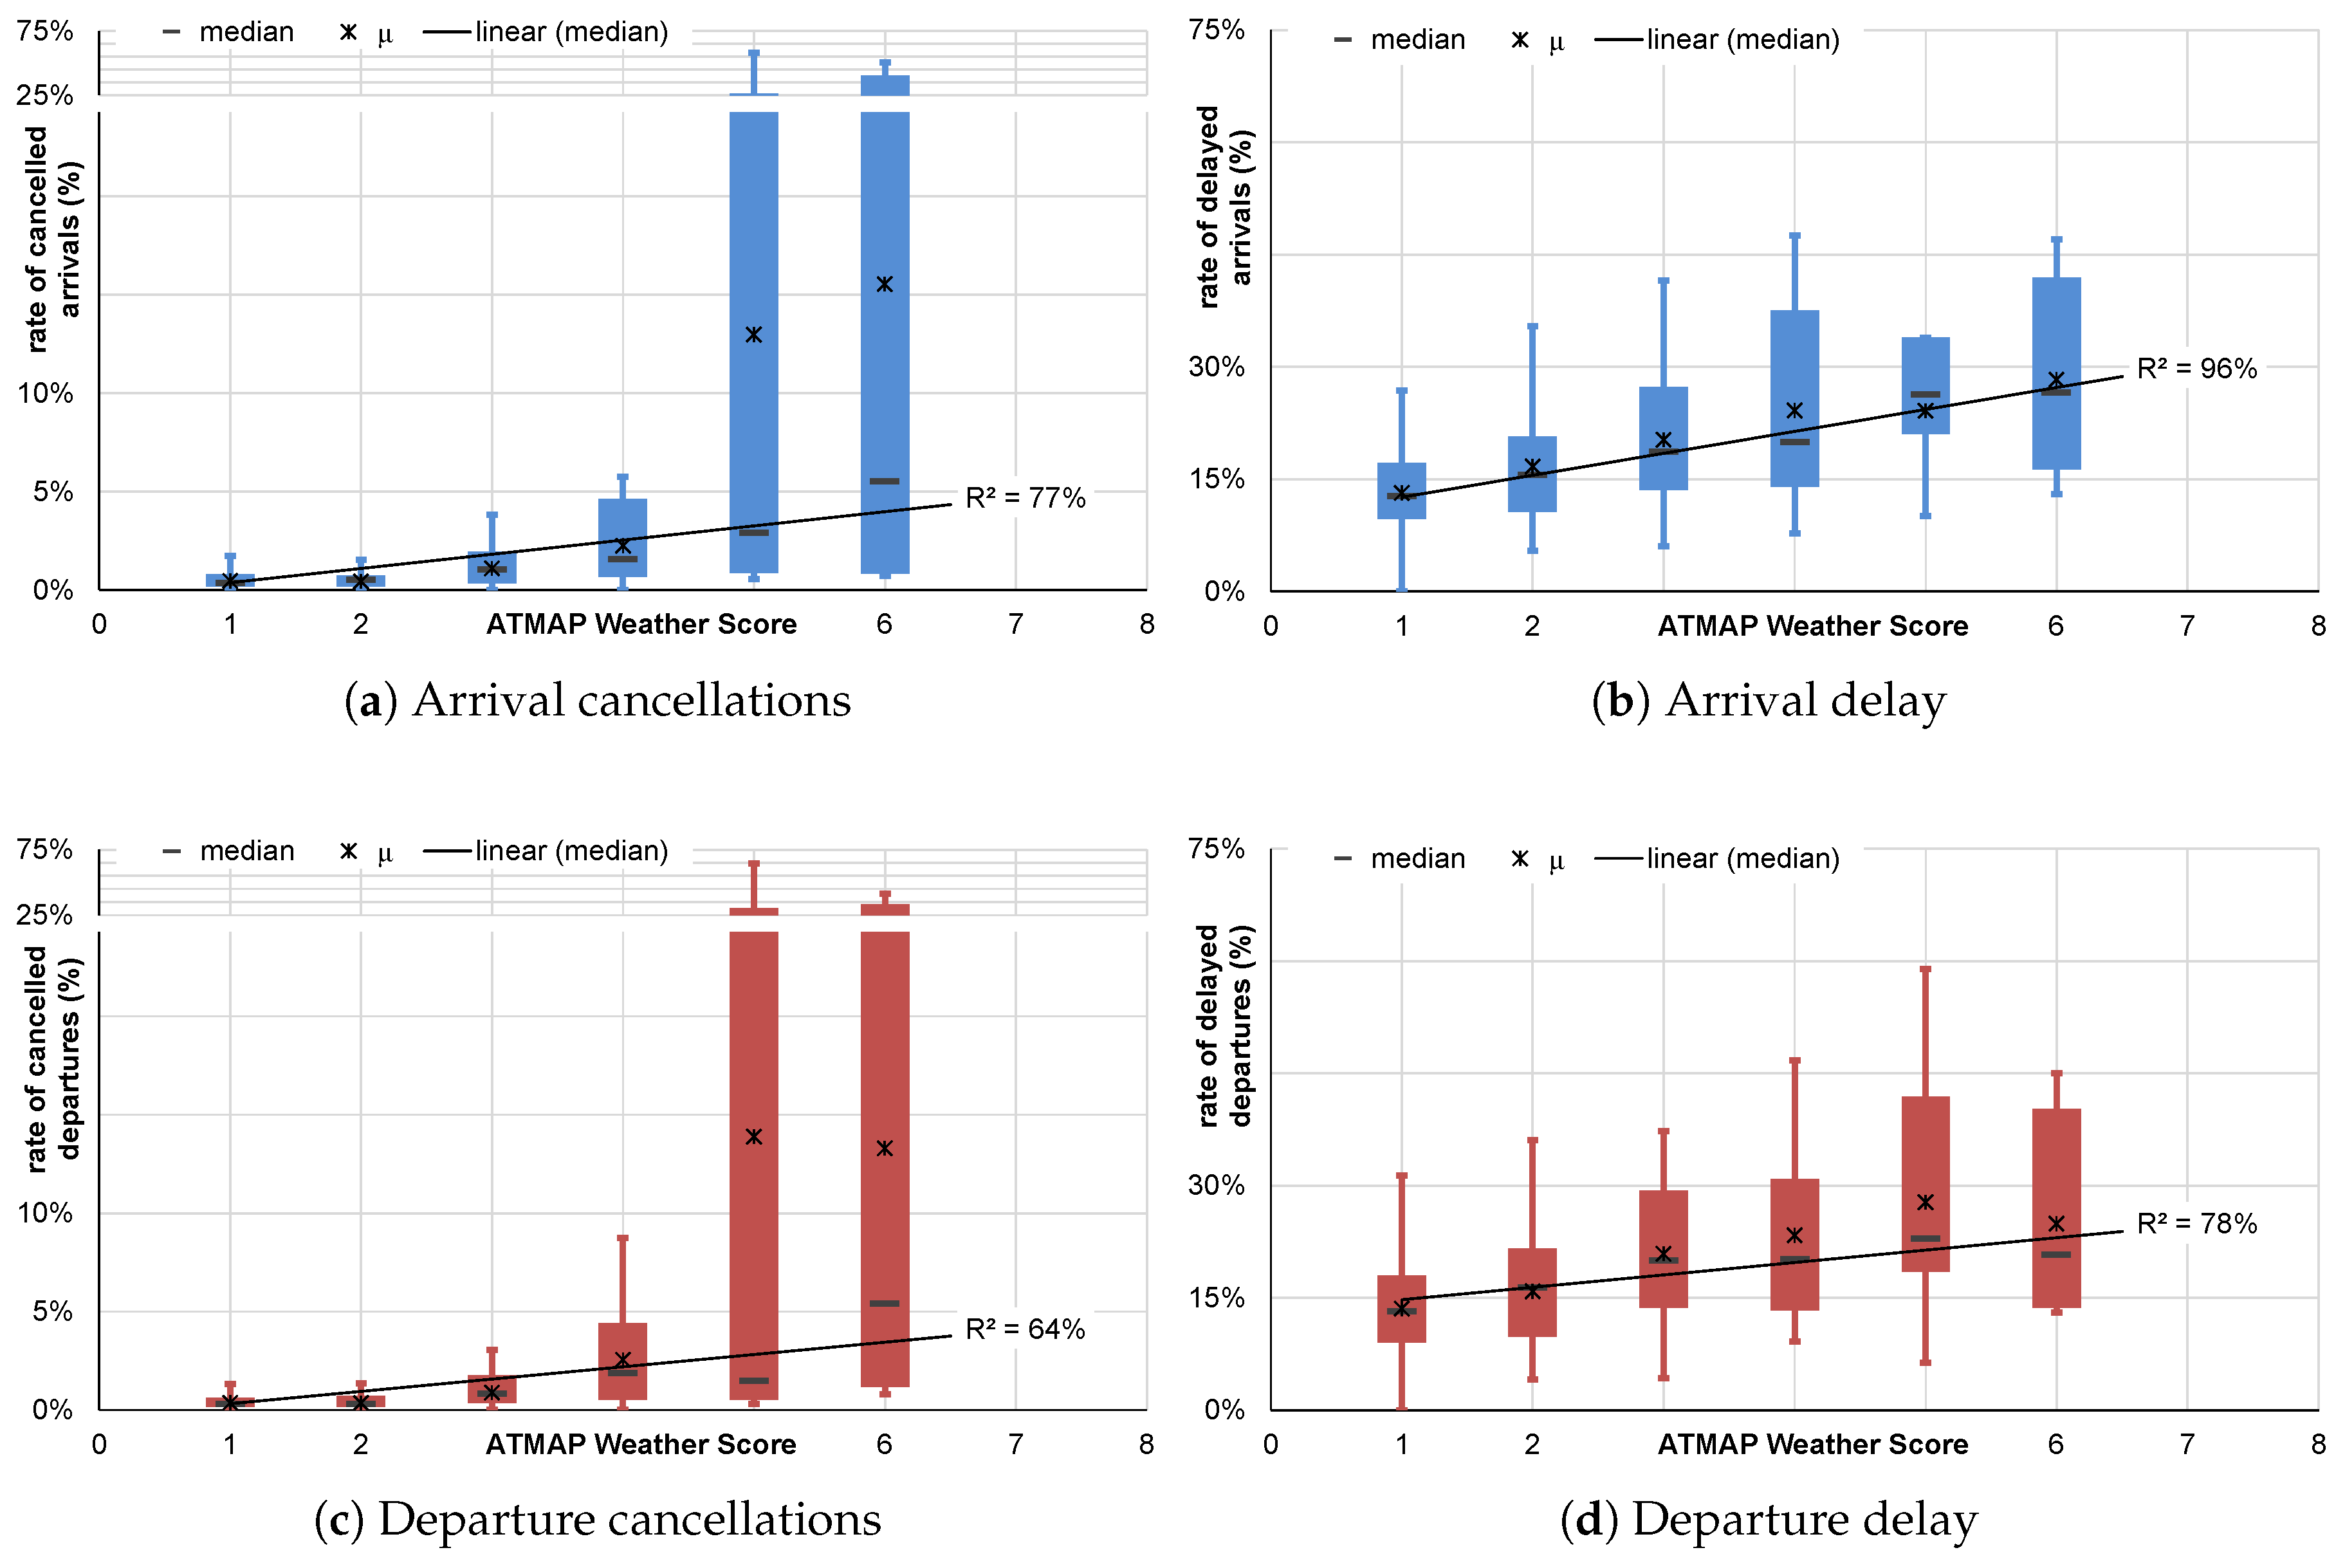
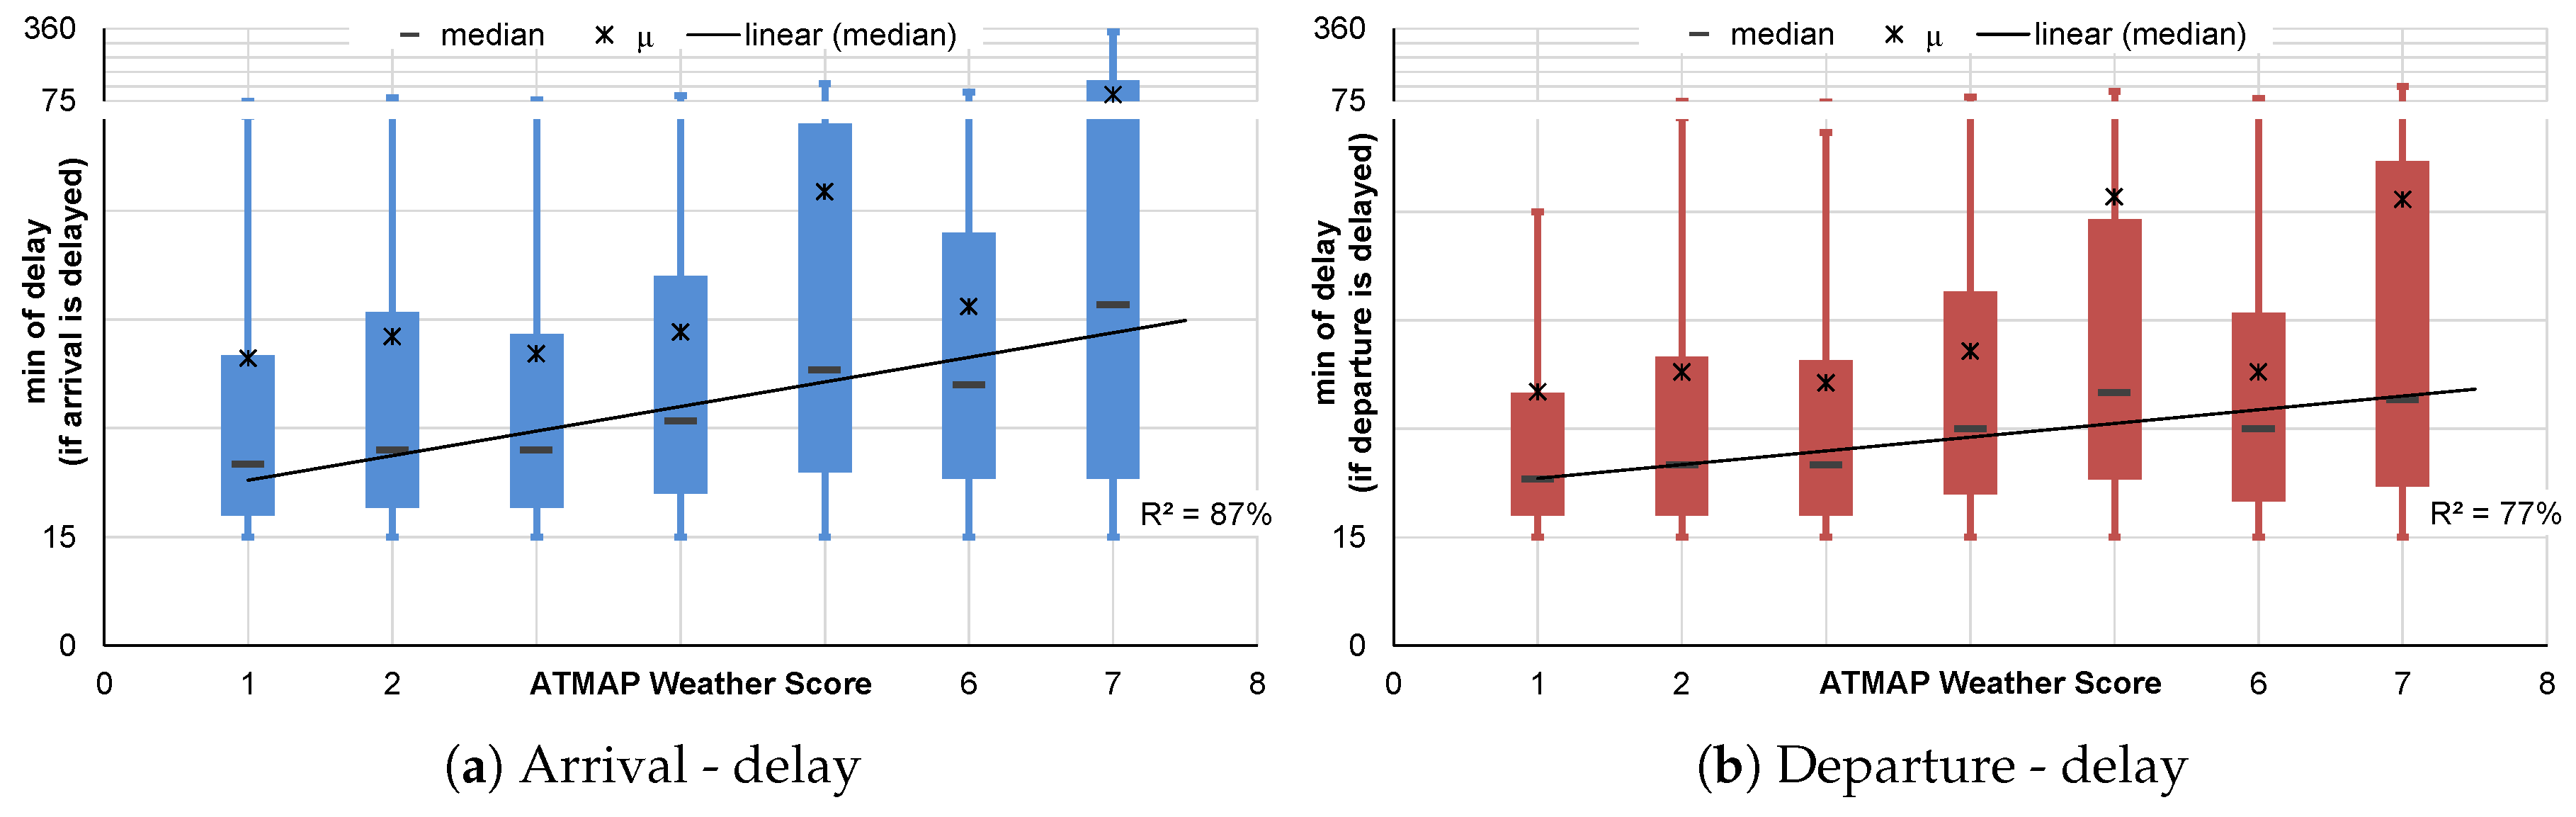
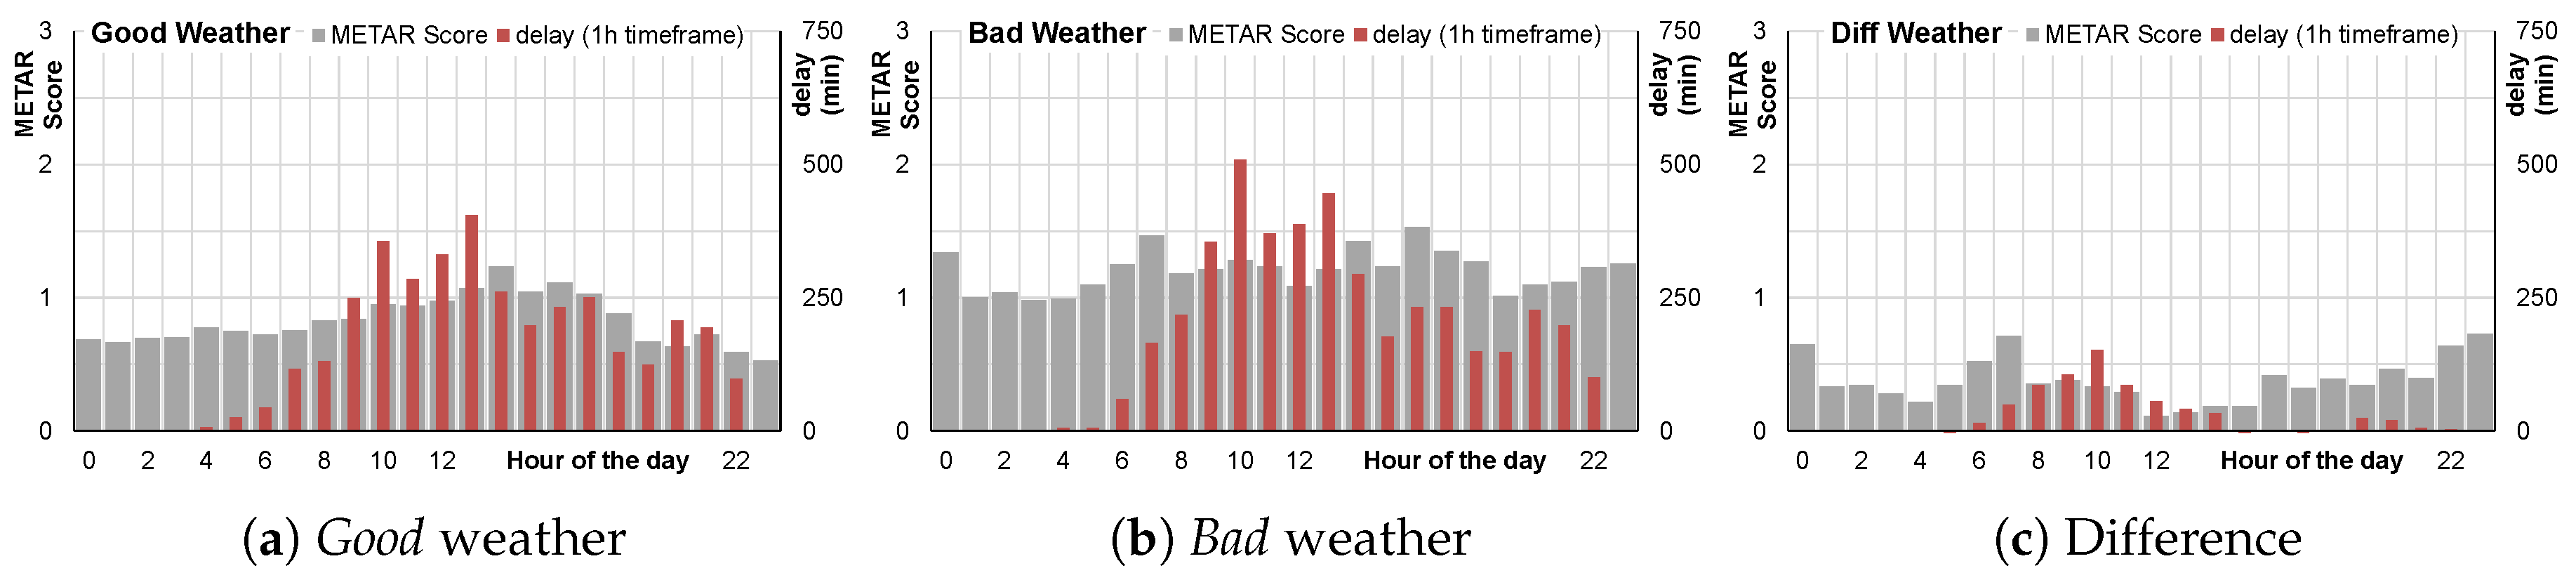
4.1. Correlation of Weather and Performance

A more detailed analysis pointed out a significant correlation against a linear fit of ATMAP weather score and proportion of both rate of cancellations and delayed flights. In Figure 4, the ATMAP weather score and the corresponding ratios are shown, using the average values ( μ ) per category and a box–whisker representation (box plot). The box–whisker plot uses the 25% and 75% quantiles as lower and upper boundaries for the box, the whiskers indicate minimum and maximum values inside an interquartile range of 1.5 as a measure of statistical dispersion. This descriptive statistical approach allows to identify outliers in the underlying data set. Furthermore, the median (50% quantile) will be used as the corresponding measure of central tendency.
The analysis of the rate of cancellations and delayed flights is based on a daily aggregated data set with 361 values. For each day, the average ATMAP weather score is calculated and the corresponding rates for cancellations and delayed flights are stored accordingly. Weather events with a high ATMAP weather scores (greater than 4) are rare during 2013, so only 3% of the days have an ATMAP score of 5 and 2% a score of 6 and greater. Furthermore, on these particular days, the specific weather conditions impact the airport system differently (see Table 5), which result in a high deviation of operational figures (such as cancellations rates). Thus, on 27 November 2013, the ATMAP score consists of significant visibility constraints and freezing conditions, but the cancellations rates are low (2%). With nearly the same ATMAP score, but a combination of high precipitation and high freezing coefficient, Frankfurt airport had to be closed for several hours on 12 March 2013 (cancellations rates >50%). This example shows that the coefficients of the ATMAP should not be considered as fully independent.
As expected, the relative number of flights affected by delays and cancellations increases with a higher ATMAP weather score. Additionally, severe weather conditions will also result in network-wide effects. In Figure 4, a linear correlation between the rate of cancellations and rate of delayed flights is assumed for both arrival and departure. In the case of the proposed linear regression, the coefficient of determination (R2) reaches high values between 64% (departure cancellations) and 96% (arrival delay), when the median is used as reference value. The mean ( μ ) value is inappropriate for the linear regression, since the high deviations and low numbers of occurrence result in a shift to higher values.
Besides the rate of cancelled and delayed flights, Figure 5 points out a strong correlation between the ATMAP weather score and a quantified delay measure (using a linear regression). If the daily weather score increases by 1, the average delay (by means of median) increases by 3.39 min for arrivals and by 1.89 min for departures. The linear correlation results in R 2 = 87% for arrivals and R 2 = 77% for departures. Furthermore, the results depicted in Figure 5 confirm the ability of airport ground operations to absorb arrival delays (lower median and variation values) [43].

4.2. Classification of Weather Effects

To derive significant weather conditions of a given time interval, an average picture of each operational hour is created (see Figure 6). This picture allows for differentiating between the two classifications of good and bad weather days. The classical hub constellation is emphasized by Figure 6 too, with incoming/out-going continental, intercontinental, and feeder flights to/from Frankfurt airport. The resulting, aggregated delay minutes over the day also depend on the number of aircraft movements and traffic mix (ratio of heavy, medium, and light aircraft). Furthermore, Figure 6 demonstrates a typical delay characteristic with an increasing delay before noon and a decreasing delay in the afternoon (depending on the specific traffic pattern). In addition, a time-shift between the weather event and the operational impact could be recognized in this aggregated view.
As Figure 7 demonstrates, if the proposed value in [37] of 1.5 is used as a threshold between good and bad weather, the difference between these two classes is not very prominent and could be hard to be distinguished from the average day of operation (Figure 6). Therefore, a new value to separate the two classes of weather has been derived from the data set. To derive this more appropriate separation value, all days are put into one data pool and both the average maximum delay per hour and the average sum of delay over the whole day are calculated. Then, daily data sets are stepwise removed from the pool with an increasing ATMAP score.
Figure 8 exhibits that the deletion of days with a low ATMAP score results in an increase of both average values of delay in the data pool of the remaining values. At an ATMAP score of 2.7, the average sum of delay over the whole day and the average value for the maximum delay reach the highest values. In this case, 34 days of operations remain in the data pool and will be categorized as relevant bad weather days and the days that were stepwise deleted from the pool are categorized as good weather days. If the separation value is increased to an ATMAP weather score of 2.8, the average delay values decreases, which means that days with a significant delay characteristic will not be contributing to the bad weather category.
In Figure 9, the new separation value of 2.7 is applied to the Frankfurt airport data set. As expected, the new separation value of 2.7 provides a more appropriate differentiation between the two weather categories and its impact on flight operations. This result will be taken as a future research task, with the recommendation to provide an update of the ATMAP algorithm.

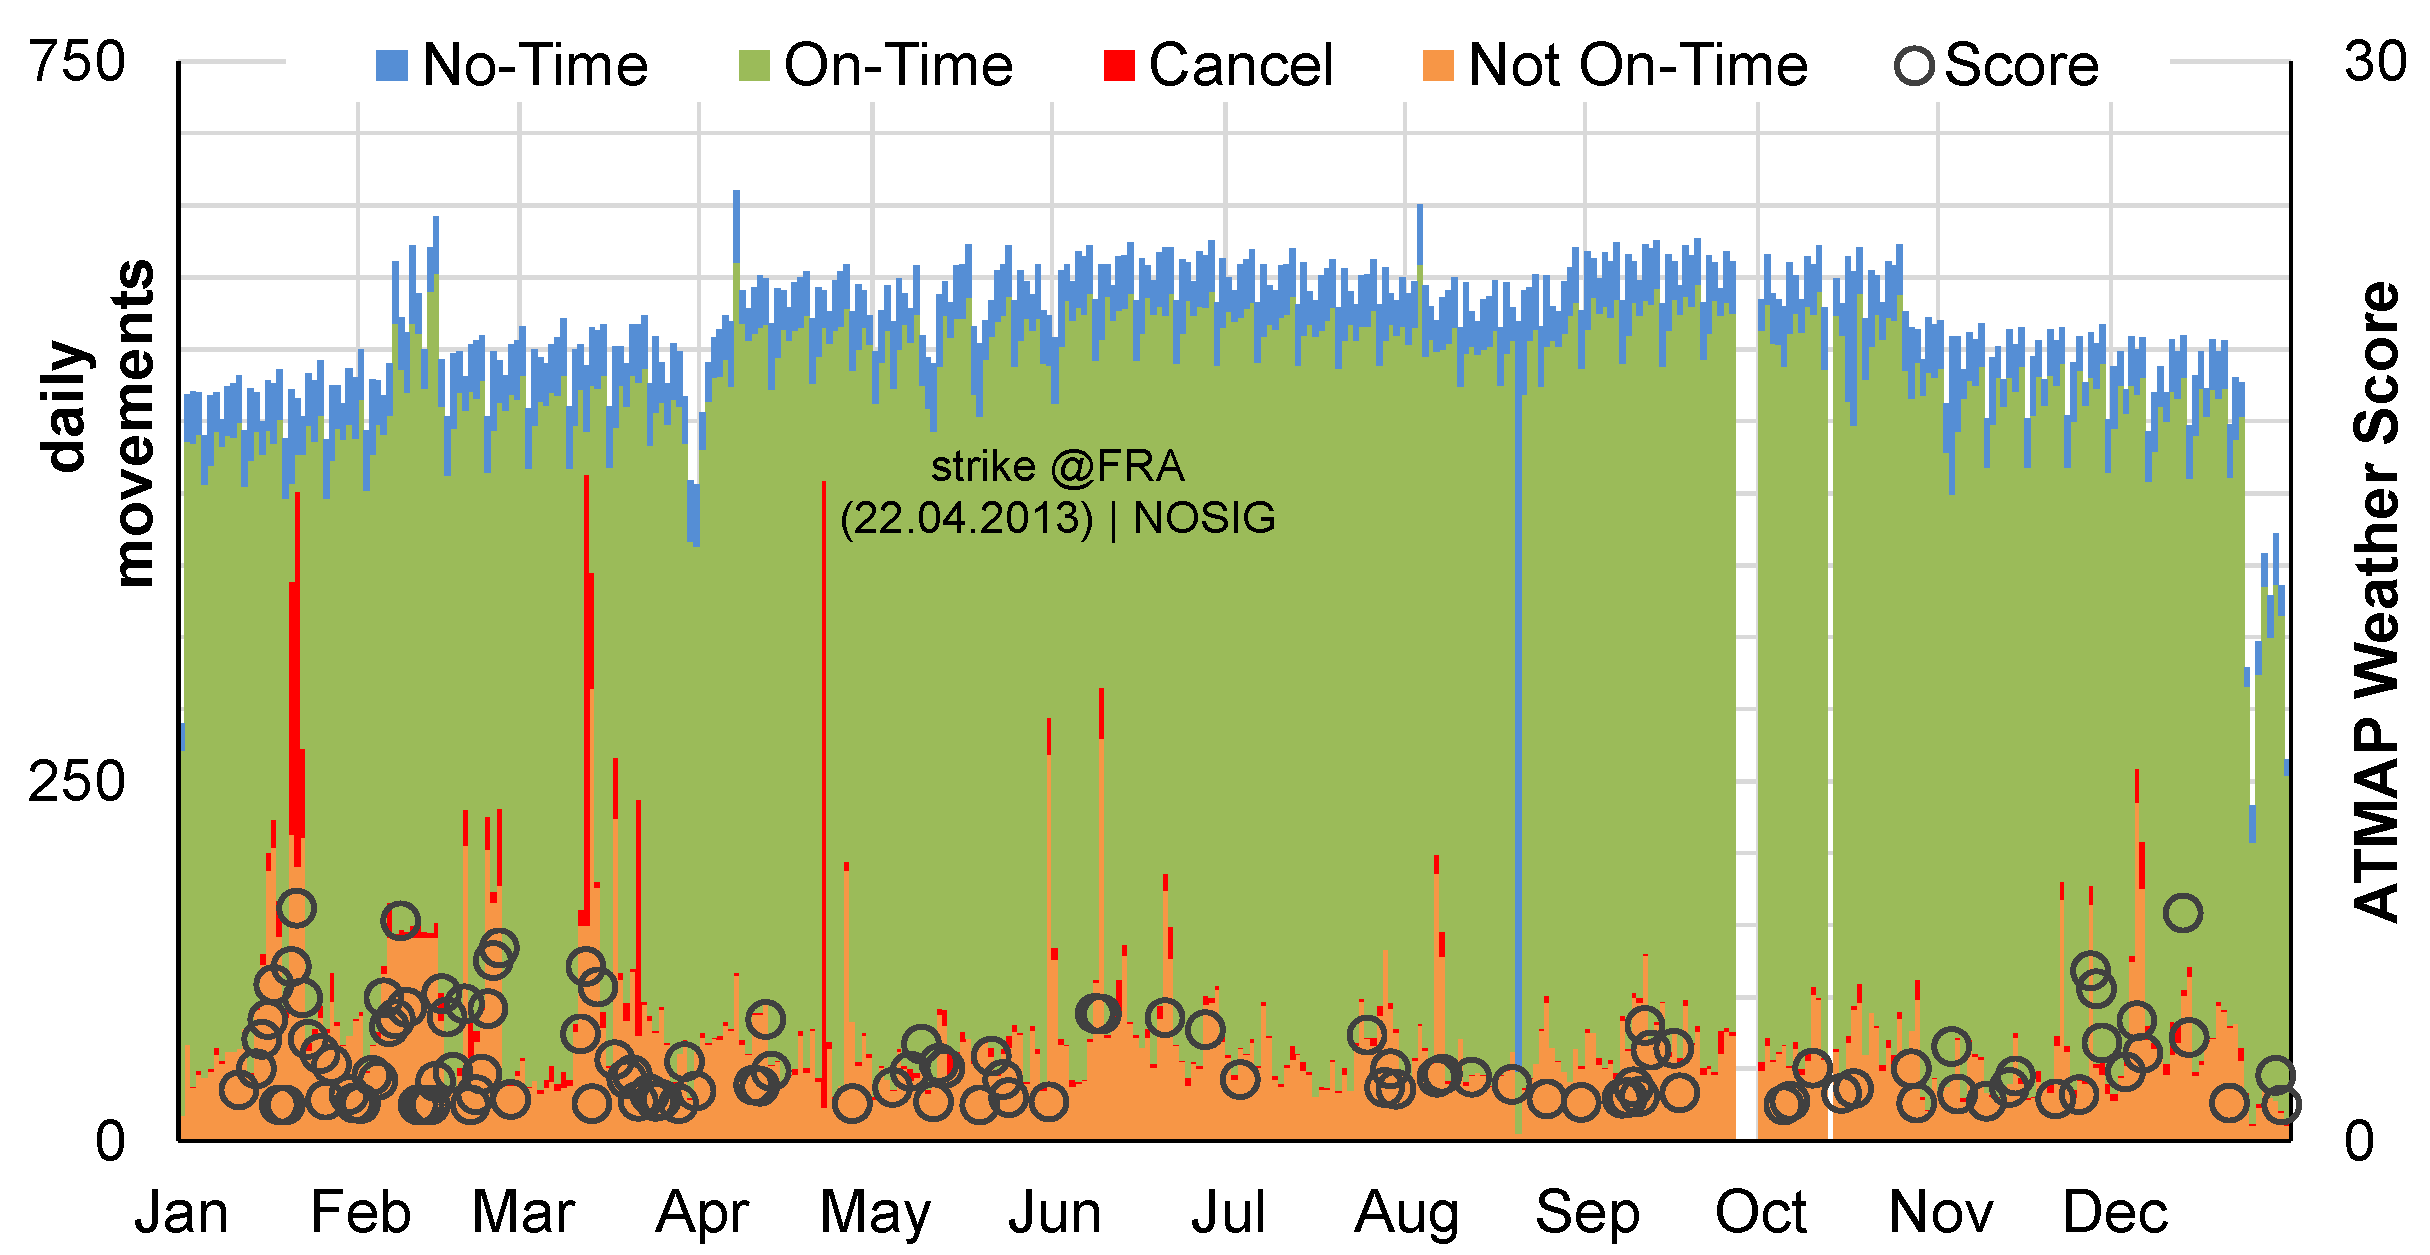
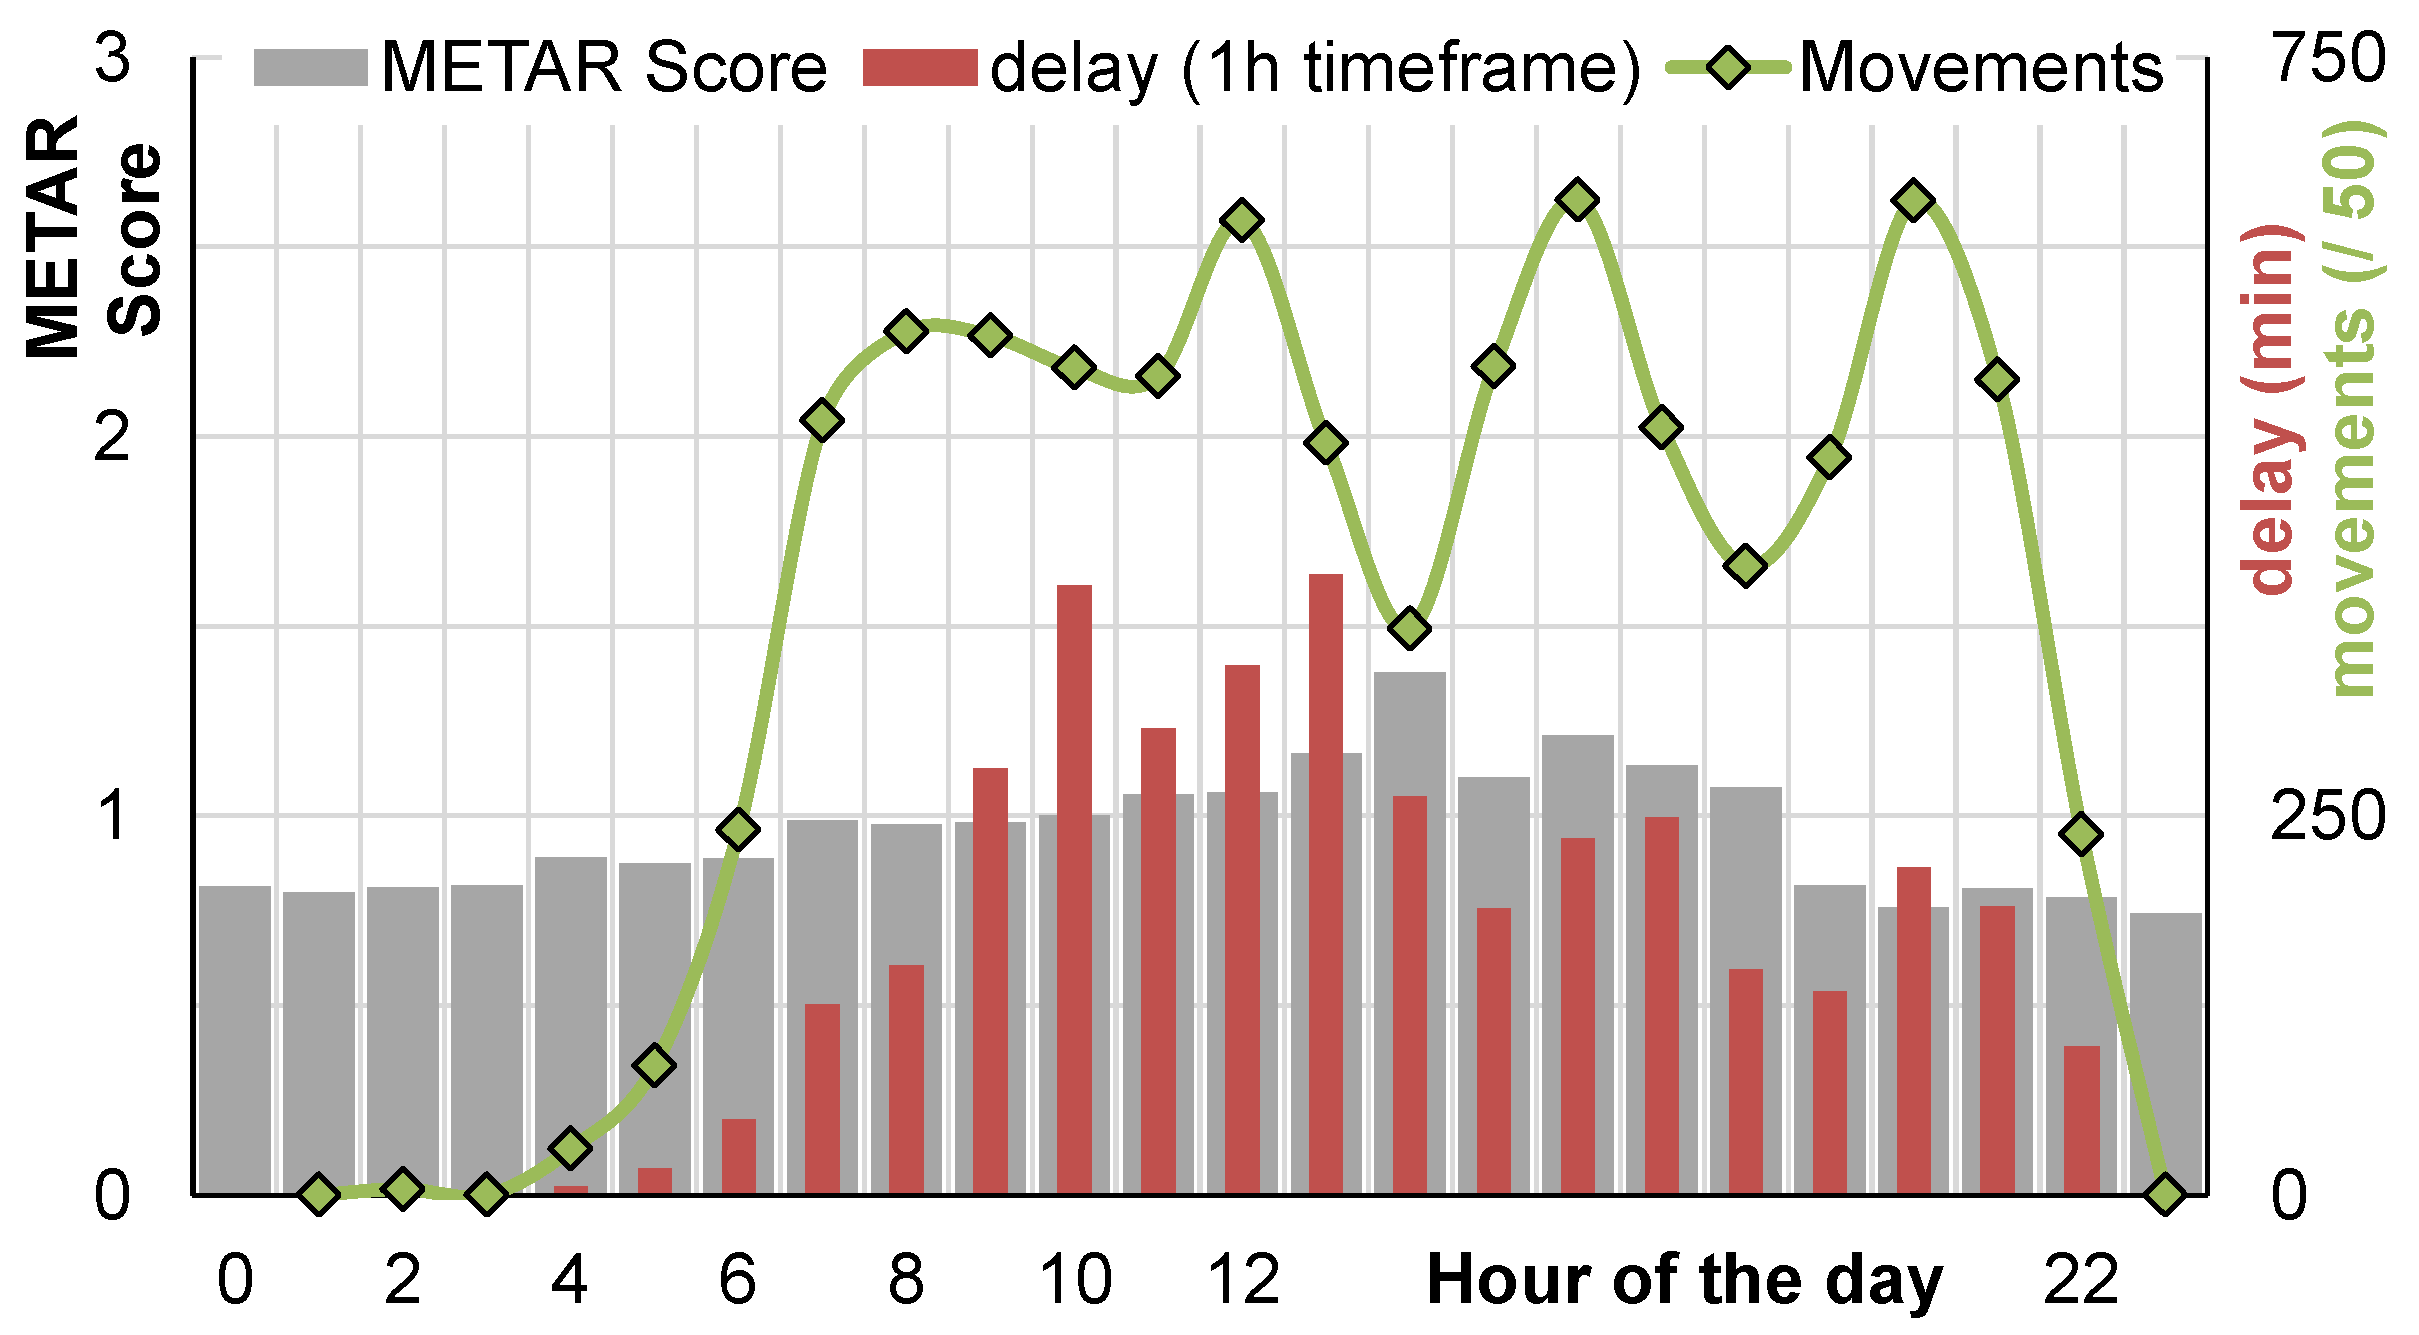
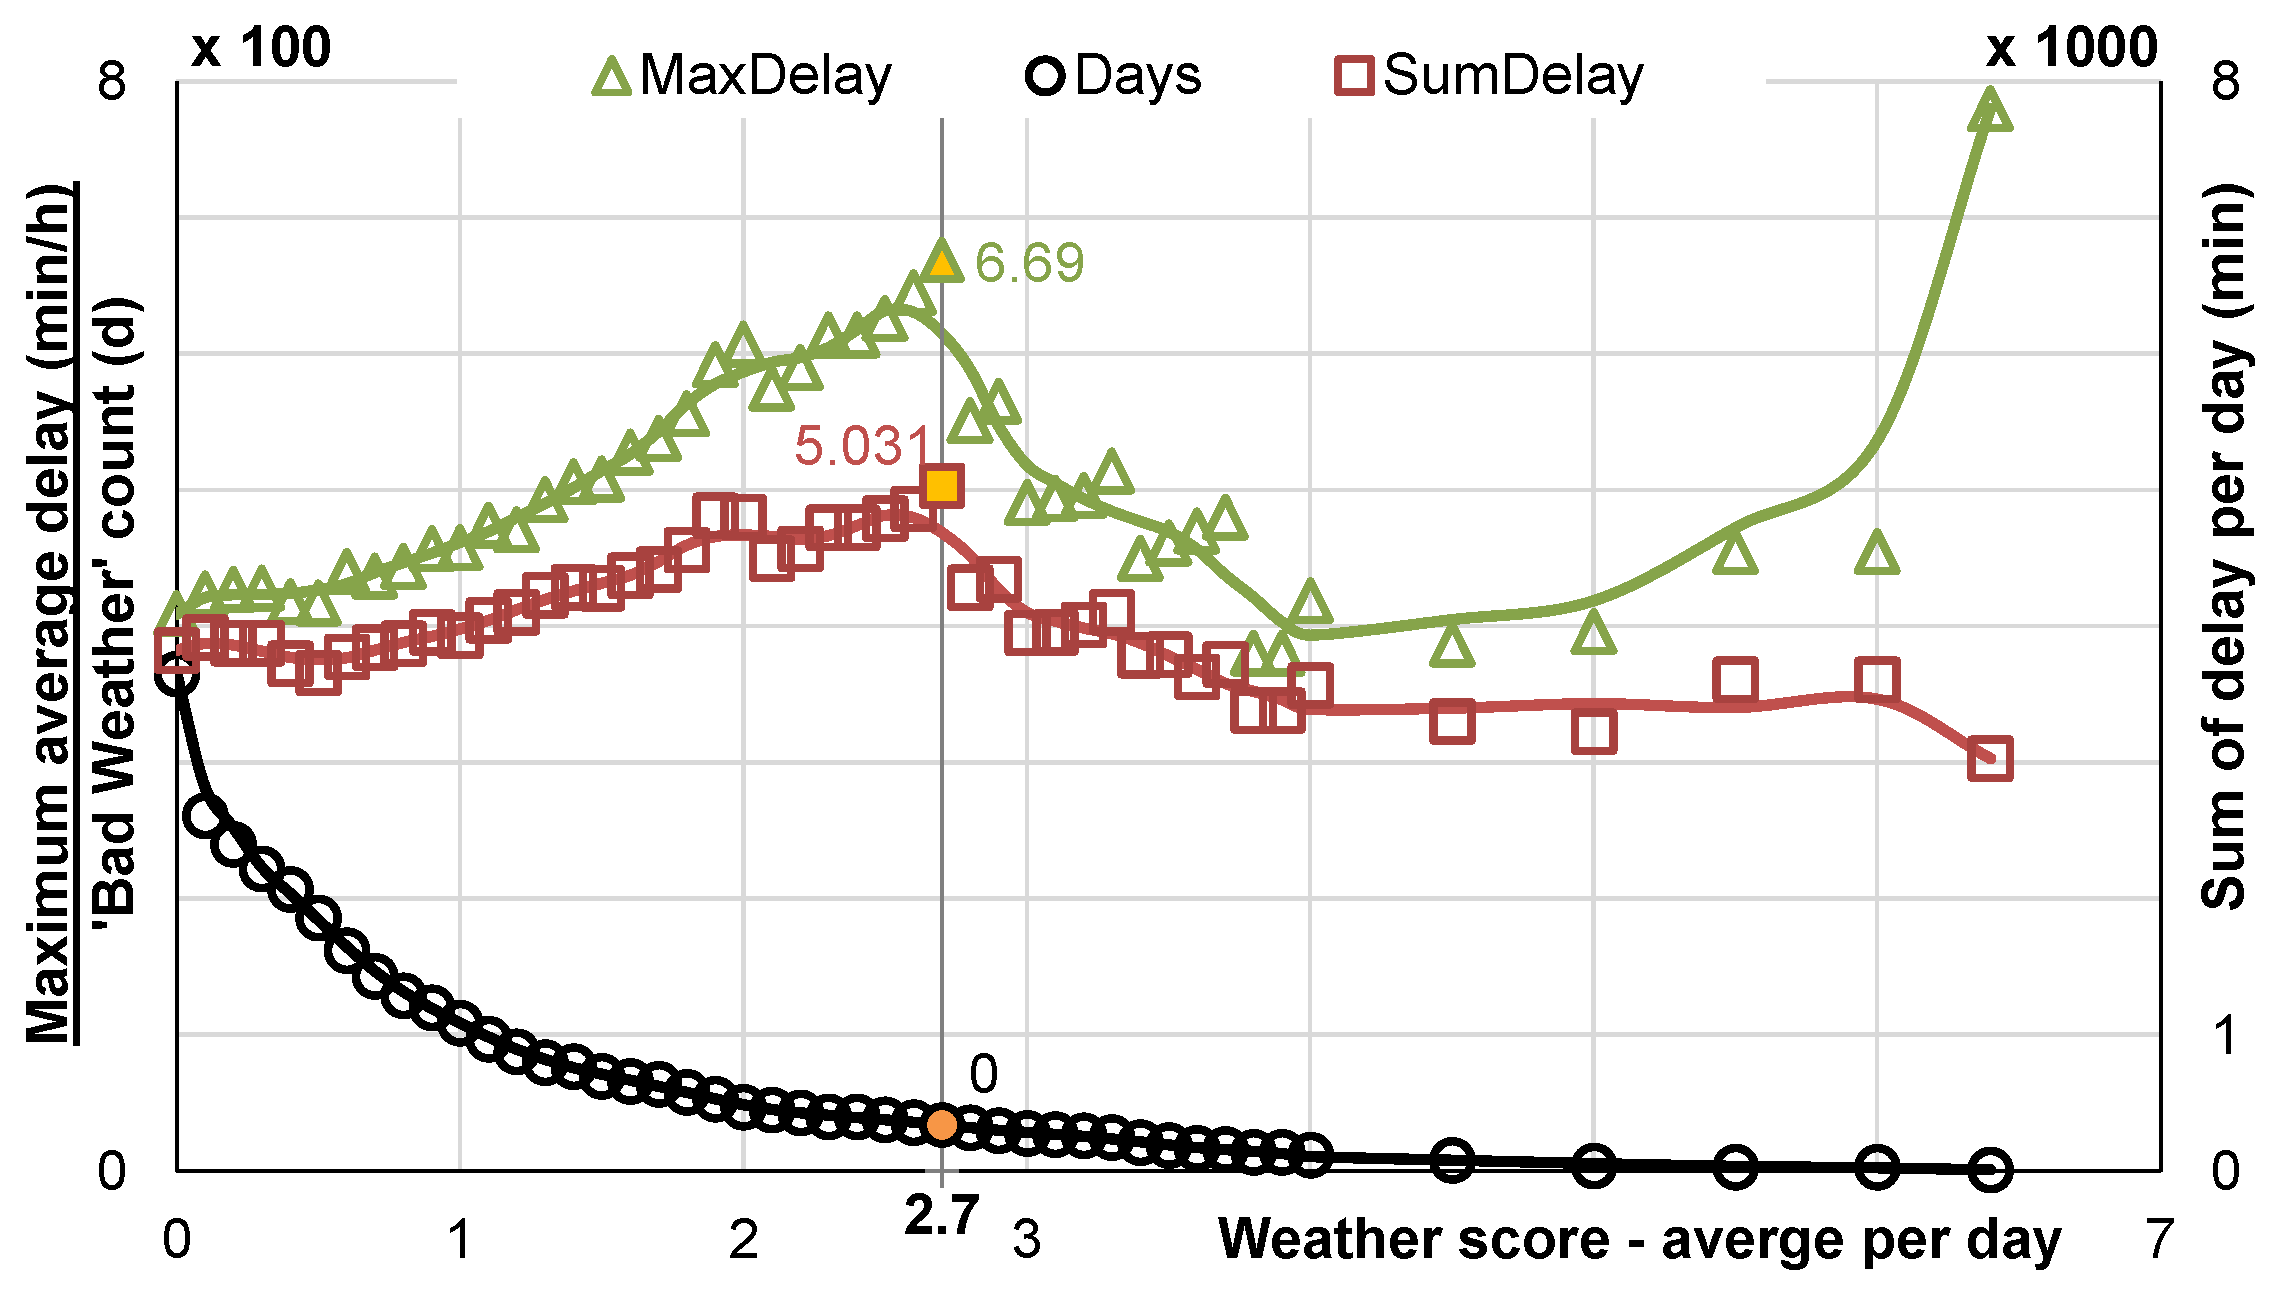
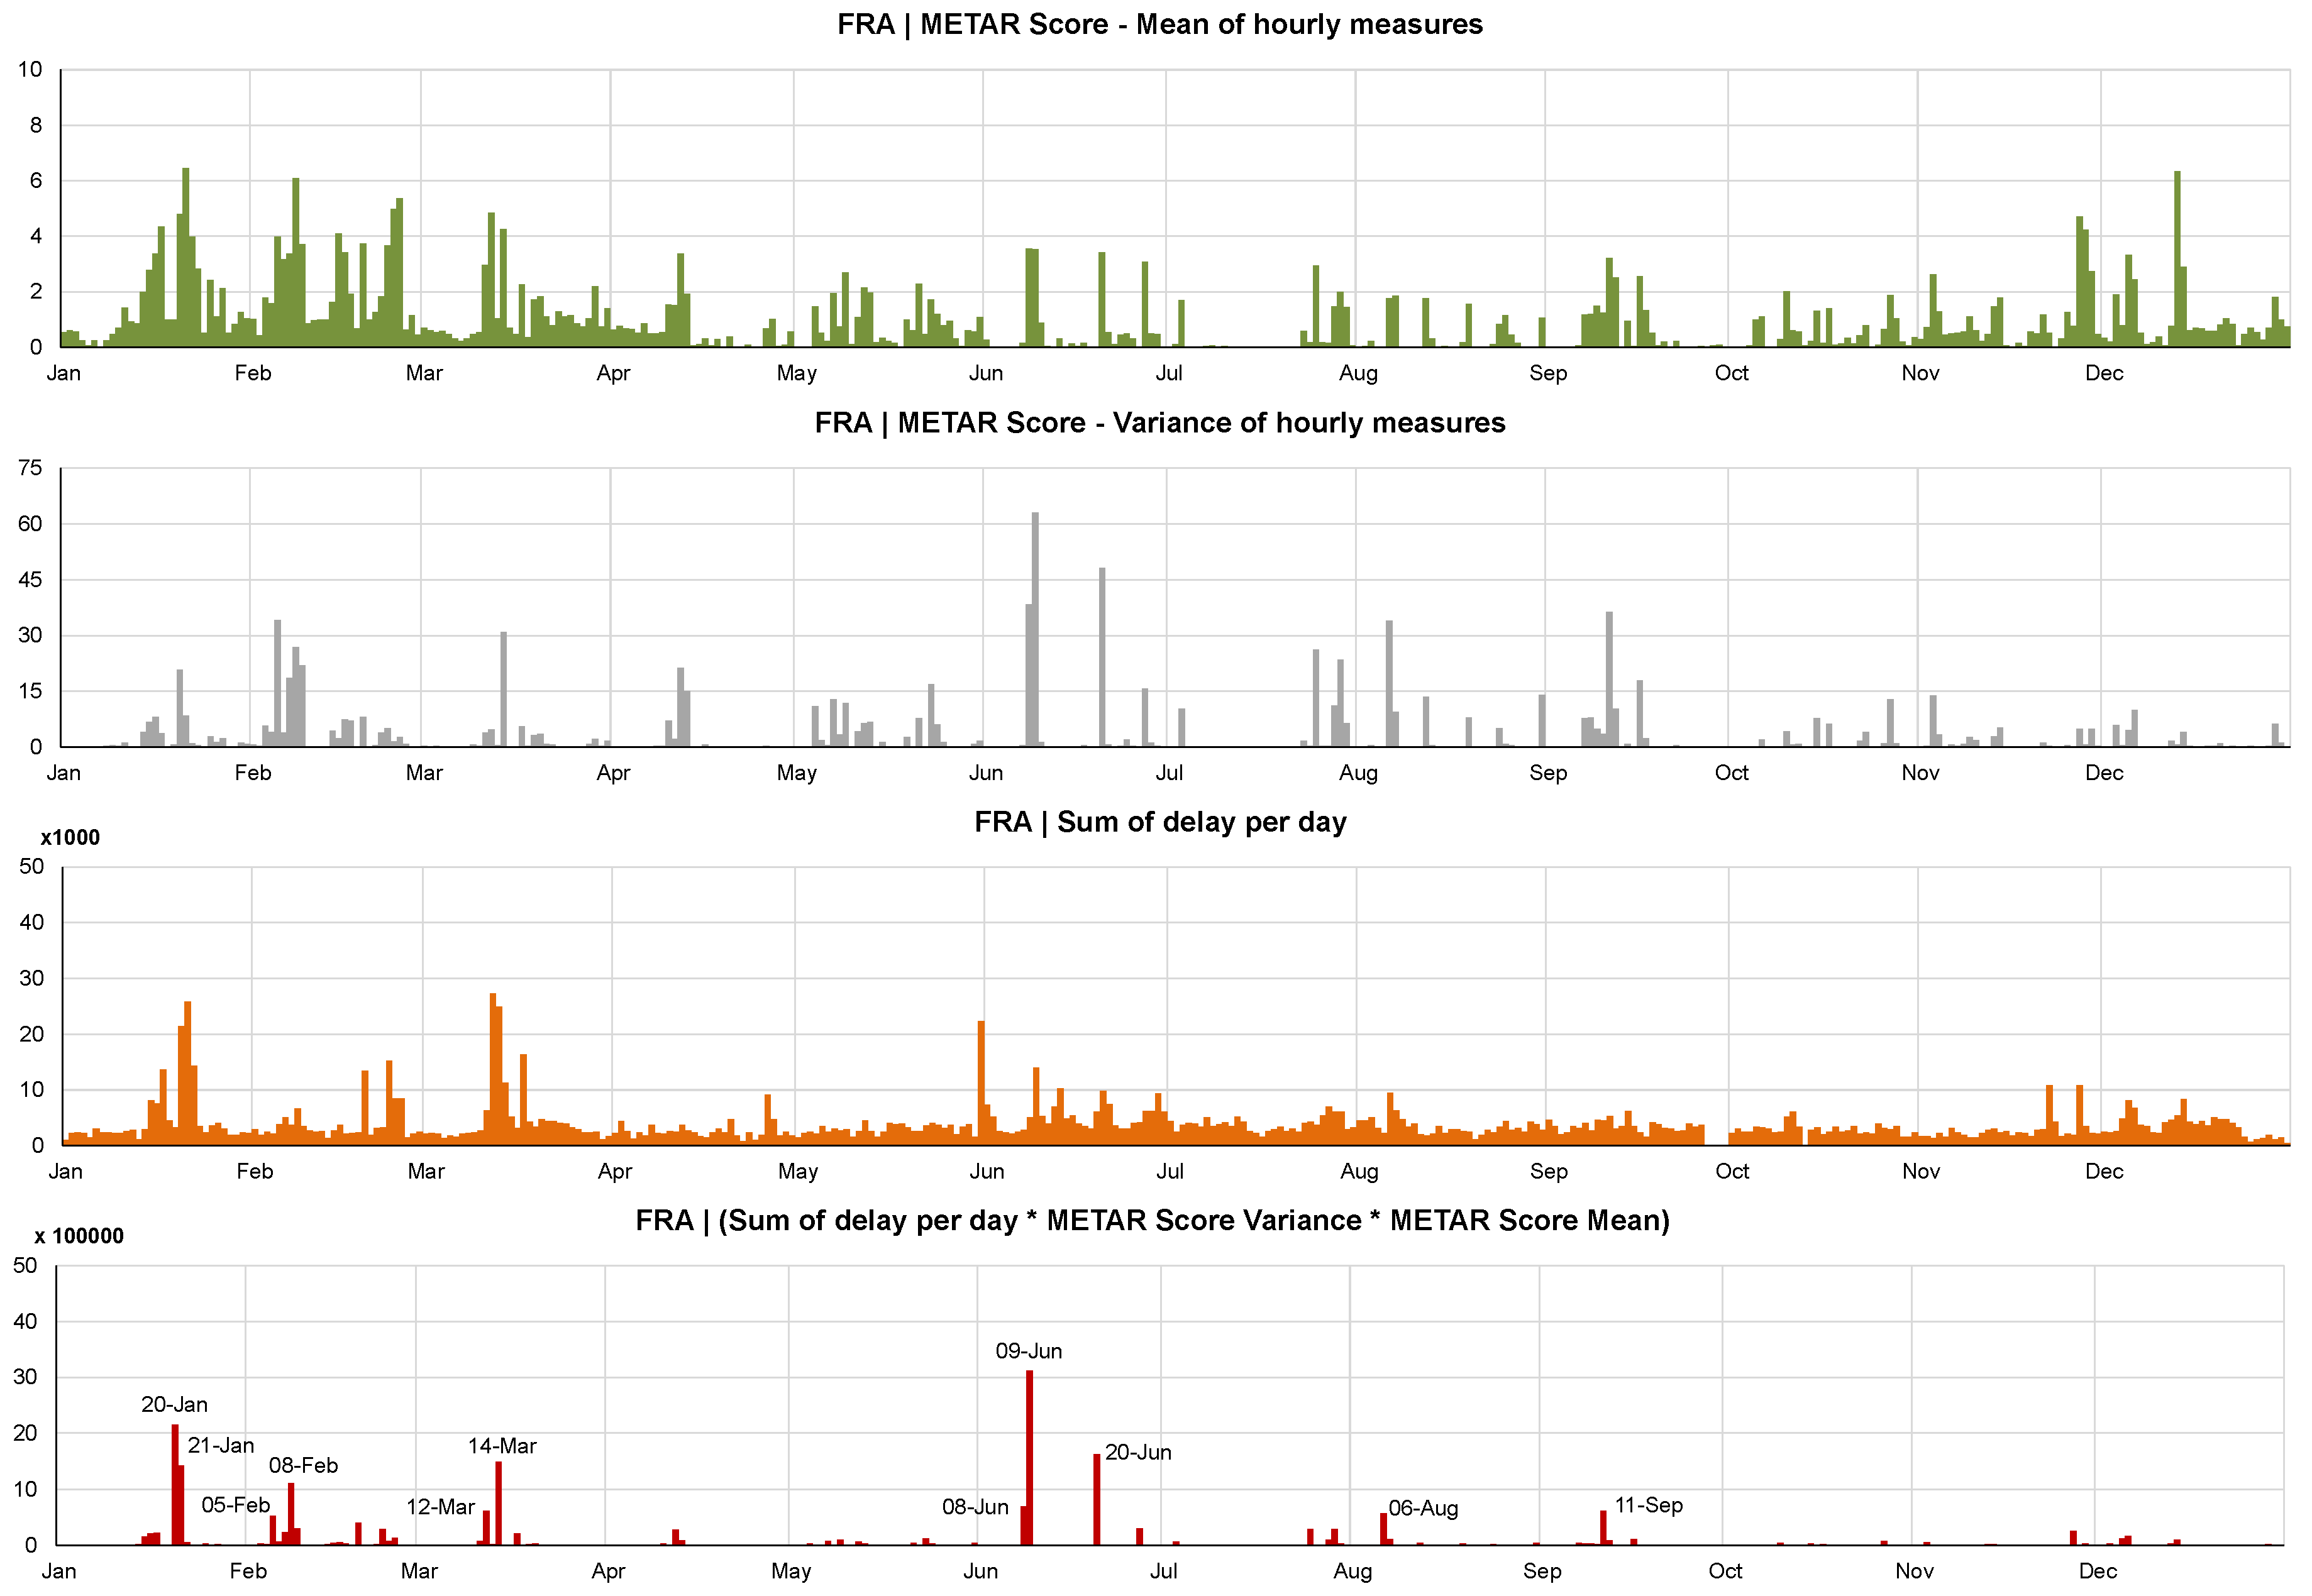
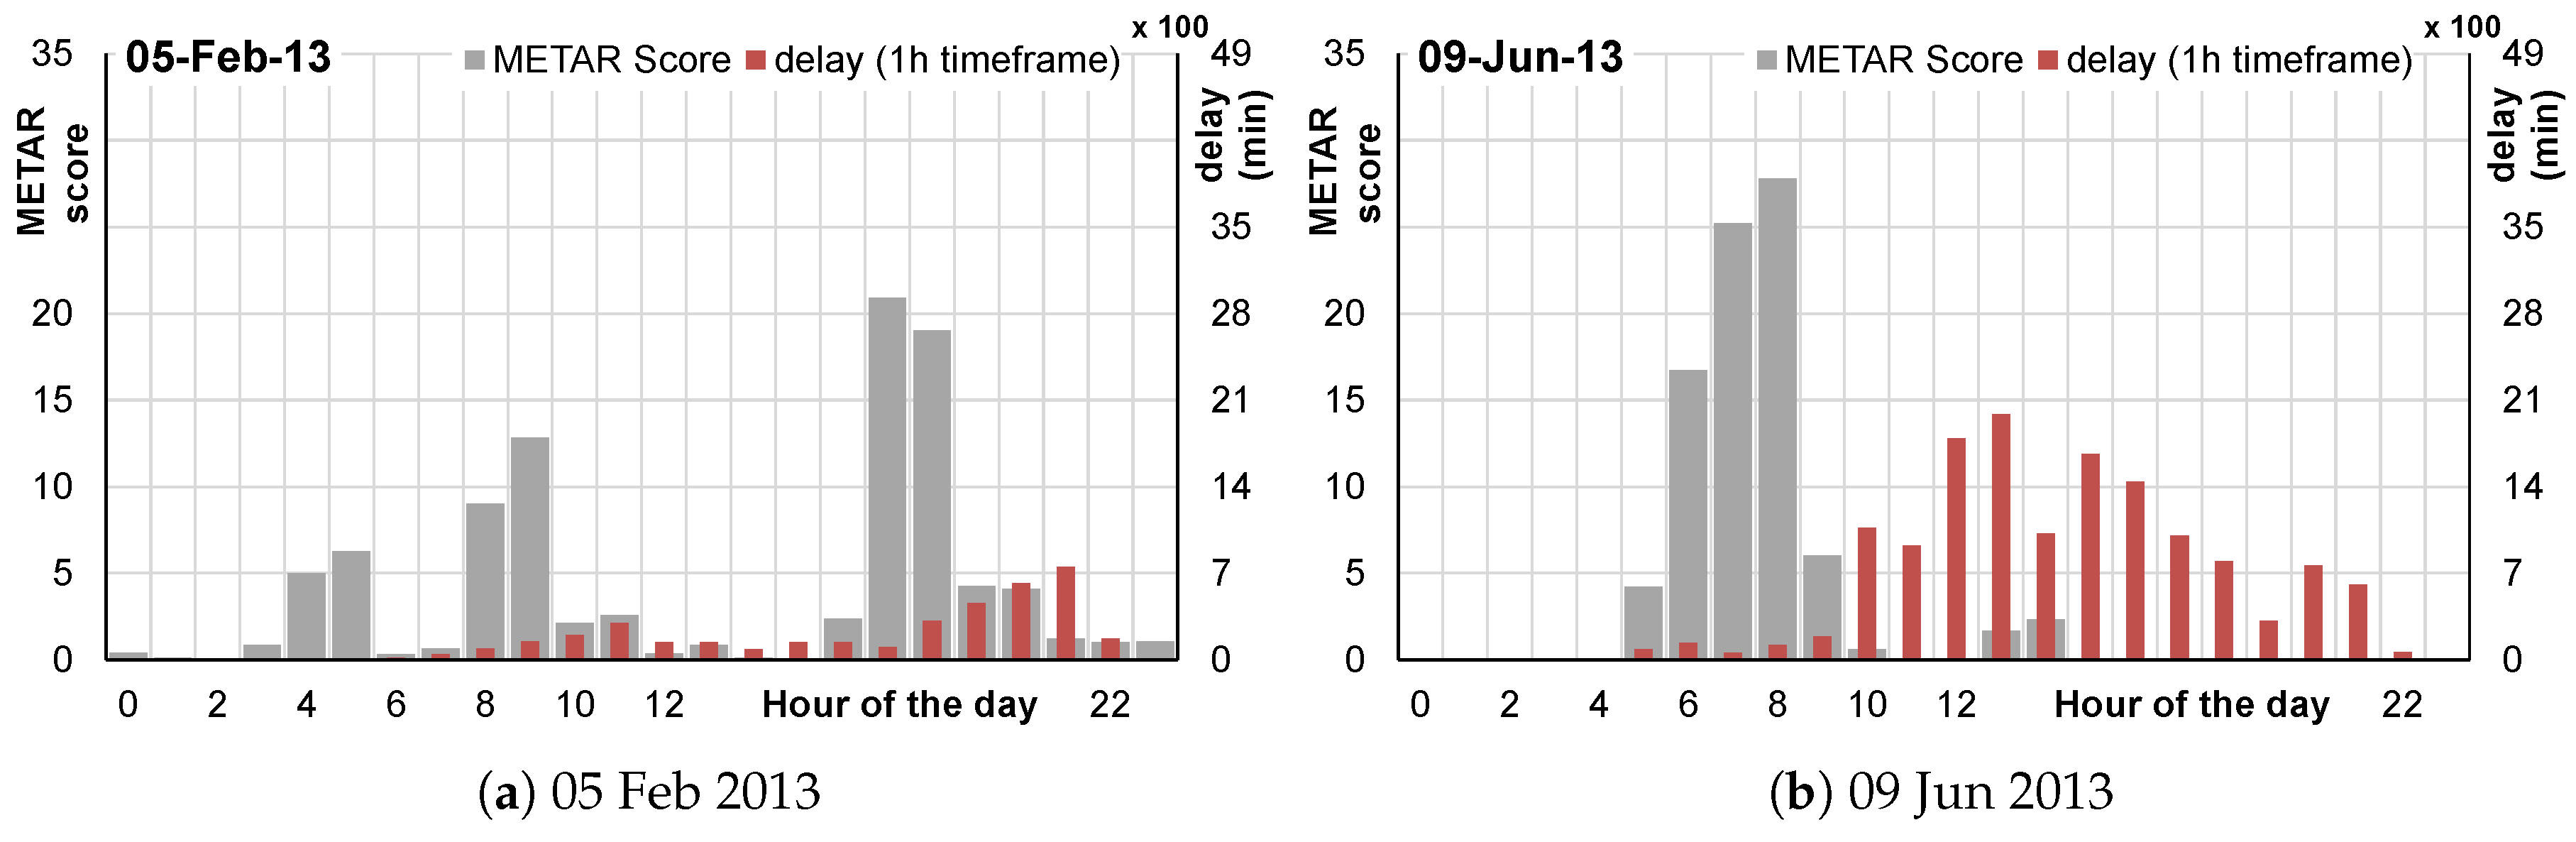
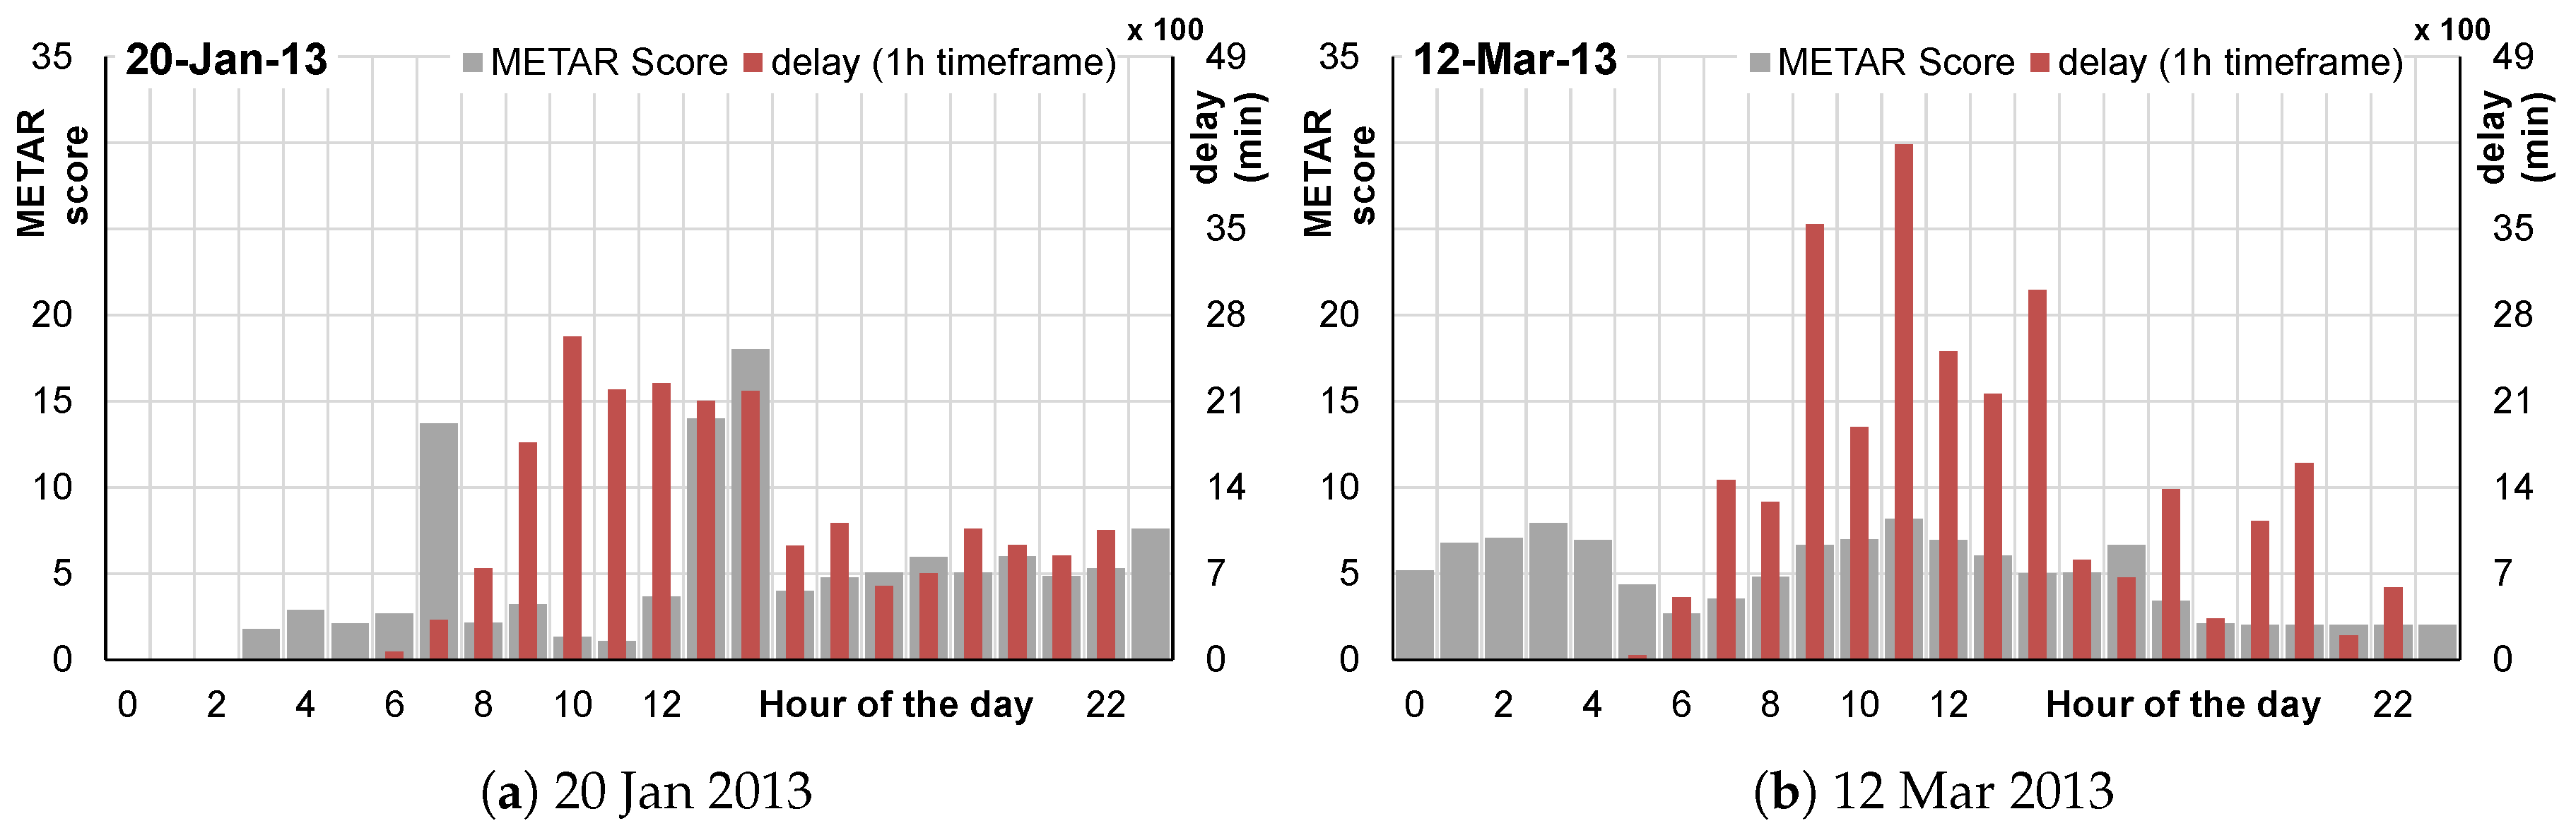
4.3. Days of Impact to Operational Performance
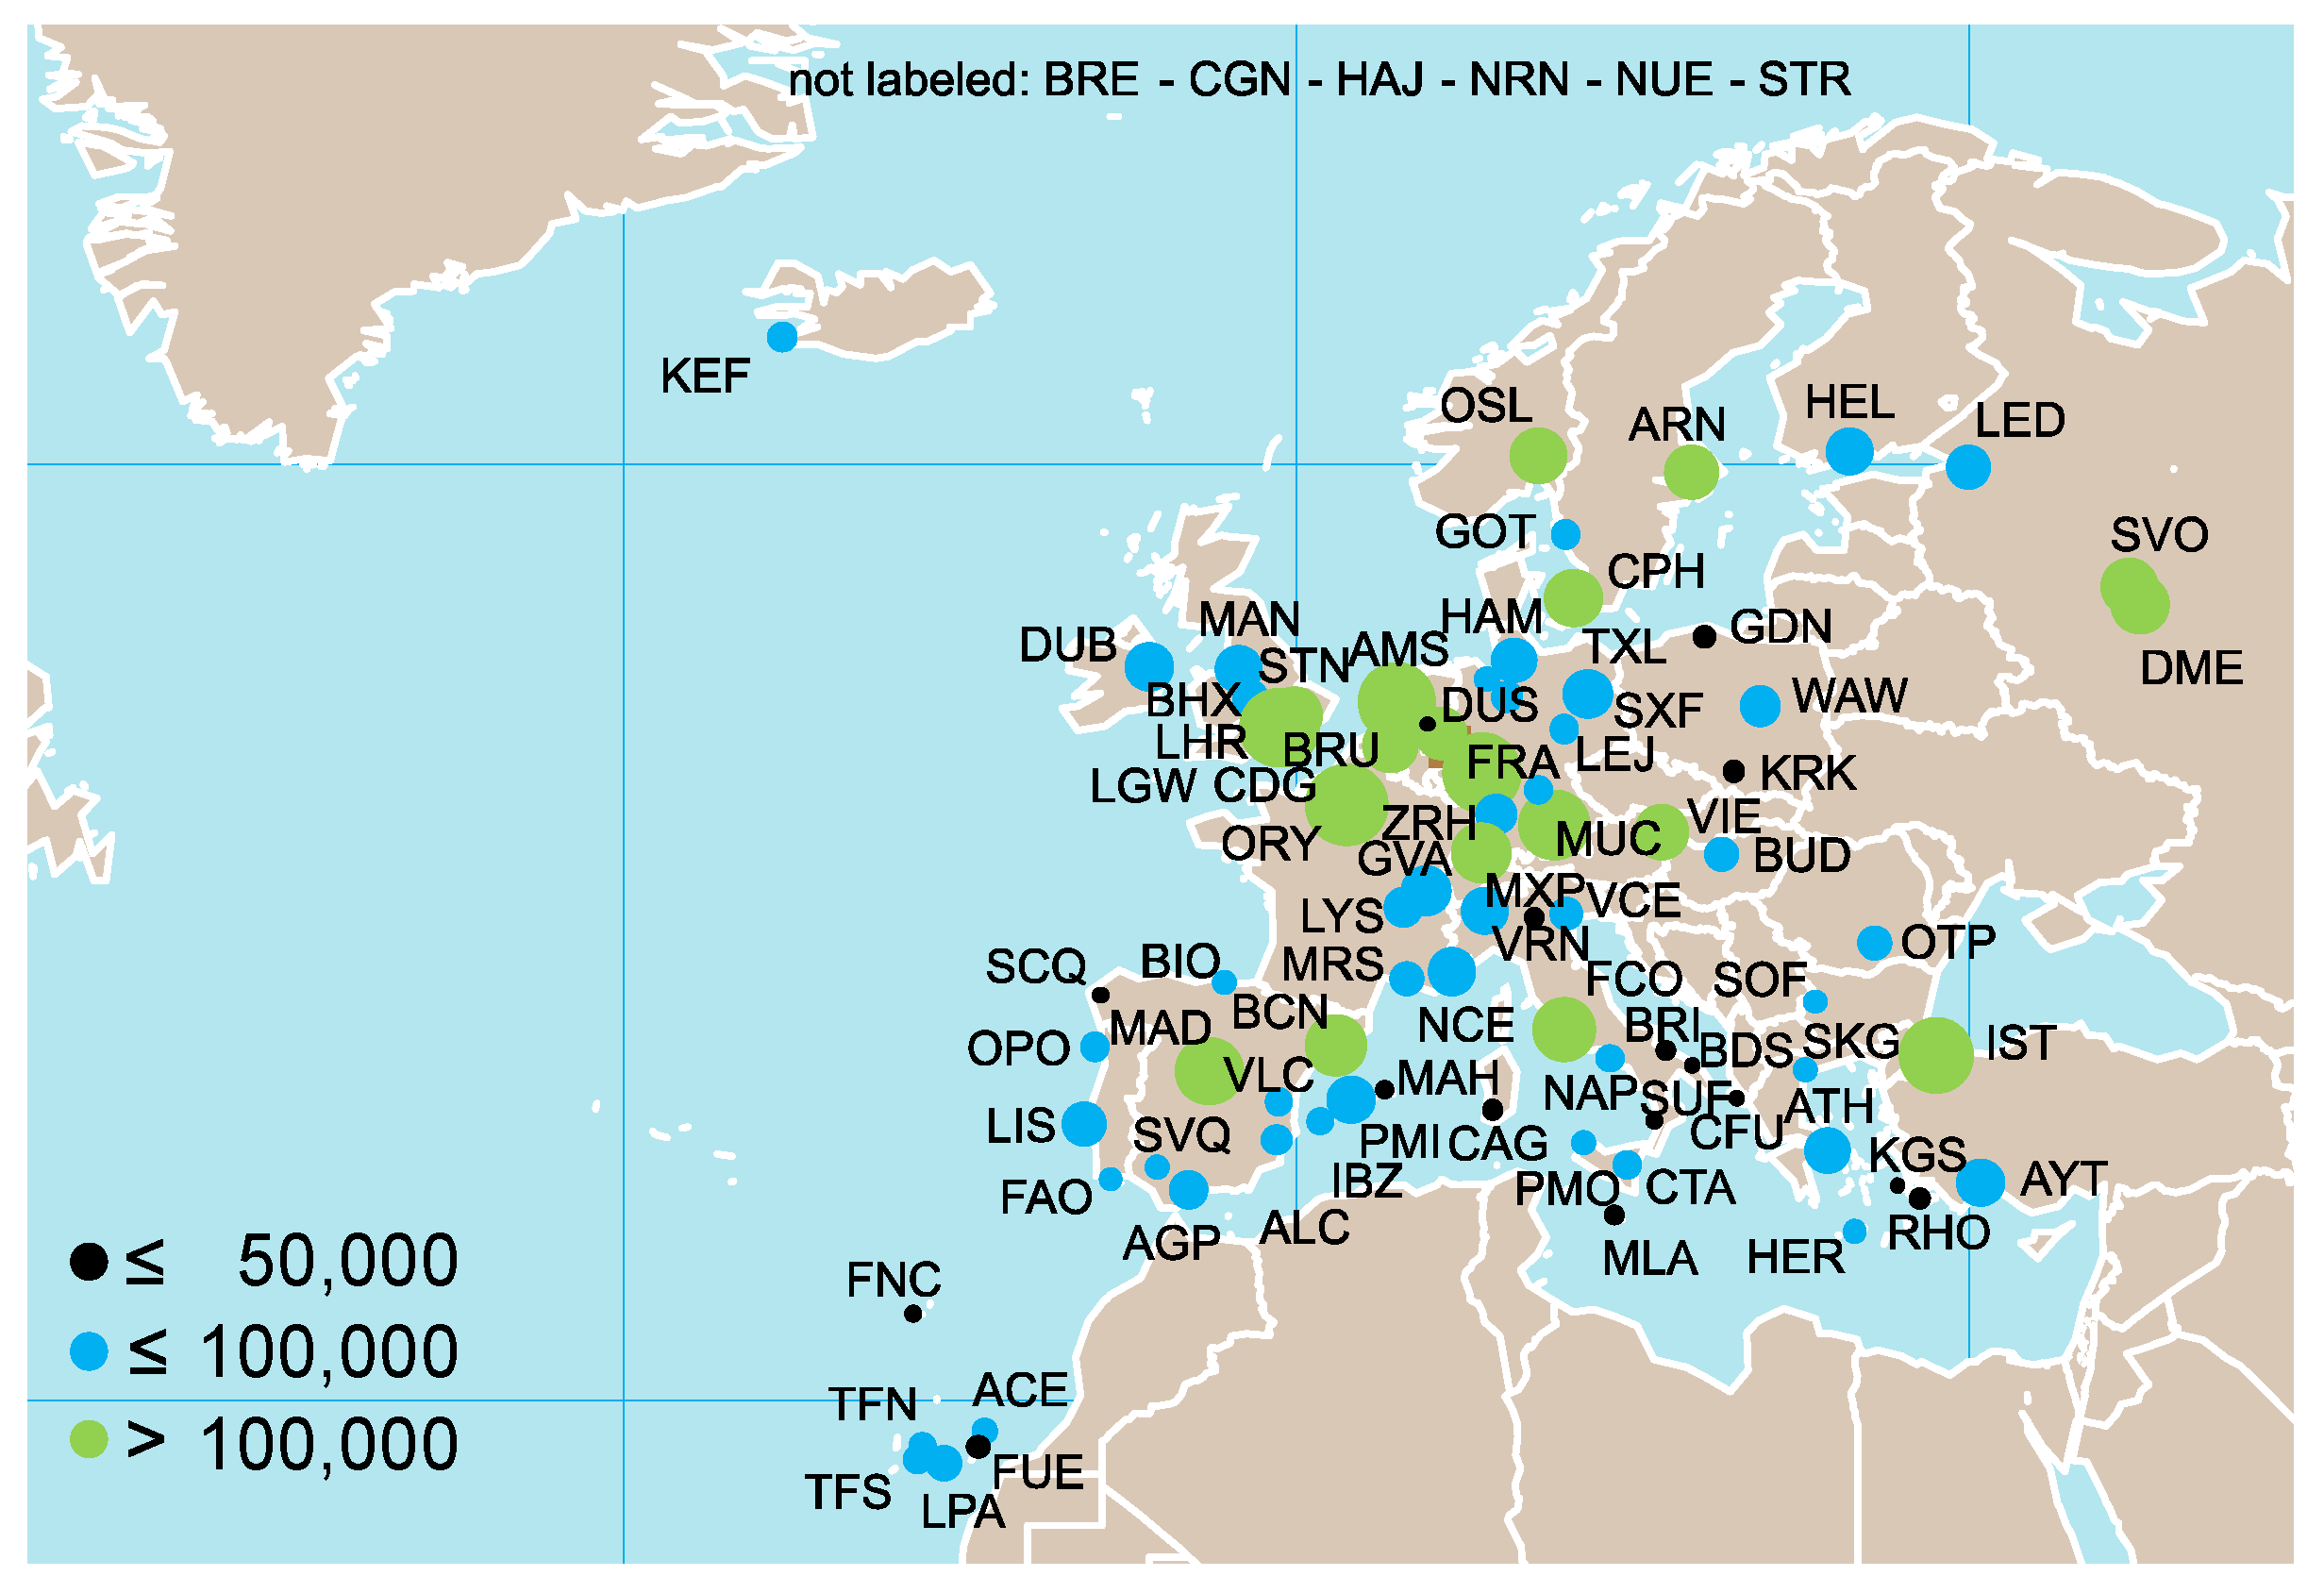
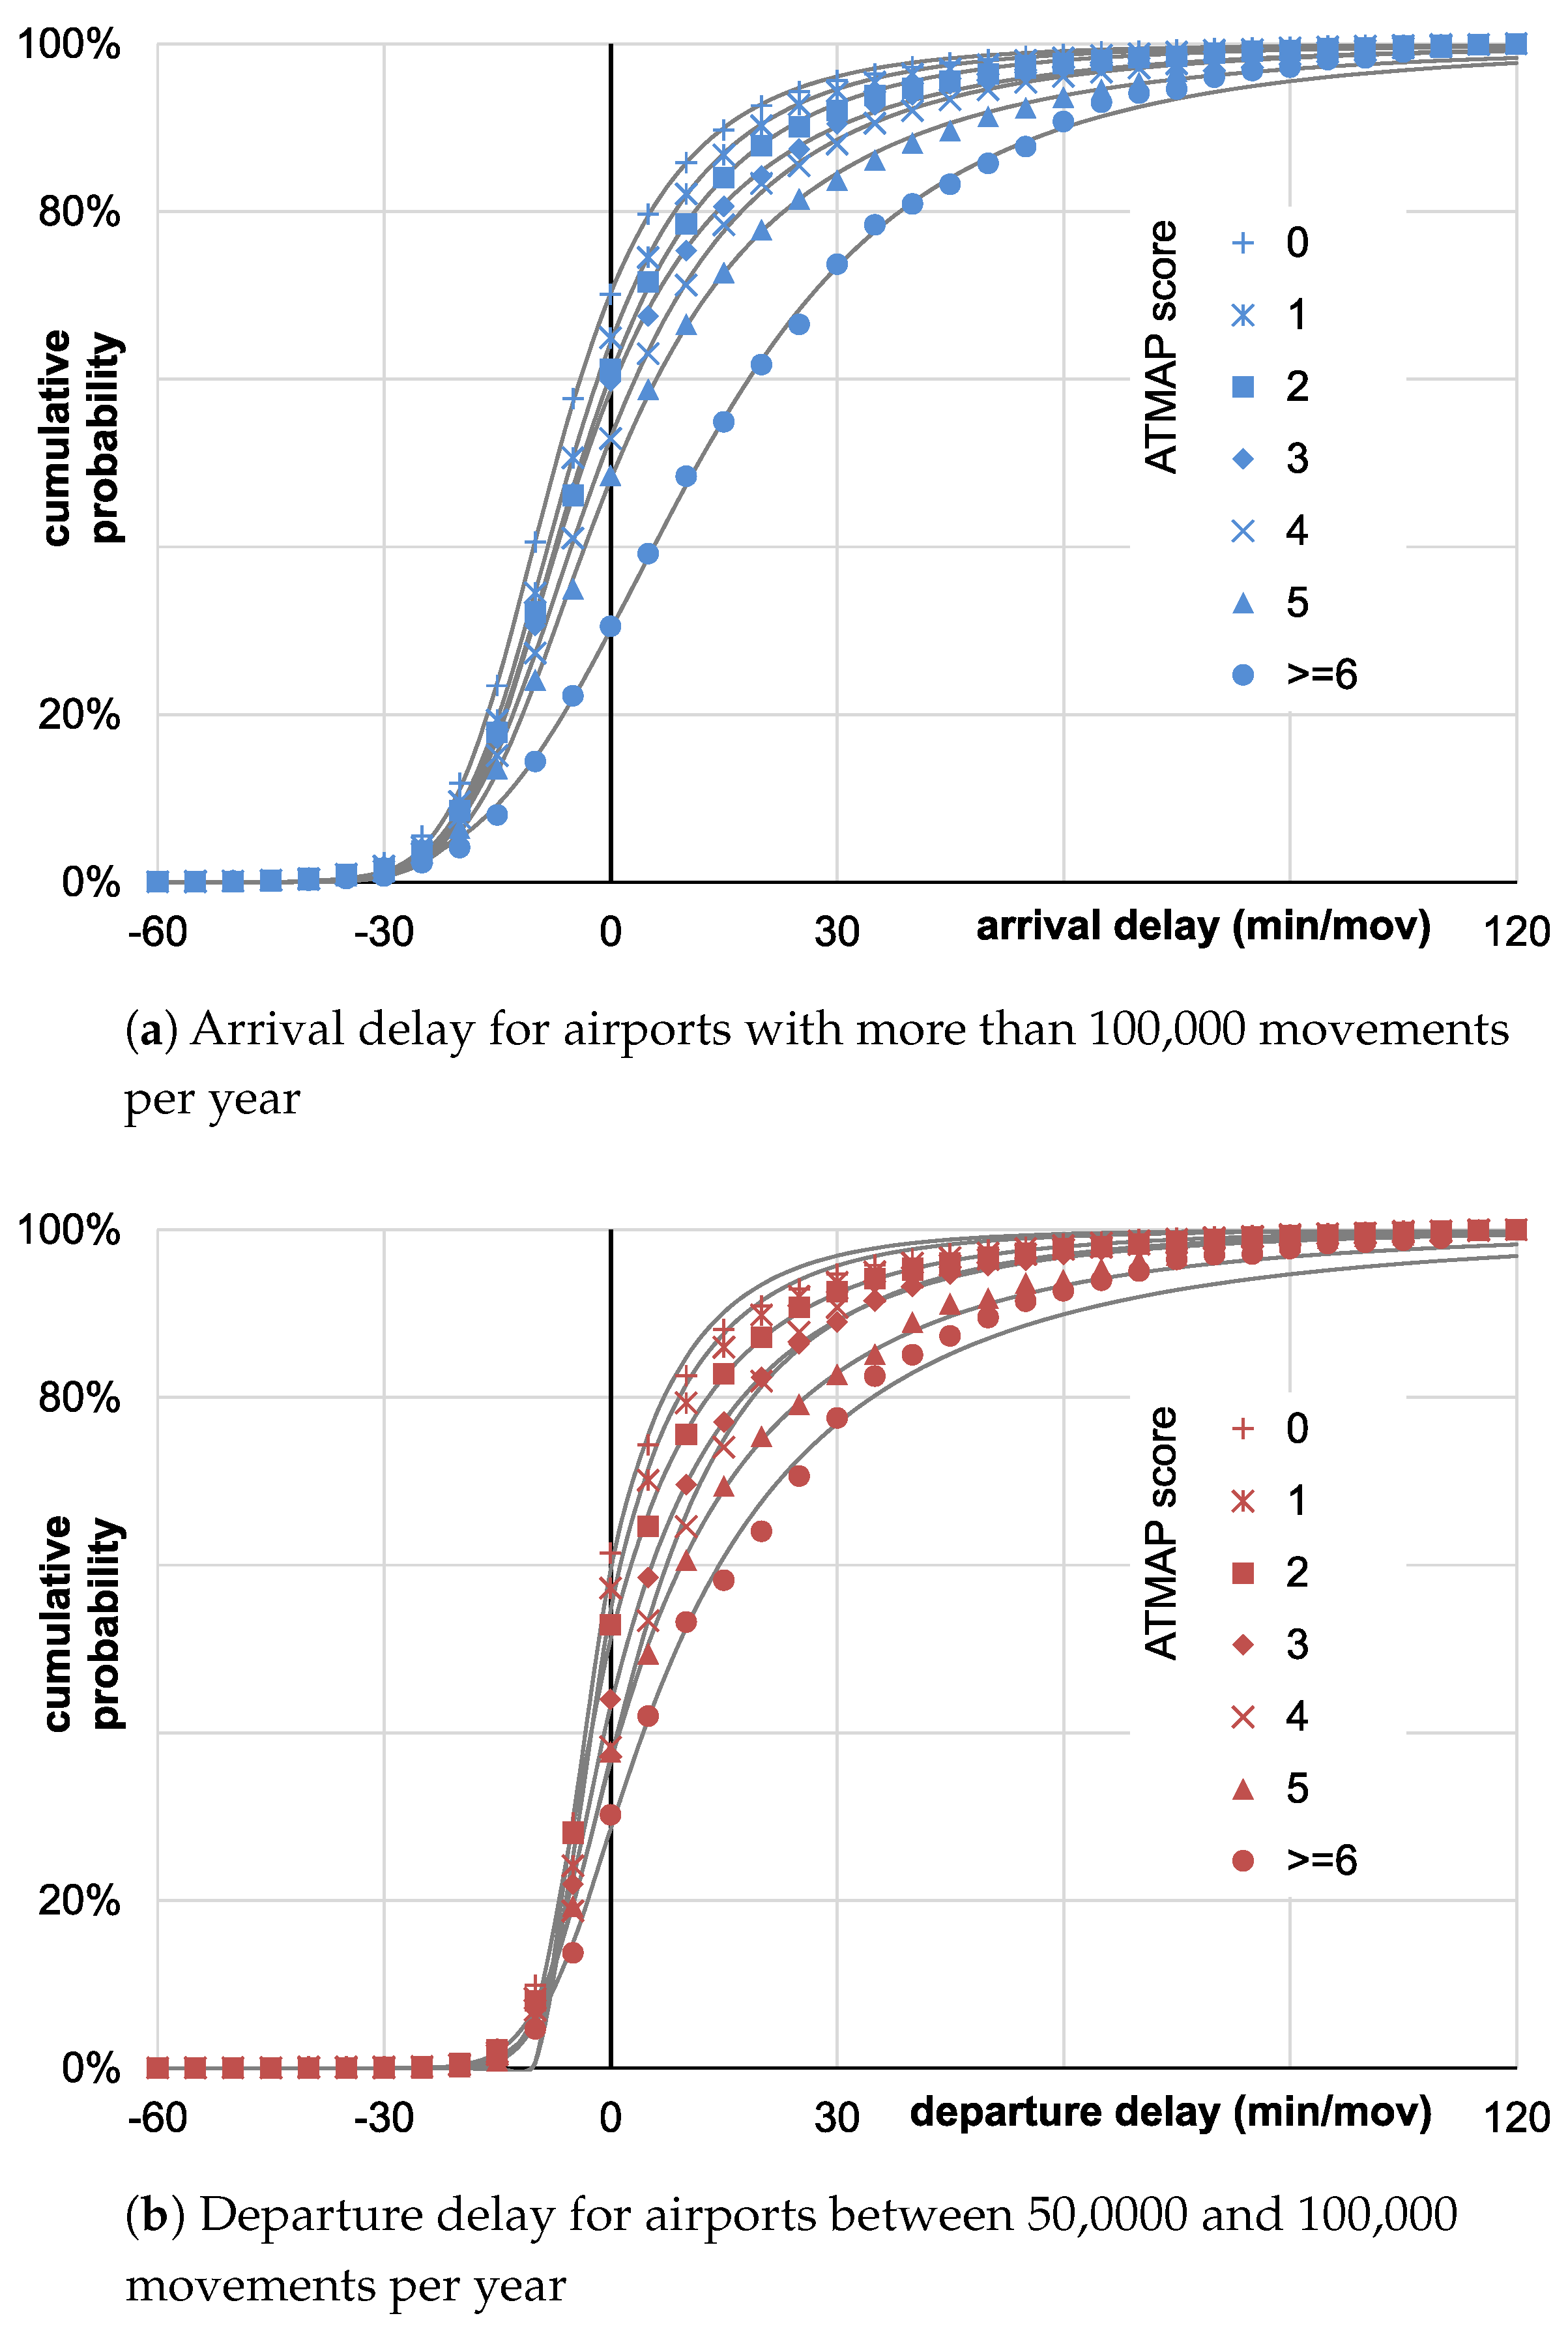
To identify days with a specific impact of weather phenomena to the airport performance, three different values (mean and variance of hourly measured ATMAP values, and sum of delay) are combined (by multiplying them) into one single value (see Figure 10). In this context, the variance of the ATMAP score is a measure of disruptiveness of the current weather phenomena. Using the information presented in Figure 10, different days with specific impact to the airport performance can be identified. These exemplary days show the common operational behaviour at airports, where the delay measure follows the weather event (indicated by the ATMAP weather score) with a certain time distance. Four days in 2013 are used, as an example, to provide additional information about the weather situation: 20 January, 5 February, 12 March, and 9 June.
The next examples are taken to point out the effect of dangerous events (see Figure 11). 5 February 2013: Between 8:50 a.m. and 10:50 a.m. local time wind gusts occur with a magnitude of 23–34 kn. Dangerous phenomena like TCU- and CB-clouds can be observed during the day repeatedly. Particularly in the early evening hours of 6:00 p.m. to 8:00 p.m., additional phenomena occur: thunderstorms with snow or rain, clouding vision and freezing conditions with temperatures around the freezing point as well as restricted runway conditions; 9 June 2013: In the period from 8:00 a.m. to 11:00 a.m. local time, there are weather disturbances in the form of dangerous phenomena (CB-cloud), especially between 9:00 a.m. and 11:00 a.m., with a mild to severe thunderstorm with heavy rainfall phases and partial sight limitations. Figure 11 also clearly exhibits a temporal shift of when the meteorological event happens and when it becomes apparent in delayed airport operations (disruptions). As the progress of 9th June emphasizes, high ATMAP scores around 6:00 a.m. to 8:00 a.m. in the morning are correlated with high delays at 11:00 a.m. to 12:00 p.m. This delayed response of the air traffic system to local weather events is typical and has a dimension of 2–4 h at Frankfurt airport.
The next examples are taken to point out the effect of freezing conditions (see Figure 12); 20 January 2013: Visibility is somehow limited all day, being less than 3000 m, due to moist haze. Temperatures are well below freezing. All-day-lasting precipitation takes the form of (light) snow, sleet or (freezing) rain. Around 3:00 p.m. local time, dangerous precipitation develops in the form of ice pellets; 12 March 2013: The whole day is marked by variably strong snowfall. Specifically, 10:00 a.m. to 1:30 p.m. local time brings heavy snowfall, which is accompanied by fog and haze. Visibility is sometimes below 500 m in critical areas and improves in subsequent hours but does not become optimal. The temperatures are in the range of 3 to 6 C.

5. Network View

The detailed analysis of one airport points out that the airport performance could be analysed against the weather data using public available data. However, our individualized analysis approach is limited, since a deeper insight into actual airport operations is not possible. On the other hand, the input data can be aggregated at a higher level opening up the possibility of estimating the amount of delay experienced at airports as a function of weather conditions. With this approach, weather phenomena extending through Europe could be modelled allowing researchers to analyse the network-wide impact of dynamic weather conditions. For these reasons, we extended our detailed view to a network perspective and investigated 83 additional airports (see Figure 13).
The airports have been clustered based on the number of IFR annual departure movements in small, medium and large airports. Burr distributions [44] for departure and arrival delays are fitted for each airport category and ATMAP score using maximum likelihood method. The Burr distribution has been selected for the modelling of delay as this is the distribution which presents a better fitting for the ATFM delay observed in a year of operations in Europe [25,45]. Examples of uses of Burr distribution on other fields can be found in [46,47]. Equation (1) presents an extended version of the Burr distribution, which provides the arrival/departure delay distribution with scaling factor λ (the value of 60 is used for a better fitness for scaling), and shape factors c and k.
F ( x ; c , k , λ ) = 1 1 + ( x + 60 ) λ c k .
In Table 6, the corresponding values for the parameters of the Burr distribution are shown, separated by arrival/departure delays (in minutes) and airport classes. To appropriately fit the Burr distribution with the corresponding data points, the parameter set with the maximum likelihood is used.
Figure 14 shows two examples of the delay distributions for large airports. Note how the use of Burr distributions provides a qualitative good fitting to the data observed. In the figures, the circle markers represent the medians, the lines illustrate the Burr distribution per airport category and ATMAP score (delay = average minutes per movement and average daily ATMAP score). As expected, higher ATMAP scores, i.e., worse meteorological situations at the airport, lead to higher probabilities of larger delays (see how an ATMAP score of 6 or higher leads to significant higher delays than scores between 1 and 4).

6. Conclusions

This study is based on an analysis of a data set containing about 20.5 million flights in 2013 between European airports and airports in the world. For the purpose of evaluating the influence of meteorological events on the airport capacity and performance, the aircraft delay (punctuality) and the number of cancellations are statistically analysed for both departure and arrival operations. The delay values are not limited to airport related delays but may also consider delays caused by increased distances in the en-route phase or reactionary delays.
The use of delay probability distributions to model the impact of weather as a function of airport size and ATMAP score is an efficient method to capture the impact of weather on the ATM network level. As presented in our analysis, there is a correlation between the ATMAP score, which is linked to the severity of the weather event, and the delay experienced by departure and arrival flights. The fitting with Burr distributions is suited and will allow modellers to consider weather events and their temporal evolution in a seamless manner: METARs, which change over time, can be transformed into ATMAP scores, which, in their application, provide a specific distribution of departure and arrival delay. With this approach, modelling the temporary evolution of ATMAP scores, the dynamics of the delay generation due to weather phenomena in Europe can be captured. This is important as operations at infrastructures affected by meteorological events might be disturbed, even if ATFM regulations have not been issued. Moreover, for weather related disturbances, not only are their scope and intensity (delay generated) important, but also their temporal evolution, which would be captured by the changes on the METAR and their associated ATMAP scores.
Note that the delay generated by using the inverse of the Burr probability distributions captures the overall delay experienced by flights and not only the effect of weather. This should be considered when using these distributions to model delay at a network to avoid double counting of delay. Further research is required to extract from the modelled delay the ones primarily due to weather. It will be particularly useful to identify which part of the delay is due to the propagation of reactionary delay as this will help stakeholders to optimise their operations. In order to achieve this modelling of primary delay, data sets that contain the registration mark of the aircraft and turnaround times will be required. Finally, the distributions provided in this paper could allow airports and airlines operators to forecast the average delay experienced at the infrastructure as a function of the current and forecast weather in order to apply mitigation strategies.

Author Contributions

Conceptualization, M.S. and L.D.; Methodology, M.S. and L.D.; Software, M.S., S.L. and R.S.; Validation, M.S., S.L. and R.S.; Formal Analysis, M.S., S.L. and R.S.; Investigation, M.S., S.L, and R.S.; Data Curation, S.L. and R.S.; Writing-Original Draft Preparation, M.S., S.L., and R.S.; Writing-Review & Editing, M.S., S.L, and L.D; Visualization, S.L. and R.S.

Funding

This research received no external funding.

Conflicts of Interest

The authors declare no conflict of interest.

Abbreviations

The following abbreviations are used in this manuscript:
ARRArrival
ATMAir Traffic Management
ATFMAir Traffic Flow Management
ATMAPATM Airport Performance
CBCumulonimbus Cloud
DEPDeparture
IATAInternational Air Transport Association
ICAOInternational Civil Aviation Organization
IFRInstrument Flight Rules
METARMeteorological Aviation Routine Weather Report
PRUPerformance Review Unit
RVRRunway Visual Range
SPECISpecial weather
TAFTerminal Area/Aerodrome Forecast
TCUTowering Cumulus
UTCCoordinated Universal Time

References

  1. EUROCONTROL. Performance Review Report—An Assessment of Air Traffic Management in Europe During the Calendar Year 2014, 2015, 2016; Technical Report; Performance Review Commission: Brussels, Belgium, 2017. [Google Scholar]
  2. Bronsvoort, J.; McDonald, G.; Porteous, R.; Gutt, E. Study of Aircraft Derived Temporal Prediction Accuracy using FANS. In Proceedings of the 13th Air Transport Research Society (ATRS) World Conference, Abu Dhabi, United Arab Emirates, 27–30 June 2009. [Google Scholar]
  3. Bongiorno, C.; Gurtner, G.; Lillo, F.; Mantegna, R.N.; Miccichè, S. Statistical characterization of deviations from planned flight trajectories in air traffic management. J. Air Trans. Manag. 2017, 58, 152–163. [Google Scholar] [CrossRef] [Green Version]
  4. Mueller, E.; Chatterji, G. Analysis of Aircraft Arrival and Departure Delay. In Proceedings of the AIAA ATIO Conference, Williamsburg, VA, USA, 6 November 2002. [Google Scholar]
  5. Tielrooij, M.; Borst, M.C.; van Paassen, M.; Mulder, M. Predicting Arrival Time Uncertainty from Actual Flight Information. In Proceedings of the 11th USA/Europe Air Traffic Management Research and Development Seminar (ATM 2015), Lisbon, Portugal, 23–26 June 2015. [Google Scholar]
  6. EUROCONTROL. CODA Digest All-Causes Delay and Cancellations to Air Transport in Europe—2016; Technical Report; Eurocontrol: Brussels, Belgium, 2016. [Google Scholar]
  7. Cook, A.; Tanner, G.; Enaud, P. Quantifying airline delay costs—The balance between strategic and tactical costs. In Proceedings of the 14th Air Transport Research Society (ATRS) World Conference, Porto, Portugal, 6–9 July 2010. [Google Scholar]
  8. Sohoni, M.G.; Erat, S. Can Time Buffers Lead to Delays? The Role of Operational Flexibility. SSRN 2015. [Google Scholar] [CrossRef] [Green Version]
  9. Rosenow, J.; Lindner, M.; Fricke, H. Impact of climate costs on airline network and trajectory optimization: A parametric study. CEAS Aeronaut. J. 2017, 8, 371–384. [Google Scholar] [CrossRef]
  10. Niklaß, M.; Lührs, B.; Grewe, V.; Dahlmann, K.; Luchkova, T.; Linke, F.; Gollnick, V. Potential to reduce the climate impact of aviation by climate restricted airspaces. Trans. Policy 2017. [Google Scholar] [CrossRef]
  11. Rosenow, J.; Fricke, H.; Luchkova, T.; Schultz, M. Minimizing contrail formation by rerouting around dynamic ice-supersaturated regions. Aeronaut. Aerosp. Open Access J. 2018, 2, 105–111. [Google Scholar] [CrossRef]
  12. Kaiser, M.; Rosenow, J.; Fricke, H.; Schultz, M. Tradeoff between optimum altitude and contrail layer to ensure maximum ecological en-route performance using the Enhanced Trajectory Prediction Model. In Proceedings of the 2nd International Conference on Application and Theory of Automation in Command and Control Systems (ATACCS 2012), London, UK, 28–30 May 2012. [Google Scholar]
  13. Oreschko, B.; Kunze, T.; Schultz, M.; Fricke, H.; Kumar, V.; Sherry, L. Turnaround prediction with stochastic process times and airport specific delay pattern. In Proceedings of the 5th International Conference on Research in Airport Transportation (ICRAT 2012), Berkeley, CA, USA, 22–25 May 2012. [Google Scholar]
  14. Gerdes, I.; Temme, A.; Schultz, M. Dynamic airspace sectorisation for flight-centric operations. Trans. Res. Part C Emerg. Technol. 2018, 95, 460–480. [Google Scholar] [CrossRef]
  15. Gerdes, I.; Temme, A.; Schultz, M. Dynamic airspace sectorization using controller task load. In Proceedings of the 6th SESAR Innovation Days (SID 2016), Delft, The Netherlands, 8–10 November 2016. [Google Scholar]
  16. Standfuß, T.; Gerdes, I.; Temme, A.; Schultz, M. Dynamic airspace optimisation. CEAS Aeronaut. J. 2018, 9, 517–531. [Google Scholar] [CrossRef]
  17. Schultz, M. Implementation and application of a stochastic aircraft boarding model. Trans. Res. Part C Emerg. Technol. 2018, 90, 334–349. [Google Scholar] [CrossRef]
  18. Schultz, M. Fast Aircraft Turnaround Enabled by Reliable Passenger Boarding. Aerospace 2018, 5, 8. [Google Scholar] [CrossRef]
  19. Grunewald, E.; Knabe, F.; Rudolph, F.; Schultz, M. Priority rules as a concept for the usage of scarce airport capacity. Trans. Res. Procedia 2018, 27, 1146–1153. [Google Scholar] [CrossRef]
  20. Schultz, M. Entwicklung eines Individuenbasierten Modells zur Abbildung des Bewegungsverhaltens von Passagieren im Flughafenterminal. Ph.D. Thesis, Technische Universität Dresden, Dresden, Germany, 2010. [Google Scholar]
  21. Santos, B.F.; Wormer, M.M.E.C.; Achola, T.A.O.; Curran, R. Airline delay management problem with airport capacity constraints and priority decisions. J. Air Trans. Manag. 2017, 63, 34–44. [Google Scholar] [CrossRef]
  22. Carlier, S.; de Lépinay, I.; Hustache, J.; Jelinek, F. Environmental impact of air traffic flow management delays. In Proceedings of the 7th USA/Europe Air Traffic Management Research and Development Seminar (ATM 2007), Barcelona, Spain, 2–5 July 2007. [Google Scholar]
  23. Campanelli, B.; Fleurquin, P.; Arranz, A.; Etxebarria, I.; Ciruelos, C.; Eguíluz, V.M.; Ramasco, J.J. Comparing the modeling of delay propagation in the US and European air traffic networks. J. Air Trans. Manag. 2016, 56, 12–18. [Google Scholar] [CrossRef] [Green Version]
  24. Ivanov, N.; Netjasov, F.; Jovanović, R.; Starita, S.; Strauss, A. Air Traffic Flow Management slot allocation to minimize propagated delay and improve airport slot adherence. Trans. Res. Part A Policy Pract. 2017, 95, 183–197. [Google Scholar] [CrossRef]
  25. Cook, A.; Delgado, L.; Tanner, G.; Cristóbal, S. Measuring the cost of resilience. J. Air Trans. Manag. 2016, 56, 38–47. [Google Scholar] [CrossRef]
  26. Proag, S.L.; Proag, V. The Cost Benefit Analysis of Providing Resilience. Procedia Econ. Financ. 2014, 18, 361–368. [Google Scholar] [CrossRef]
  27. Cook, A.; Tanner, G.; Williams, V.; Meise, G. Dynamic cost indexing—Managing airline delay costs. J. Air Trans. Manag. 2009, 15, 26–35. [Google Scholar] [CrossRef]
  28. Islami, A.; Sun, M.; Chaimatanan, S.; Delahaye, D. Optimization of military missions impact on civilian 4D trajectories. In Proceedings of the ENRI International Workshop on ATM/CNS (EIWAC 2017), Tokyo, Japan, 6 November 2017. [Google Scholar]
  29. Luchkova, T.; Vujasinovic, R.; Lau, A.; Schultz, M. Analysis of Impacts an Eruption of Volcano Stromboli could have on European Air Traffic. In Proceedings of the 11th USA/Europe Air Traffic Management Research and Development Seminar (ATM 2015), Lisbon, Portugal, 23–26 June 2015. [Google Scholar]
  30. Kreuz, M.; Luchkova, T.; Schultz, M. Effect Of Restricted Airspace On The ATM System. In Proceedings of the World Conference on Transport Research (WCTR 2016), Shanghai, China, 26–31 May 2016. [Google Scholar]
  31. Rosenow, J.; Fricke, H.; Schultz, M. Air Traffic Simulation with 4D multi-criteria optimized trajectories. In Proceedings of the 2017 Winter Simulation Conference (WSC), Las Vegas, NV, USA, 3–6 December 2017; pp. 2589–2600. [Google Scholar]
  32. Kaltenhäuser, S.; Morlang, F.; Luchkova, T.; Hampe, J.; Sippel, M. Facilitating Sustainable Commercial Space Transportation Through an Efficient Integration into Air Traffic Management. New Space 2017, 5, 244–256. [Google Scholar] [CrossRef]
  33. Sunil, E.; Hoekstra, J.; Ellerbroek, J.; Bussink, F.; Nieuwenhuisen, D.; Vidosavljevic, A.; Kern, S. Metropolis: Relating Airspace Structure and Capacity for Extreme Traffic Densities. In Proceedings of the 11th USA/Europe Air Traffic Management Research and Development Seminar (ATM 2015), Lisbon, Portugal, 16 September 2015. [Google Scholar]
  34. Montlaur, A.; Delgado, L. Flight and passenger delay assignment optimization strategies. Trans. Res. Part C Emerg. Technol. 2017, 81, 99–117. [Google Scholar] [CrossRef]
  35. Delgado, L.; Prats, X. Operating cost based cruise speed reduction for ground delay programs: Effect of scope length. Trans. Res. Part C Emerg. Technol. 2014, 48, 437–452. [Google Scholar] [CrossRef] [Green Version]
  36. Buxi, G.; Hansen, M. Generating day-of-operation probabilistic capacity scenarios from weather forecasts. Trans. Res. Part C Emerg. Technol. 2013, 33, 153–166. [Google Scholar] [CrossRef] [Green Version]
  37. EUROCONTROL. Algorithm to Describe Weather Conditions at European Airports; Technical Report; Eurocontrol: Brussels, Belgium, 2011. [Google Scholar]
  38. Fraport, A.G. Annual Report; Technical Report; Fraport AG: Frankfurt, Germany, 2013. [Google Scholar]
  39. Federal Aviation Administration. Advisory Circular 00-45—Aviation Weather Services; Technical Report; Federal Aviation Administration: Washington, DC, USA, 2016. [Google Scholar]
  40. O’Flynn, S. Airport Capacity Assessment Methodology—ACAM Manual; Technical Report 1.1; EUROCONTROL: Brussels, Belgium, 2016. [Google Scholar]
  41. Schultz, M.; Fricke, H. Managing Passenger Handling at Airport Terminal. In Proceedings of the 9th USA/Europe Air Traffic Management Research and Development Seminar (ATM 2011), Berlin, Germany, 14–17 June 2011. [Google Scholar]
  42. Röhner, P. Modelling of punctuality at Frankfurt Airport. Ph.D. Thesis, Gottfried Wilhelm Leibniz Universität Hannover, Hannover, Germany, 2009. [Google Scholar]
  43. Fricke, H.; Schultz, M. Delay Impacts onto Turnaround Performance. In Proceedings of the 8th USA/Europe Air Traffic Management Research and Development Seminar (ATM 2009), Napa, CA, USA, 23–26 June 2009. [Google Scholar]
  44. Tadikamalla, P.R. A look at the Burr and related distributions. Int. Stat. Rev. 1980, 48, 337–344. [Google Scholar] [CrossRef]
  45. SESAR Joint Undertaking. E.02.35-ComplexityCosts-D3.2—Scenario Definition; Technical Report; University of Westminster: London, UK, 2015. [Google Scholar]
  46. Papadopoulos, A.S. The Burr distribution as a failure model from a Bayesian approach. IEEE Trans. Reliab. 1978, R-27, 369–371. [Google Scholar] [CrossRef]
  47. Lindsay, S.R.; Wood, G.R.; Woollons, R.C. Modelling the diameter distribution of forest stands using the Burr distribution. J. Appl. Stat. 1996, 23, 609–620. [Google Scholar] [CrossRef]
Figure 1. Analysis of European flights from 2008–2015 regarding (a) variability of flight phases and (b) punctuality, not considering flights departing to or arrival from outside Europe (for data, see [1,6]).
Aerospace 05 00109 g001
Figure 2. Ratio of different weather classes at selected European airports (top down: Rom-Fiumicino, Madrid, London-Heathrow, London-Gatwick, Paris-Orly, Brussels, Paris-Charles-de-Gaule, Frankfurt, Copenhagen, Amsterdam, Zurich, Dusseldorf, Vienna, Oslo, Munich).
Aerospace 05 00109 g002
Figure 3. Airport performance data and ATM Airport Performance (ATMAP) weather score.
Aerospace 05 00109 g003
Figure 4. Correlation of ATMAP weather score and cancellation rate for (a) arrival and (c) departure (please notice the staggered scale) and correlation with the rate of delayed flights (b) for arrival and departure (d). The ATMAP weather score of n ( 0 < n < 6 ) contains all measures between n 1 and n, the score of 6 contains all values n 6 .
Aerospace 05 00109 g004
Figure 5. Quantification of (a) arrival and (b) departure delay if aircraft are not on time (delay greater or equal than 15 min).
Aerospace 05 00109 g005
Figure 6. Average weather score and total delay (per hour).
Aerospace 05 00109 g006
Figure 7. Categorization of weather days, separated by the common ATMAP score 1.5 to distinguish between (a) good and (b) bad weather conditions; (c) indicates the differences between.
Aerospace 05 00109 g007
Figure 8. Identification of relevant weather impacts.
Aerospace 05 00109 g008
Figure 9. Categorization of weather days, separated by the specific ATMAP score of 2.7 to distinguish between (a) good and (b) bad weather conditions; (c) indicates the differences between.
Aerospace 05 00109 g009
Figure 10. Histogram of daily values for ATMAP score at Frankfurt airport (FRA): mean of hourly ATMAP measures (above), variance of hourly ATMAP measures, sum of delay minutes per day, and multiplication of these values (below) to indicate relevant weather events.
Aerospace 05 00109 g010
Figure 11. Weather/delay progress considering dangerous events.
Aerospace 05 00109 g011
Figure 12. Weather/delay progress considering freezing events.
Aerospace 05 00109 g012
Figure 13. Airport classification according to annual IFR departures in Europe (2013).
Aerospace 05 00109 g013
Figure 14. Distributions for (a) arrival and (b) departure delays at airports at different local weather conditions (cumulative density function).
Aerospace 05 00109 g014
Table 1. Data set of airport related flights.
DateAirport (IATA)Arrival/
Departure
AircraftFlight IDScheduled
Time (min)
Actual
Time (min)
Delay (min)
FromToArrivalDeparture
2013-03-13FRAPMIdeparture320AB9872395750359355
2013-03-13FRATXLdeparture320AB6552395−32,000−32,000−32,000
2013-03-13FRABRUdeparture319LH10044004437243
2013-03-13FRAZRHdeparture319LH11824004114911
2013-03-13FRATXLdeparture321LH17040544112636
2013-03-13FRALCYdepartureE90CL9264054478242
2013-03-13CAIFRAarrival321LH581405394−11−31,000
2013-03-13FRAPMIdeparture738AB332841045911849
2013-03-13FRABREdepartureCR7CL344104363226
2013-03-13STRFRAarrival319LH12741544126−31,000
Table 2. Main components of Meteorological Aviation Routine Weather Report (METAR) message.
ParameterMeasurementMETAR Code (Example)
winddirection azimuth in degrees/speed [kn]06010KT
visibilityhorizontal visibility [m]7000
precipitationsignificant weather phenomenon−SN
cloudcover/hight ∗ 100 [ft] above aerodrome levelBKN019
temperatureair/dew point [C]M03/M06
pressureSea-level pressure (QNH) [hPa]Q0998
(TAF) (NOSIG)
Table 3. Weather classes defined in the ATM Airport Performance (ATMAP) algorithm.
Weather ClassDescriptionMeteorological ConditionsCoefficient
(1) ceiling and visibilitydeterioration of visibility (from “non-precision approach” up to “low visibility”)precision approach runways: CAT I-IIImax. 5
(2) windstrong head-/cross-wind, also gusts.Wind speed > 16 knots (+gusts)max. 4 (+1)
(3) precipitationsRunway friction influencing runway occupancy times. Complex procedures for runway clearing.e.g., rain, (+/−) snow, frozen rainmax. 3
(4) freezing conditionsReduced runway friction, de-icing: additional taxi out times.T ≤ 3 C, visible moisture or not, any precipitation.max. 4
(5) dangerous phenomenaDangerous for aircraft, unsafe operations, unpredictable impact.towering cumulus (TCU)/ cumulonimbus (CB), cloud cover, (+/−) shower.3–24
(+/−) phenomena (e.g., thunderstorm)18–24
Table 4. Calculation of ATMAP weather score using local airport METAR messages from Frankfurt and Munich airport.
Weather(1)(2)(3)(4)(5)ATMAP
ClassVisibilityWindPrecipitationFreezingDangerousScore
METAR
(Frankfurt)
EDDF 241320Z 03007KT 9999 −SN FEW012 SCT018 BKN025 01/M02
Q1013 R07L/295 R07C/295 R07R/295 R18/5//295 NOSIG
measurement999903007KT−SN01, −SN-(sum)
coefficient002305
METAR
(Munich)
EDDM 082120Z 25006KT 3200 SHSN FEW005 SCT018CB BKN025 M00/M03
Q1015 TEMPO...
measurement320025006KTSHSNM00, SHSNSCT018CB, SH(sum)
coefficient00341522
Table 5. Comparison of two exemplary days with approx. similar ATMAP weather scores.
DateATMAP(1)(2)(3)(4)(5)Cancellation Rates
ScoreVisibilityWindPrecipitationFreezingDangerousArrivalDeparture
27 November 20134.721.870.000.832.020.002%2%
12 March 20134.830.450.122.471.770.0058%64%
Table 6. Parameters set for the Burr distributions.
IFR (Instrument Flight Rules) Annual Departure Movements
≤50,000[50,000, 100,000]>100,000
λ ck λ ck λ ck
Daily Average ATMAP Score0Arrival50.448.320.7350.107.350.7648.598.220.64
1 50.709.000.6251.347.240.7349.928.140.61
2 50.858.980.5650.018.010.6150.098.020.56
3 50.0310.560.4250.367.400.5947.758.920.41
4 48.5814.680.2652.137.810.6350.747.560.50
5 50.1825.380.1254.966.630.7150.357.850.41
≥6 no data54.687.290.5365.065.220.71
0Departure51.7521.230.2952.0463.420.1053.0123.940.24
1 51.6921.190.2552.3758.190.1052.8226.670.19
2 51.9352.090.1051.3826.040.1852.3835.200.13
3 52.4228.690.1552.4221.630.1952.9829.140.14
4 54.5913.860.2855.4013.530.3453.4121.520.15
5 54.9231.570.1052.4318.580.1856.0515.260.24
≥6 no data54.1514.460.2061.3713.000.23

