1. Introduction
Ports for metering gas flow are used extensively in gas turbines, for example, in the internal air system, for blade cooling, and for combustor walls (and of course, there are many none gas turbine related examples). Despite an increased use of CFD in the design stages of combustors, good quality experimental data on discharge coefficients is still essential for validating and determining flow splits between the numerous ports. This is true in the initial design stage where one-dimensional flow network calculations are most appropriate, because these methods rely heavily on empirical correlations, and also in complex networks where hundreds of flow paths are possible. Rubini [
1] describes such a network methodology for combustor preliminary design and these methods continue to be used. With more complex cooling strategies in cooling tiles or turbine blades, similar approaches are used in cooling circuits, such as within turbine blades as in Kukutla and Prasad [
2], for example, where several hundred discharge coefficients are required to determine the network flow solution. Even in the detailed design phases, the CFD model requires at least some validation because air admission ports present their own difficulties to performing accurate predictions with a wide range of flow scales that require capturing. This is particularly true when sharp edges are present that result in significant separation and vena contracta formation. Moreover, the ports are often at a small scale compared with typical CFD grid cell sizes when full systems are modelled, and thus require significant grid distortion or local refinement to accurately define them. This is even worse if port inlet features such as radiusing, chamfering, or—as considered here—sharp steps are present, which are usually another order of magnitude smaller in scale than the port itself. The predicted discharge coefficient,
Cd, is also found to be sensitive to approach flow conditions that may not be well predicted or may be only crudely defined as a boundary condition to the calculation, as discussed by McGuirk and Spencer [
3].
Improving engine efficiency requires reducing parasitic losses. Cooling tiles have thus become desirable in modern engine combustors because they require less air for wall cooling than conventional cooling methods such as z-rings, as outlined in the literature [
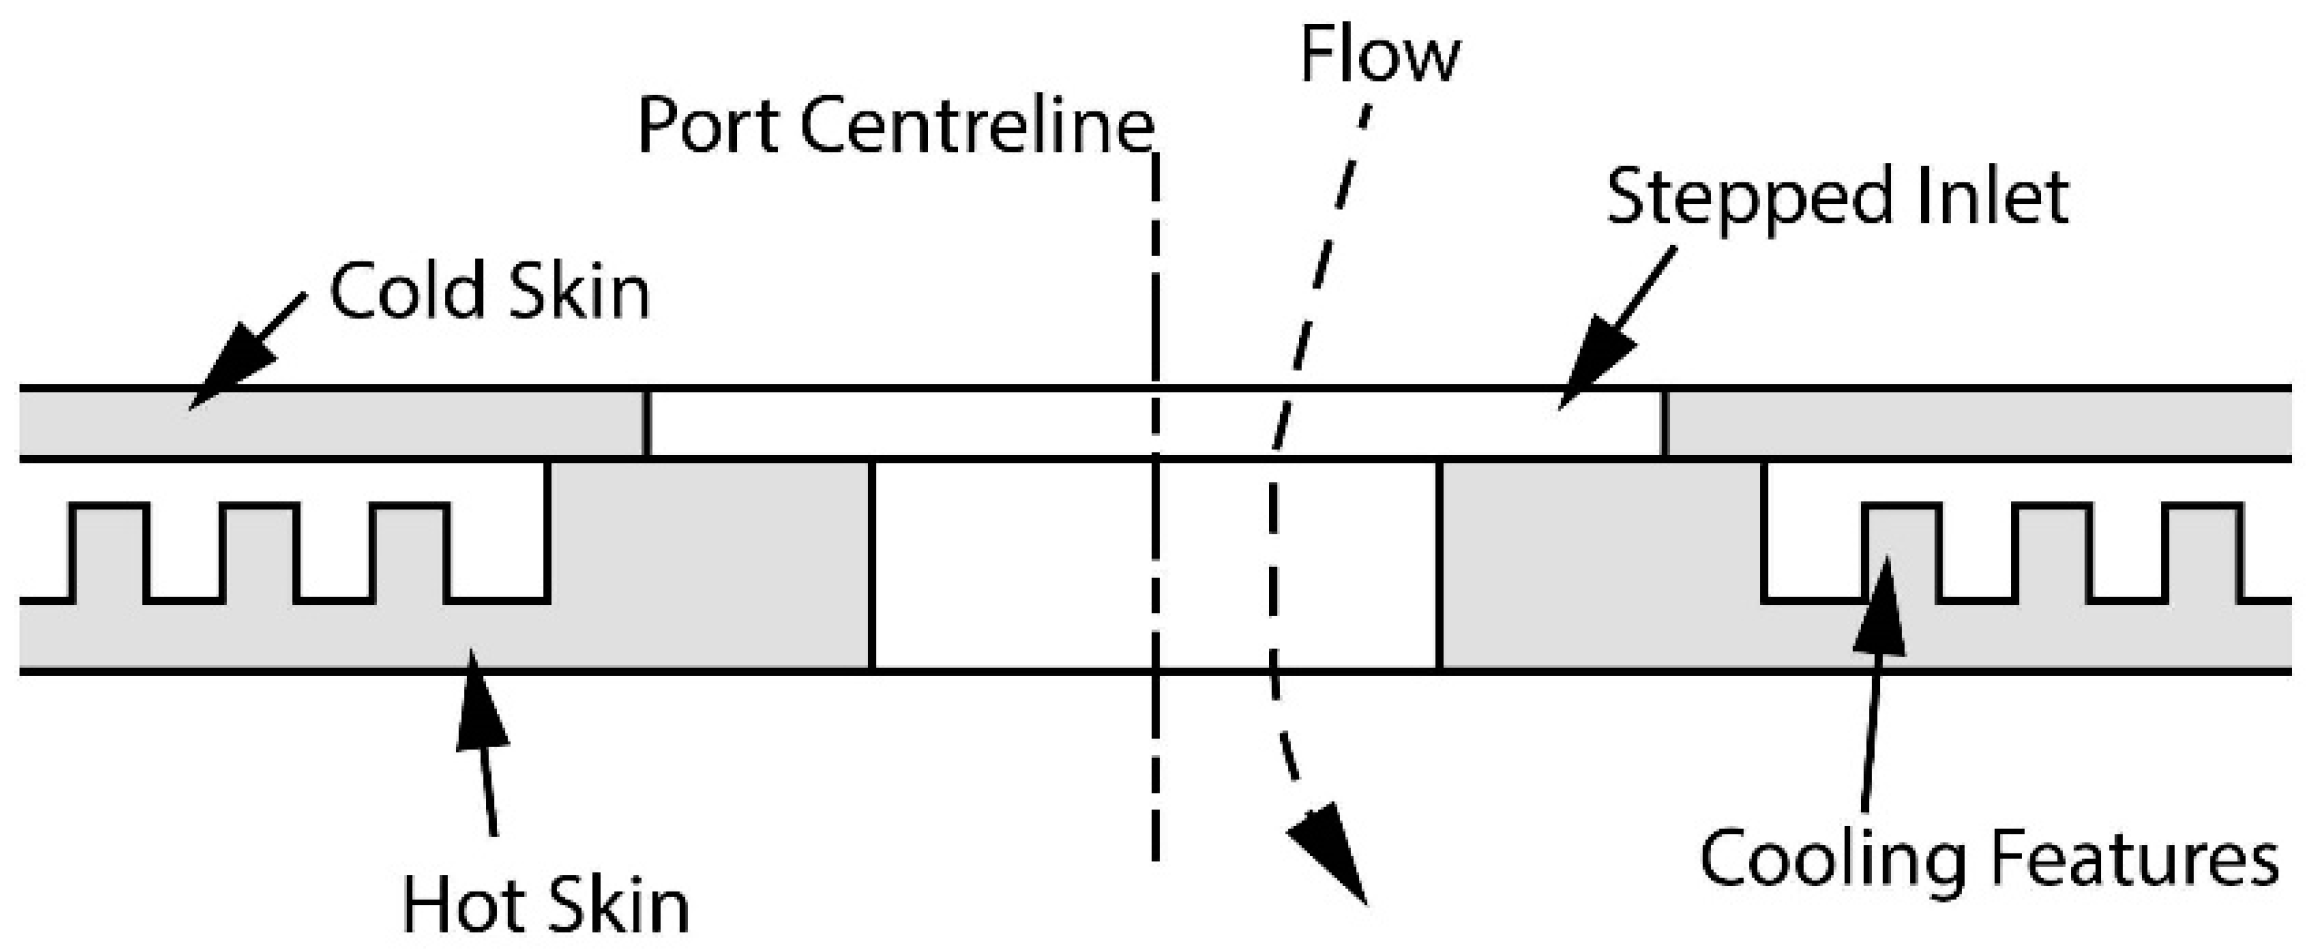
4]. This has led to a two-skin combustor wall construction shown schematically in
Figure 1, see the work of [
5] for an example of a patent application of this nature. The outer ‘cold’ skin provides the structural integrity of the combustor. The inner ‘hot’ skin, or ‘cooling tile’ provides the thermal barrier and wall cooling mechanisms between the flame and the cold skin. A primary air admission port thus must penetrate two skins. The outer skin hole is made larger than the inner skin hole to account for manufacturing and assembly tolerances, as well as differential thermal expansion. Without this provision, an inadvertent reduction in open area could result as the layers become misaligned—leading to a reduction in required flow rate. Of more concern could be the regions of hot gas recirculation behind the resulting ‘fence’ that could occur, leading to premature failure of the cooling tile.
Cold skin thickness for a combustor liner tends to be of the order 1 mm and the cooling tile effective thickness can be around 5 times this value. Much of the hot skin thickness is the result of the pedestals and similar features usually employed between the two skins, but a ‘boss’ feature provides a sealing land between the port flow and the cooling feature flow paths. The outer skin hole is typically larger than the inner skin hole by at least a similar magnitude as the cold skin thickness. A chute at exit from the cooling tile may be required to direct the resulting jet in a desired direction, typically these are half a port diameter in length. With typical port diameters of 10 to 25 mm in size using such construction, the main geometric parameter ranges of the port of interest in this study can be determined. Described here as stepped inlets, they could also be called shallow counterbore holes.
It is well known that small features at the inlet of a port can have a large effect on the discharge coefficient of a port. Ports with inlet radiusing have been the focus of many studies (for example, [
6,
7]), and it is found that as the inlet radius is increased, as is the discharge coefficient. The rate of increase is large initially, but the coefficient asymptotes towards a value close to 1 as the inlet radius exceeds the port diameter. These findings have been codified as empirical correlations, such as McGreehan and Schotsch [
8] and, more recently, Feseker et al. [
9]. Chamfered ports are also investigated in the works of [
6,
7], but there are few other examples. It is found for a given chamfering angle that a significant increase in discharge coefficient is achieved very quickly with chamfer depth to port diameter ratio of only 0.08. Beyond this depth to diameter ratio, little or no further increase in
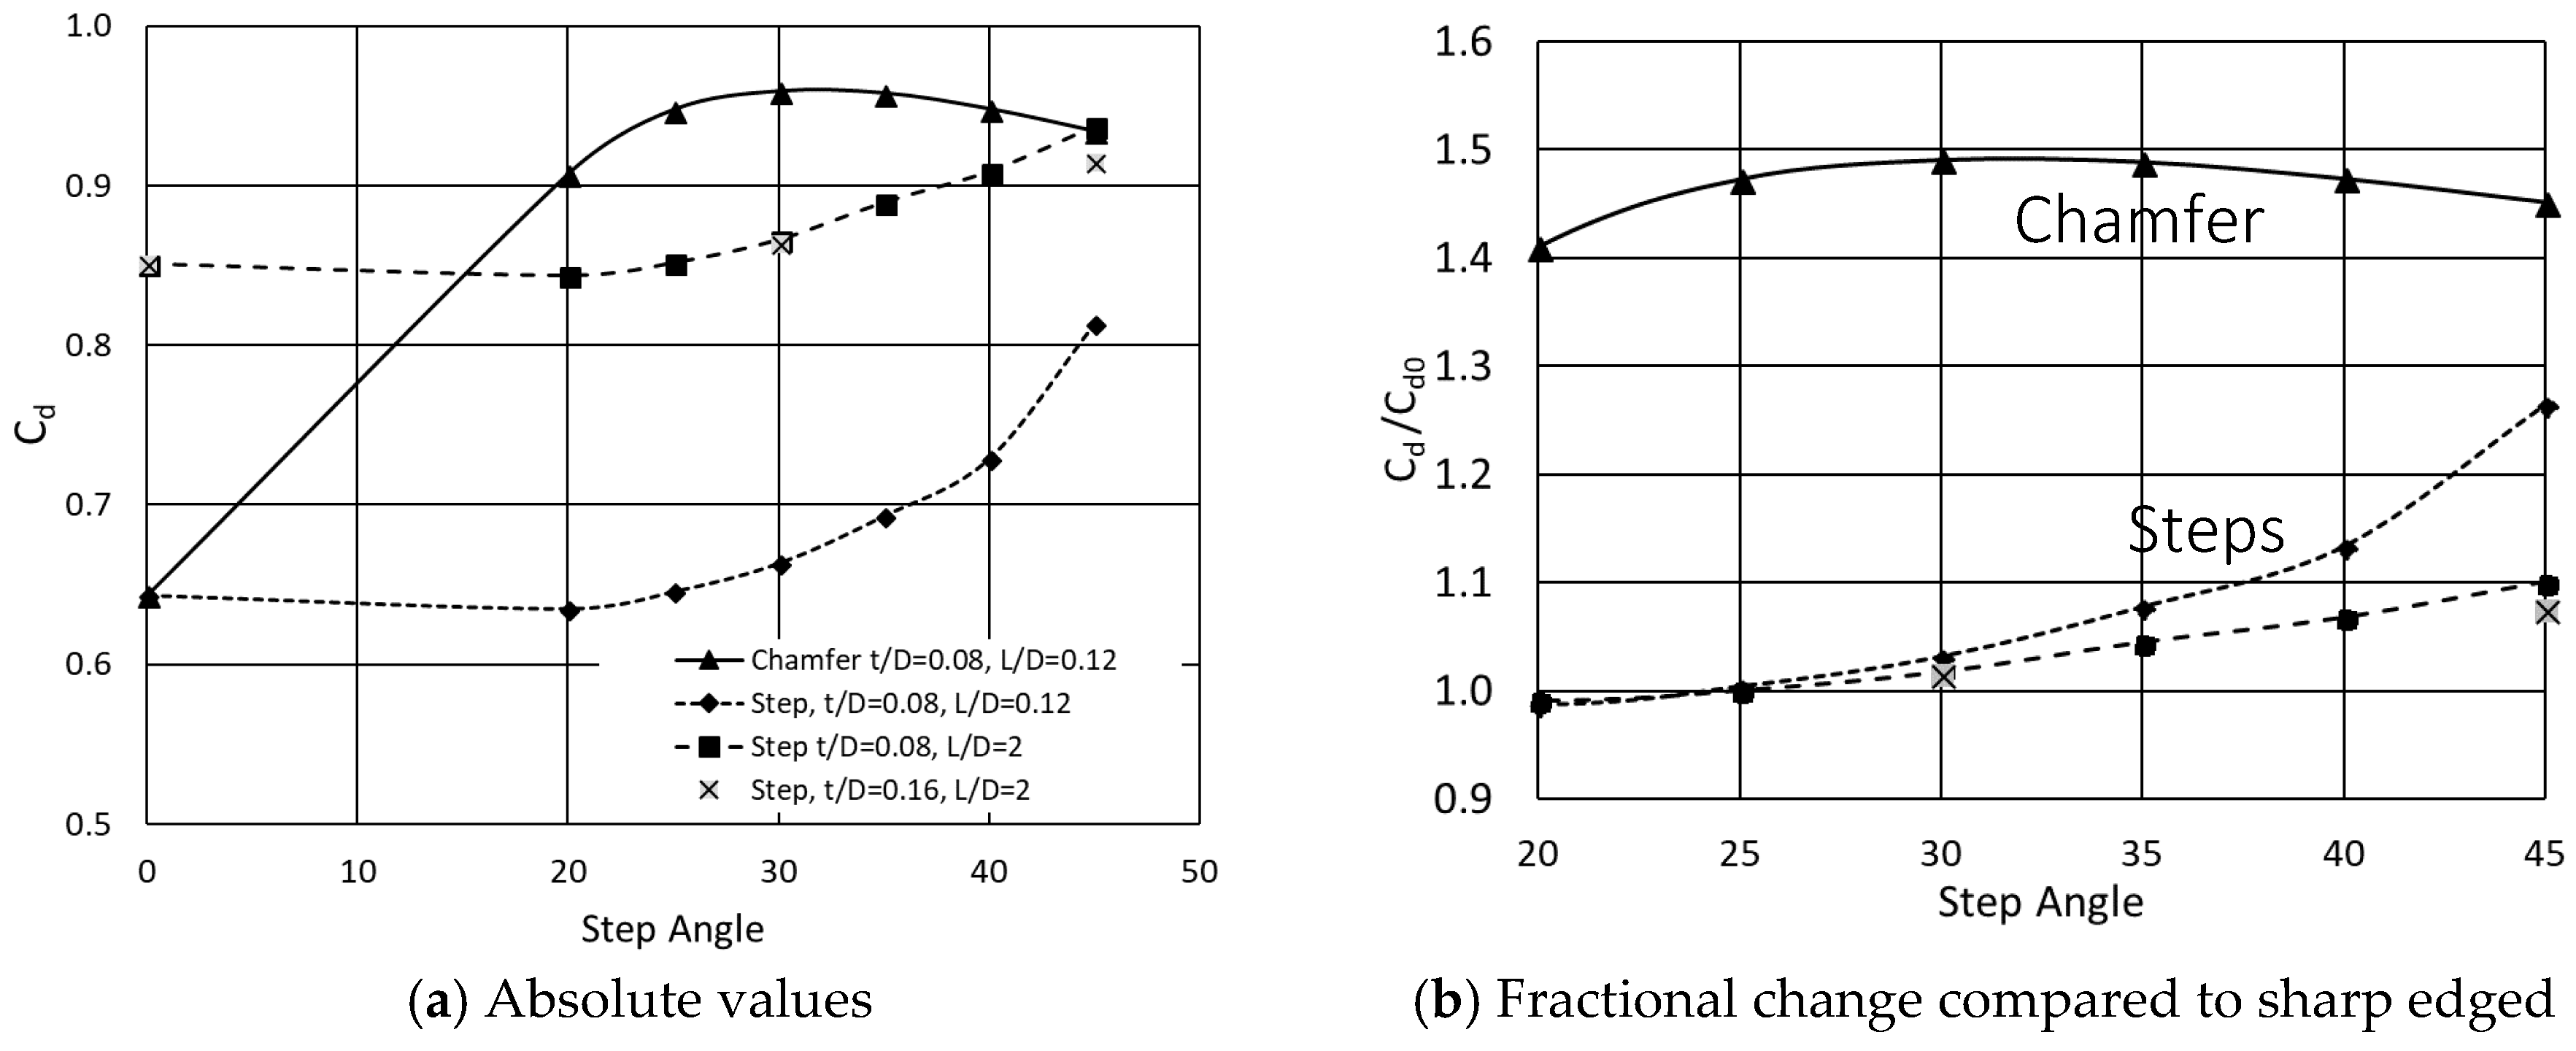
Cd is found. The discharge coefficient of chamfered ports is found to be less sensitive to the flow conditions than radiused ports. Empirical correlation for chamfer effects have been presented in the literature [
9] for holes that have a chamfer angle of 45°, but otherwise empirical relationships are not available for chamfering because of the limited data available to calibrate them. Naturally, the increase in discharge coefficient brought about by chamfering is dependent upon the chamfer angle with a maximum found at a chamfer angle of around 30°. Once a given depth of chamfer is achieved, the discharge coefficient is found to be fairly insensitive to chamfer depth [
6] and chamfer tooling mis-alignment [
10], making them attractive because of the lower manufacturing tolerances required to produce them.
Other parameters, such as port length to diameter ratio, Reynolds number, and proximity to other ports, also influence the discharge coefficient. These effects have been the subject of previous research and several empirical correlations exist, but are not investigated in detail here. Interdependence between the port inlet shape and these other parameters is found to be small, provided that the inlet feature is small compared with the port diameter and length. The first of these criteria is easily met within the context of this work, with step sizes typically being an order of magnitude smaller than that of the port diameter. Port length could be important in terms of the reattachment of flow within the port. Separation of the flow from a sharp-edged port takes around half a port diameter to reattach. Once this occurs, pressure recovery within the port leads to an increase in the discharge coefficient. With inlet shaping, the resulting increase in discharge coefficient implies a reduction in the size of flow separation at inlet, thus reattachment will occur much sooner. For the stepped ports described without chutes, it is probable that the flow is marginally reattached and further comment will be given on this.
All these geometrical and crossflow effects on discharge coefficient discussed above have been summarized by various empirical correlations. Notable ones and those relevant here are McGreehan and Schotsch [
7], Chin et al. [
11], Adkins and Gueroui [
12], and more recently Fesker et al. [
9], which allow prediction (within typical experimental uncertainty) of a port discharge coefficient to be determined. Each uses a different methodology and base flow parameters and each has their own limits of applicability. The effect of stepped inlets on discharge coefficients is currently not reported in open literature and not included in any available correlation methodology. It is thus difficult to predict combustor pressure loss without an indication of their effect. Indeed, a recent full-scale test of a combustor with stepped ports performed very differently than expected because sharp-edged port discharge coefficients had been assumed. Without hindsight, this is perhaps a reasonable assumption. The combustor total pressure loss was close to 20% lower than its design value and had weaker jet penetration than required.
The objective of this work is thus to test stepped holes with crossflow feed for port ingestion fractions of 30% to 100% (i.e., annulus bleed ratios, α, 0–70%). This will include investigating the effect of changing the port diameter to feed annulus height and step angle, for example. Benchmarking the stepped port against plain port data is useful to determine the influence of the step and provide validation of the experimental techniques. An initial indication of how to include the effect of the inlet step on the Cd can then be made.
These tests do not consider the effects of compressibility or explore full ranges of geometrical parameters that are already well captured by existing Cd correlations (such as length to diameter ratio (L/D), for example). Instead, only two or three values of other main parameters are studied to ensure stepped port behavior is consistent with these existing correlations and exhibits no significant coupling between the step feature geometry and other parameters.
2. Materials and Methods
A water flow rig has been used for most measurements in which a single row of multiple ports is fed by an annular crossflow and the jets issue into a crossflow, as in a combustor, this also allows for a bleed flow stream, where the port only receives a fraction of the approaching cross flow. Flow through the ports are at supercritical jet Reynolds numbers above which it is found that there is little variation in
Cd, quoted in various works to be between 1.8 × 10
4 and 3.5 × 10
4 [
13,
14]. Reynolds number variation in
Cd has been tested in this work in the range 5 × 10
4 to 2 × 10
5, which has agreed with these previous works and all results presented are for jet Reynolds numbers above 5 × 10
4. Results from both rigs agree with previous studies, within experimental uncertainty. Other numerous parameters affecting discharge coefficients have been studied previously and several empirical correlations exist to describe each of their behaviors.
2.1. Water Flow Facility
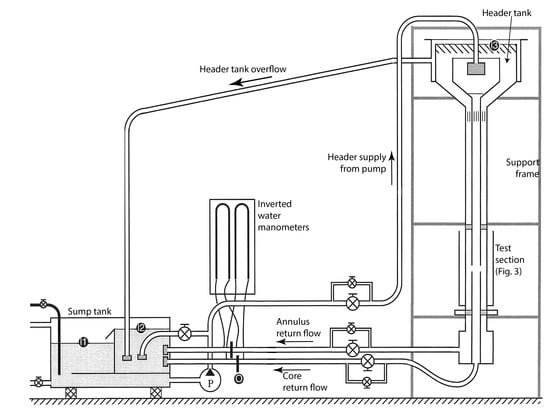
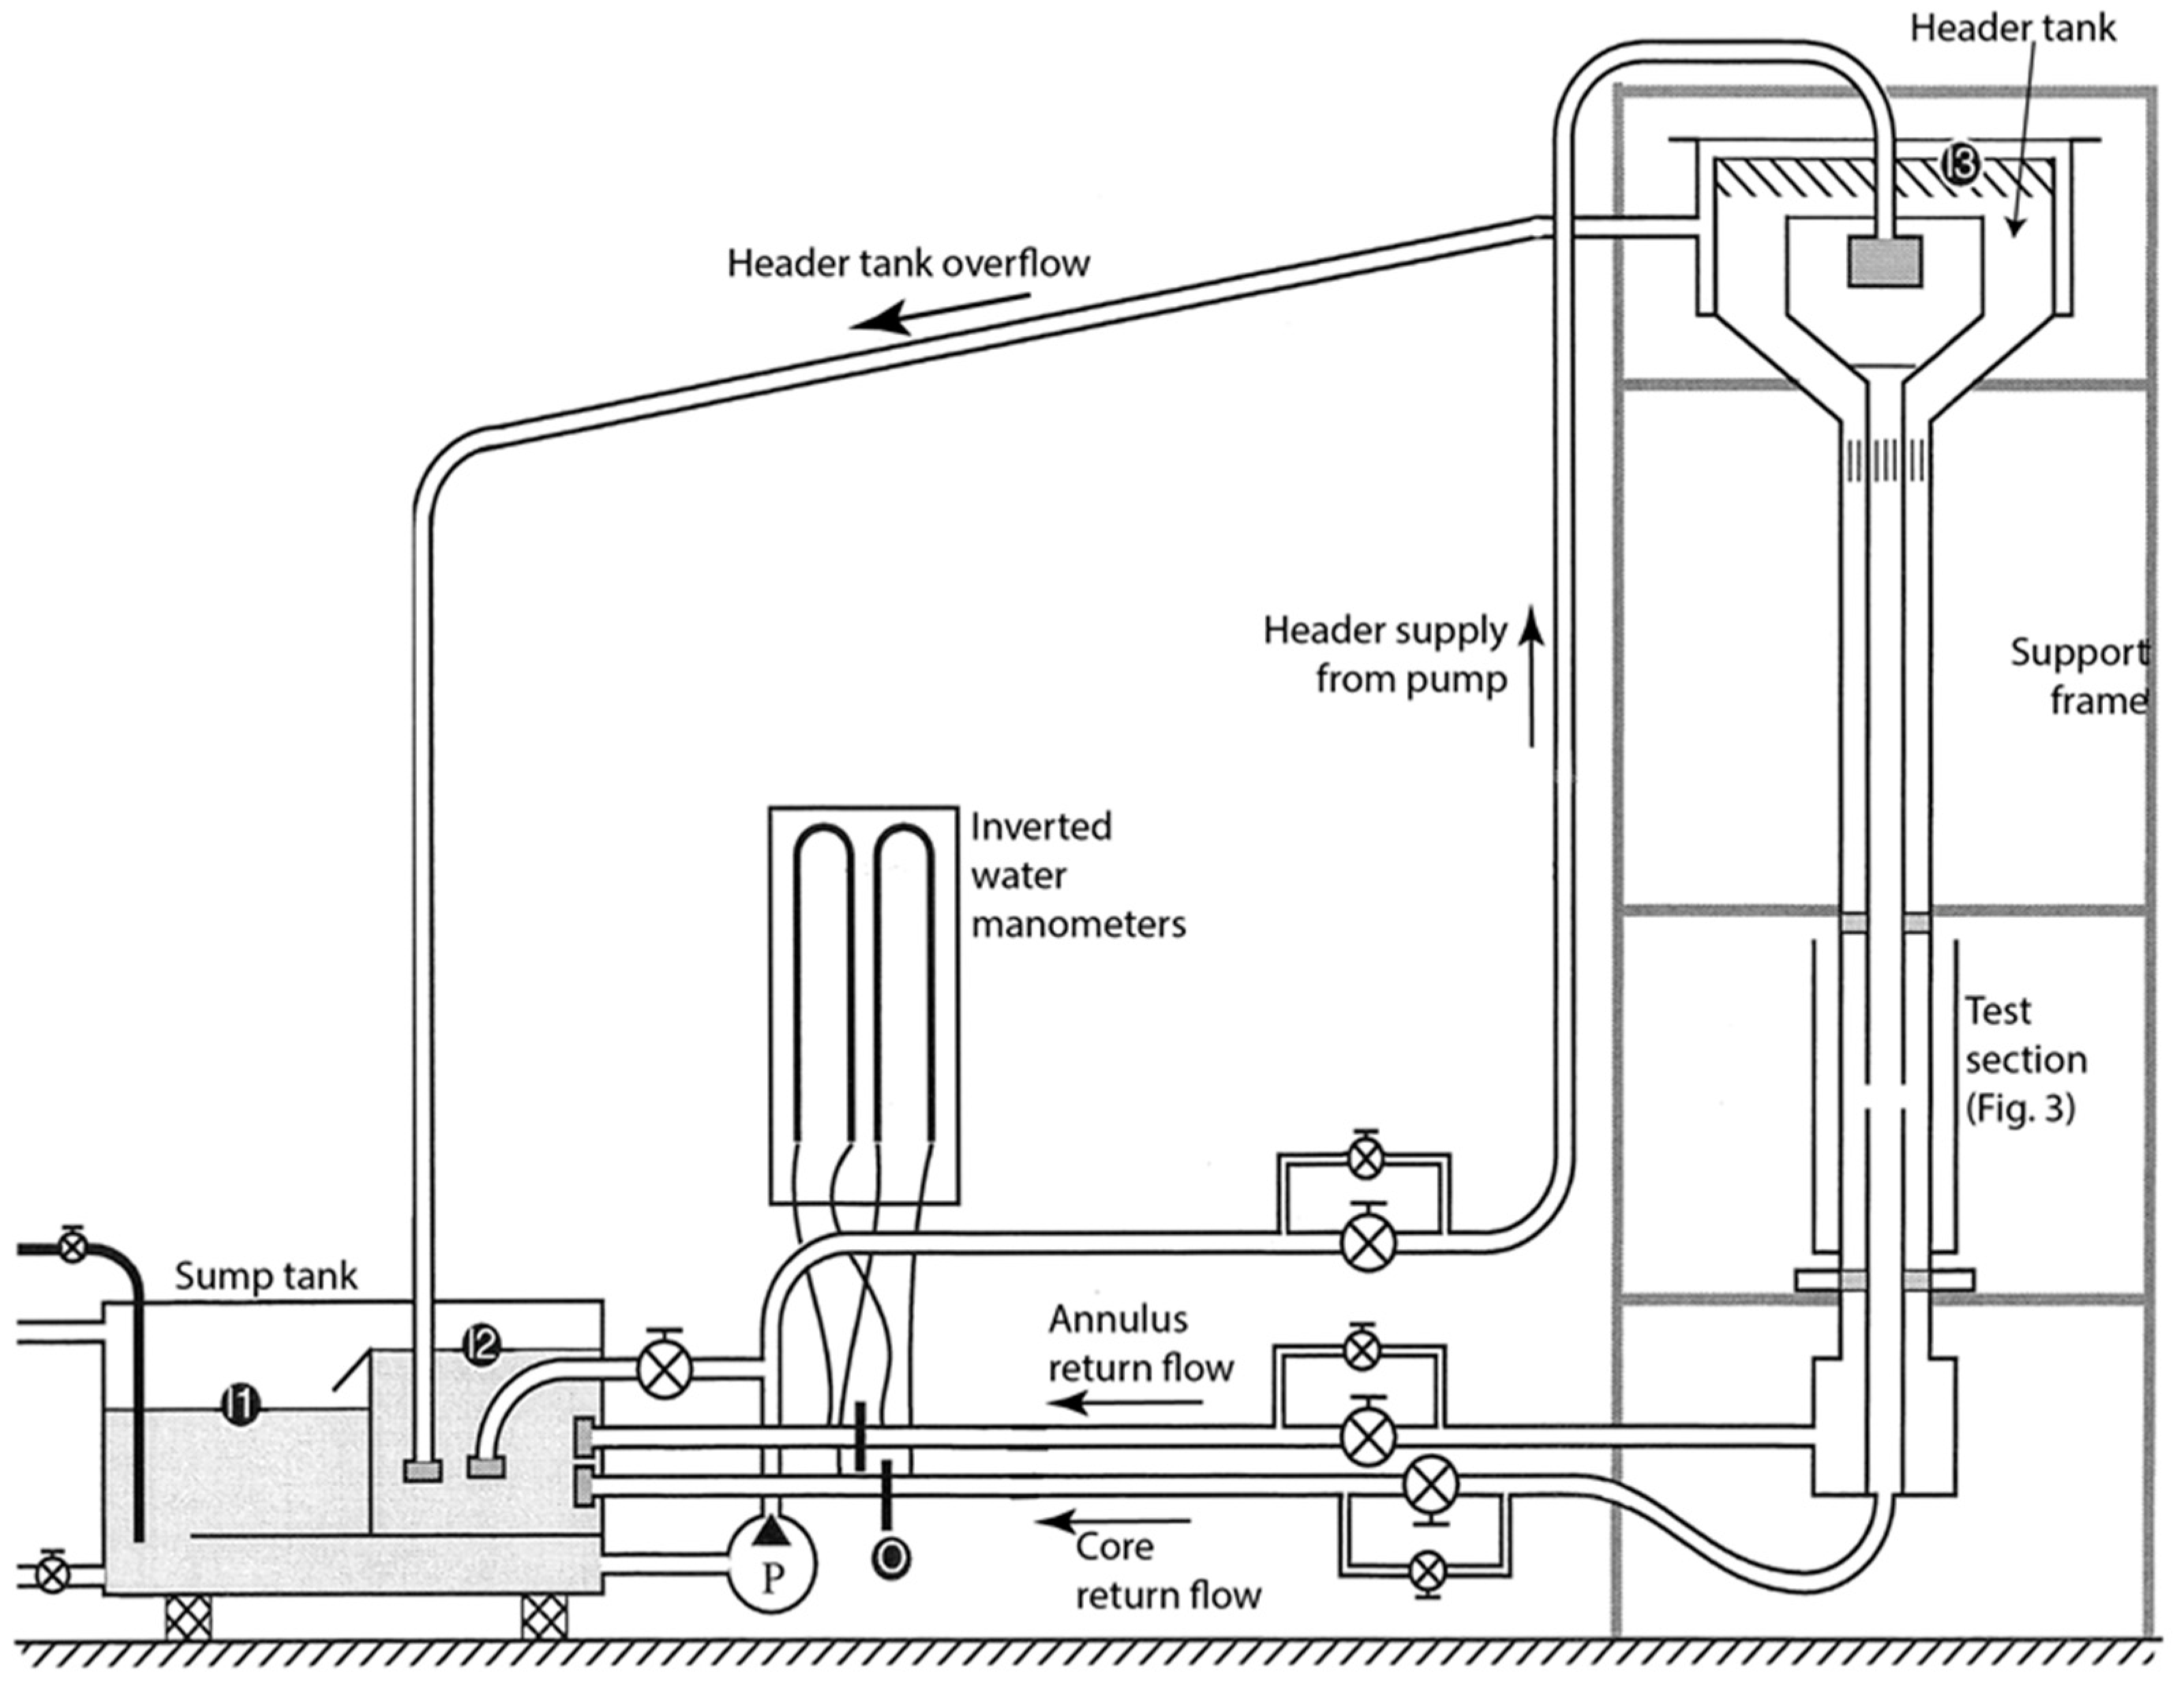
The test rig is an isothermal, vertically flowing, constant head, water flow rig.
Figure 2 shows a schematic of the rig, and it is described in detail in McGuirk and Spencer [
15]. The test section has two inlet flows and two outlet flows that can be controlled by two return flow valves and one inlet valve to provide a range of jet Reynolds numbers, jet to downstream cross flow ratios, and annulus bypass flow ratios independently. Setting these three parameters effectively defines the mass flows through each path of the test section.
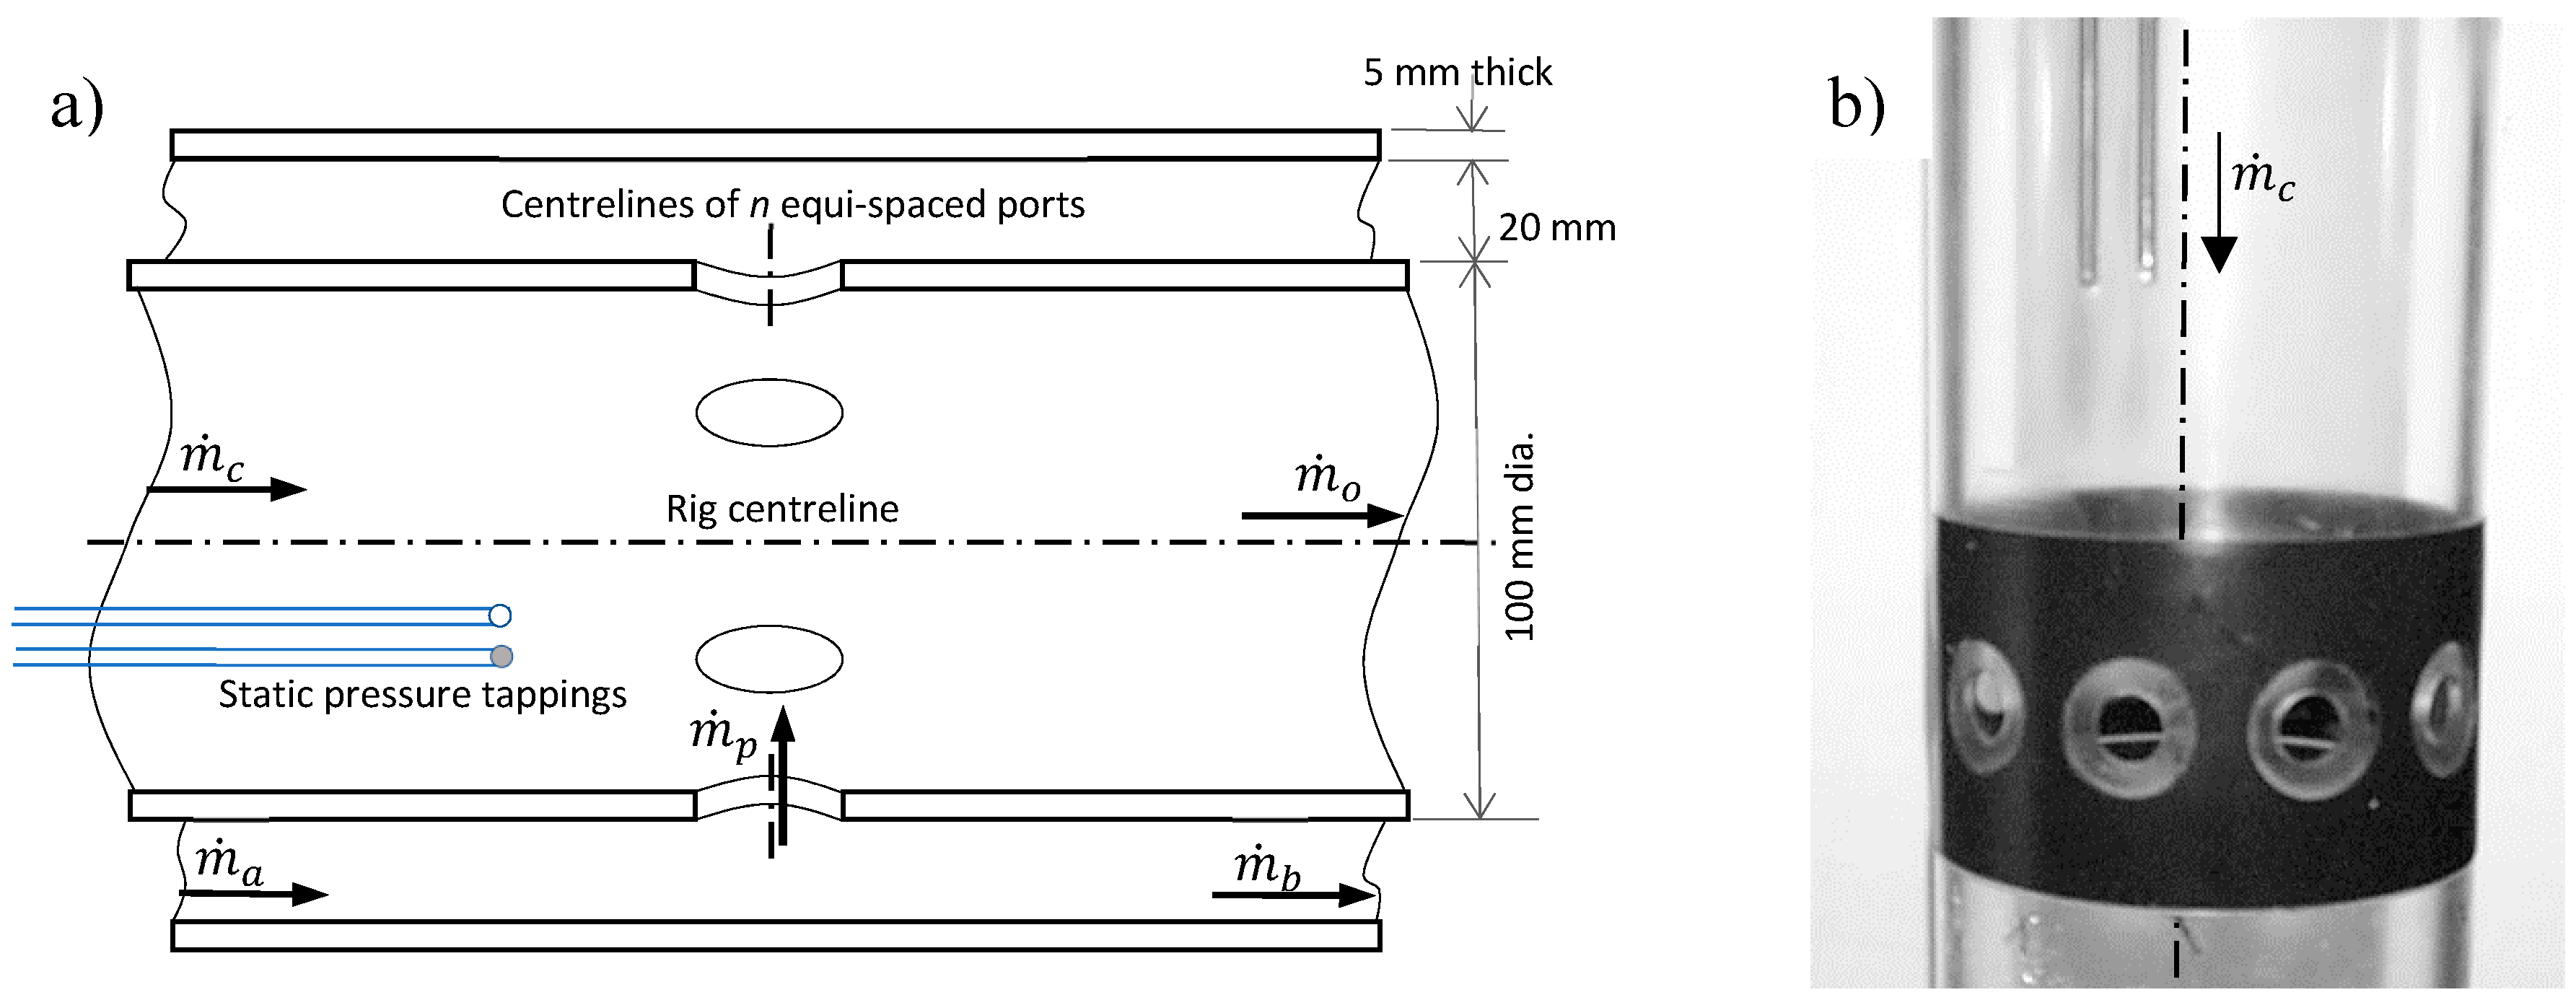
The working section shown in
Figure 3 is comprised of two circular 600-mm long pipes, the inner one being held concentric with the outer at each end via a set of six NACA 0015 struts. The inner pipe contains the ports approximately half way along its length. Wall static pressure tappings were positioned 70 mm upstream of the ports on the inner and outer surface of the liner to monitor the wall static pressure drop.
The liner pressure tappings are seen in
Figure 3 embedded in the Perspex wall of the inner liner, which has been removed from the test rig in the right-hand photograph. The tapping location was positioned upstream to avoid regions of recirculation within the core pipe induced when low internal crossflow to jet velocities are used. It has previously been investigated if the jet to downstream crossflow velocity ratio has any effect on discharge coefficients and findings have shown the effect to be less than 1%, provided the measurement of liner pressure drop is not influenced by the tapping location. The inner liner can be rotated, and this had no effect on the pressure measurements, giving confidence in the axisymmetric nature of the approach flows. More details on these aspects can be found in Spencer [
16]. Using water as an essentially incompressible media implies the findings can be equated to port behavior in air at low pressure ratios. The behavior of compressibility is well captured by existing discharge coefficient correlations through compressibility corrections, for example, in the works of [
7,
9,
11], and is thus not considered further.
2.2. Airflow Facility
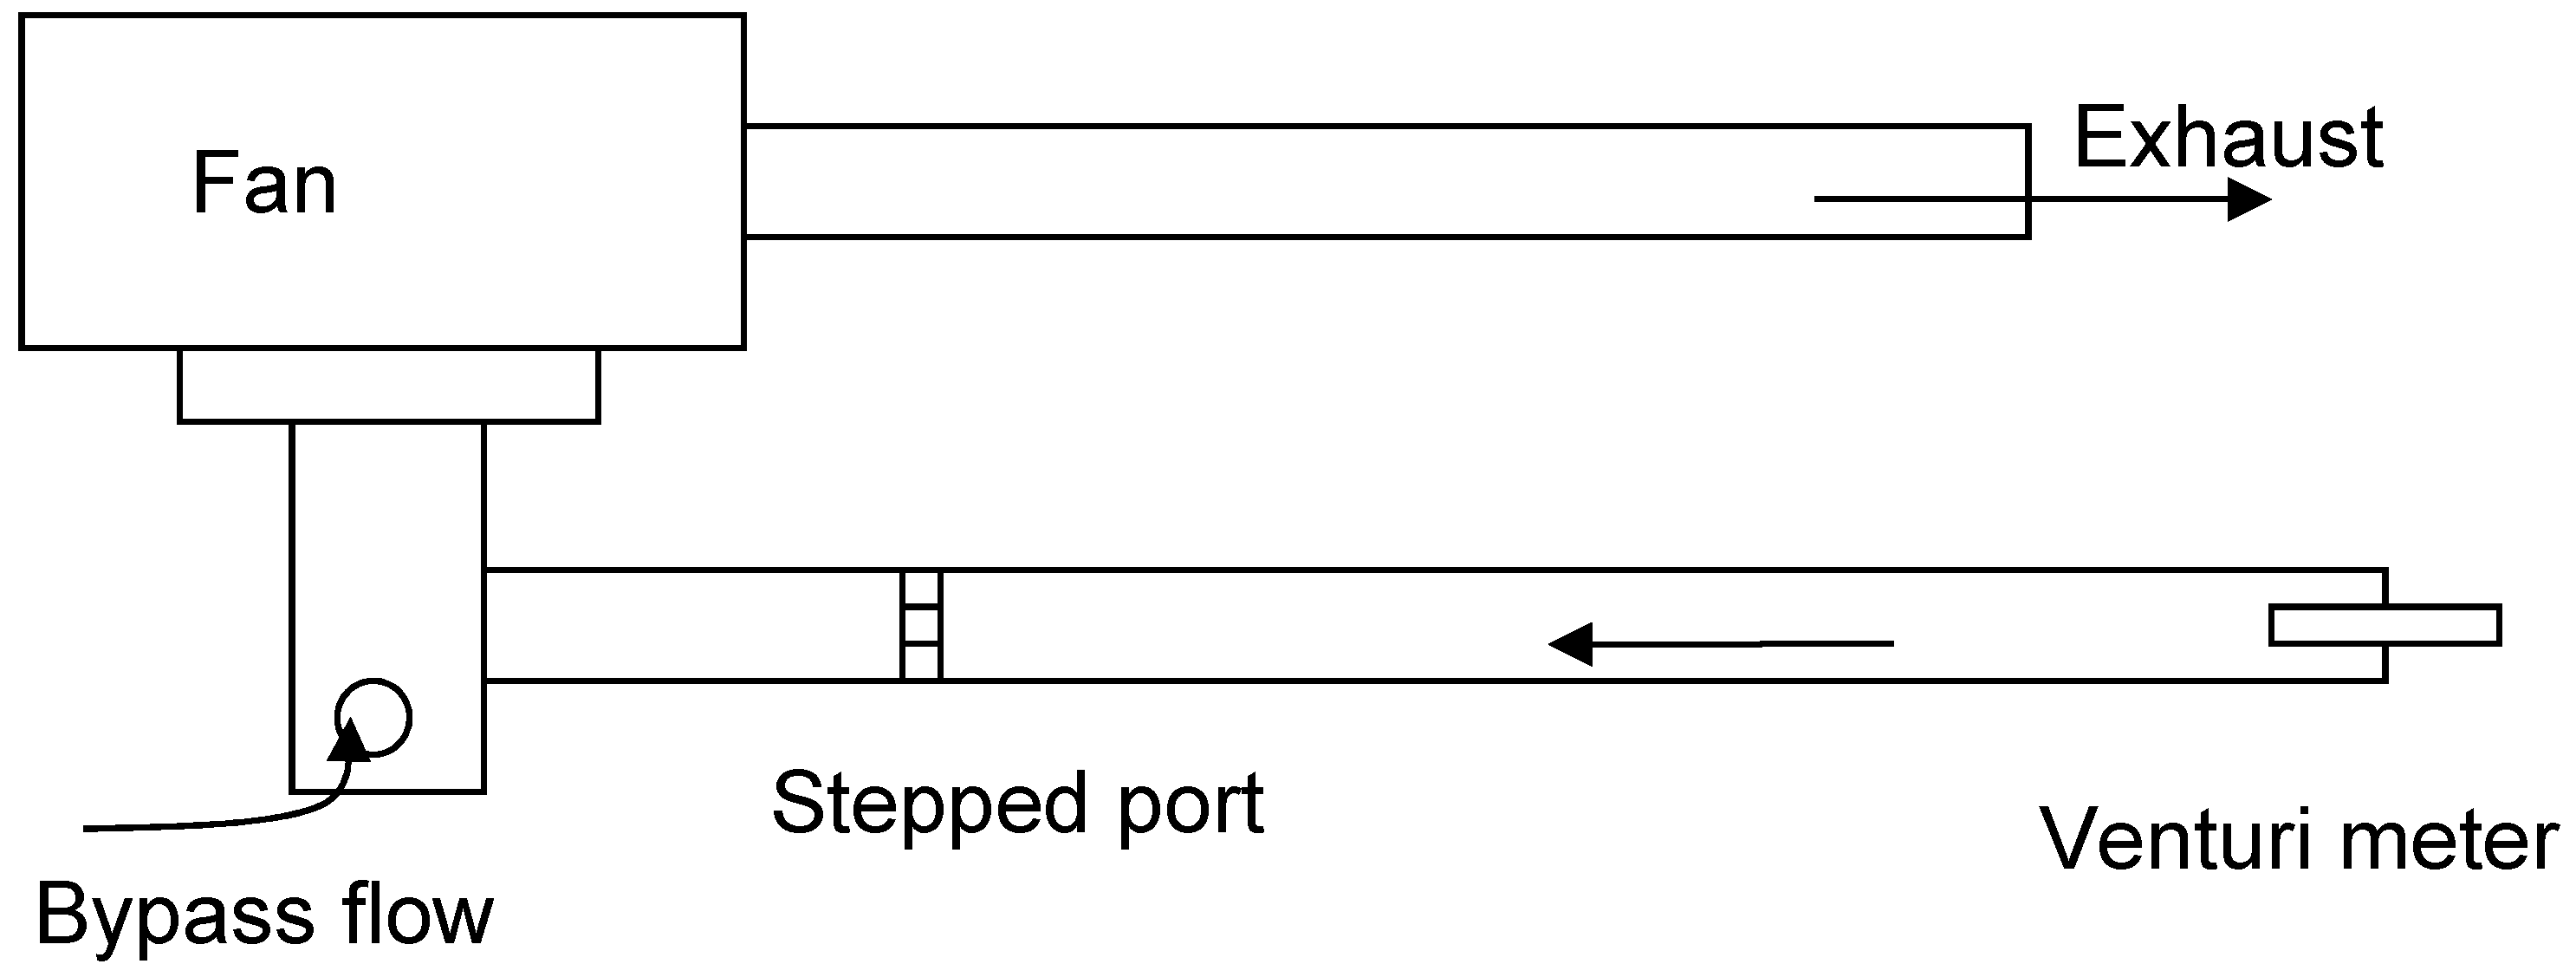
Shown in
Figure 4 is the open circuit air flow rig that was used to compliment the main body of work. In the final results section, a short study is presented on axis-symmetric flow through ports with stepped inlets, and compares this with ports of similar chamfered dimensions. A centrifugal fan draws air through the stepped port by creating a low-pressure region behind it. A bypass flow is allowed into the fan to ensure the fan operates in a stable, non-stalled condition that would occur otherwise. The stepped port is fed by a 2.5-m long, 90-mm internal diameter pipe downstream of a 30-mm diameter venturi meter, which measures the mass flow through the stepped port. Static pressure ports are positioned 50 mm upstream downstream of the stepped port to determine the pressure drop across it. Equipment, methods of instrumentation, and data reduction are all in line with simplified versions of what is presented for the water flow results.
2.3. Instrumentation
It was important to know actual port mass flow and port pressure drops to determine the port discharge coefficient. Temperature is recorded to determine viscosity for Reynolds number and density of water is taken as a 1000 kg/m3.
Three types of instrumentation were used for this study: orifice plates were used to measure the flow rates exiting the test section (core and annulus), a 1D laser Doppler anemometer was used to measure the velocity profiles entering the test section (again, core, and annulus), and finally a pressure transducer was used to measure the liner pressure drop. With these measurements, the discharge coefficient could be calculated, as will be described in the next section. These devices are described in a little detail below and summarized in
Table 1, but for a fuller description, refer to Spencer [
16].
Orifice plates were used to measure the return flow from the annulus and core passages of the test section. Designed and made to BS 1042, the uncertainty in the orifice plate’s Cd obtained from the Stolz equation was always below 2.0% (refer to the standard for further details). The pressure drop across each plate was monitored using an inverted water manometer connected to D and D/2 static pressure tappings. Typically, each return mass flow rate could be measured to better than ±2.5% over the flow conditions used for these tests. This has been verified by checking the measured outlet mass flows against the mass flows obtained by integrating the Laser Doppler Anemometer (LDA) determined diametral velocity profiles through the annulus and core of a blank test section (i.e., with no ports).
A 1D LDA system was used to measure the axial velocity profiles 150 mm upstream of the ports in both the annulus and core inflow streams. By assuming the flow at inlet is axis-symmetric, the mass flow rate into the core and annulus may be obtained by integration of the measured axial velocity profiles. Within the core, the assumption of axis-symmetry has been shown to be good. However, in the annulus, a circumferential variation is found because of the six struts used to hold the liner concentric to the outer casing. It has been established that the effect of the wakes is that the actual mass flow rate is about 2% lower than if axis-symmetry is assumed. Only three mass flow rates are required to specify the flow split through the rig, as if the two exit and one of the inlet mass flow rates are known, then by mass continuity, the unknown inlet mass flow may be calculated. Because the annulus inlet mass flow rate was determined to have the highest error associated with its measurement, it was decided to use this purely as a check on the mass flow balance through the test section. It was considered acceptable if the inferred and measured annulus inlet mass flows agreed to within 3%. Considering the other three mass flows were measured to within 2.5%, this could be considered a stringent condition, however, all measurements reported were within this limit. Subsequent calculations requiring knowledge of the annulus mass flow rate used the value inferred from the other three measured values for consistency.
2.4. Data Reduction
Discharge coefficient is evaluated here by dividing the actual mass flow passing through the ports by the ideal mass flow, defined as follows:
and the port to annulus inlet mass flow ratio, α, calculated via the following:
noting that the annulus inlet mass flow is not used in any calculation to keep the uncertainty associated with
Cd and α minimised for the current experimental setup. Inputs to this calculation were the inlet axial velocity profiles, the exit orifice plate pressure drops, and the pressure transducer voltage. Calibration coefficients for each of these then allows the respective inlet, exit, and ideal mass flow rates to be calculated in kg/s.
Direct comparison was made between the inferred and measured value of annulus inlet mass flow rate of around 1% to 2% was found, which was typical of most tests, and for all measurements, the accepted maximum difference between measured and calculated annulus inlet mass flow rate was 3%, as previously stated.
Uncertainties were determined from the contributions from the individual measured value uncertainties for all measured conditions. In combining the sources of uncertainty, the overall absolute uncertainty in the discharge coefficient of 4% is calculated with 95% confidence for conditions with α > 0.5. This is typical of most measurements though, with the highest annulus bleed ratios (i.e., low α, of less than 0.4), the uncertainty rises to around 6% because of compounding the effect of port mass flow being derived from the decreasing difference of two mass flows. Taking into account only the systematic errors indicates that the repeatability of a typical test should be within 2.5%. The level of scatter within data supports these findings.
The port pressure ratio of the airflow tests was typically around 1.02 to obtain sufficiently high Reynolds numbers, but stay comfortably within an incompressible regime that has been assumed within the analysis. Peak through port velocities of the order 50 m/s were obtained. Again,
Cd is defined as the actual to ideal mass flow ratio and assuming constant density locally and using the calibrated venturi meter (
Cd,v = 0.994) as the reference (actual mass flow), the port
Cd was calculated using the following:
Airflow rig results are also at sufficiently high Reynolds numbers (the Cd is quoted as an average of the tests over the range 6 × 10⁴ and 3 × 10⁵) and uncertainty analysis shows the Cd is reported at better than 3% with 95% certainty.
2.5. Test Configurations
Several test sections were used for this study, one with plain sharp edged (
s = 0, or no step) circular port inlets for reference purposes, and the rest were representative of stepped ports, either full scale ports or two-thirds scale (based on a nominal port diameter,
D, of 18 mm). A typical test section as shown in
Figure 4 for the water flow rig will have several of these ports with a curvature in the through page direction as a result of the walls through which the port passes being cylindrical.
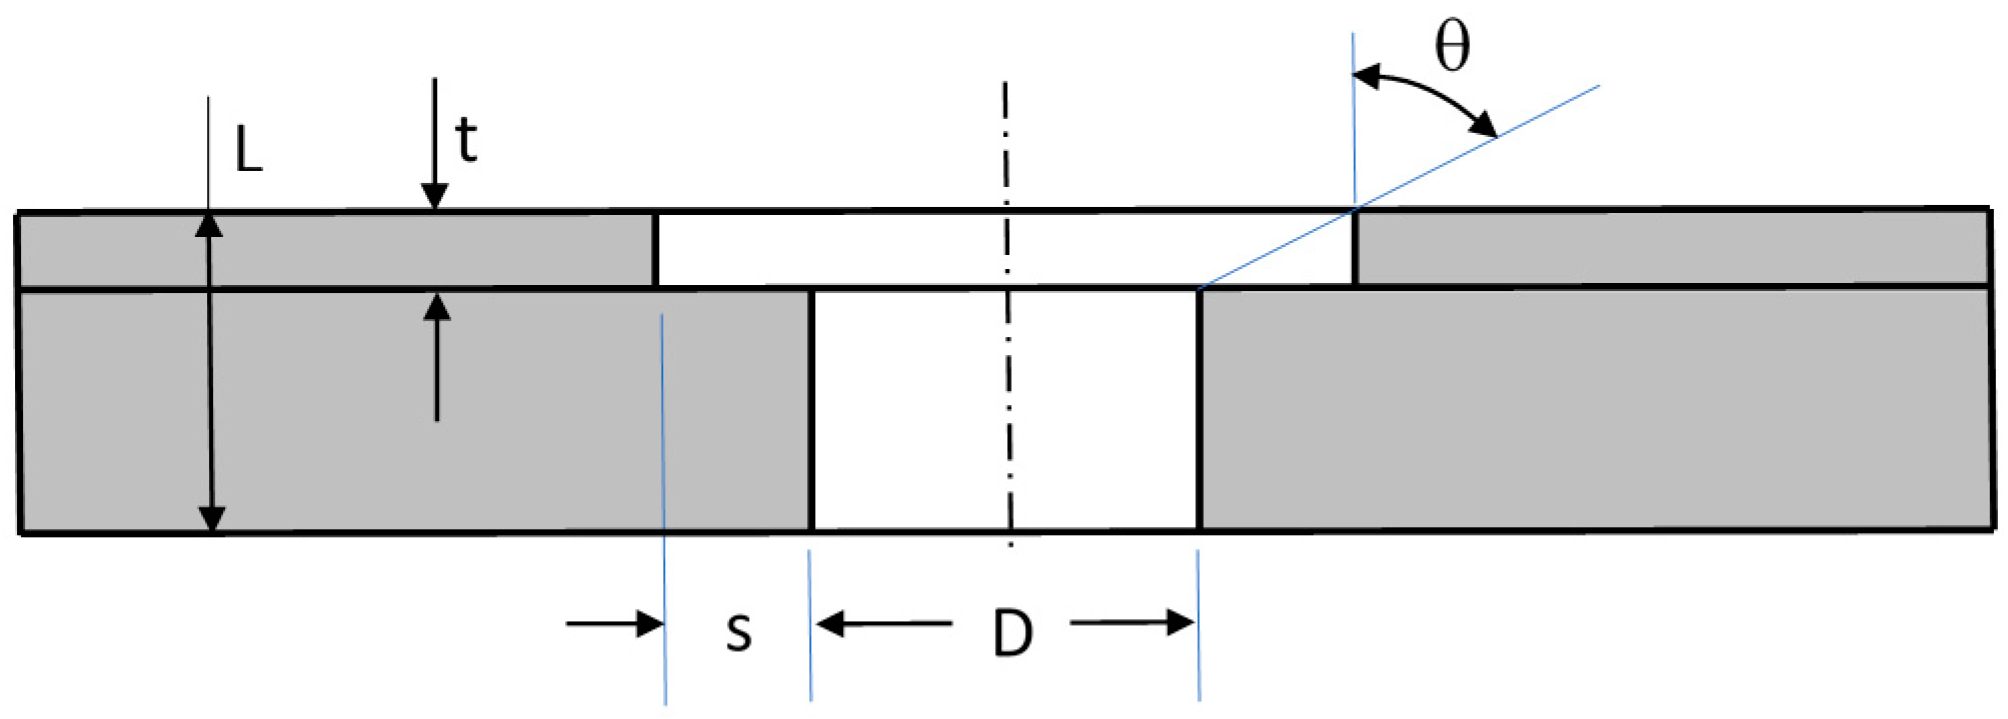
The dimensions of each test port can be seen parametrically in
Figure 5. This figure shows a cross section through the centreline of one port. It is clear to see how the step is formed by the two joined walls with holes of slightly differing diameters. A dimension not shown in
Figure 5 is the hole pitch spacing,
Z, for the waterflow measurements. This is the distance between port centres measured around the circumference—which will decrease as the number of ports increases. As shown in
Figure 3, the outer radius of the liner (outer wall) was fixed at 50 mm, and the annulus height,
H, was 20 mm, giving an outer annulus diameter of 70 mm. Some plain port validation work also included annulus heights of 5 mm.
Plain port measurement configurations are used to verify the measurement set taken and to benchmark against both
Cd correlation methods and the stepped port results are listed in
Table 2. Stepped port configurations are given in
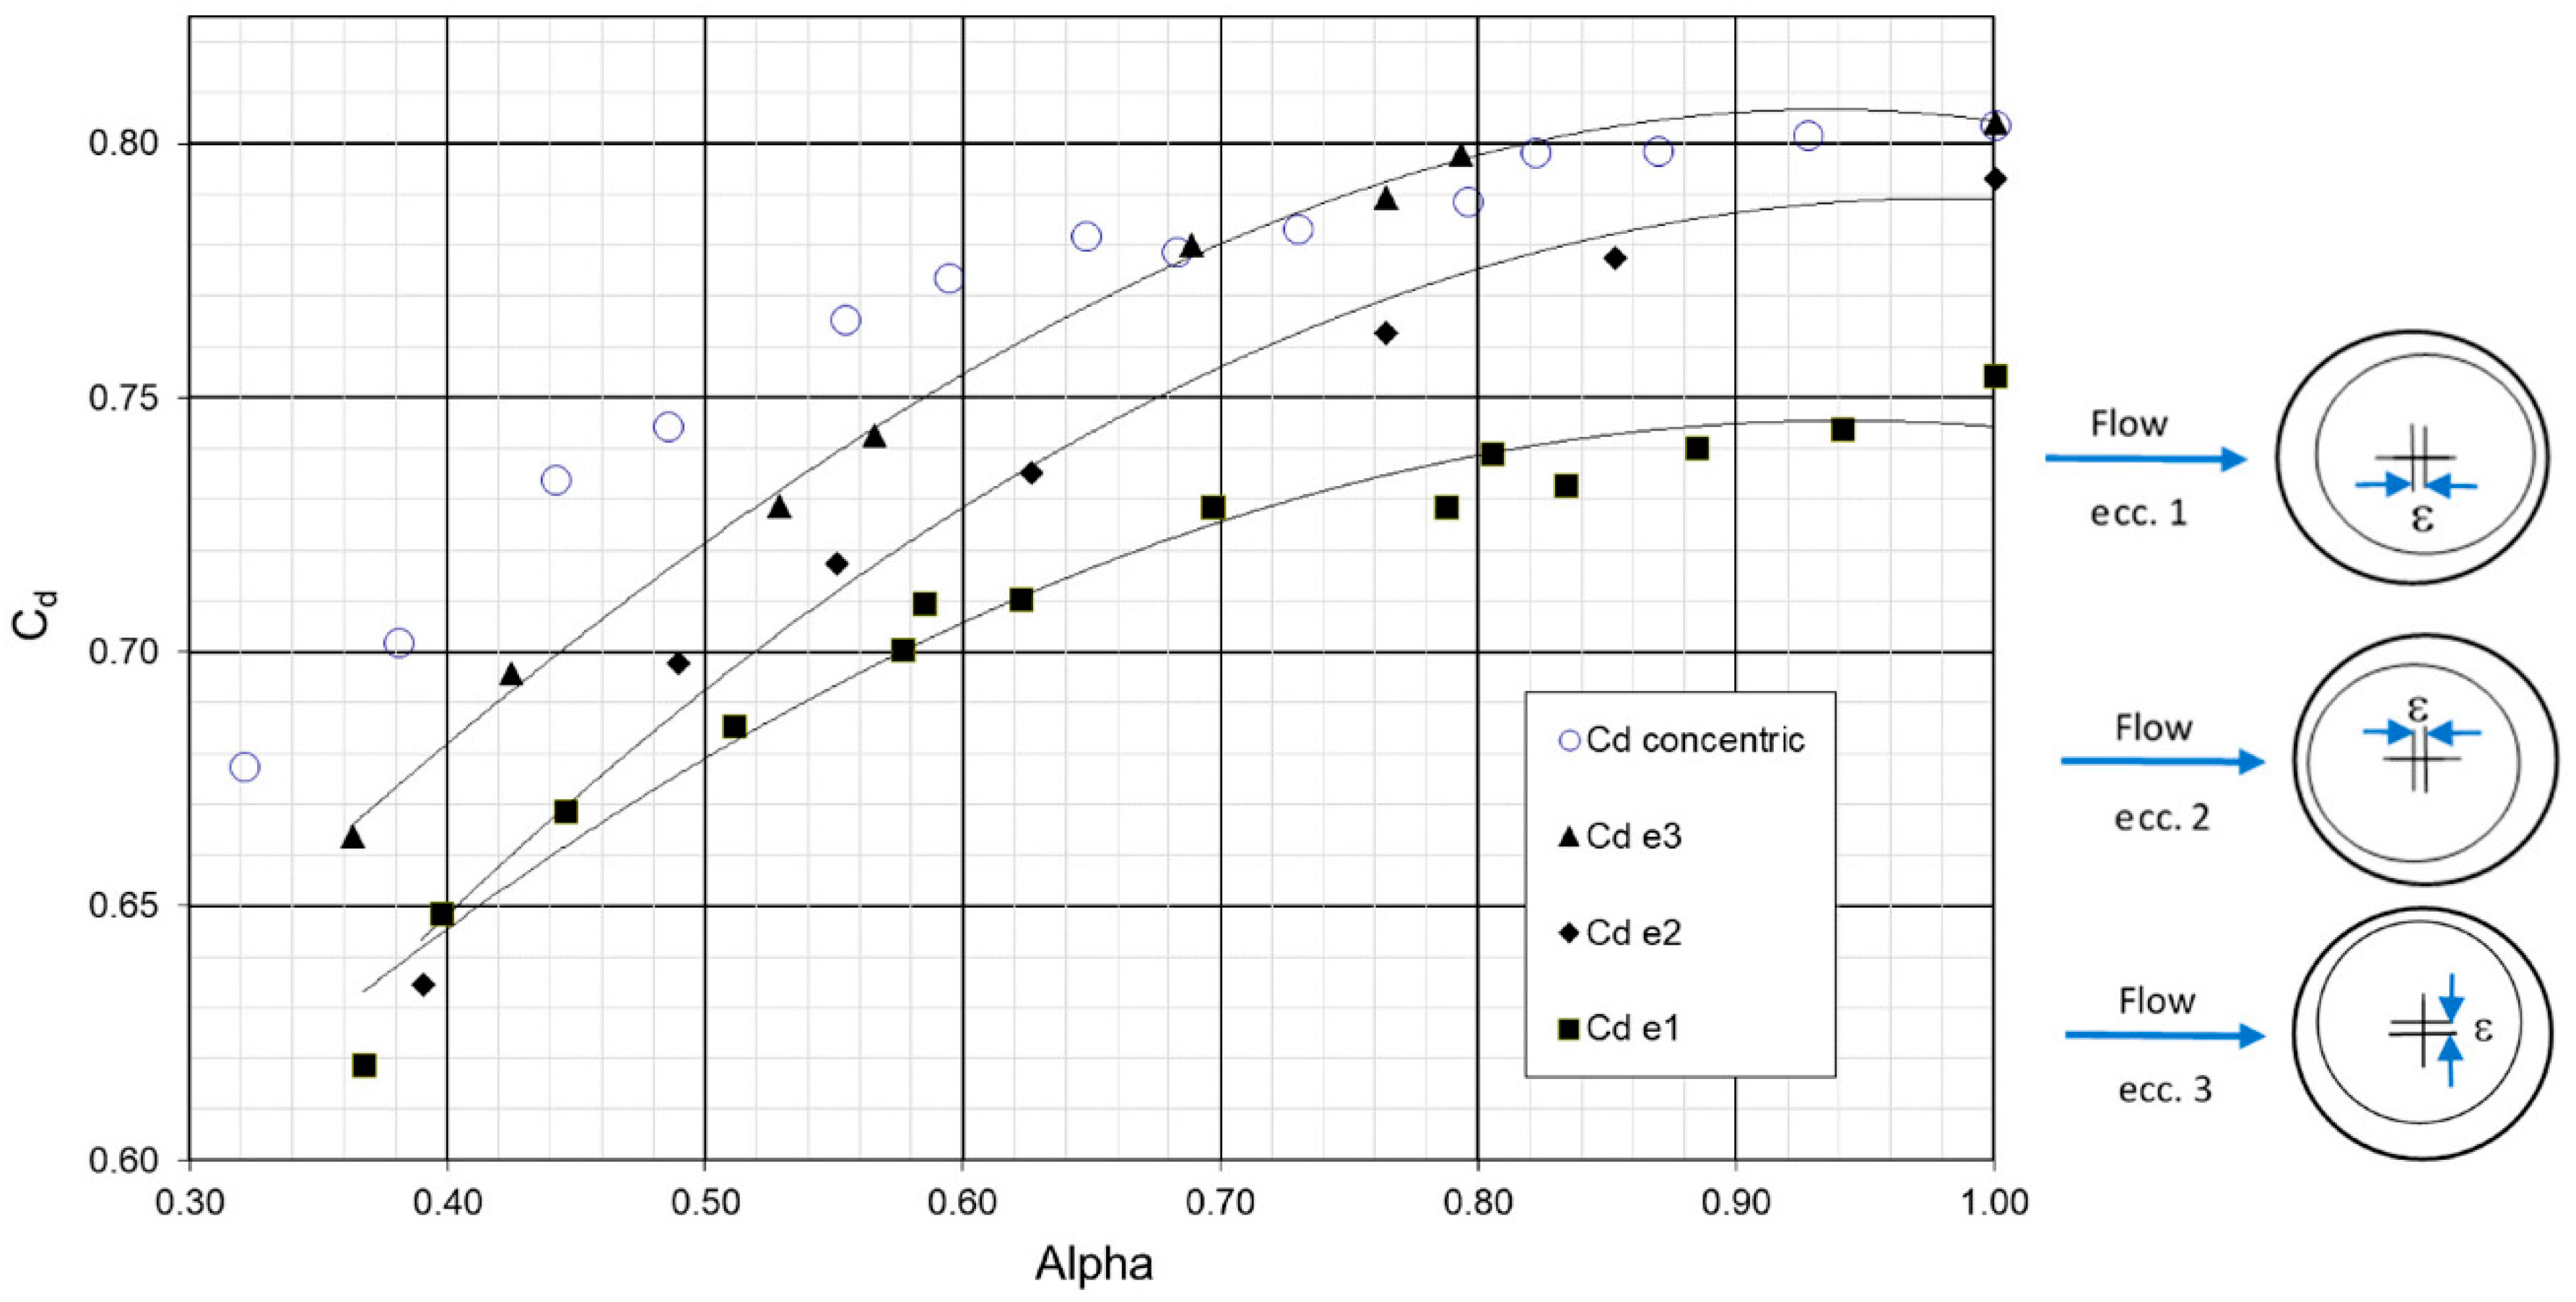
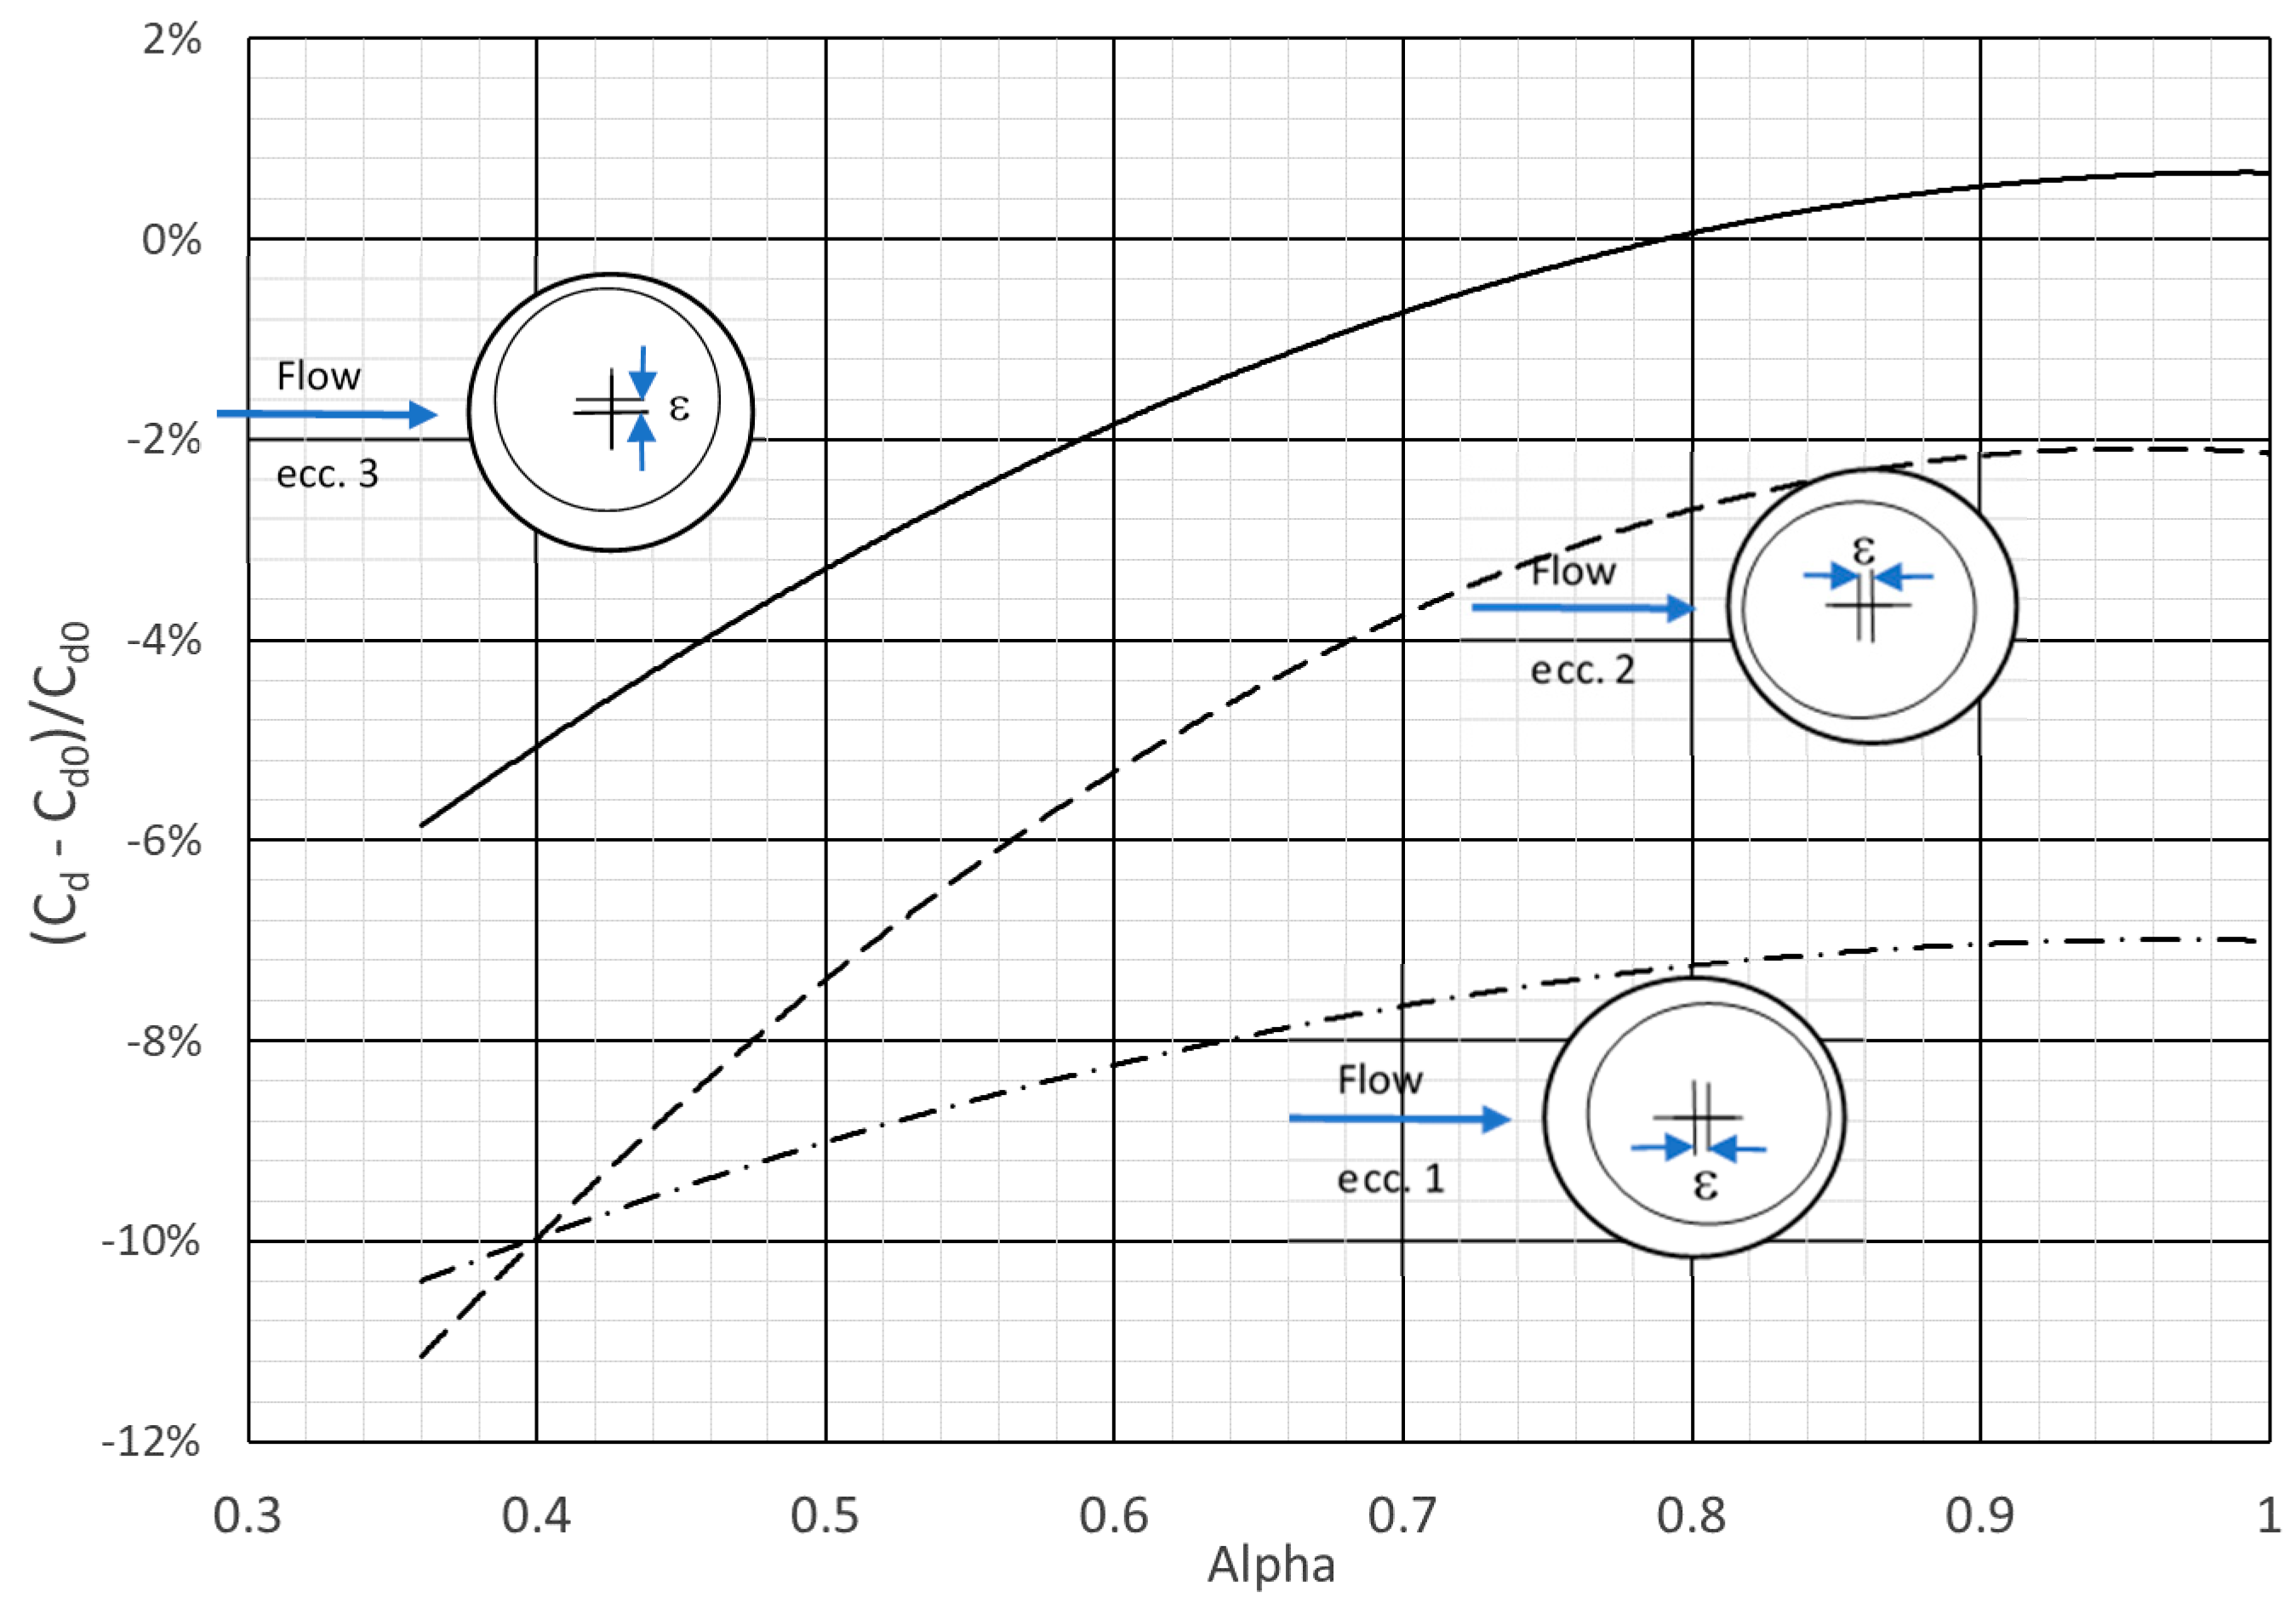
Table 3. The 12-mm diameter stepped ports are able to closely match all of the important geometric ratios found typically on an engine. Four step length, s, (hence four angles, θ) are considered for the 12 mm ports (cases A to D). At around two-thirds scale, it would be difficult to manufacture a test section with accurate eccentricity between the cold skin and tile ports. Approximately full-scale ports (diameter 18 mm) were thus employed to explore the effect of eccentricity in three directions, in which the outer sleeve could be moved relative to the inner ring to create the eccentricity (cases ε1, ε2, and ε3 have the cold skin upstream, downstream, and to one side of the smaller port, respectively). These are benchmarked against case E, which had no eccentricity but otherwise matched all other geometric parameters. To compare the effects of the step inlet to inlet chamfering, some airflow tests were also performed for single ports in axisymmetric flow with a range of step inlet angles comparable to the chamfering angles that had been considered in previous studies [
6]. These are reported separately at the end of the results section.
The port Reynolds number determines the port velocity for both the water flow and air flow tests, and hence for a given port size, also the port mass flow. This fully defines the airflow test condition. Two additional parameters are required to determine the crossflow conditions. (1) The proportion of the annulus inlet flow that is ingested by the port, α. This, combined with the absolute port mass flow, sets both the annulus inlet and outlet mass flow rates. The area ratio of the port to the annulus, β, then determines the annulus approach velocity. (2) Similarly, the core inlet mass flow is determined by the port to cross flow velocity ratio,
Vp/
Vc. Discharge coefficients are known to be insensitive to this parameter and no correlations feature in
Cd as a result. In these tests, the port jet to cross flow velocity ratio was kept in the range 2 <
Vp/
Vc < 5. Experience on the facility used here has shown no measurable change in
Cd in this range. However, exceeding a value of 5 for
Vp/
Vc can cause problems because the jet impingement becomes very strong and forms a recirculation large enough to give unsteady pressure measurements in the core, and was thus avoided. These flow conditions are summarized in
Table 4. Readers interested in further details, such as the approach flow velocity profiles, may see references [
3,
16].
4. Conclusions
A range of port configurations with stepped inlets have been tested with and without approach cross flow. Discharge coefficients have been measured and compared to plain port benchmark tests for validation purposes.
Stepped inlets at entrance to ports produce a significant increase of the port discharge coefficient.
For a stepped port geometry similar to a typical engine combustor primary port, an increase in Cd of 25% over the equivalent sharp-edged port was found (L/D = 0.25, t/D = 0.08).
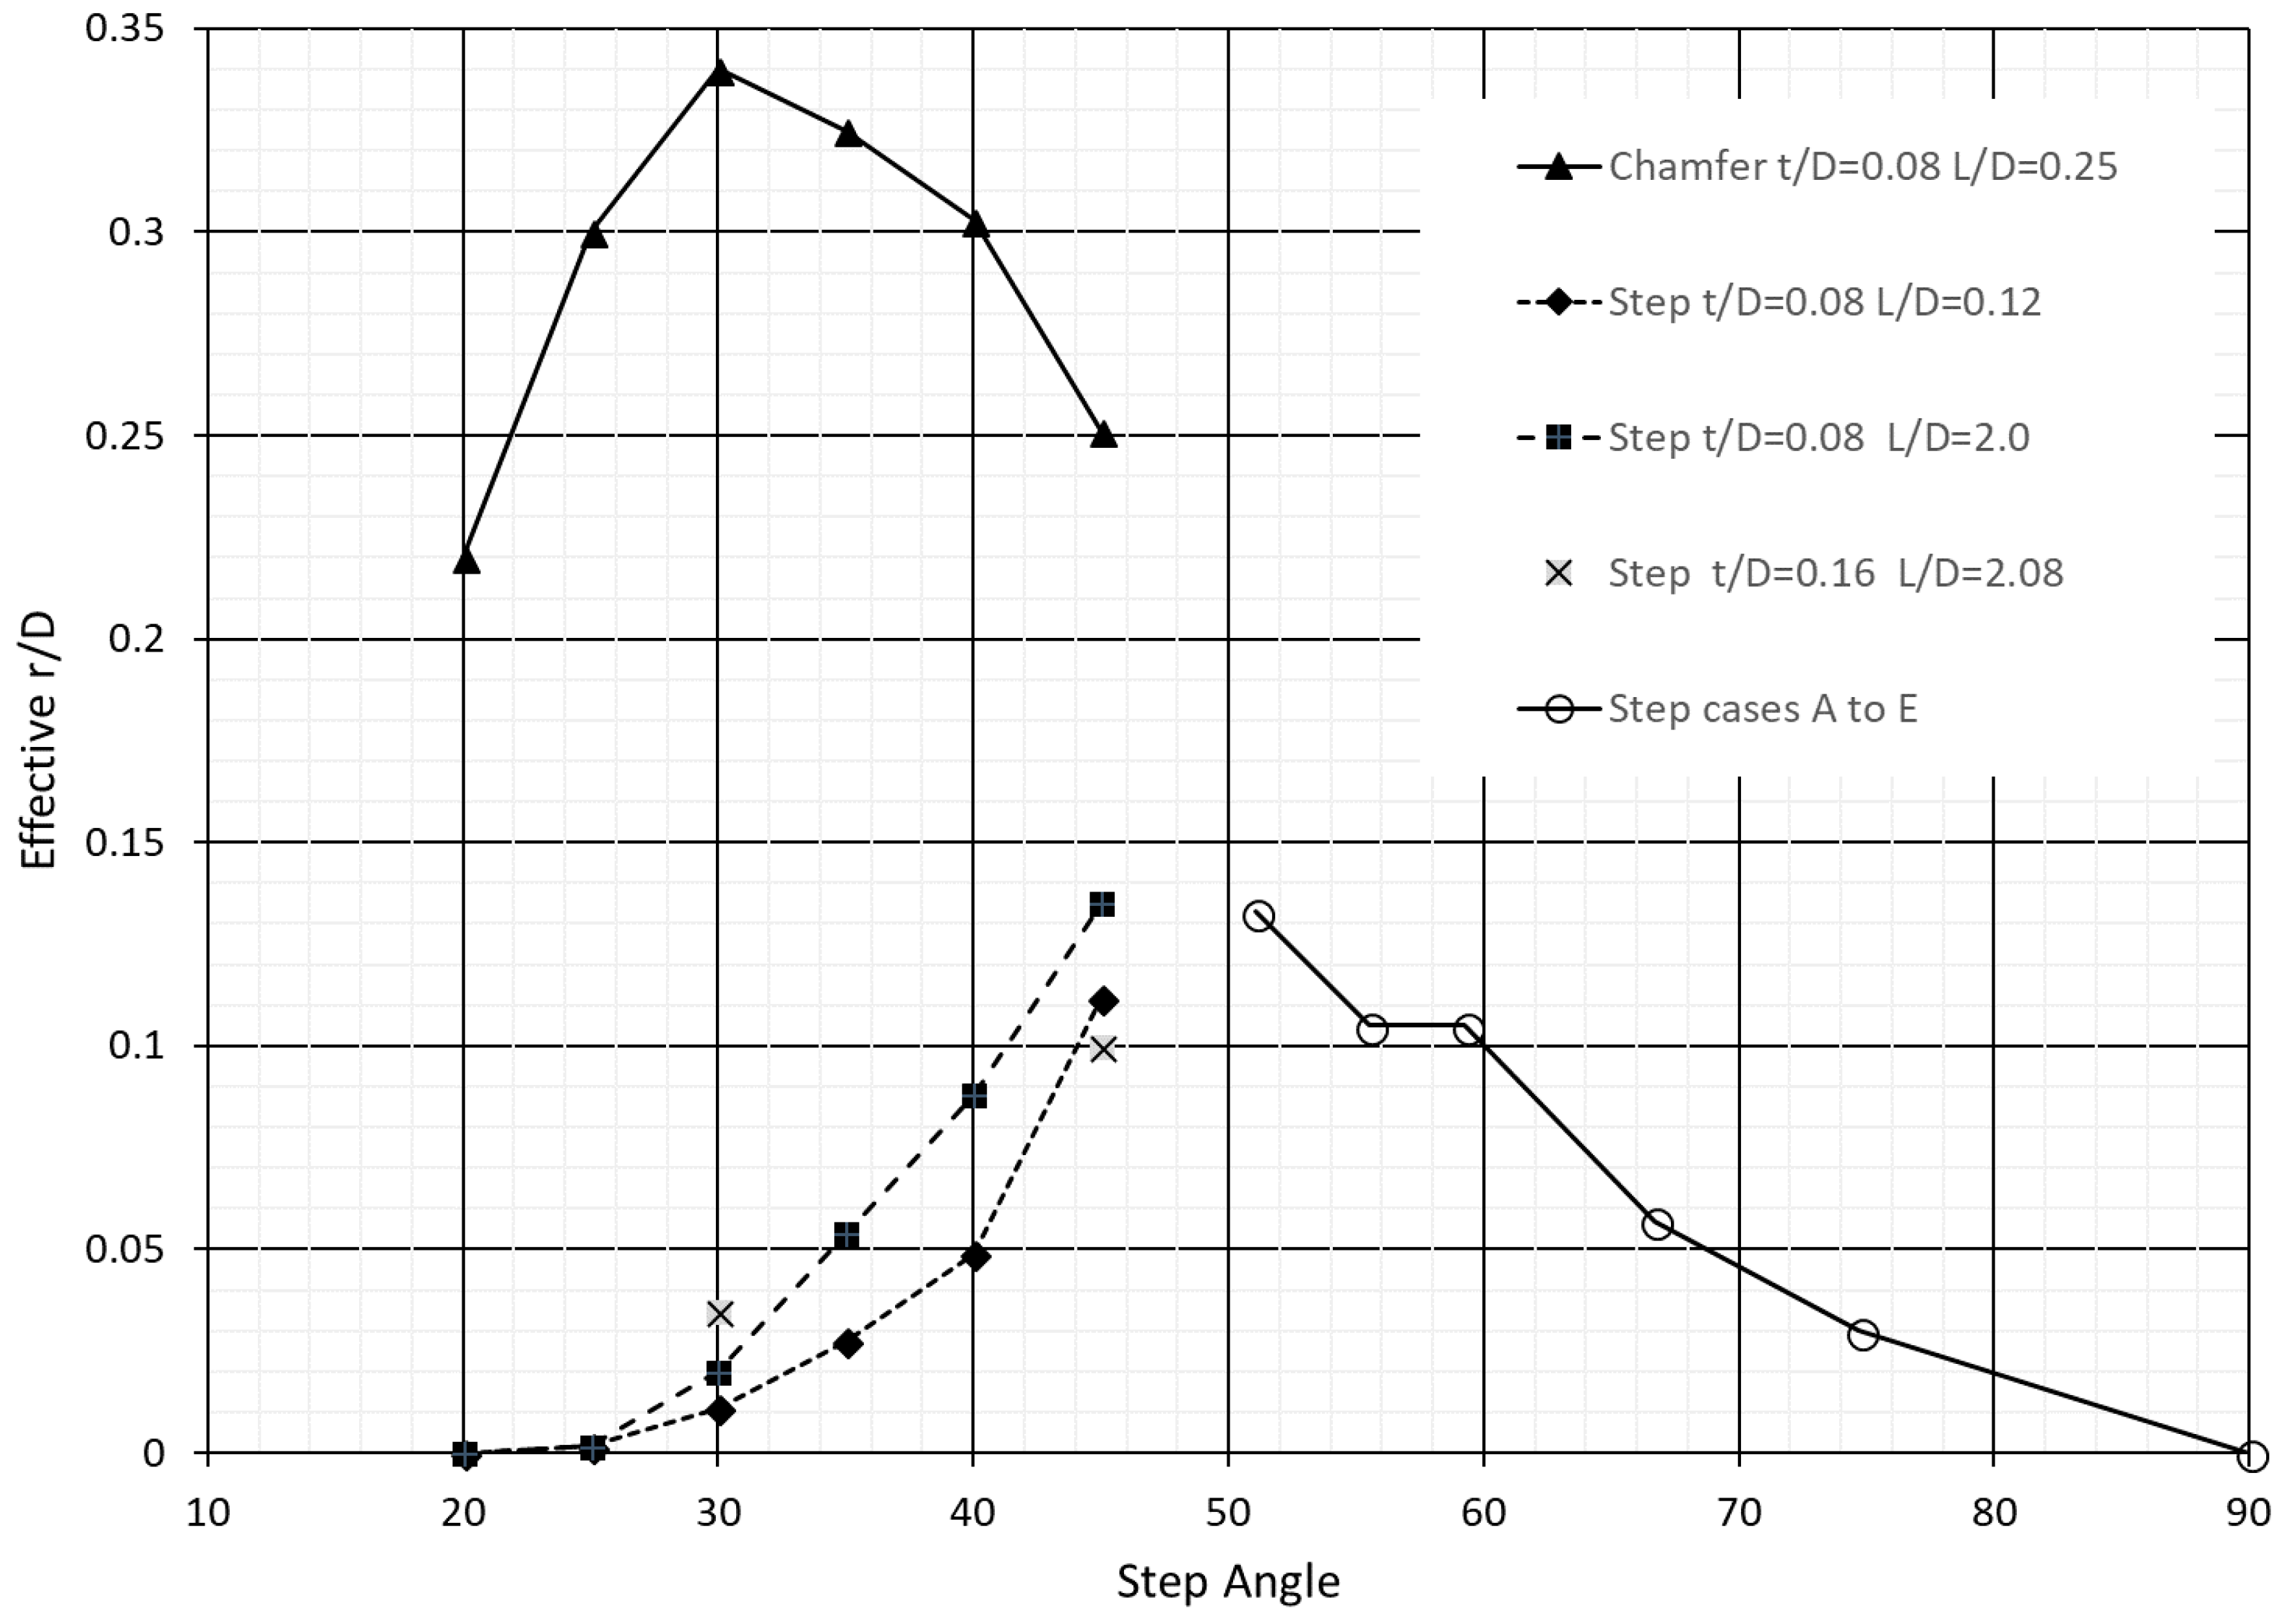
To include the effect of the step in empirical correlations, an equivalent r/D factor may be used. The equivalent r/D depends primarily on the port step angle (arctan of ratio of step length to height). Step height to diameter ratios in the range 0.06 to 0.2 had an insignificant effect on discharge coefficient in comparison compared with step angle, and is compensated for in existing correlations.
Eccentricity of the two diameters that define the stepped port is a significant factor influencing the overall discharge coefficient. Cd was reduced by up to 10% for the orientations of eccentricity tested and approach flow directionality behavior was changed compared with concentric inlet features.
Step angles of around 45° to 50° appear to produce the highest Cd, though further work is required to verify this because this value fell between the two testing configurations.


