Abstract
High-lift devices are commonly modelled using potential flow methods at the conceptual design stage. Often, these analyses require the use of prescribed wake shapes in order to avoid numerical stability issues. The wake type used, however, has an impact on the absolute aerodynamic load predictions, which is why, in general, these methods are used to assess performance changes due to configuration variations. Therefore, a study was completed that compared the predicted aerodynamic performance changes of such variations of high-lift configurations using different wake types. Lift and induced drag results are compared with the results that were obtained using relaxed wakes and various prescribed wake shapes. Specific attention is given to predictions of performance changes due to changes in geometry. It was found that models with wakes that are prescribed below the freestream direction yield the best results when investigating performance changes due to flap deflections and flap-span changes. The effect of flap-gap sizes is best evaluated using a fully-relaxed model. The numerically most stable approach of wakes that are prescribed leaving the trailing edge upwards seems to be least reliable in predicting performance changes.
1. Introduction
Modern commercial aircraft rely on high-lift devices to achieve the necessary low speed performance. Often, these devices consist of slats and slotted flaps, as shown in Figure 1 [1]. The design of such devices is becoming increasingly more complex as multidisciplinary optimization tasks are used to reduce the weight and system complexity early during conceptual design. In order to facilitate this highly iterative design stage, computationally-inexpensive approaches are commonly used to analyse these complex aerodynamic devices in a relatively quick manner [2,3]. Because of the limited accuracy of these simplified analysis tools, the impact of configuration changes, for example that of slotted flap geometries, is assessed for their relative changes in aerodynamic performance with respect to analytical predictions of a baseline configuration, as was done in [4]. The baseline configuration is well understood and has often been explored experimentally and numerically. Only selected configurations are further investigated for their absolute performance using higher-fidelity tools and/or wind-tunnel tests.

Figure 1.
Two-dimensional view of a wing with a slat and single slotted flap [5].
For modern conceptual design, three-dimensional panel methods and lifting surface methods are employed to estimate the aerodynamic performance of high-lift devices [2,3,6]. Potential flow methods, such as these, can use vortex filaments to model the shear layer in the wake [7,8,9]. The strength of these wake filaments depends on the change in the circulation along the trailing edge of the wing. In the streamwise direction, the strength remains constant under steady conditions. This wake can have a prescribed shape, for example being aligned with the freestream direction (drag-free) or at a predefined angle. More complex models allow the wake elements to move with the local velocities, thus resulting in a relaxed, force-free wake. The latter is able to capture secondary wake effects caused by the wake roll-up, which can be significant if there is strong interaction between lifting surfaces and their wakes, for example, as is true for high-lift devices. With either wake model, prescribed or free, care has to be taken when modelling complex multiple lifting surfaces, for example high-lift systems, in order to avoid adverse numerical interactions.
Previous studies have found that differences exist in the aerodynamic predictions of systems with multiple lifting elements depending on the wake model that was used [10,11,12,13]. The herein presented study further explores this trend and outlines the advantages and disadvantages of using different wake shapes to analyse high-lift devices and determine their ability to predict relative performance changes due to specific configuration changes. The objective is to provide the designer with an assessment, whether and how particular wake shapes that were chosen for numerical stability purposes affect the prediction results. Having a better understanding of these effects will allow designers to push forward the use of potential flow methods for conceptual design tasks.
2. Potential Flow Wake Models
Shedding vorticity into the wake, behind a lifting surface, models the shear layer that is present behind the physical wing. The vorticity shed defines the strength of the steady-state wake, which contributes to the induced velocities used to determine the surface singularity strengths. As mentioned, low-order potential flow methods often discretize this shear layer into vortex filaments. Due to the mathematical singularities at the centre of vortex filaments, modelling complex wakes and lifting systems can, however, become challenging and may require the manual placement of the filaments in the wake in order to avoid adverse numerical interactions. In such cases, the trailing wake filaments may not be aligned with the local streamlines, and the wake may carry forces. Furthermore, since the wake elements induce velocities on the lifting surfaces, modifying the position of the wake impacts the surface circulation distribution, depending on the wake type used.
2.1. Wake-Induced Velocities
Generally, the position of the wake of a potential flow model is of limited importance, except for the unique cases where strong interaction is expected between lifting elements and their wakes [12,14]. For most wing-body configurations, aligning the wake with the streamwise direction produces adequate results. However, as was found in [7], even an analysis of a simple, single wing can produce an array of results depending on the type of wake chosen.
Multiple-wing configurations have also shown different results depending on the shapes of the wakes. It was found by Miller and Youngblood that the predicted lift of a canard-wing configuration differed when the wake shed by the canard was positioned in the wing-canard mean plane, rather than aligned with the freestream direction or allowed to relax to a force-free wake [13]. Ultimately, the latter two models produced results that most closely aligned with wind tunnel testing. A more in-depth study of the wake of a canard was performed by Madson and Erickson [15]. The authors compared predictions using a freestream fixed wake to a body fixed wake. They found that a freestream fixed wake produced a 5% increase in the lift curve slope over a body fixed wake, and the freestream fixed wake produced results much closer to test data. They also analysed spanwise circulation distributions and found that the wake model did not have a large effect on the circulation strength of the canard; rather, it had an important effect on the lift distribution along the main wing. Using a freestream fixed wake increased lift inboard of the canard tip station, due to the diminished downwash field produced by the canard wake at that location. Conversely, the outboard sections of the main wing had less lift with a freestream fixed wake, since the upwash field was also diminished. Overall, in both of these canard wing studies, it was found that, depending on the investigative focus, the location and shape of the wake can make an impact on the aerodynamic predictions.
2.2. Singularity Issues
Modelling multiple lifting surfaces and their wakes using discrete vortex filaments has numerical challenges related to the singularity at the centre of filaments. This becomes a problem, for example, when a trailing filament is positioned close to a downstream numerical control point, as shown in Figure 2. The resulting large velocities that the singularity induces can cause computational issues and result in unrealistic load distributions. This problem worsens if the wake is relaxed and filaments in the wake come within close proximity to one another. Because of the large, non-physical velocities that they induce on one another, the filaments can experience relatively large displacements. As a result, the relaxation process can become erratic and the load prediction unrealistic.

Figure 2.
A wing and trailing-edge flap system modelled using a traditional vortex lattice method [5].
Multiple methods have been developed to deal with the singularities of filaments. For example, solid-core models that limit the maximum induced velocities eliminate some of the numerical issues [7]. In this case, however, the size of the core can easily become a driving factor of the solution, especially in the presence of strong wake interactions. Another approach to handle the singularity of a filament is to use damping factors to limit the movement of the wake during the relaxation process. Other methods include near-field velocity corrections to smooth out velocity peaks near discrete filaments by replacing them with multiple vortex lines of lesser strength distributed over panel edges [8,9].
Depending on the potential flow solver used, the user may have to manually prescribe the wake position. In some cases, this can lead to geometry simplifications. For example, in [16], the combination of a slat, main wing, triple slotted flap system led to leading and trailing edge discontinuities in the spanwise direction. In order to treat these discontinuities, the triple slotted flap geometry was merged into a single slotted flap, and the wake of each lifting element was prescribed parallel to the downstream surface. Although these careful modifications did not compromise the results, such an approach is difficult to generalize, which makes it unsuitable for configuration design explorations.
Another, more generalizable approach to modelling high-lift systems that is suitable for design explorations is using prescribed wake models, in which the vortex filaments leave the trailing edges at prescribed angles. Although such wake shapes can differ greatly from the physical location of the actual shear layer, this approach ensures that any adverse interaction is prevented. Nevertheless, the prescribed wake angles can lead to incorrect predictions of the aerodynamic forces of the high-lift system. Therefore, one possible approach for design studies is to assess the relative changes of the aerodynamics forces that various configurations develop. Unfortunately, very little has been recorded publicly that quantifies how different prescribed wake types influence relative aerodynamic performance changes and where the limits of such an approach lie.
3. Aerodynamic Model
For this study, the aerodynamic performance of high-lift devices was analysed using the higher-order potential flow method of Bramesfeld and Maughmer [10,17,18]. The method differs from conventional vortex lattice methods and panel codes in that the lifting surfaces and wakes are modelled using continuous vorticity distributions, rather than discrete vortex filaments. Therefore, the method essentially avoids the singularity issues that are often encountered with the more conventional approaches. As a consequence, the chosen method is ideal for the study of the impact of different wake models on the predicted aerodynamic performance, even in cases of strong interactions, for example as is shown in Figure 2.
The continuous spanwise vorticity distribution in the wake is modelled using vortex sheets that can be prescribed to a predefined position, or relaxed, as is shown in Figure 3. In absence of the singularities that are typically encountered with conventional vortex lattice and panel methods, numerically-stable wake and wake-surface interactions are achieved without the need for solid-core models or other numerical fixes.
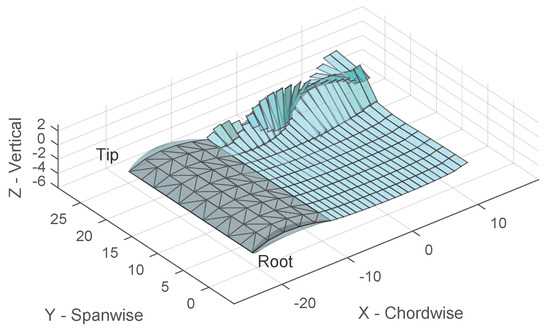
Figure 3.
Higher-order elements placed along the camber plane of a rectangular wing and the corresponding relaxed wake [5].
As a consequence of the continuous formulation of the higher-order method, the induced velocity profiles, especially in the wake, are better behaved than with many conventional potential flow methods. Figure 4 shows the wake-induced downwash velocities along three lines in a plane perpendicular to the wake downstream of a wing. The centre figure shows the location of the vortex filaments of a traditional vortex lattice method, shown by the black circles. The filament model results in a discontinuous downwash velocity distribution as shown by the dashed line. Although these discontinuities can be smoothed using a solid-core model, such a model would still incorrectly predict upwash at certain locations behind the wing, which is in stark contrast to experimental observations. In contrast to the discrete vortex-filament model, the continuous vorticity wake of the higher-order method predicts a smooth downwash and upwash distribution. The smooth distribution is achieved without any intervention and is due to the continuous nature of the model.

Figure 4.
Wake-induced velocities from a vortex lattice method, as well as a higher-order continuous vorticity method. The lower inset shows where the velocities were found [5].
The upper and lower plots in Figure 4 show the velocities induced along a line one quarter-chord above the wake and one quarter-chord below the wake vorticity location, respectively. At these locations, both of the velocity distributions are continuous; however, the velocities induced by the vortex filaments are wavy, especially near the edge of the wake where the strength of the filaments is highest. This non-physical effect is eliminated when modelling the wake using vortex sheets; the vortex sheet induced velocities are smooth at all locations surveyed. The well-behaved velocities in the wake of the higher-order method make it well suitable for a study on wakes and their relative positions, especially with strong wake–wake and wake–wing interactions.
In summary, the continuous nature and numerical stability of the higher-order method make it ideal to study the impact that various wake shapes have on aerodynamic load predictions. Such a systematic study, as presented in Section 4.3, can provide the high-lift conceptual designer, who likely uses conventional potential flow methods, with a measure to gauge the effects of a wake model that is prescribed for numerical stability purposes. The primary focus of the study that is discussed herein is less on how well a particular wake model predicts the absolute loads, but how well a particular wake model predicts performance changes due to configuration changes, for example changes in slotted flap geometry.
4. Comparison of Wake Shapes
The study of the impact of various wakes on the predicted changes in aerodynamic performance is approached in three steps. First, the impact of various wake shapes is explored using a simple rectangular wing. In the next step, this exploration is extended to a complex high-lift system that consists of a slat and a slotted flap in addition to the main wing. The prediction results are directly compared with experimental data in order to determine the quality of the predictions. In a third step, the relative aerodynamic performance changes due to changes in configuration of the high-lift system are investigated using predictions based on the different wake models. As in the second step, experimental results provide a baseline.
4.1. Single Rectangular Wing
To analyse the effects of wake shapes on a single lifting surface, a rectangular wing with a symmetrical airfoil shape and an aspect ratio of 10 was analysed using the higher-order potential flow method. A convergence study was completed on the number of elements used to model the lifting surface for each type of wake used. The minimum number of elements in both the chordwise direction and the spanwise direction that produced converged results was then used for the remainder of the study on the rectangular wing. Figure 5a shows the convergence of the span efficiency factor at an angle of attack of 10 degrees, using eight elements in the chordwise direction while increasing the number of spanwise elements, for three of the wake types tested. Convergence appears to be reached when using eight or more spanwise elements, regardless of the wake shape. Similar trends were found when using wakes prescribed to other angles. This study was repeated while holding the number of spanwise elements constant at eight and increasing the number of chordwise elements until the span efficiency factor converged. The results are shown in Figure 5b. Again, convergence for each wake type is reached when using eight or more elements in the chordwise direction. Based on these results, eight chordwise elements and eight spanwise elements were used to model the rectangular wing half-span for the remainder of the rectangular wing study.
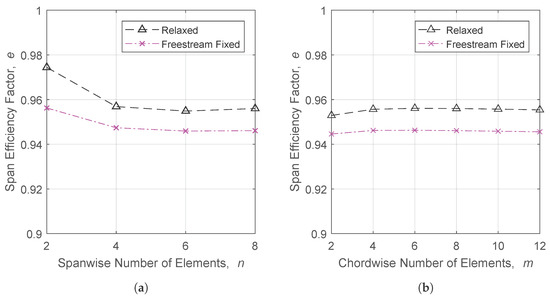
Figure 5.
Convergence of the span efficiency factor as the number of elements is increased for a rectangular wing. (a) Varying number of spanwise elements, m = 8; (b) varying number of chordwise elements, n = 8.
In general, it can be concluded for single, high aspect ratio wings that the wake shape has negligible influence on the convergence with changing element density. As a result, the aerodynamic properties of simple configurations can be found without having to perform multiple convergence studies if multiple wake types are to be used. This means that, for this study, the same configuration can be modelled with multiple wake types without having to change the discretization of the surface to achieve the convergence of the desired parameters.
The size of the wake to be used for the study was selected based on the convergence of span efficiency, as the wake grew in length with increasing numbers of time step iterations. Figure 6 shows the convergence of these parameters as the wake grows using eight spanwise and eight chordwise elements to model the half-span. As can be seen, the results have converged by 20 time steps, or after the wing has advanced a distance equal to five wing root chords. This was similar for all wake types used and therefore was used for the remainder of the study on the rectangular wing. Since convergence of the span efficiency as the wake grows is independent of the wake type for this single rectangular wing, the same configuration can be modelled with multiple wake types for this study, without having to change the size of the wake to achieve convergence.
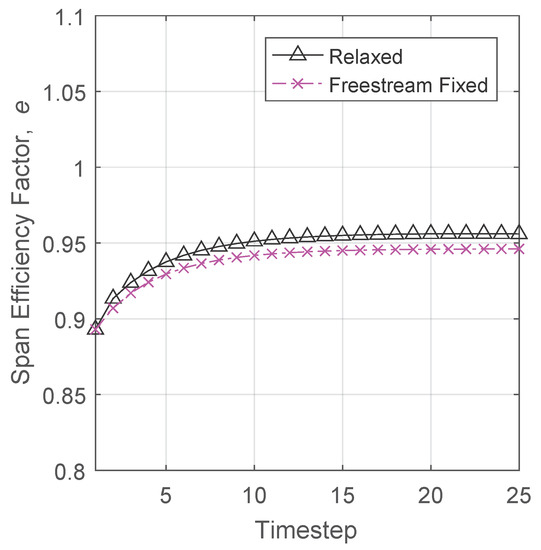
Figure 6.
Relaxed and fixed wake predictions of span efficiency as the number of time steps increases for a rectangular wing.
Plots of the five wake shapes tested are shown on the rectangular wing half-span in Figure 7, for an analysis at an angle of attack of six degrees. Note that the prescribed angles and freestream direction are with respect to the global X–Y plane, shown in Figure 3. As such, an analysis performed using a freestream fixed, drag-free wake at an angle of attack of 10 degrees, for example, would produce the same result as an analysis with a wake prescribed to +10 degrees.
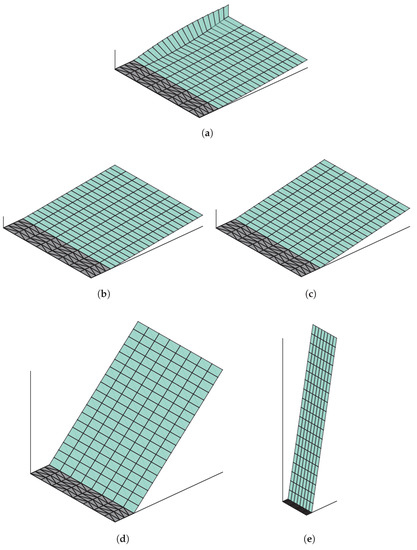
Figure 7.
Wake shapes analysed on a rectangular wing with an aspect ratio of 10 at an angle of attack of six degrees [5]. (a) Relaxed (force-free); (b) freestream fixed (drag-free, angle of attack +6 degrees); (c) prescribed to +10 degrees; (d) prescribed to +45 degrees; (e) prescribed to +80 degrees.
The lift and drag polars for results obtained using a relaxed wake, a drag-free wake and wakes prescribed to 10, 45 and 80 degrees above the zero-lift line are plotted in Figure 8. The results predict very little differences in the lift and induced drag for all wake shapes except the wakes prescribed to extreme angles. As shown in Figure 9, with high positive wake angles, the velocity induced by the wake on the wing has a large component in the freestream direction. This results in an increase in the predicted lift when comparing high wake angles to drag-free wakes. Simultaneously, the component of the wake-induced velocity normal to the freestream direction is reduced, resulting in a smaller angle of attack reduction when compared to a freestream fixed wake. Thus, the predicted induced drag is decreased as the wake angle increases. An interesting side note is that a wake prescribed at positive mto the freestream will produce zero induced drag with the method. Additionally, although not tested in this case, a wake prescribed below the freestream direction will decrease lift, since the incoming flow velocity is reduced by the wake-induced velocity. This will also produce less induced drag than a freestream fixed wake. Therefore, a freestream fixed wake will produce the most induced drag for a given lift coefficient, for a single wing configuration. These correlations between prescribed wake shapes and aerodynamic predictions are also applicable to the relaxed, force-free shapes. In such cases, the effects are applied to each element in the wake, rather than the plane of the entire wake.
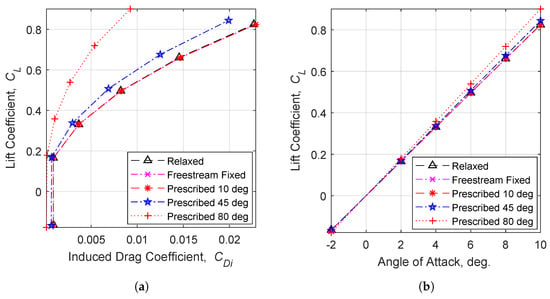
Figure 8.
Aerodynamic predictions of a single rectangular wing, using five different wake shapes [5]. (a) drag polar; (b) lift curve.
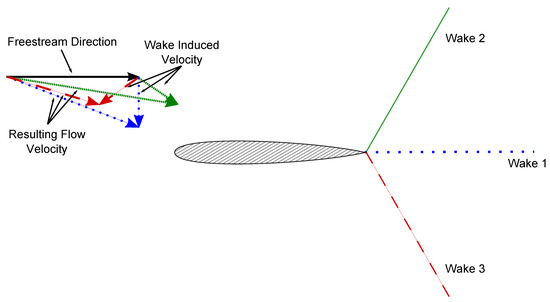
Figure 9.
Effect on incoming flow velocity due to three prescribed wake shapes of equal strength [5].
4.2. NASA Trap Wing
To study the effects of wake shapes on high-lift system predictions, the NASA Trap Wing was used as a source of experimental data to compare predictions to [19]. Table 1 provides geometrical data for the stowed configuration, which is used for non-dimensionalization of forces when applicable.

Table 1.
Summary of NASA Trap Wing model geometry [19].
The specific NASA Trap Wing experimental configurations under consideration are from the LaRC 14 × 22 ft low Reynolds number entry and are outlined in Table 2. This experiment took place at a Reynolds number of 4.3 million and at a freestream Mach number of 0.2. The corresponding force and pressure data are provided in [19] with wind tunnel boundary corrections applied.

Table 2.
Analysed NASA Trap Wing configurations from the LaRC 14 × 22 ft entry [19].
Using this model allows for comparison to a multi-element system, which has been analysed using several modern CFD solvers [20,21,22,23,24]. Figure 10 shows the three element system with the slat and flap in the LaRC Configuration 1 position, modelled using higher-order elements as described in [10]. A preliminary study showed that lift and induced drag predictions using this inviscid method are relatively insensitive to the specific positioning of the camber line of the slat and main wing. Note that the slat and flap are sealed at the root and that the model does not include the main body cove that was used in the experiment.
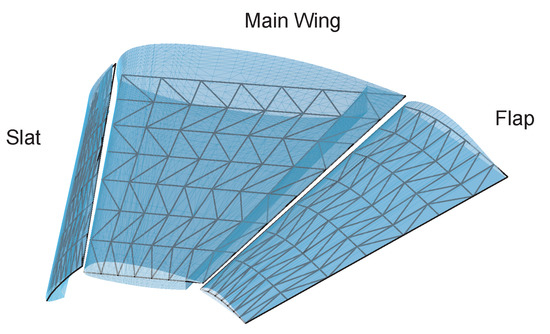
Figure 10.
NASA Trap Wing LaRC Configuration 1 modelled using higher-order elements.
Although not shown here, this study has found that predicted performance changes of prescribed wakes exhibited very little sensitivity to panel-density changes. However, results found when using a relaxed wake do differ, and therefore, a convergence study was completed on the NASA Trap Wing LaRC Configuration 1 at an angle of attack of 20 degrees to determine the minimum number of elements needed to model the wing while achieving converged results. Figure 11a shows the convergence of the span efficiency factor as the number of spanwise elements is increased. For results found when using a freestream fixed wake model, good convergence can be seen when 12 elements are used in the spanwise direction. Similar results were found for all prescribed wake models, as well. In contrast to the results of the rectangular wing study, the span efficiency convergence when using a relaxed wake is more erratic when modelling multiple lifting surfaces with multiple wakes. This is due to the changing relaxed wake shape as the number of spanwise elements is increased and the strong interaction between wakes and surfaces. Nonetheless, the results attained with more than 12 spanwise elements produced results that were deemed accurate enough for this study. This number was then used to determine the number of elements needed in the chordwise direction. Figure 11b shows the convergence in span efficiency as the number of chordwise elements is increased. Since the model includes camber, increasing the number of elements in the chordwise direction generates a geometry closer to the physical configuration. Based on these figures, 12 elements in the chordwise direction were chosen to be suitable for the subsequent study of the NASA Trap Wing.

Figure 11.
Convergence of the span efficiency factor as the number of elements is increased during an analysis of the NASA Trap Wing LaRC Configuration 1. (a) Varying number of spanwise elements, m = 12; (b) varying number of chordwise elements, n = 12.
The size of the wake used for the study was based on the convergence of span efficiency as the wake grew in length. In Figure 12, convergence for both relaxed and fixed wake models can be seen when the number of time steps is equal to 20. This corresponds to a wake length that is two-times the root chord length in the streamwise direction. Since this trend continued for all wake shapes used, this wake size was used for this wake shape study on the NASA Trap Wing.

Figure 12.
Convergence of the span efficiency factor as the number of time steps increases during an analysis of the NASA Trap Wing LaRC Configuration 1.
The seven wake positions corresponding to a relaxed wake, a freestream fixed (drag-free) wake and wakes prescribed to −45, −20, +20, +45 and +80 degrees are shown in Figure 13. Similar to the single rectangular wing study, the global X–Y plane is used as the reference plane for the freestream direction and prescribed wake angles. This means that an analysis at an angle of attack of 10 degrees with a freestream fixed wake would produce a wake that is identical to a wake prescribed to 10 degrees.
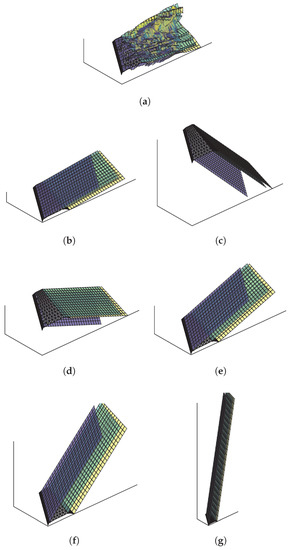
Figure 13.
Wake shapes analysed on the NASA Trap Wing LaRC Configuration 1 at an angle of attack of five degrees [5]. (a) Relaxed (force-free); (b) freestream fixed (drag-free, angle of attack +5 degrees); (c) prescribed to −45 degrees; (d) prescribed to −20 degrees; (e) prescribed to +20 degrees; (f) prescribed to +45 degrees; (g) prescribed to +80 degrees.
Note that each of the three lifting surfaces sheds a wake from its respective trailing edge. The wake of each lifting surface has been represented in Figure 13 using different colors. Blue elements represent the wake shed from the slat, green elements are shed from the main wing, and yellow elements represent the wake shed from the flap. For a select number of cases, it can be seen that a wake passes through a downstream element. Although this is non-physical, the method can handle it without numerical issues. In terms of performance, it has been shown that the velocities induced by a body-piercing wake are almost identical to that of a properly-treated body-conforming wake [25].
Figure 14 and Figure 15 compare the results of the study to the experimentally-obtained NASA Trap Wing LaRC Configuration 1 data. It must be noted that the regions above an angle of attack of 30 degrees and below an angle of attack of five degrees are not compared in this study. It is assumed that viscous effects, in the form of significant flow separation, dominate in these regions. The current analysis method uses no viscous model and therefore cannot predict such effects. Hence, the predicted drag values are that of only induced drag, whereas the experimental drag values are total drag. Therefore, an offset in drag is expected, and only the general shape of the polars is being compared.
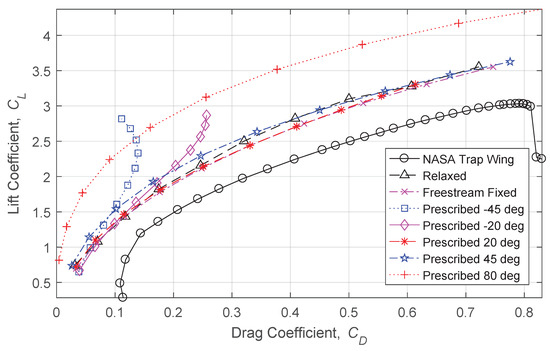
Figure 14.
Comparisons of induced drag predictions using several wake types, and experimental observations of drag, for the NASA Trap Wing LaRC Configuration 1.
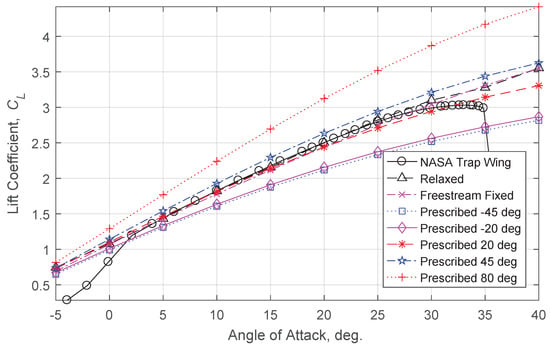
Figure 15.
Comparisons of lift predictions using several wake types, and experimental observations, for the NASA Trap Wing LaRC Configuration 1.
As was found with the rectangular wing study, the freestream fixed wake produces the most induced drag for a given lift coefficient. This value then decreases as the wake angle is tilted away from the freestream angle. The limit of zero predicted induced drag occurs when a wake is prescribed perpendicular to the freestream direction. This explains why, when analysing with negative prescribed wake angles, the induced drag predictions begin to decrease above a specific lift coefficient. The intersection points between the predictions of two prescribed wake angles represent two different wake shapes that predict the same induced drag at the same lift coefficient.
As was previously mentioned, a wake prescribed to the freestream angle will produce the same aerodynamic predictions as a freestream fixed wake. At lower and higher freestream angles, the prescribed wake will predict less induced drag. Therefore, the predicted drag polars will not be of the same shape, as shown in Figure 14. As a result, for a given lift coefficient, wakes prescribed to angles less than 10 degrees from the freestream angle of attack produced very similar results to the freestream fixed wake.
As can be seen in Figure 15, the major difference between the predicted lift coefficients using different wake types is the lift curve slope. The predictions follow the rule that at a given angle of attack, lift coefficients deviate approximately 3.3% for every 10 degree difference between the prescribed wake angle and the freestream direction. Overall, predictions using relaxed wakes, freestream fixed wakes or wakes that are prescribed above the freestream direction, at angles of less than 45 degrees, agree relatively well with the experimental results. The latter is true since the angle of attack range in question is positive and less than 45 degrees. This also means that predictions using wake models that are prescribed below the freestream direction differ significantly from the experimental results and underpredict the lift curve slope.
The different impact that the wake models have on the predicted lift curve slope is due to the combination of two effects. The first effect is that the wake of a lifting surface affects the incoming flow vector. This is in line with observations that were made with the single rectangular wing analysis and is depicted in Figure 9. The second effect is unique to cases with multiple lifting elements. Since the downwash velocities are highest in the plane of the wake itself, prescribing a wake to a defined angle will affect the strength of the downwash field that a subsequent lifting surface passes through. The resulting spanwise circulation distributions will be affected, as shown for multiple wake types in Figure 16. Since the trailing edge of the slat and main wing shed their wakes on top of the subsequent lifting surfaces, prescribing a wake angle to any angle above or below the subsequent lifting surface decreases the downwash at that location. Alternatively, prescribing a wake that passes through a downstream lifting surface results in large downwash velocities at the downstream location.
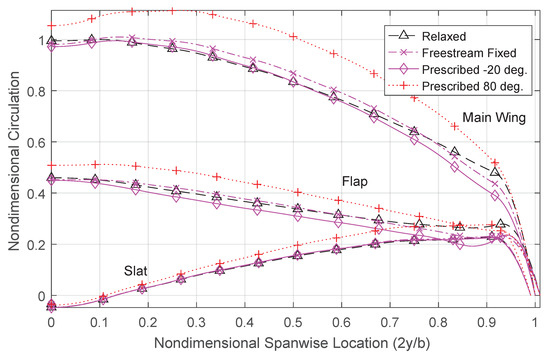
Figure 16.
Predicted spanwise circulation distributions for the NASA Trap Wing LaRC Configuration 1, at an angle of attack of 20 degrees. Values are normalized to the circulation at the main wing root section, as predicted with a relaxed wake.
The results find the same conclusions that were made during the canard wing studies by Miller and Youngblood [13] and further explored by Madson and Erickson [15]. Figure 15 shows that a relaxed wake provides results closest to experimental data, and a freestream fixed wake will provide more lift at a given angle of attack when compared to a wake aligned close to the body.
The spanwise circulation distributions shown below are normalized to the circulation at the root of the main wing, as found when using a relaxed wake shape. Negative circulation at the inboard section of the slat produces a net downwards force at that location. This may be physical, due to the nature of the slat; however, it is likely due to the simplifications required to model a complex, three-dimensional surface with an infinitely thin wing. These problems, and the solution taken, are described in [10].
As expected, the circulation values produced when using a wake prescribed to positive angles are higher than those predicted with a relaxed wake, except at the tip of the flap. This is a result of the relaxed wakes from the slat and main wing being rolled-up to angles higher than 80 degrees as they pass over the flap. This reduces the downwash and increases the velocities in the freestream direction at the location of the flap more than the wakes prescribed to high angles. The opposite effect happens with wakes prescribed to angles below the freestream direction.
4.3. Relative Performance Changes
In order to study the impact that different wake shapes have on the the relative changes in aerodynamic load predictions of high-lift configurations, a systematic study was performed using the NASA Trap Wing as a basis. Eight different wakes shapes, the same ones of the previous section, were used to investigate and compare the predicted changes in performance due to configuration changes, such as a flap deflection, a slotted-flap gap size and relative flap-span variations. The different configuration changes correspond to particular experimental configurations of the NASA Trap Wing, with Configuration 1 being the baseline. The specific configurations are presented in Table 2.
4.3.1. Flap Deflection
The predicted changes in lift due to an increase in a flap deflection angle are shown in Figure 17, along with the experimental results. These changes are based on the comparison of computational results of the NASA Trap Wing Configurations 1 and 8 at a given angle of attack. As can be seen in Figure 17a, all wake types predict an increase in the lift coefficient across the linear angle of attack range with a flap angle increase, according to:

Figure 17.
Predicted and experimentally-observed performance changes due to a flap deflection angle increase, from 20 deg to 25 deg. (a) Lift predictions, ; (b) drag predictions, ; (c) span efficiency predictions, .
When compared to the experimental NASA Trap Wing performance changes, freestream fixed wakes, relaxed wakes and wakes prescribed to positive angles over-predict an increase in lift due to a flap angle increase. As shown in the figure, wakes prescribed to −20 degrees and −45 degrees both underpredict the lift increase; however, the predictions at −20 degrees predict performance changes that agree best with the NASA Trap Wing experimentally-measured changes in the lift coefficient.
As can be seen in Figure 17b, downward deflections of the flap result, for a given lift coefficient, in a drag reduction for the models with positive prescribed wake angles. The change in drag is given by:
The models with negative prescribed wake angles exhibit an increase in drag as the flap angle is increased. Less pronounced changes in drag are observed for fixed and relaxed wake models, as well as for the experimental results, although these includes viscous effects, such as boundary layer thickening.
The changes in span efficiency due to an increase in flap deflection are largely affected by the changes in lift and are shown in Figure 17c. The changes in span efficiency are based on:
The experimental results were omitted from Figure 17c since the subsequent comparison of Oswald’s efficiency includes viscous effects and would be misleading. Freestream fixed and relaxed wake shapes show little change in span efficiency when increasing the flap deflection. In general, wakes that are prescribed at positive angles (shed upwards) predict an increase in span efficiency, whereas wakes prescribed at negative angles result in a decrease in span efficiency.
The predicted increase in span efficiency when modelling the flap deflection using positively-prescribed wakes results in a more efficient distribution of lift between the main wing/slat and the slotted flap, when compared to predictions made using negatively-prescribed wakes. The predicted spanwise circulation distributions for both flap configurations are shown in Figure 18 for the same lift coefficients. The values have been normalized to the maximum circulation for each case, which occurs at approximately the same spanwise location for all configurations. The predictions were computed using wake models that were prescribed 45 degrees above and below the reference plane. As can be seen, both wake models predict an increase in spanwise loading on the flap when deflecting the flap downwards, as one would expect. However, when looking at the changes of spanwise circulation distributions, as done in Figure 19, it becomes evident that, when deflecting the flap downward, the positive wake model results in a stronger unloading of the main wing than compared with the prediction that uses a negatively-prescribed wake model. Evidently, the stronger unloading of the main wing results in the observed improvement of the overall span efficiency.
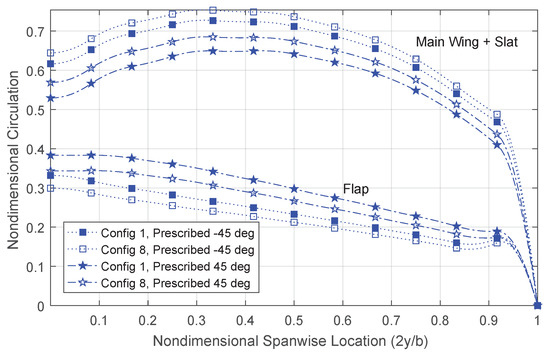
Figure 18.
Spanwise circulation predictions for the NASA Trap Wing at two configurations representing a flap angle change, .
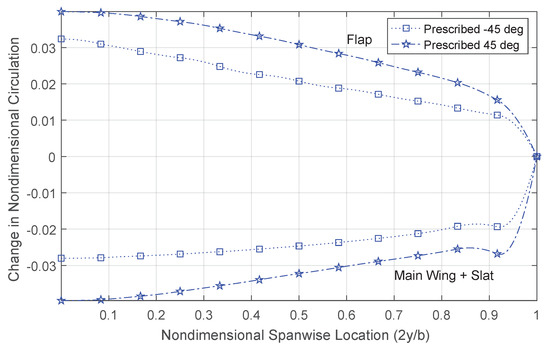
Figure 19.
Predicted changes in the spanwise circulation distributions due to an increase in flap deflection angle for the NASA Trap Wing, according to , .
4.3.2. Flap Gap Widening
The impact of varying the gap size between the main wing and slotted flap is shown in Figure 20 for the predicted and experimental results. The changes are based on a configuration change from the NASA Trap Wing Configuration 2 to Configuration 1. Independent of the wake model, the predictions consistently indicate a reduction in lift as the gap size is increased, whereas the experiment shows an increase in lift. This difference in lift behaviour between experiment and predictions is directly related to boundary layer effects. In general, increasing the gap size reduces the velocities in the gap, which reduces the main-wing circulation in a purely inviscid case. In the viscous experiment, however, the increasing gap size also reduces the adverse effects of the interaction of the main-wing and flap boundary layers that are relatively close for Configuration 2. The relaxed wake model most closely follows the experimental trends, which indicates that wake roll-up can have a significant impact, depending on the accuracy that is required.

Figure 20.
Predicted and experimentally-observed performance changes due to a slotted flap gap size increase, from 1% to 1.5% of the cruise wing chord. (a) Lift predictions, ; (b) drag predictions, ; (c) span efficiency predictions, .
Figure 20b shows that analyses with all wake types predict a negligible change in drag at lower lift coefficients, which agrees with the experimental data. At higher lift coefficients, the experimental data predict a small increase in drag. This is not captured by any of the wake models and is assumed to be caused by viscous effects.
Unsurprisingly, the negligible changes in drag for a given lift coefficient is also reflected in insignificant changes of span efficiency due to a flap-gap size increase for most wake models, as shown in Figure 20c. Some differences occur at large lift coefficients for the wake models with negative angles. As in the previous configuration change study, the span efficiency of the experiment is omitted, since it cannot be measured.
4.3.3. Flap Span Increase
The impact of a flap span change from a partial-span flap, spanning from 26% to 75% of the half-span, to a full-span flap is shown in Figure 21. The partial span flap corresponds to the NASA Trap Wing Configuration 9, and similar to the previous cases, the NASA Trap Wing Configuration 1 serves as the baseline. Across the linear angle of attack range, all wake types predict an increase in lift due to the flap span increase, as shown in Figure 21a. However, all wake types overpredict the increase in lift, with the wakes that are angled downwards predicting changes that agree best with the experimental data. The overprediction of the lift increase is most likely related to the inability of inviscid models to capture effective decambering due to boundary layer thickening, thus overestimating the impact of a flap-span increase compared to the experiment.

Figure 21.
Predicted and experimentally-observed performance changes due to a change in flap span, from a part-span flap to full-span flap. (a) Lift predictions, ; (b) drag predictions, ; (c) span efficiency predictions, .
When comparing the predictions of drag, Figure 21b shows that the relaxed wake predictions agree best with the experimental data. This good agreement is found without a prediction of profile drag, suggesting that the reduction in drag in the experimental case is mostly due to induced drag sources. Wakes that are fixed to the freestream direction, or above it, overpredict the reduction in drag due to the flap span increase. Finally, negative wake angles, that is wakes that are trailing downward, incorrectly predict an increase in drag due to a flap span change. Overall, however, the wakes aligned with the freestream or prescribed to positive angles are in better agreement with the experimental results than wakes that are prescribed to trail downward. This is an important conclusion since positively-prescribed wake angles reduce the chance of adverse numerical interactions between wakes and downstream lifting elements.
The change from a partial-span to full-span flap improves the span efficiency for the relaxed, fixed and positive angle wake models, as shown in Figure 21c. This improvement in lift production efficiency is concurrent with the conclusion of the drag reductions of Figure 21b. Despite the better prediction in change in lift coefficient using wakes that are prescribed to trail downward, the positive angles, at least the 45 degrees case, have the best agreement with the relaxed and freestream-fixed wakes.
5. Conclusions
The changes in aerodynamic performance due to changes in the configuration of a high-lift system were investigated using a higher-order potential flow method and various prescribed and free wake shapes. The study used wakes prescribed at various angles, including aligned with the freestream, as well as a fully-relaxed wake model.
Overall, the growing use of multidisciplinary optimization tasks in conceptual design means that computational analysis must be efficient. Depending on the need for numerical accuracy, potential flow models continue to provide analysis methods that are well suitable for highly iterative processes, such as those performed during conceptual design studies. For example, in this study, even relatively extreme prescribed wake angles of positive 45 degrees predict drag within less than approximately 250 drag counts or roughly 15% of the overall wing drag.
The study found that specific configuration changes require different wake types to achieve results that agree with experimental data. For example, analysing the additional lift due to the deflection of a slotted flap is best approximated using wakes that are prescribed slightly downwards, whereas the drag-coefficient changes are best captured using wakes that are fully relaxed or prescribed slightly downwards. Aerodynamic performance changes due to flap-gap variations are best approximated using a relaxed wake model, suggesting that wake roll-up has a significant impact on the results. Finally, this study found that an analysis of a change in flap span requires a wake that is prescribed downwards in order to best approximate changes in lift, while a relaxed wake is required in order to best estimate changes in drag. Analysis of all of the results presented suggests that changes due to significant viscous effects cannot be captured by any wake shape.
Despite the specific findings, overall, one can conclude that prescribed wakes yield predictions in performance changes that can provide sufficient guidance during conceptual design studies. This not only applies to wakes that are aligned with the freestream direction or leave the trailing edge downwards at moderate angles, but also wakes that leave the trailing edge upwards at moderate angles. Although a fully-relaxed wake analysis provides the most consistent agreement with predicted changes and absolute values of aerodynamic performance, this analysis requires approximately 31% more time to achieve convergence when compared to a prescribed wake. In addition, when using a conventional vortex lattice or panel method, prescribed positive wake angles reduce the chance of any adverse numerical interaction between wakes and lifting elements that are further downstream.
Acknowledgments
This research was possible through funding provided by the Kenneth M. Molson Foundation and the Faculty of Engineering and Architectural Sciences at Ryerson University.
Author Contributions
William Bissonnette performed the numerical simulations and data analysis and prepared the manuscript. Götz Bramesfeld guided and supervised the numerical analysis and revised the manuscript.
Conflicts of Interest
The authors declare no conflict of interest.
Nomenclature
| aspect ratio | |
| b | wingspan |
| c | wing chord |
| induced drag coefficient | |
| drag coefficient | |
| lift coefficient | |
| e | span efficiency ( |
| m | number of elements along the chord |
| n | number of elements along the half-span |
| y | spanwise location |
References
- Rudolph, P.K. High-Lift Systems on Commercial Subsonic Airliners; NASA CR-4746; National Aeronautics and Space Administration, Ames Research Center: Moffett Field, CA, USA, 1996.
- Nield, B.N. An Overview of the Boeing 777 High Lift Aerodynamic Design. Aeronaut. J. 1995, 99, 361–371. [Google Scholar]
- Reckzeh, D. Aerodynamic Design of the High-Lift-Wing for a Megaliner Aircraft. Aerosp. Sci. Technol. 2003, 7, 107–119. [Google Scholar] [CrossRef]
- Henne, P.A. Computational Aerodynamics Applied to High-Lift Systems. Appl. Comput. Aerodyn. Prog. Astronaut. Aeronaut. 1990, 125, 389–433. [Google Scholar]
- Bissonnette, W.; Bramesfeld, G. Effects of Wake Shapes on High-Lift System Aerodynamic Predictions. In Proceedings of the 54th AIAA Aerospace Sciences Meeting, San Diego, CA, USA, 4–8 January 2016. AIAA 2016-2040. [Google Scholar]
- Strüber, H. The Aerodynamic Design of the A350 XWB-900 High Lift System. In Proceedings of the 29th International Congress of the Aeronautical Sciences, St. Petersburg, Russia, 7–12 September 2014. [Google Scholar]
- Katz, J.; Plotkin, A. Low-Speed Aerodynamics; Cambridge University Press: New York, NY, USA, 2001; Volume 13. [Google Scholar]
- Maskew, B. Program VSAERO Theory Document: A Computer Program for Calculating Nonlinear Aerodynamic Characteristics of Arbitrary Configurations; NASA CR-4023; National Aeronautics and Space Administration, Ames Research Center: Moffett Field, CA, USA, 1987.
- Ashby, D.L.; Dudley, M.R.; Iguchi, S.K.; Browne, L.; Katz, J. Potential Flow Theory and Operation Guide for the Panel Code PMARC; NASA TM-102851; National Aeronautics and Space Administration, Ames Research Center: Moffett Field, CA, USA, 1991.
- Bissonnette, W.; Bramesfeld, G. Demonstration of a Conceptual Design Tool for Multiple Lifting Elements. In Proceedings of the 53rd AIAA Aerospace Sciences Meeting, Kissimmee, FL, USA, 5–9 January 2015. AIAA 2015-1031. [Google Scholar]
- Bramesfeld, G.; Maughmer, M.D. Effects of Wake Rollup on Formation-Flight Aerodynamics. J. Aircr. 2008, 45, 1167–1173. [Google Scholar] [CrossRef]
- Erickson, L.L. Panel Methods: An Introduction; NASA TP-2995; National Aeronautics and Space Administration, Ames Research Center: Moffett Field, CA, USA, 1990.
- Miller, S.G.; Youngblood, D.B. Applications of USSAERO-B and the PANAIR Production Code to the CDAF Model, a Canard/Wing Configuration. In Proceedings of the 1983 AIAA Applied Aerodynamics Conference, Danvers, MA, USA, 13–15 July 1983. AIAA 83-1829. [Google Scholar]
- Epton, M.; Magnus, A. PAN AIR: A Computer Program for Predicting Subsonic or Supersonic Linear Potential Flows about Arbitrary Configurations Using a Higher Order Panel Method; Volume 1: Theory Document (Version 3.0); NASA CR-3251; National Aeronautics and Space Administration, Ames Research Center: Moffett Field, CA, USA, 1990.
- Madson, M.D.; Erickson, L.L. PAN AIR Analysis of the NASA/MCAIR 279-3: An Advanced Supersonic V/STOL Fighter/Attack Aircraft; NASA TM-86838; National Aeronautics and Space Administration, Ames Research Center: Moffett Field, CA, USA, 1986.
- Tinoco, E.; Ball, D.; RICE, F., II. PAN AIR Analysis of a Transport High-Lift Configuration. J. Aircr. 1987, 24, 181–187. [Google Scholar] [CrossRef]
- Bramesfeld, G. A Higher Order Vortex-Lattice Method with a Force-Free Wake. Ph.D. Thesis, The Pennsylvania State University, State College, PA, USA, 2006. [Google Scholar]
- Bramesfeld, G.; Maughmer, M.D. Relaxed-wake Vortex-Lattice Method Using Distributed Vorticity Elements. J. Aircr. 2008, 45, 560–568. [Google Scholar] [CrossRef]
- Hannon, J.A. 1998/1999 Trap Wing Data Archive. 2014. Available online: http://hiliftpw.larc.nasa.gov/98-99WebArchiveWithMods/Trap%20Wing%20Data%20Archive.html (accessed on 13 July 2016).
- Murayama, M.; Tanaka, K.; Yamamoto, K. CFD Comparison Study for Trapezoidal High-Lift Wing Configurations by Structured and Unstructured Mesh Method. In Proceedings of the 49th AIAA Aerospace Sciences Meeting, Orlando, FL, USA, 4–7 January 2011. AIAA 2011-937. [Google Scholar]
- Lee, H.C.; Pulliam, T.H. Effect of Using Near and Off-Body Grids with Grid Adaption to Simulate Airplane Geometries. In Proceedings of the 20th AIAA Computational Fluid Dynamics Conference, Honolulu, HI, USA, 27–30 June 2011. AIAA 2011-3985. [Google Scholar]
- Sclafani, A.J.; Slotnick, J.P.; Vassberg, J.C.; Pulliam, T.H.; Lee, H.C. OVERFLOW Analysis of the NASA Trap Wing Model from the First High Lift Prediction Workshop. In Proceedings of the 49th AIAA Aerospace Sciences Meeting, Orlando, FL, USA, 4–7 January 2011. AIAA 2011-866. [Google Scholar]
- Fares, E.; Nölting, S. Unsteady Flow Simulation of a High-Lift Configuration Using a Lattice Boltzmann Approach. In Proceedings of the 49th AIAA Aerospace Sciences Meeting, Orlando, FL, USA, 4–7 January 2011; AIAA 2011-869. pp. 4–5. [Google Scholar]
- Ravindra, K.; Shende, N.V.; Patel, S.K.; Balakrishnan, N. Unstructured Adaptive Mesh Calculations for NASA Trap Wing Using the Code HiFUN. In Proceedings of the 30th AIAA Applied Aerodynamics Conference, New Orleans, LA, USA, 25–28 June 2012. AIAA 2012-2849. [Google Scholar]
- Willis, D.J. An Unsteady, Accelerated, High Order Panel Method With Vortex Particle Wakes. Ph.D. Thesis, Massachusetts Institute of Technology, Cambridge, MA, USA, 2006. [Google Scholar]
© 2017 by the authors. Licensee MDPI, Basel, Switzerland. This article is an open access article distributed under the terms and conditions of the Creative Commons Attribution (CC BY) license (http://creativecommons.org/licenses/by/4.0/).