To begin with, the cases presented in [
15] are repeated here using Overture so that a direct comparison of results with the new obstacle configuration is possible. First, two cases were simulated using the full Navier–Stokes equations. In the first case, the obstacles were cylinders with diameter
mm placed in a non-staggered matrix (NS) based on four rows, each containing four obstacles;
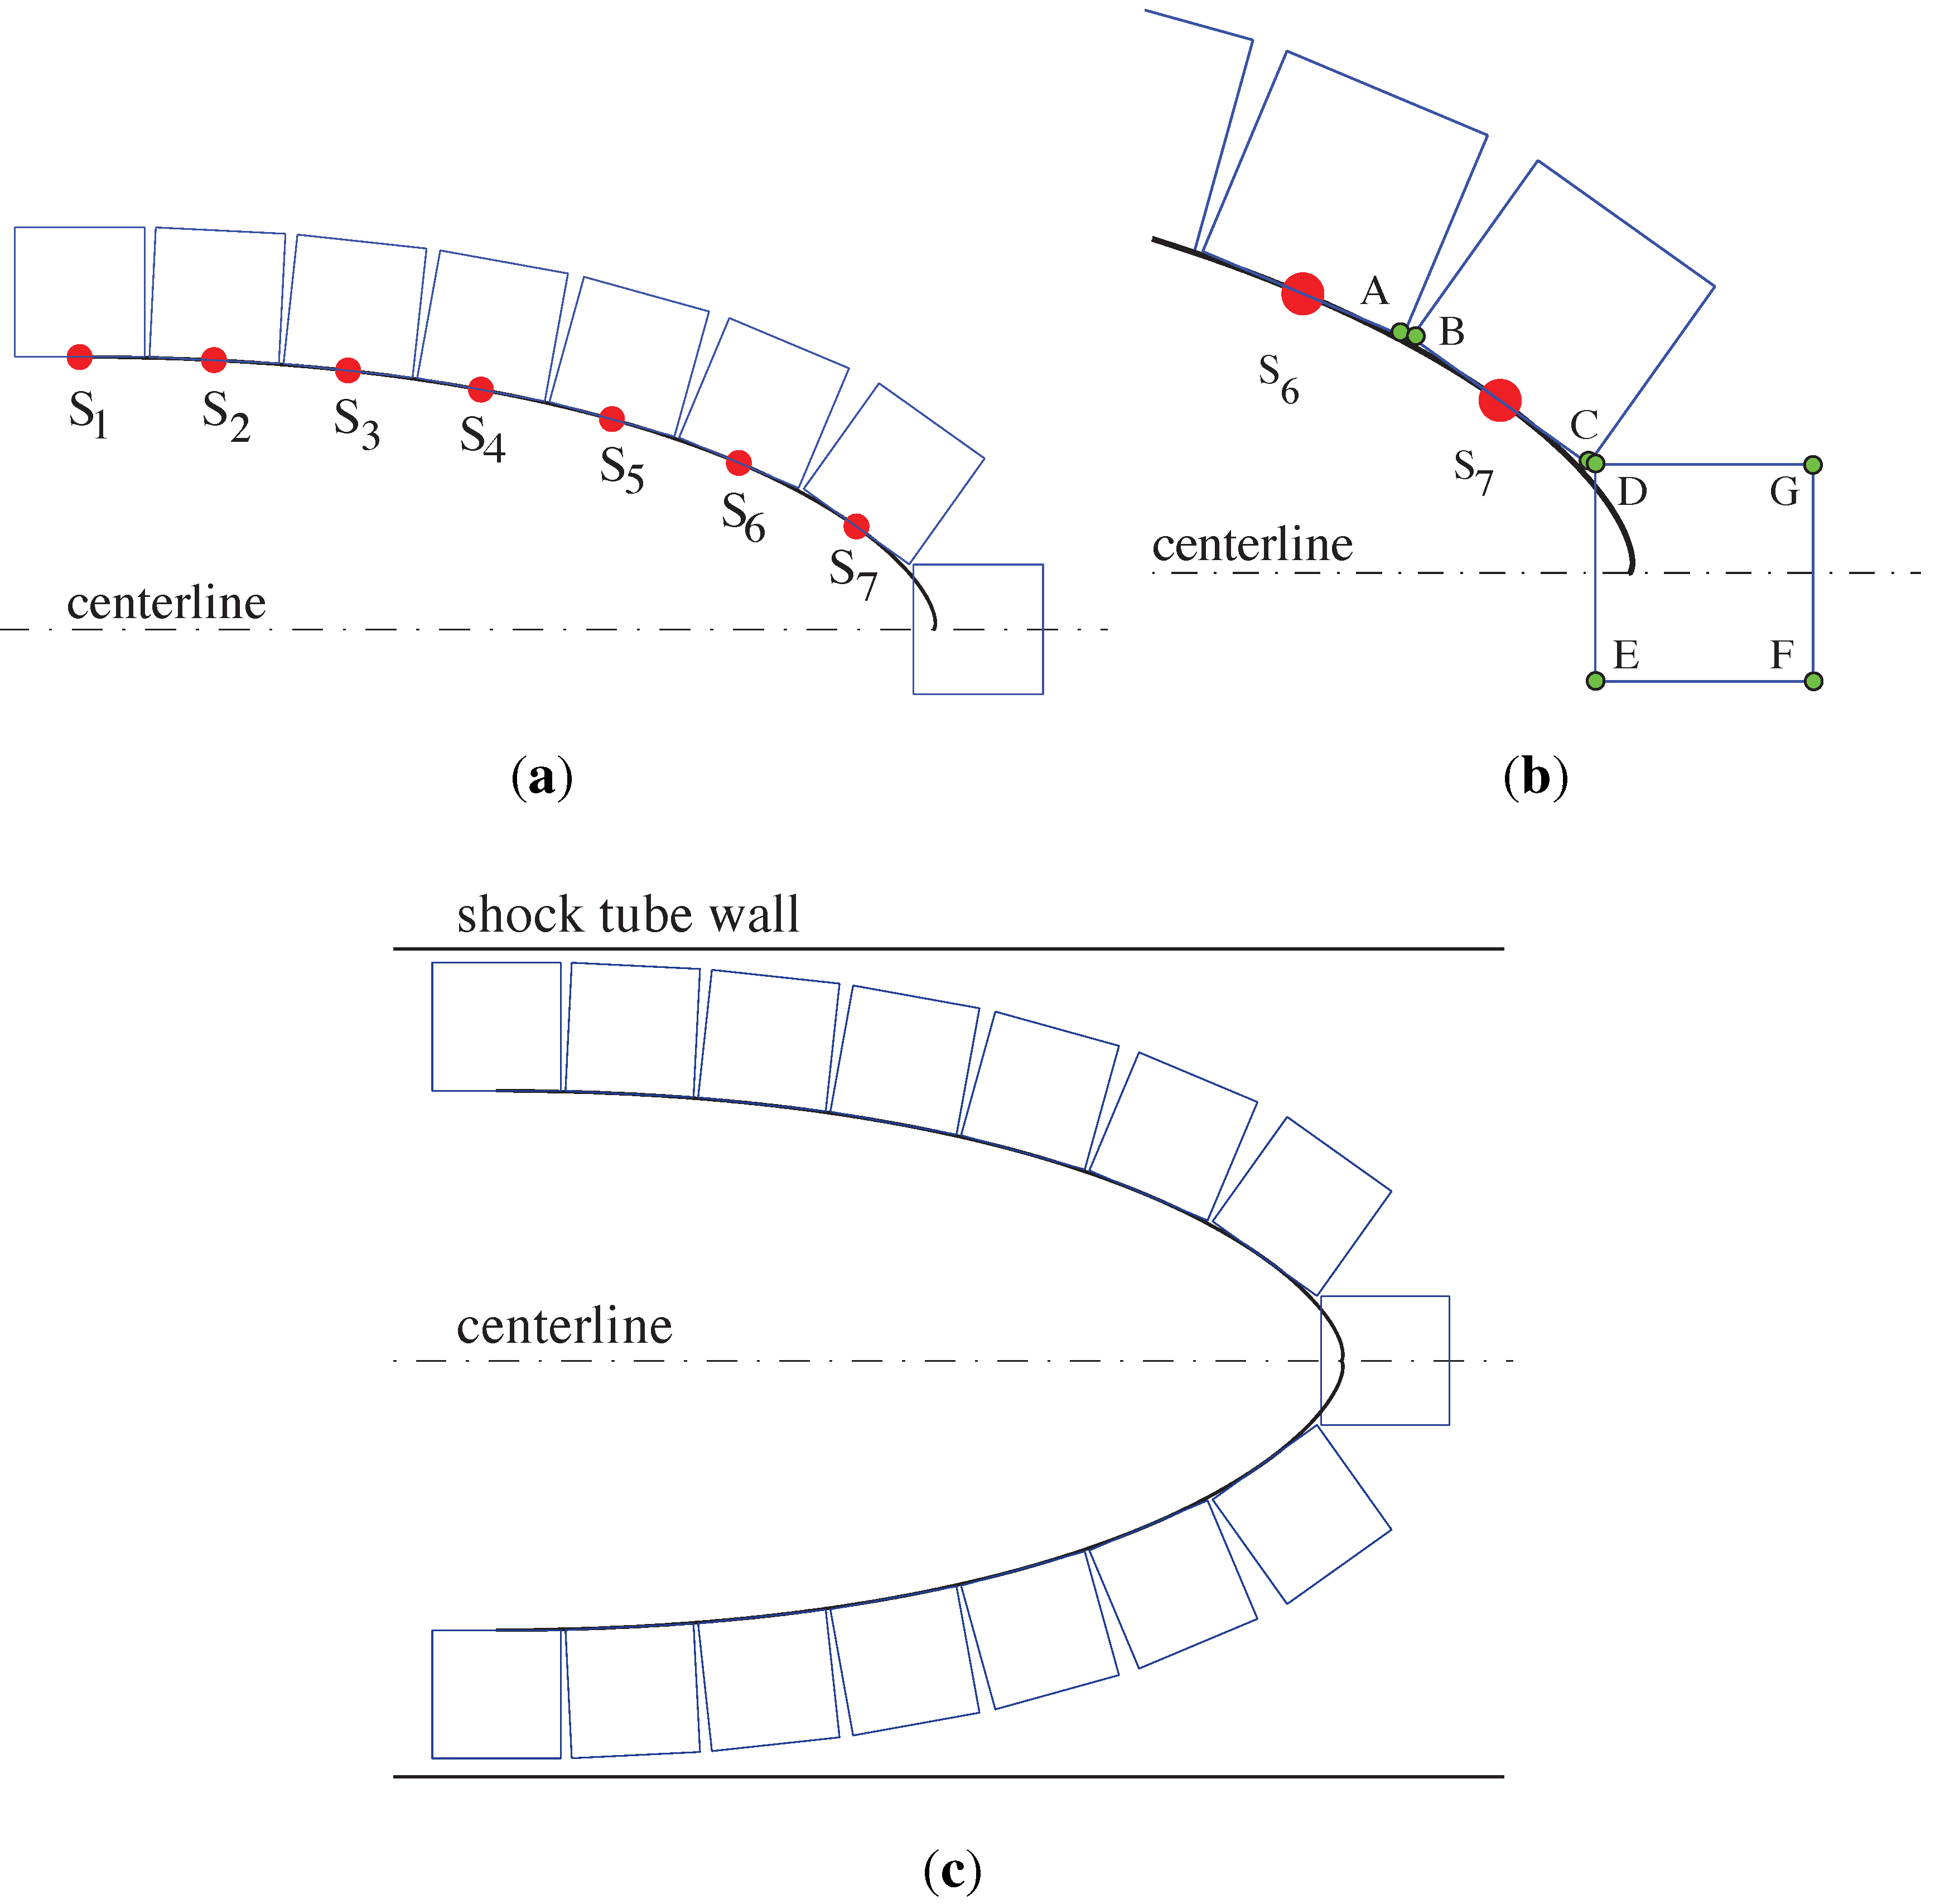
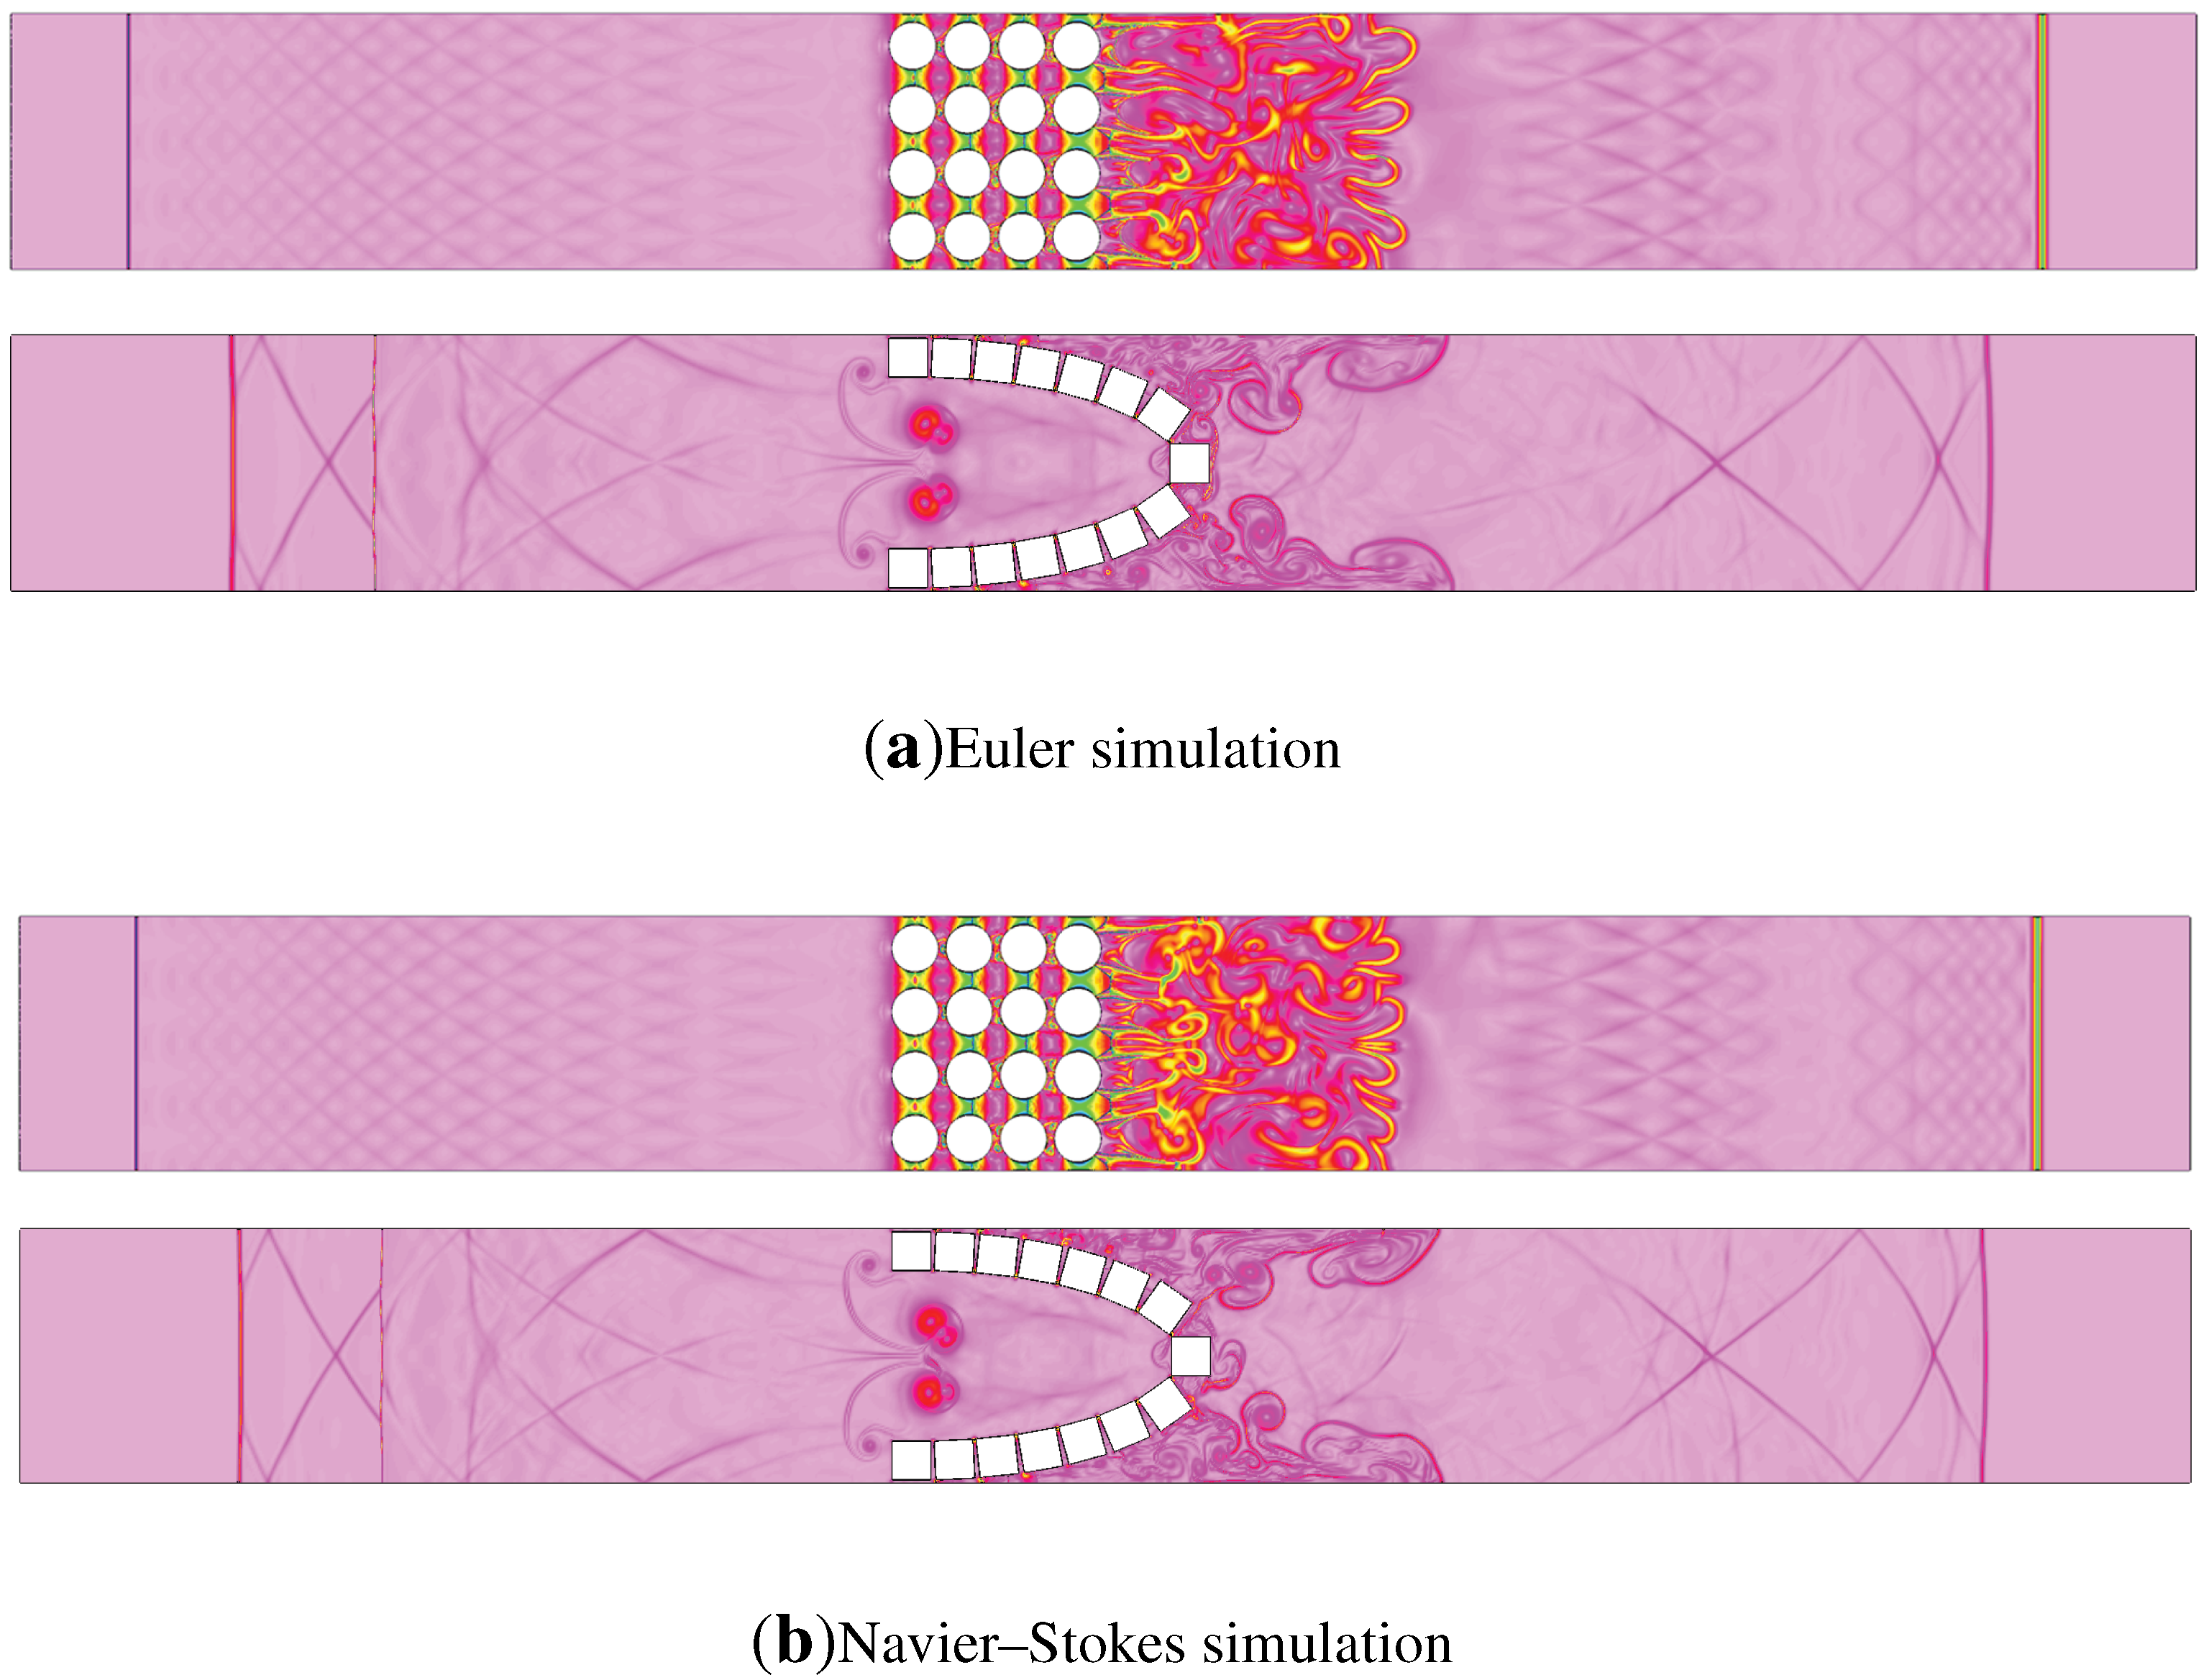
Figure 4. The second case is a logarithmic spiral case with square obstacles. The Reynolds number for these cases is approximately
, which is calculated as
. Here,
kg/m
,
m/s,
m and dynamic viscosity
kg/(ms). The Prandtl number is set to be
, and the thermal conductivity is
. Pressure
is defined as the initial pressure set in the low pressure part of the shock tube,
Pa, and
is the initial high pressure behind the incident shock wave,
Pa. Then, the simulations were repeated using the inviscid Euler equations, and the results were compared.
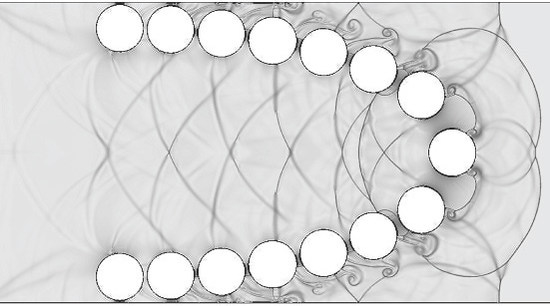
Figure 4.
Schlieren contour for shock wave propagation past non-staggered cylindermatrix and squares along a logarithmic spiral under (a) inviscid Euler equations and (b) full Navier–Stokes equations.
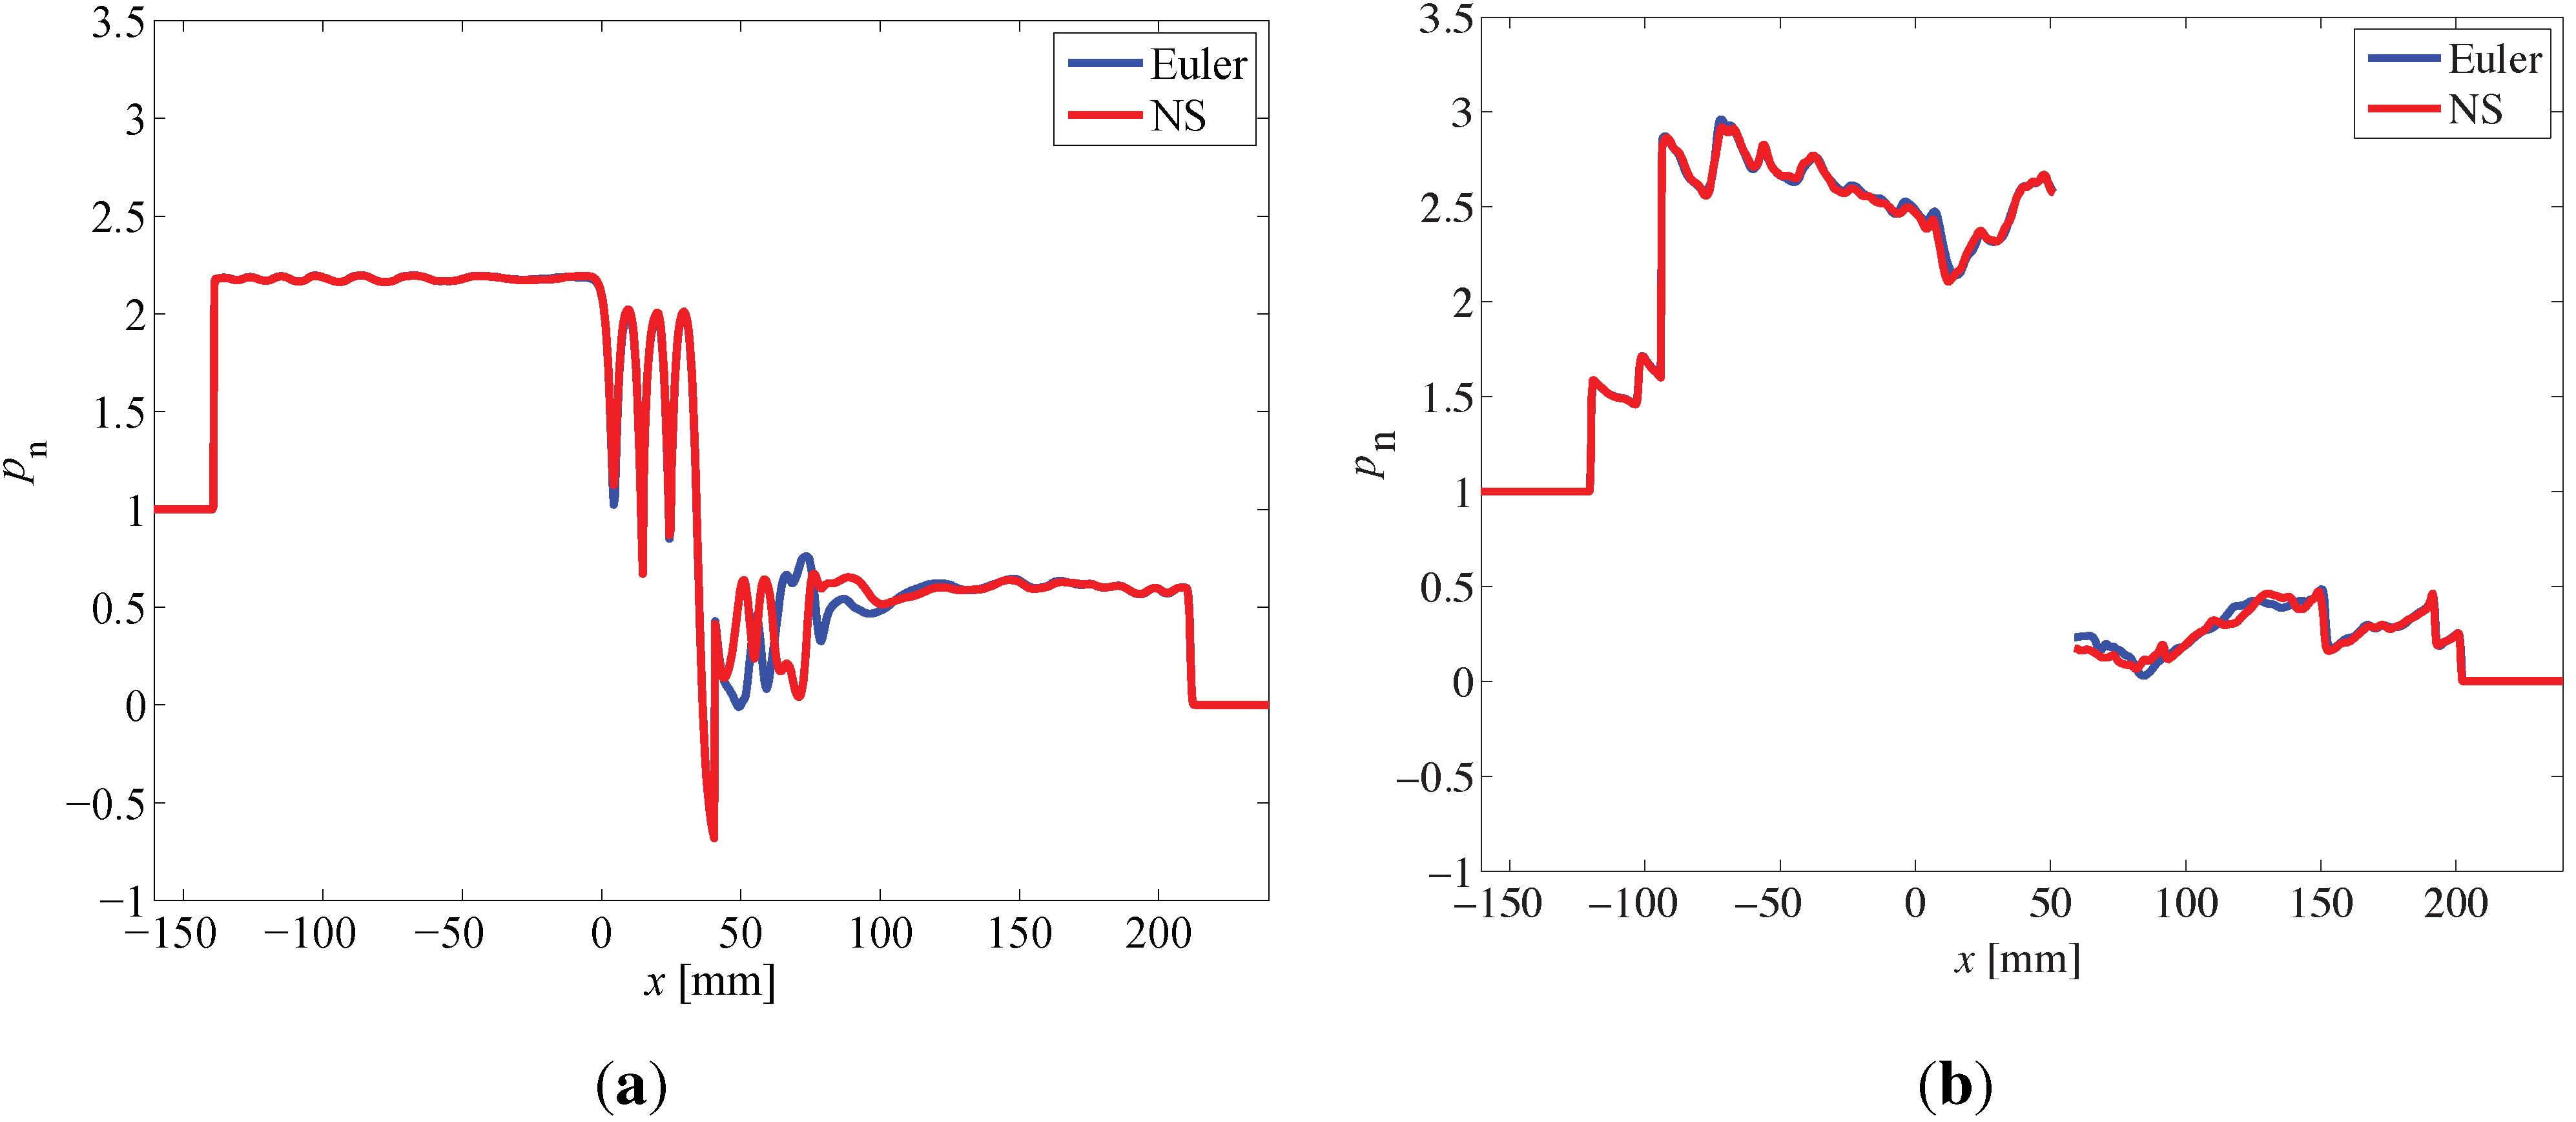
The corresponding non-dimensional pressure (
) for these two cases is plotted in
Figure 5 at
s. The curves in
Figure 5b are discontinuous due to the obstacle placed at the centerline. The non-dimensional pressure is defined as
, where
p is dimensional pressure measured by the probe. As shown in the figure, the reflected and transmitted shock waves are at the same location for the two simulations, and the amplitudes of the peak pressures are the same for both cases. The only difference of the two cases is the area with the turbulence right behind the obstacles. From the collected pressure data at the downstream probe for the non-staggered cylinder (NC) and logarithmic spiral square (LSS) cases (for a grid resolution
mm for the background grid and the smallest grid size
m, including AMR), the difference is only 2.6% for NC and 2.7% for LSS between time-averaged non-dimensional pressures for full Navier–Stokes and inviscid Euler simulation.
Figure 5.
Dimensionless pressure, , along the centerline for Navier–Stokes and Euler simulations at time instant μs for non-staggered cylinders (NC) and logarithmic spiral squares (LSS). (a) NC; (b) LSS.
Moreover, to quantify the effect of viscosity, the standard deviation between the Euler and theNavier–Stokes results shown in
Figure 5 was calculated. Pressure data was collected at 2000 points along the centerline of the shock tube for both cases at a time instant of
μs. Then, the pressure difference between the two sets of simulation data for each point in space was calculated. Thus, a dataset containing pressure differences was obtained, for which every element should be close to zero. The standard deviation,
, of this dataset was calculated using Equation (11).
where
N is the total number of the data points,
,
is the pressure difference at each point between the Euler and Navier–Stokes simulations and
is the average pressure difference along the centerline. The standard deviation for pressure difference of the LSS case is
Pa along the centerline, which is only 2.5% of the initial constant inlet high pressure,
Pa. The standard deviation for pressure difference of the NC case is
Pa, which is about 6.5% of the initial constant inlet high pressure. Therefore, because these differences were small and the choice of equations does not influence the shock positions, the rest of the cases were run using the Euler equations.
3.1. Numerical Results for Obstacle Arrays
Collection of data starts when the shock wave first impacts the leading edge of the obstacles, and the simulation then lasts for about 500
μs. Numerical schlieren plots for nine different obstacle configurations at time instant
μs are shown in
Figure 6. The first four cases, from top to bottom, are arranged in non-staggered columns (NS, NC, non-staggered forward triangle (NFT), non-staggered backward triangle (NBT)). The fifth and sixth cases (staggered square (SS) and staggered cylinder (SC)) are arranged in staggered patterns. The obstacles in the seventh, eighth and ninth cases are placed along a logarithmic spiral (LSS, SLS, logarithmic spiral cylinder (LCS)). The reflected and transmitted shocks and vortices behind the obstacles are clearly visualized in the schlieren plots. Of the first six cases, the NFT case most efficiently minimizes the transmitted shock, and NBT most efficiently reduces the reflected shock wave. The fluid velocities downstream of the obstacle arrays are smaller for staggered cases than non-staggered cases.
Figure 6.
Top to bottom: NS, NC, NBT, NFT, SS, SC, LSS, SLS and LCS schlieren contours taken at
μs after the shock first impacts the obstacle array. The locations of the incident shock wave and the reflected shock wave are marked with arrows. Note: the first six cases, from top to bottom, are reproduced from [
15].
In the LSS case, not only is the transmitted shock delayed more than for the previous cases, but the reflected shock wave is also delayed. Part of the shock propagates through the barrier, while the rest is reflected. The gaps between the square obstacles change the direction of portions of the incident shock, deflecting it towards the walls of the shock tube. Therefore, some of the energy is lost through dissipation near the walls as vortices are formed. During shock wave propagation through the obstacles, part of the initial horizontal kinetic energy is converted to kinetic energy in the vertical direction, especially in regions around the slits between adjacent square obstacles. In these areas, more than 80%–90% of the kinetic energy has been directed in the vertical direction after 250 μs.
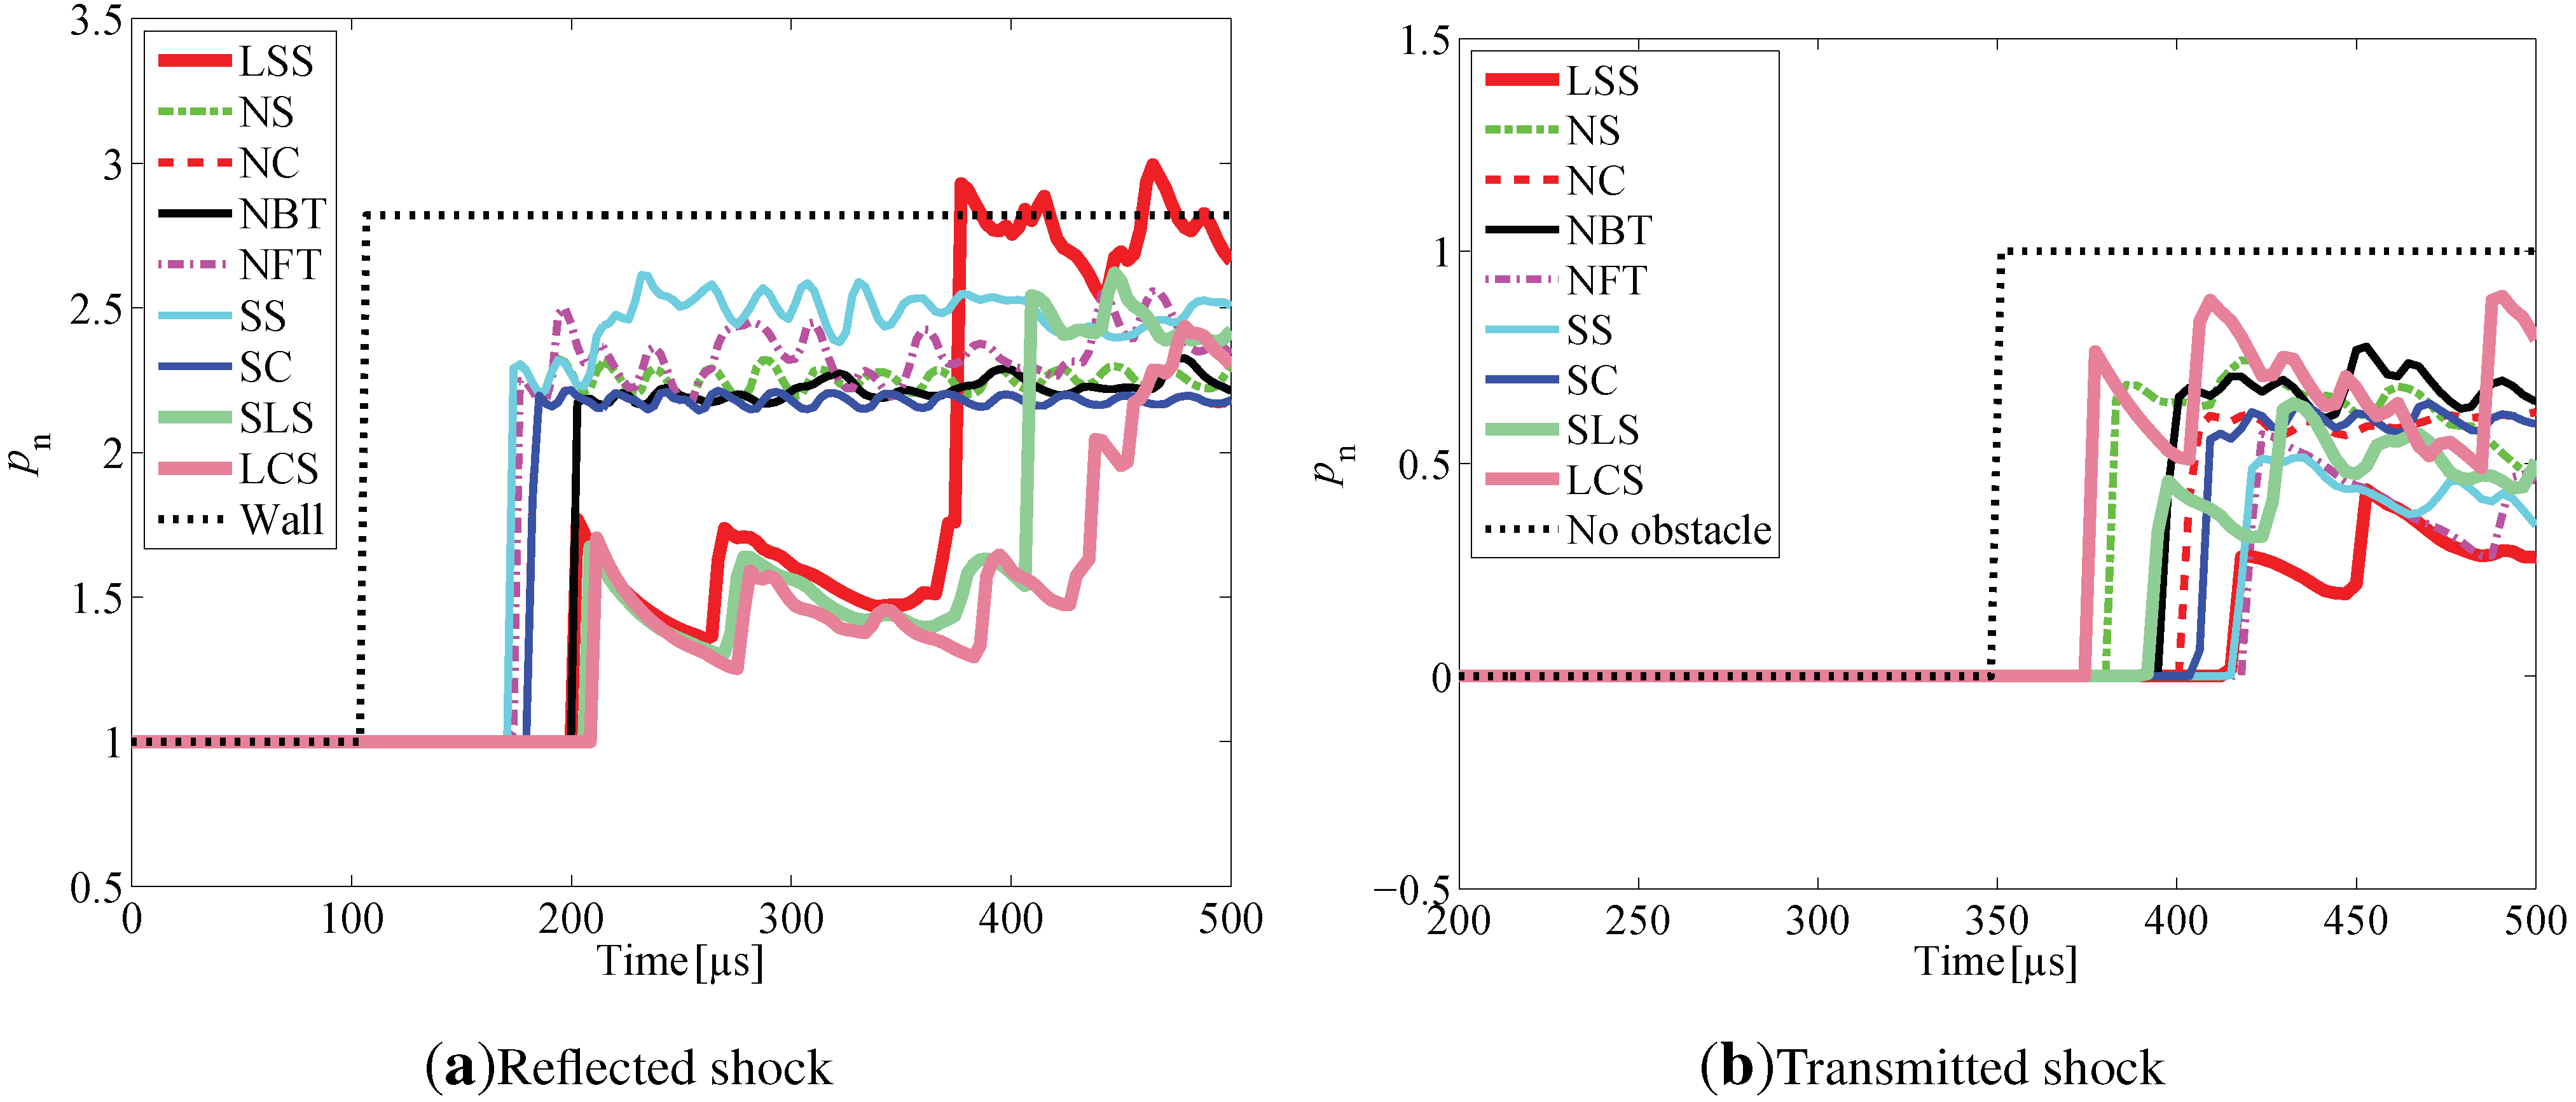
Non-dimensional pressures as functions of time recorded at both probe locations for all cases are shown in
Figure 7. In addition to the cases described earlier, reflection from a solid wall located at the leading edge,
, and incident shock propagation without encountering any type of obstacles are also taken into consideration for comparison purposes. For all cases, there is a pressure jump when the shock wave initially reaches the probe. For most cases, the pressure oscillates around a particular high pressure. As seen in
Figure 7b, the pressure for the LSS case is smaller than the rest of the cases. However, as seen in
Figure 7a, the pressure amplitude of the reflected shock for the LSS case is lower than other cases, but for later times, the peak pressure is the highest. Note that in the LSS case shown in
Figure 6, there are two reflected shocks traveling leftward. The first shock is the reflection from the leading edge of the obstacles, while the second shock following behind the first reflected shock is the reflection from the deep end of the logarithmic spiral curve. For other matrix cases, only one reflected shock is generated. Comparing with other cases, the first reflected shock is weaker than that in other cases, because the pressure amplitude of the first reflected shock is lower than other cases. The pressure jump across the second shock is higher, so the second reflected shock is stronger than the first.
Figure 7.
Plot of dimensionless pressure, , at (a) upstream probe and (b) downstream probe , as functions of time for all cases.
Figure 7.
Plot of dimensionless pressure, , at (a) upstream probe and (b) downstream probe , as functions of time for all cases.
The time-averaged overpressure after the shock reaches the probes and the time when the shock wave arrives at the probes are two indicators that measure the effectiveness of the obstacle barriers. The time-averaged overpressure is defined as
. The time-averaged pressure,
, is defined as
,
, where
and
are the final and start time when pressure data are collected. Using subscript
r to denote the overpressure for the reflected shock and subscript
t to denote the overpressure for the transmitted shock, the time-averaged overpressure data,
and
, collected at the probes from time
to
are presented in
Table 2, along with the times,
and
, when the shock reaches the probes. Larger
and
and smaller
and
mean that the obstacles more efficiently attenuate the incident shock wave. Results show that the LSS case produces the smallest time-averaged pressure in the region downstream of the obstacle area, for all cases, and in the upstream region, it is smaller than the matrix arrangements, but larger than the SLS and LCS cases.
Table 2.
Comparison of time-averaged overpressure
,
, shock arrival time at the upstream probe,
, and downstream probe,
, and the difference
.
Results reported in [
15].
Table 2.
Comparison of time-averaged overpressure , , shock arrival time at the upstream probe, , and downstream probe, , and the difference . Results reported in [15].
| Case | | | (μs) | (μs) | (%) |
|---|
| NS | 2.25 | 0.61 (0.58 ) | 174 | 377 | 5.2 |
| NC | 2.18 | 0.54 (0.56 ) | 182 | 395 | −3.6 |
| NBT | 2.22 | 0.62 (0.55 ) | 203 | 389 | 12.7 |
| NFT | 2.33 | 0.38 (0.37 ) | 174 | 412 | 2.7 |
| SS | 2.47 | 0.38 (0.24 ) | 174 | 406 | 58.3 |
| SC | 2.18 | 0.54 (0.55 ) | 182 | 398 | −1.8 |
| LSS | 2.06 | 0.27 (−) | 203 | 409 | – |
| SLS | 1.79 | 0.43 (−) | 209 | 383 | – |
| LCS | 1.62 | 0.66 (−) | 211 | 374 | – |
A direct comparison between the pressure values reported in [
15] (all obtained from the full Navier–Stokes equations) and the ones presented here (using the inviscid Euler equations) shows somewhat different results, with comparable results for NS, NC, NFT and SC cases (<
difference), somewhat comparable to the NBT case (<
difference), but a large discrepancy for the SS case (<
difference); see
Table 2. One likely reason that the SS cases are different is the way the obstacles are represented. Here, the squares have slightly rounded corners, and this will influence the flow around them. A comparison among the logarithmic spiral cases shows that the transmitted shock for both the LCS and the SLS case reach the probe earlier than the LSS case. This is due to a combination of obstacle shape and gap size between obstacles; more details on effective flow area are in
Section 3.3.
Then, the impulse for both reflected and transmitted shocks is computed for three different time intervals; see
Table 3. The impulses are calculated from the time when the reflected shock reaches the probe, and only the pressure that is higher than the initial pressure before the shock arrives contributes to the impulse. The reflected shocks reach the probe relatively early in the simulation, so the impulses were calculated for 100-, 200- and 300-
μs time intervals. The transmitted shocks reach the probe at a later time, so the impulses were calculated for shorter time spans of 30, 60 and 90
μs. For the transmitted shock, the LSS case results in the lowest impulse, and for the reflected shock, the LSS case is lower than any of the matrix-arranged obstacles, but higher than the other two logarithmic spiral shapes.
Table 3.
Impulse, I, recorded by the upstream (reflected shock) and downstream (transmitted shock) probes for three time intervals. Units in Pa·s.
Table 3.
Impulse, I, recorded by the upstream (reflected shock) and downstream (transmitted shock) probes for three time intervals. Units in Pa·s.
| Case | Reflected Shock | | Transmitted shock |
|---|
| | | | | | |
|---|
| NS | 1.87 | 3.74 | 5.61 | | 0.24 | 0.55 | 1.24 |
| NC | 1.75 | 3.51 | 5.27 | | 0.18 | 0.45 | 1.11 |
| NBT | 1.77 | 3.61 | 5.46 | | 0.20 | 0.50 | 1.22 |
| NFT | 1.88 | 3.88 | 5.94 | | 0.16 | 0.35 | 0.92 |
| SS | 2.12 | 4.36 | 6.55 | | 0.13 | 0.32 | 0.91 |
| SC | 1.75 | 3.51 | 5.27 | | 0.23 | 0.50 | 1.17 |
| LSS | 0.84 | 2.13 | 4.75 | | 0.08 | 0.23 | 0.76 |
| SLS | 0.72 | 1.44 | 3.60 | | 0.11 | 0.32 | 0.96 |
| LCS | 0.67 | 1.31 | 2.88 | | 0.25 | 0.60 | 1.29 |
3.2. Effects of Incident Shock Mach Number
Because the logarithmic spiral shape used here is designed for a specific incident shock Mach number,
, two additional cases,
and
, were simulated to understand how well this particular shape works for off-design Mach numbers.
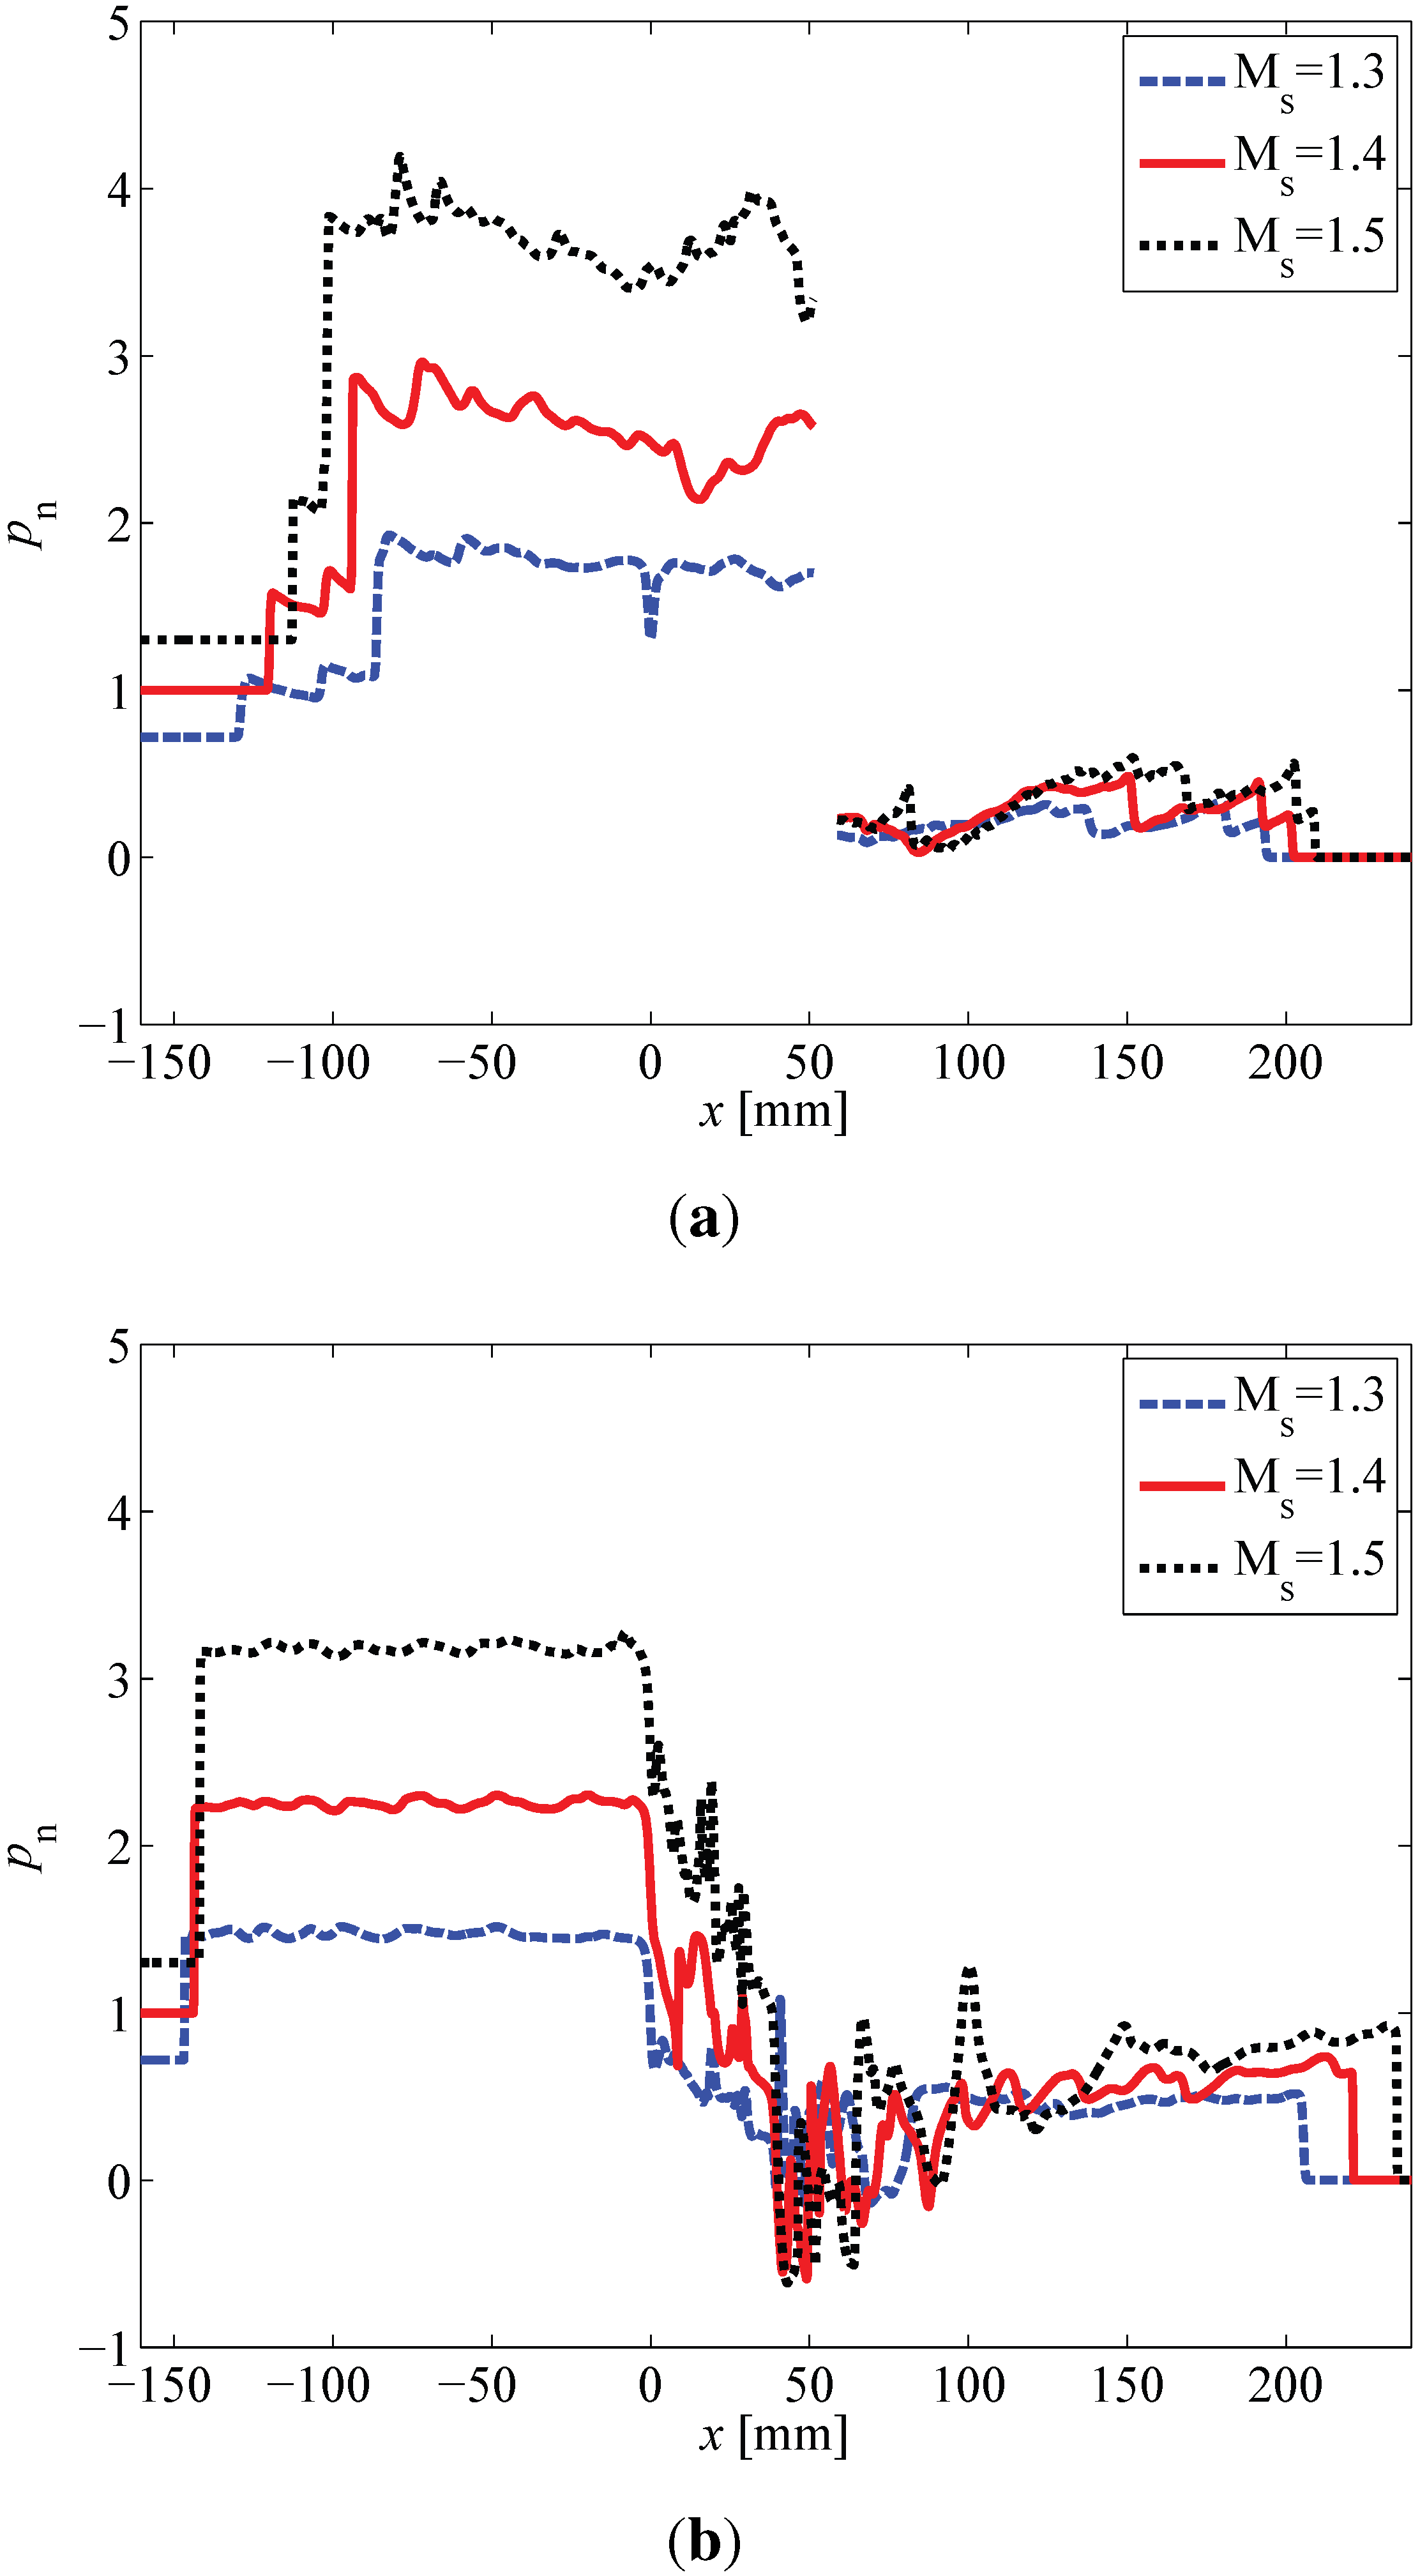
Figure 8 shows the pressure distribution along the centerline for
= 1.3, 1.4 and 1.5 for the LSS and NS cases at
μs. The discontinuity in
Figure 8a is due to the square obstacle placed at the centerline at the tip of the spiral. It can be seen that for a higher incoming Mach number, the stronger the transmitted and reflected shocks are, which is due to more energy contained in the shock wave. Especially, the pressure behind the reflected shocks increases when
is increased from 1.3 to 1.5.
To compare the degree of shock attenuation for the reflected and transmitted shocks of the LSS and NS cases, we defined the pressure ratio of the pressure behind the shock and the initial high pressure in
Table 4. Results show that for both the LSS and NS cases, the pressure ratio for
is smaller than that for
, which means that the current logarithmic spiral shape is more effective for
than
to mitigate the transmitted shock and similarly for the NS case. However, for
in the LSS case, this pressure ratio is even lower than the
case, which means that the transmitted shock is more attenuated for higher shock Mach numbers. However, for the NS case at
, the pressure ratio is higher than the ratio for
. Comparing upstream pressure ratios for the NS with the LSS case, it is found that the pressure ratios behind the reflected shock for the NS cases are all lower than the LSS cases, with 16% lower on average.
Figure 8.
Dimensionless pressure, , along the centerline of (a) LSS and (b) NS for and at time instant μs.
Figure 8.
Dimensionless pressure, , along the centerline of (a) LSS and (b) NS for and at time instant μs.
Table 4.
The ratio of the peak pressure measured behind the transmitted and reflected shocks along the centerline of the shock tube at time μs to the initial high pressure behind the incident shock, and , where the subscript t denotes transmitted shock and r denotes reflected shock.
Table 4.
The ratio of the peak pressure measured behind the transmitted and reflected shocks along the centerline of the shock tube at time μs to the initial high pressure behind the incident shock, and , where the subscript t denotes transmitted shock and r denotes reflected shock.
| Case | LSS | | NS |
|---|
| | | | | | |
|---|
| 0.757 | 0.728 | 0.678 | | 1.23 | 0.861 | 0.985 |
| 1.75 | 2.04 | 2.32 | | 1.50 | 1.69 | 1.90 |
Doing the same comparison for the reflected shock yields a different result. As shown in
Table 4, the reflected shock has been most effectively attenuated for the lower Mach number cases and least for the higher Mach number case. Comparing NS with LSS regarding the pressure ratios at the downstream position shows that the pressure ratios behind the transmitted shock for the LSS cases are all lower than the NS cases, about 28% lower on average. To sum up, this logarithmic spiral shape, initially designed for
, has a higher ability of decreasing the pressure of transmitted shocks for incident Mach numbers that are larger or equal to the design Mach number, than Mach numbers that are lower than the design Mach number. On the other hand, this shape reduces the pressure of the reflected shock more when the incident Mach number is less than or equal to the design Mach number compared to the higher Mach number cases.
3.3. Effective Flow Area and Sensitivity of Obstacle Size
To be able to compare the result from one case to another, one way is to define an effective flow area. The effective flow area with regard to the gaps along the columns in [
15] is defined as follows,
where
is the number of obstacles in a column,
is the diameter of the
i-th obstacle and
H is the height of the shock tube. For the logarithmic spiral cases, the obstacles are not placed in subsequent columns, so the effective flow area is calculated with the following formula,
where
is the number of gaps and
is the gap size projection in the
y-direction perpendicular to the shock propagation direction).
Table 5 summarizes the effective flow area for all cases. If, instead, the gap projection area in the
x-direction is used,
where
is the gap size projection in the
x-direction (shock propagation direction).
By comparing the previous results from
Table 2 and
Table 5, with an
for SLS
larger than that for the LSS case and with an
larger than that for the LSS case, the overpressure for the transmitted shock,
, has a
increase, while the overpressure for the reflected shock,
, has a
decrease. Thus, the overpressure downstream is increasing rapidly, and overpressure upstream is decreasing relatively slow as
and
increase for the logarithmic spiral cases. The geometric pattern of placing the square obstacles is similar in both the SLS and LSS case. However, the effective flow area is different. It is likely that the transmitted shock travels faster in the SLS case than in LSS case due to the increase of the gap size between the obstacles.
Table 5.
The effective flow area. For matrix arrangements, case NC–SS, Equation (12) is used to calculate , and for logarithmic spiral cases, LSS–SLS, Equation (13) is used to calculate .
Table 5.
The effective flow area. For matrix arrangements, case NC–SS, Equation (12) is used to calculate , and for logarithmic spiral cases, LSS–SLS, Equation (13) is used to calculate .
| Case | or | |
|---|
| NC | 0.25 | – |
| NS | 0.25 | – |
| SC | 0.25 | – |
| NBT | 0.25 | – |
| NFT | 0.25 | – |
| SC | 0.25 | – |
| SS | 0.25 | – |
| LSS | 0.0091 | 0.080 |
| LCS | 0.14 | 0.21 |
| SLS | 0.036 | 0.23 |
