3.4.1. Item-Number Analysis Based on Generalizability Theory
Given that the one-factor structure of the CD-RISC-10 was supported as an adequate working representation, generalizability theory (GT) was further used to examine sources of score reliability and to evaluate whether the scale could maintain acceptable measurement reliability after item reduction.
The variance component estimates from the G-study are shown in
Table 5. The variance component for the pilot main effect was 0.2252533, accounting for approximately 43.33% of the total variance. This indicated clear individual differences in psychological resilience scores among pilots. The variance component for the item main effect was 0.0296799, accounting for approximately 5.71% of the total variance. This indicated small differences in average item scores, suggesting limited differences among items in overall difficulty or average response level. The variance component for the pilot-by-item interaction was 0.2649381, accounting for approximately 50.96% of the total variance, and was the largest source of variance in the model. This result showed that pilots differed in their response patterns across items. It also indicated that total-score reliability indices alone were insufficient for judging the retention value of specific items.
The D-study results are shown in
Table 6. Under the full 10-item condition, the CD-RISC-10 had a G coefficient of 0.89476 and a phi coefficient of 0.88433, indicating high reliability for both relative and absolute decisions in the present sample. As the number of items decreased, both the G coefficient and phi coefficient declined gradually. This indicated that item reduction reduced measurement stability, although the overall decrease was relatively modest. When the number of items was reduced to five, the G coefficient remained above 0.80 (G = 0.80956), indicating that five items could maintain acceptable reliability if the primary purpose was to compare relative differences in resilience among pilots. However, the phi coefficient under the five-item condition was 0.79265, slightly below 0.80, and therefore did not meet the prespecified point-estimate criterion for absolute decisions. When six items were retained, both the G coefficient (0.83610) and phi coefficient (0.82102) exceeded 0.80. Thus, under the point-estimate criterion and when both relative and absolute decisions were considered, six items provided the more conservative reference length.
Pilot-level bootstrap analyses indicated uncertainty around this boundary. For the five-item condition, the 95% bootstrap intervals were [0.761, 0.844] for G and [0.740, 0.829] for phi. For the six-item condition, the corresponding intervals were [0.792, 0.867] and [0.773, 0.854]. Because these intervals overlapped 0.80, the six-item result was interpreted as a development-sample point-estimate reference rather than as a universally guaranteed threshold.
Overall, the GT results identified six items as the point-estimate-based reference length for subsequent item-selection analysis, while the bootstrap intervals indicated uncertainty around this boundary.
3.4.2. Item Information Analysis Based on Item Response Theory
After the unidimensional structure of the CD-RISC-10 was shown to be generally acceptable, the graded response model (GRM) within item response theory (IRT) was further used to analyse the measurement characteristics of each item. The model information criteria were AIC = 3095.96 and BIC = 3252.32. Item parameter estimates are shown in
Table 7.
Limited-information fit assessment for the CD-RISC-10 yielded C2(35) = 79.78, p < 0.001, CFI = 0.976, TLI = 0.969, RMSEA = 0.082 (90% CI 0.058–0.105), and SRMSR = 0.062. The CFI, TLI, and SRMSR therefore indicated favourable incremental and residual fit, whereas the significant C2 test and RMSEA confidence interval indicated some remaining global misfit. The GRM was consequently interpreted as providing adequate but not unequivocal fit for item-level evaluation.
As a sensitivity diagnostic, M2*(7) = 28.33, p < 0.001, CFI = 0.688, TLI = 0.243, and RMSEA = 0.126 (90% CI [0.080, 0.176]). Because M2* had only seven degrees of freedom, it was not treated as the primary global-fit diagnostic. Nevertheless, its less favourable result reinforced the need for a cautious interpretation of the GRM fit.
The discrimination parameters (a) of the 10 items ranged from 1.636 to 2.874, with standard errors ranging from 0.255 to 0.438. Item 6 had the lowest discrimination estimate (a = 1.636, SE = 0.255, 95% CI [1.138, 2.135]). Except for item 6, which had a discrimination parameter of 1.636 and was slightly below the reference criterion of 1.70 for “very high discrimination”, the remaining nine items all had discrimination parameters greater than 1.70. This indicated that most items distinguished relatively well among pilots with different levels of psychological resilience. In the relative ranking, items 6, 1, 19, and 17 showed lower discrimination than the other items, with item 6 showing the lowest discrimination.
The threshold parameters generally increased as response categories increased, and no threshold disordering was observed. This indicated that the response categories of the CD-RISC-10 were ordered overall. For items 1 and 19, the lowest threshold parameter, b1, could not be stably estimated because no participant selected the 0-point response option (“not true at all”). For items 4, 6, 11, and 17, the absolute values of b1 were greater than 3, indicating that the transition point between the lowest response category and higher categories was located at the very low end of the latent trait distribution. This finding reflected the low use of the 0-point response option in the present sample. For item 6, b1 was −3.866, and the subsequent threshold parameters were also located toward the lower end of the latent trait distribution, indicating an uneven response-category distribution and relatively limited discrimination among pilots with lower resilience levels. Across the estimable threshold parameters, standard errors ranged from 0.105 to 0.774. The largest standard error was observed for the lowest threshold of item 6 (b1 = −3.866, SE = 0.774, 95% CI [−5.383, −2.349]), consistent with the sparse use of the lowest response categories. In terms of item fit, the unadjusted S−X2 p values ranged from 0.084 to 0.506, and the corresponding Holm-adjusted p values ranged from 0.839 to 1.000. Thus, no CD-RISC-10 item showed statistically significant item-level misfit after adjustment for multiple testing, and the item-fit results did not identify an item that required deletion solely on the basis of S−X2.
Four adjusted Q3 residual correlations exceeded 0.20 in absolute magnitude: items 6 and 7 (0.271), items 16 and 17 (0.270), items 17 and 19 (0.250), and items 16 and 19 (0.248). All four pairs involved at least one item later removed during the shortening procedure. These values were treated as post hoc local-dependence diagnostics and were not used as item-deletion criteria.
In terms of item information, item information values ranged from 4.191 to 9.895. The total information across the 10 items was 72.753, and the mean item information value was 7.275. Item 14 had the highest information value (9.895), followed by item 8 (9.423), item 7 (9.222), and item 11 (8.477), indicating that these items contributed more information for measuring the latent resilience trait. In contrast, item 6 had the lowest information value (4.191), followed by item 1 (5.020), item 19 (5.585), and item 17 (6.753). Item 16 also had an information value below the mean (6.932), but its value remained higher than those of the four lower-information items. These results indicated uneven measurement contributions among CD-RISC-10 items.
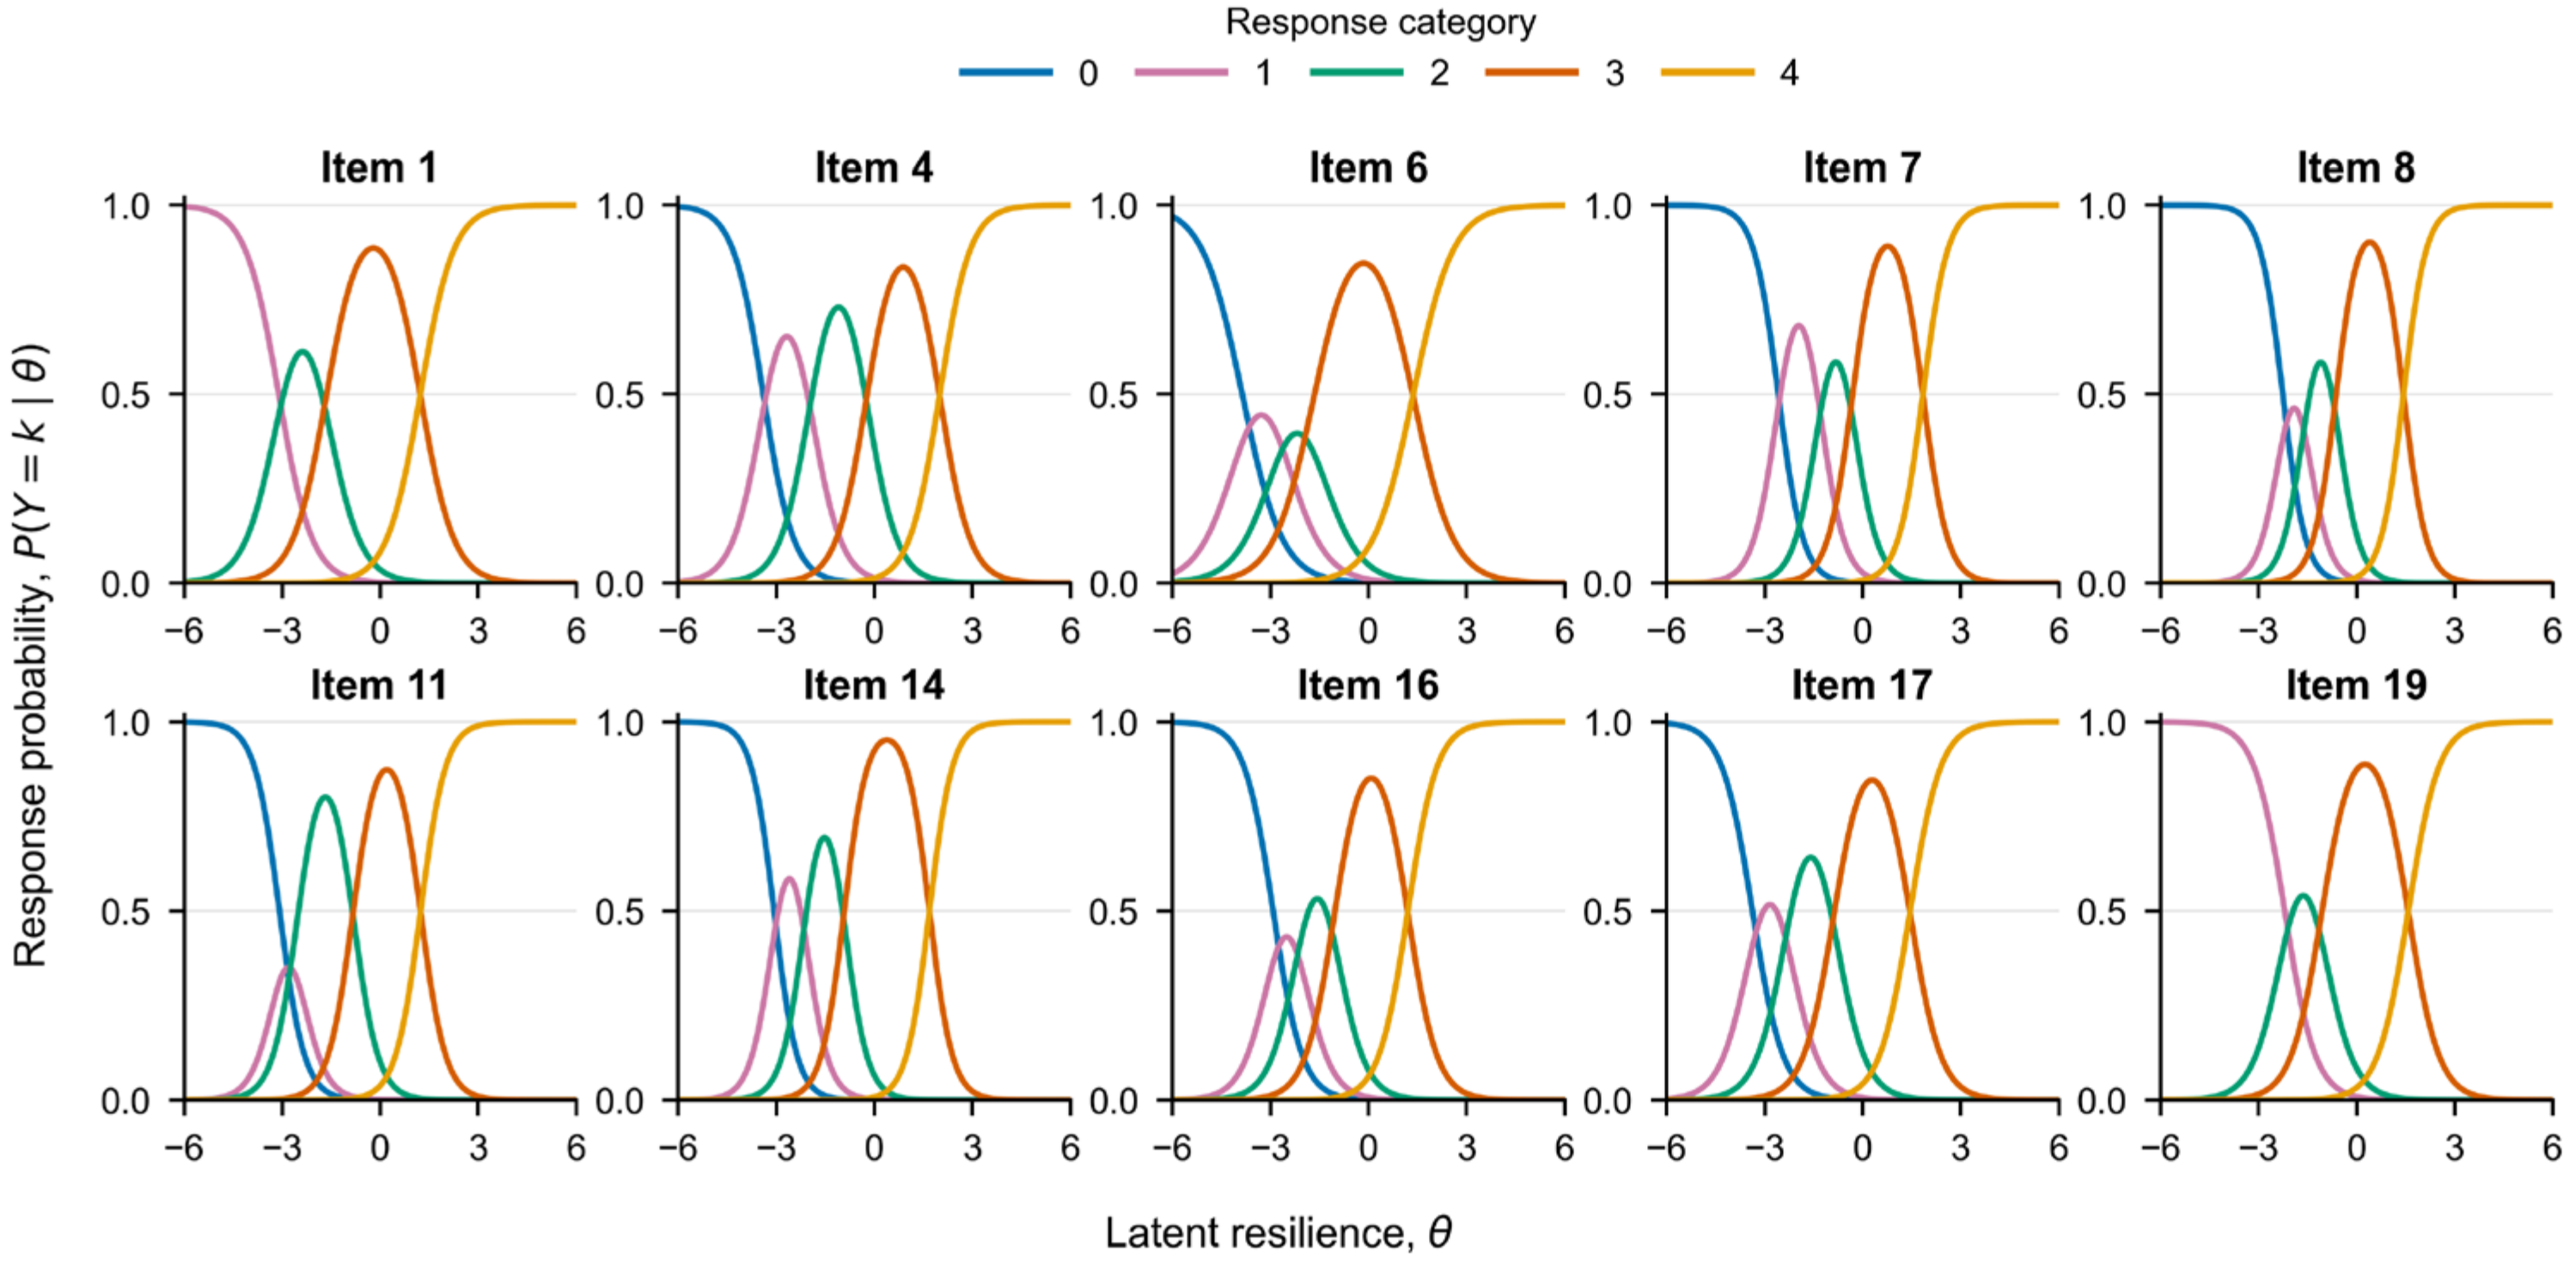
The category response curves are shown in
Figure 1. Because no participant selected the 0-point response option for items 1 and 19, their category response curves did not fully represent all five response categories. Overall, lower response categories, especially scores of 0 and 1, had low probabilities of being selected across several items, indicating sparse use of the lowest response options in the development sample. For items 6 and 11, the response curve for the 1-point category was relatively flat, indicating limited discrimination across different levels of latent resilience for this category. Some category response curves for item 6 also had low peaks, further indicating insufficient use of response categories and potentially reduced measurement efficiency for this item. Although item 11 also showed limited use of lower response categories, it had high item information and a good discrimination parameter. Therefore, it was not prioritized for deletion solely on the basis of its category response curves.
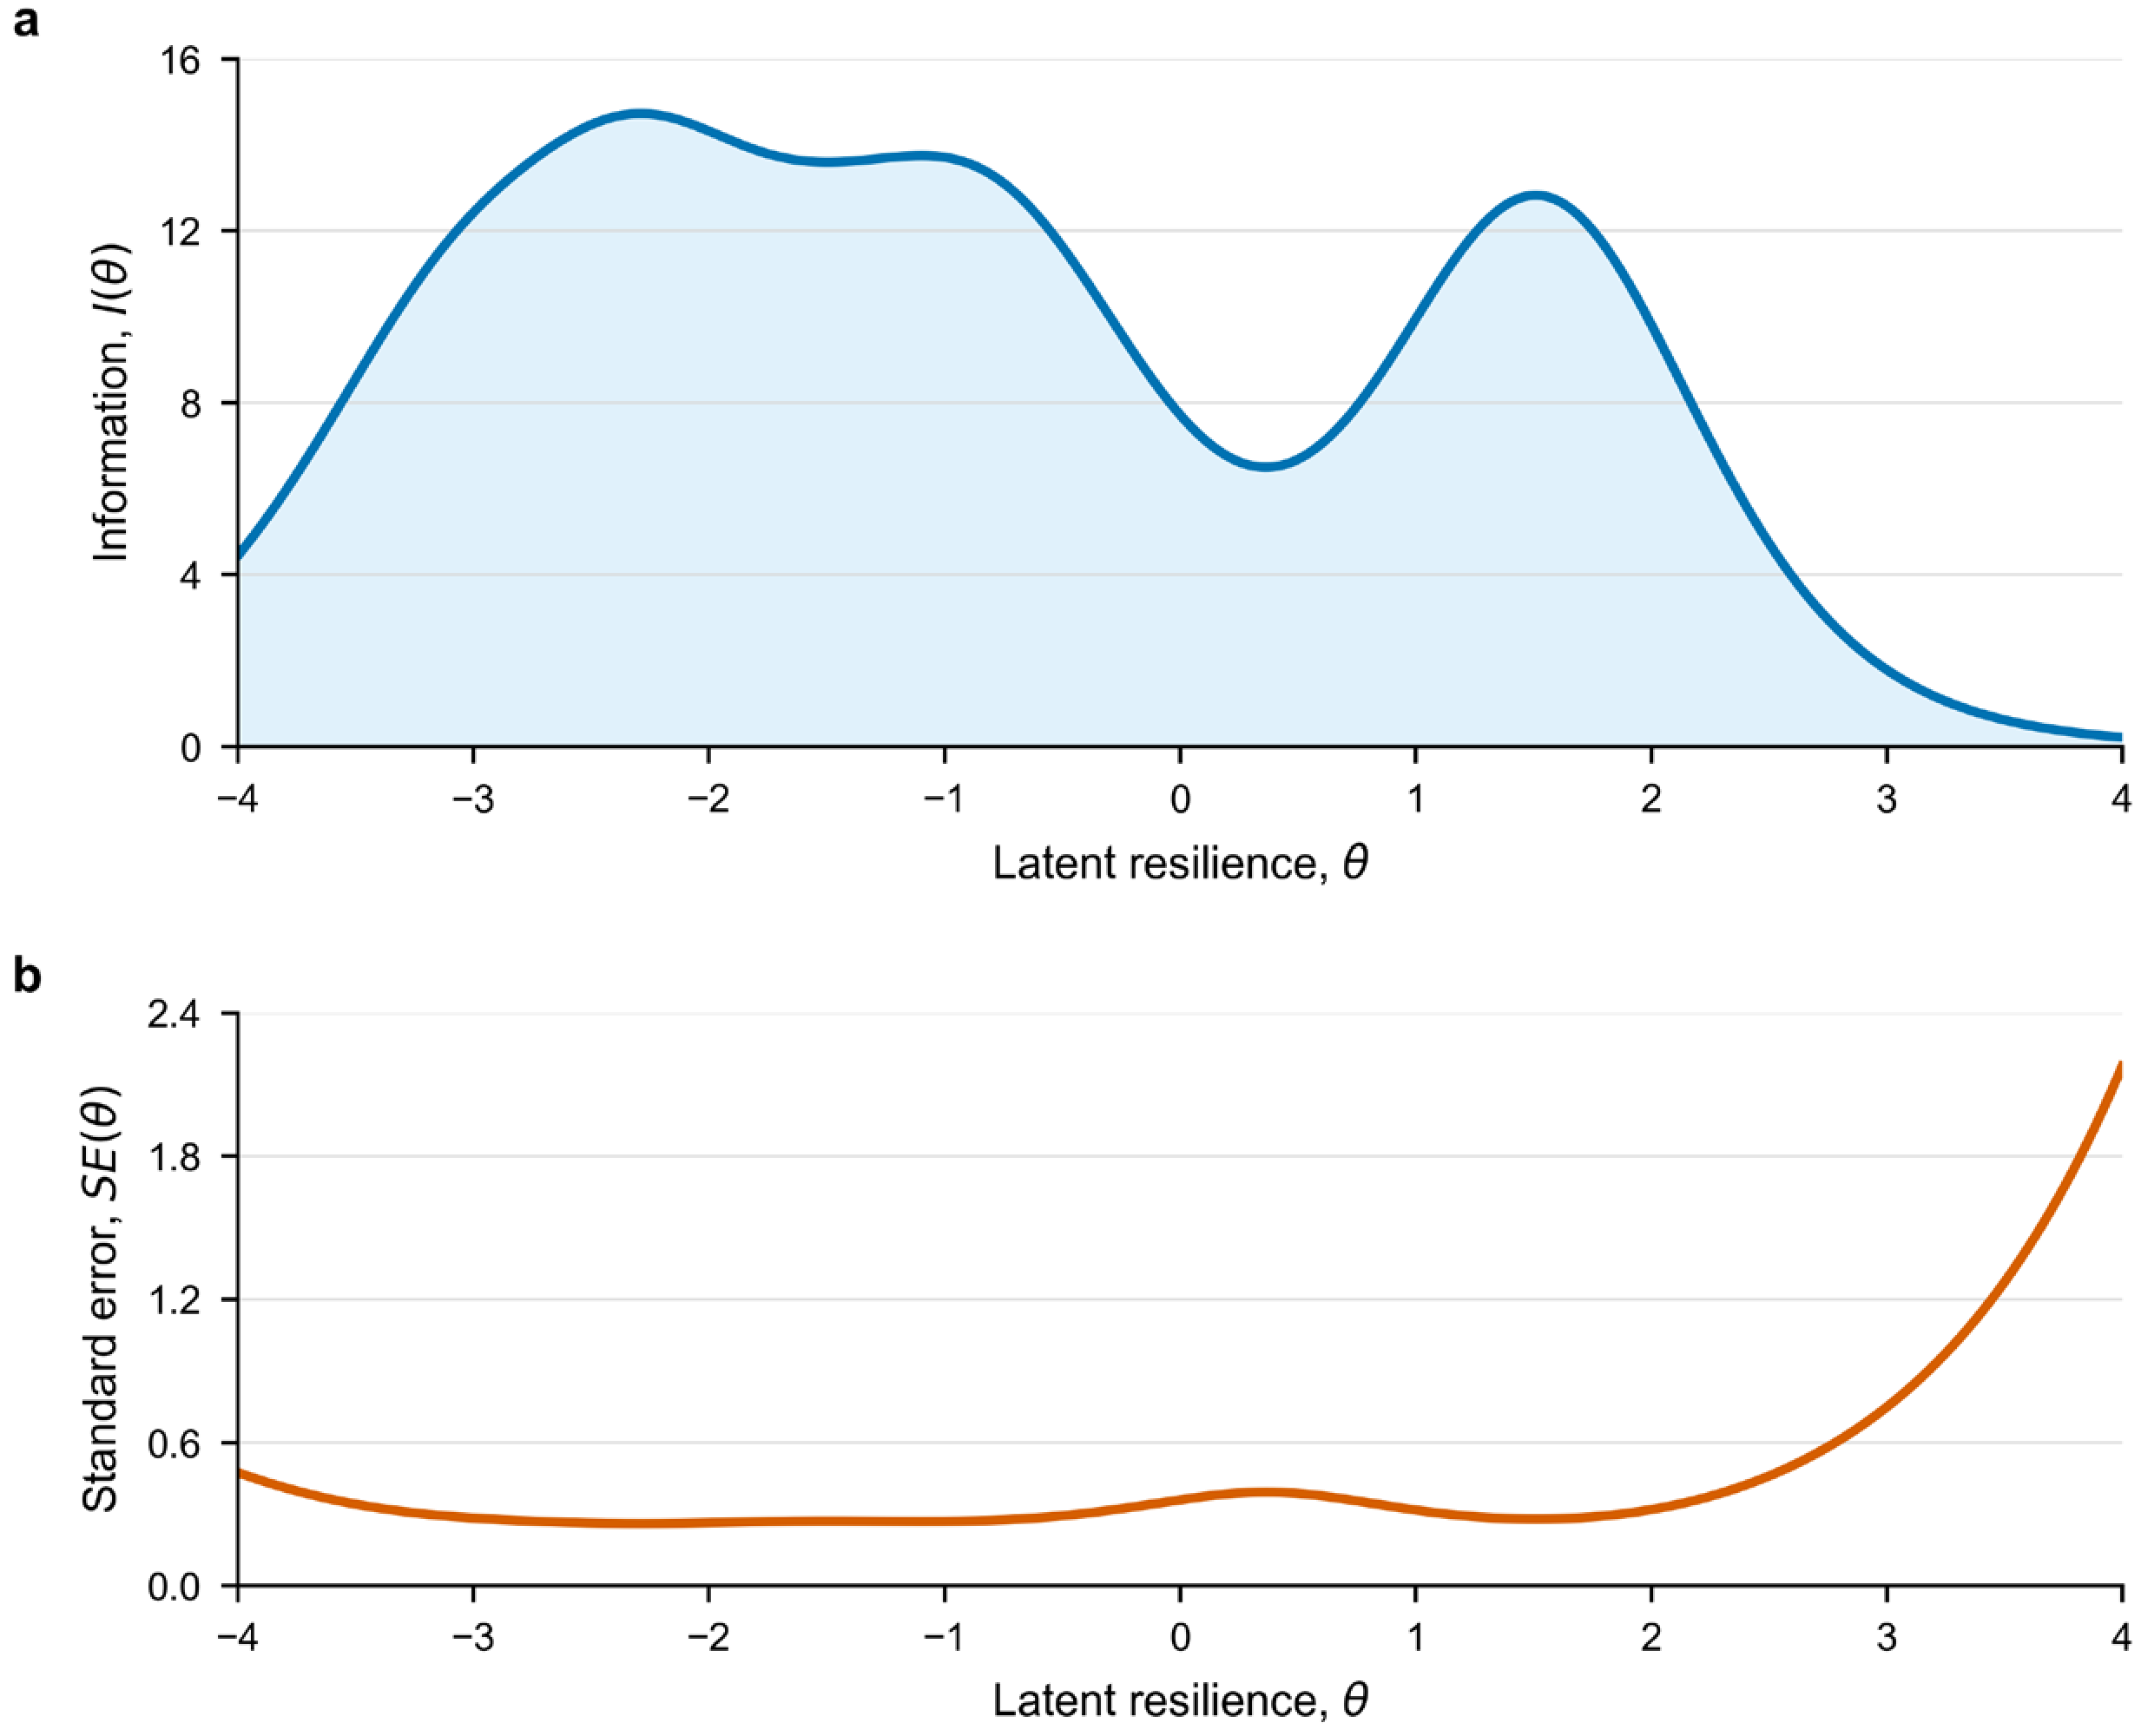
The test information function of the CD-RISC-10 was obtained by summing the information functions of its 10 items (
Figure 2a). Test information was relatively high in the lower region of the latent resilience continuum, approximately from
θ = −2.5 to −1.0. Information was also relatively high in the upper-middle region, approximately from
θ = 1.0 to 2.0, indicating greater measurement precision in these regions. In contrast, test information was comparatively lower near the centr of the latent trait scale. Consistent with the relationship
regions with higher information showed lower conditional standard errors, whereas the central region showed a comparatively higher standard error (
Figure 2b).
Overall, the CD-RISC-10 showed generally strong item discrimination and no statistically significant item-level misfit after Holm adjustment, although the global fit evidence was mixed and several local-dependence flags were observed. The measurement contributions of individual items were nevertheless uneven. Compared with the other items, items 6, 1, 19, and 17 showed relatively weaker performance in discrimination, threshold distribution, response-category use, or item information. These items were therefore prioritized for further consideration in the subsequent shortening analysis.
3.4.3. Scale Shortening Based on Integrated Evidence from CTT, GT and IRT
The evidence from classical test theory, CFA, GT, and IRT was combined sequentially rather than through a numerical weighting scheme. CFA provided the prerequisite for considering item reduction within a common latent construct, whereas GT provided a point-estimate-based reference length of six items. Within this reference length, IRT discrimination, threshold and response-category functioning, and item information were used to compare item-level measurement contributions. Reliability results and qualitative item-content review served as safeguards, whereas the MI and adjusted Q3 diagnostics were not used as item-deletion criteria. Items 1, 6, 17, and 19 showed relatively lower measurement contributions. Item 6 had the lowest discrimination (a = 1.636), the lowest item information (4.191), and relatively extreme lower thresholds, indicating insufficient response-category use and relatively limited measurement efficiency in the present sample. Items 1 and 19 had no stable estimates for the lowest threshold parameter because no participant selected the 0-point response option, and their item information values, 5.020 and 5.585, respectively, were both below the mean item information. Although the discrimination and item information of item 17 remained within an acceptable range, both were relatively low among the 10 items, and its lower threshold was also located toward the lower end of the latent trait distribution. Based on this integrated evidence, items 1, 6, 17, and 19 were removed, and items 4, 7, 8, 11, 14, and 16 were retained to form a candidate six-item short form, the CD-RISC-6. Each retained item used the original 0–4 response scale, yielding total scores ranging from 0 to 24. The qualitative item-content review served as a coverage safeguard and was not a formal expert-rated content-validity analysis.
The shortened CD-RISC-6 still showed good internal consistency. Cronbach’s α was 0.866, Spearman–Brown split-half reliability was 0.874, McDonald’s ω was 0.901, and the theta coefficient was 0.869, all exceeding 0.80. These results indicated that the shortened scale retained high score reliability after four items were removed. Compared with the original CD-RISC-10, the CD-RISC-6 reduced the number of items by 40% while maintaining acceptable to high internal consistency and split-half reliability in the present sample. This provided preliminary support for its feasibility as a candidate brief measure. When GT was re-estimated for the six items actually retained, the G coefficient was 0.866 (95% bootstrap CI [0.816, 0.899]) and the phi coefficient was 0.854 (95% bootstrap CI [0.800, 0.889]). These findings provided additional evidence of acceptable score dependability for the selected six-item set in the development sample.
Further CFA results showed that the one-factor model of the candidate CD-RISC-6 yielded χ2(9) = 13.22, p = 0.153, CFI = 0.991, TLI = 0.985, RMSEA = 0.049 (90% CI [0.000, 0.102]), SRMR = 0.027, AVE = 0.527, and CR = 0.869. In the development sample, the candidate CD-RISC-6 yielded CFI, TLI, RMSEA, and SRMR values that were more favourable than those of the CD-RISC-10, and its AVE exceeded 0.50. Because the same sample was used for item selection and post-selection evaluation, this pattern may partly reflect sample-dependent optimization. It should therefore be interpreted as post-selection structural performance within the selection sample, not as independent cross-validation or evidence of superiority over the CD-RISC-10.
From the perspective of item information, the six retained items had a total information value of 51.204 based on the original IRT parameters of the CD-RISC-10, accounting for 70.38% of the total information of the original 10-item scale (72.753). Thus, after a 40% reduction in item number, the six retained items still preserved more than 70% of the measurement information of the original scale. After GRM parameters were re-estimated for the CD-RISC-6, the total information value of the six items was 53.32, with model information criteria of AIC = 2004.57 and BIC = 2102.29. These values were reported descriptively and were not compared directly with those of the CD-RISC-10 because the models were fitted to different item sets. The item parameters are shown in
Table 8. The re-estimated CD-RISC-6 GRM yielded C
2(9) = 12.55,
p = 0.184, CFI = 0.995, TLI = 0.992, RMSEA = 0.045 (90% CI [0.000, 0.099]), and SRMSR = 0.038. Discrimination standard errors ranged from 0.297 to 0.459, and threshold standard errors ranged from 0.108 to 0.548. M
2* could not be calculated because the six-item model provided insufficient degrees of freedom. No adjusted Q3 residual correlation exceeded 0.20, with a maximum absolute value of 0.184. Item 8 had an unadjusted S−X
2 p value of 0.049 but was not significant after Holm adjustment (adjusted
p = 0.293); no retained item showed statistically significant item-level misfit after adjustment. The IRT-based latent trait estimates (
θ) from the CD-RISC-6 were highly positively correlated with the original CD-RISC-10 total scores (r = 0.969,
p < 0.001), indicating high consistency in individual ranking between the candidate short form and the original version. Because the CD-RISC-6 items were derived from the CD-RISC-10, this correlation mainly reflects consistency between the two scoring results and should not be interpreted as independent validity evidence.
The concurrent associations with occupational burnout are shown in
Table 9. The CD-RISC-6 remained significantly negatively correlated with the total occupational burnout score and all burnout dimensions. Specifically, the correlation between the CD-RISC-6 and total occupational burnout was −0.494. The correlations with emotional exhaustion, depersonalization, and reduced personal accomplishment after reverse scoring were −0.418, −0.457, and −0.311, respectively, all reaching
p < 0.01. These correlation coefficients were close to those observed for the CD-RISC-10, indicating that the shortened version showed directionally consistent associations of similar magnitude with the external criterion after item reduction. This result provided preliminary support for the feasibility of the CD-RISC-6 as a candidate brief measure of psychological resilience among Chinese male airline pilots.
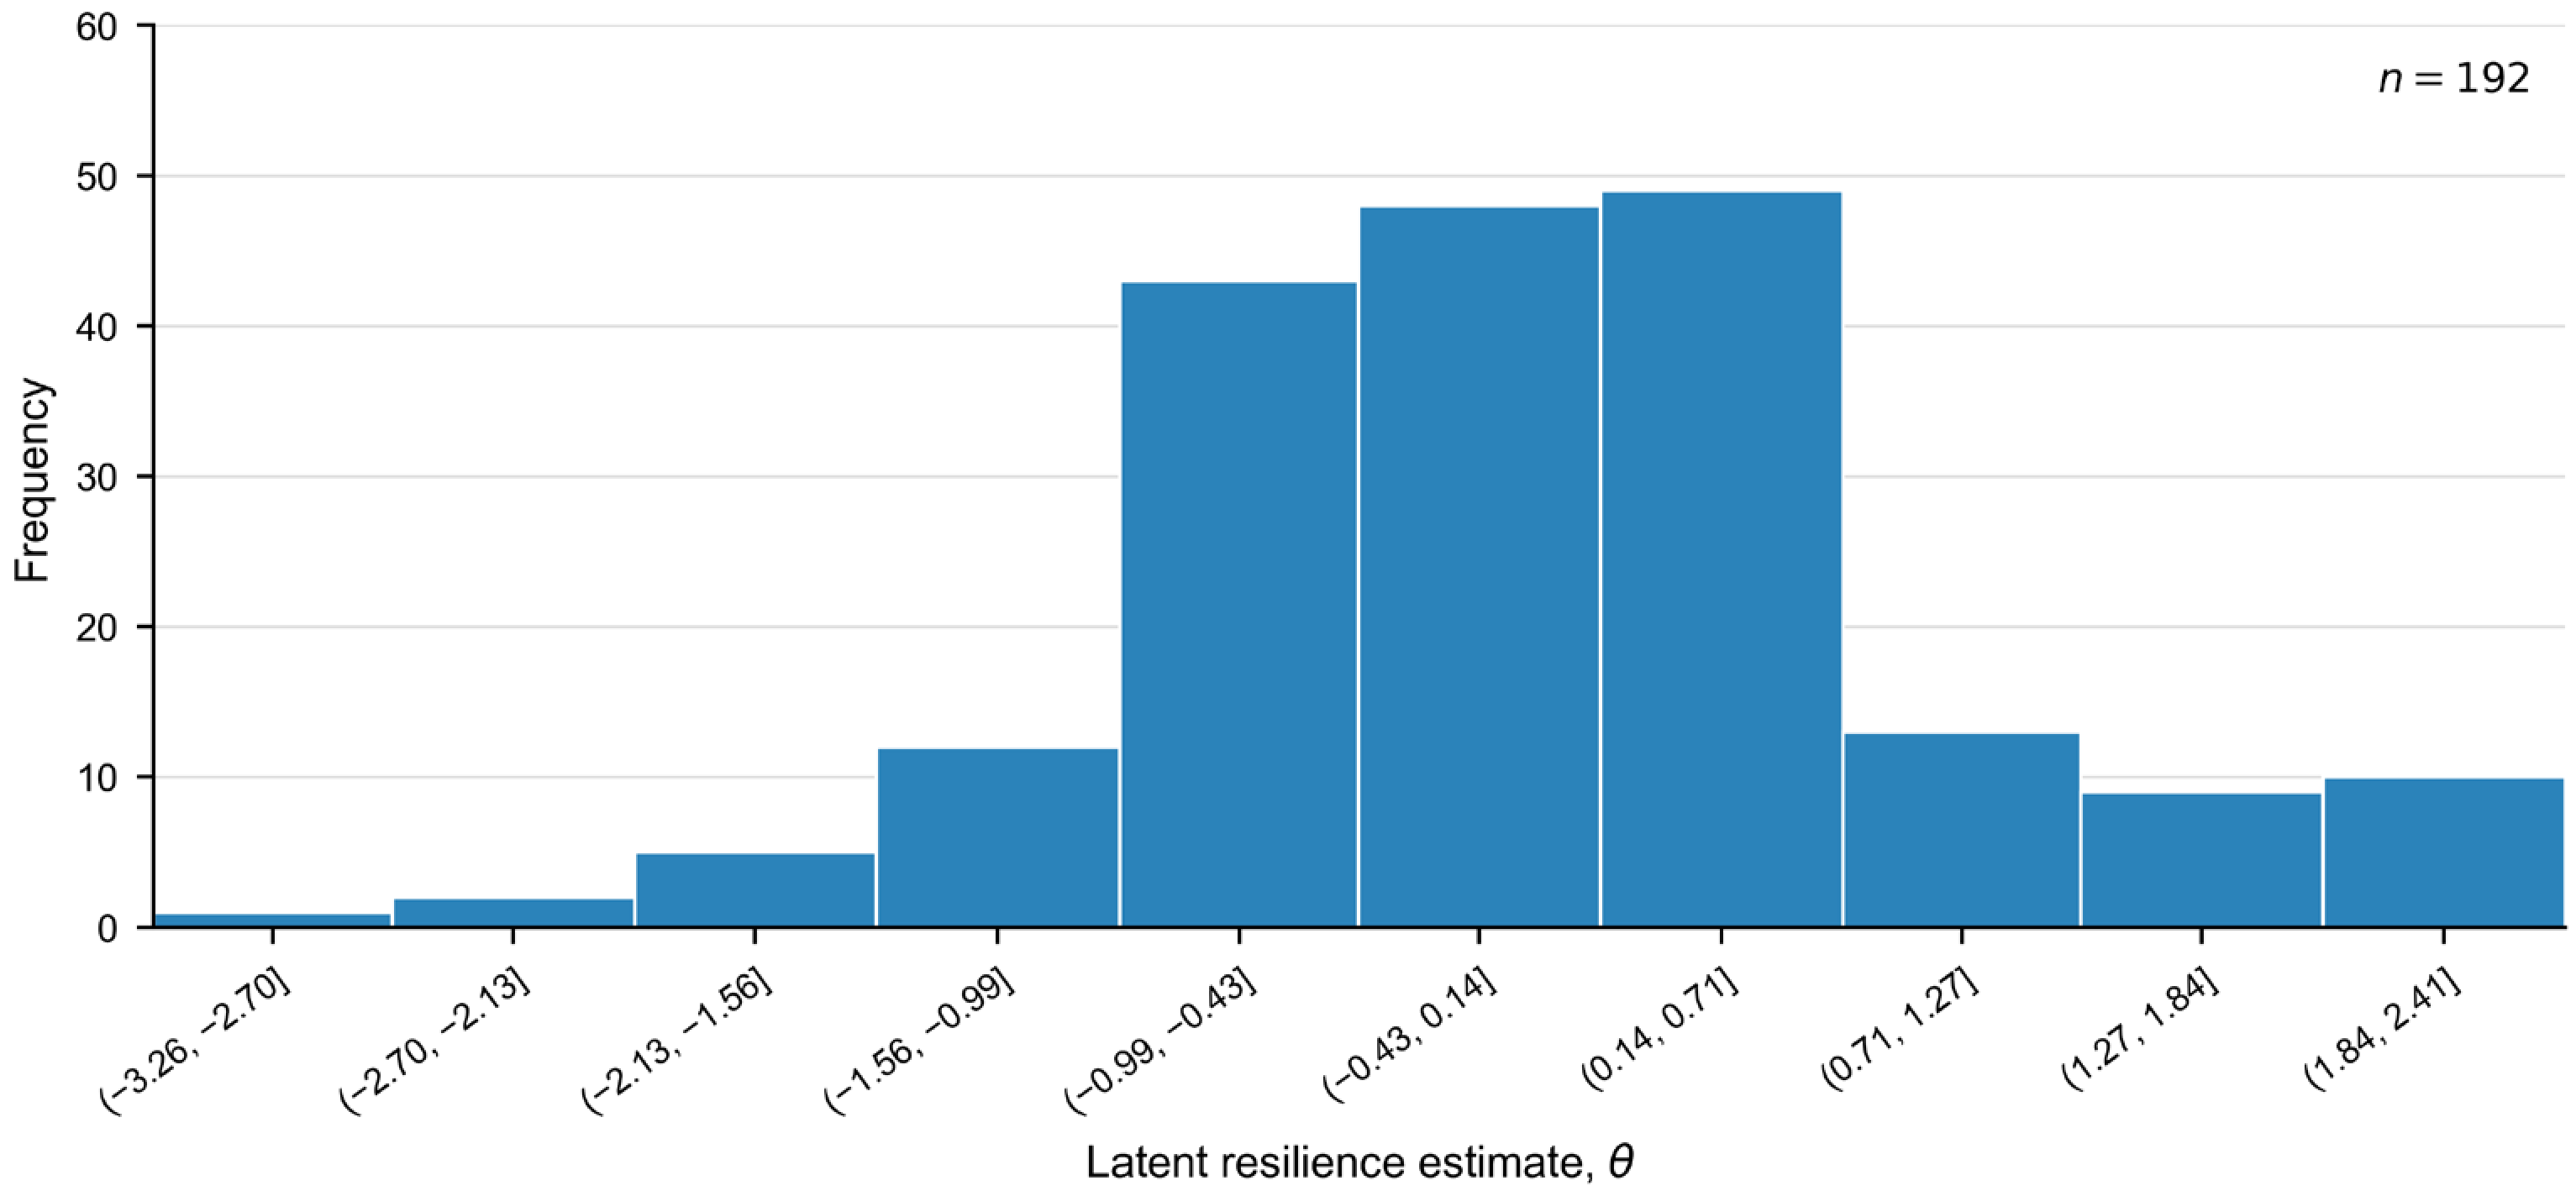
Figure 3 shows the distribution of IRT-based latent trait estimates (
θ) among the 192 pilots. The estimates were concentrated mainly between approximately
θ = −1.0 and 0.7, with observations extending across a wider range. This distribution is described relative to the modelled latent-trait scale and was not interpreted as a norm-referenced classification of low, average, or high resilience.
Taken together, the integrated CTT, CFA, GT, and IRT results provided preliminary support for shortening the CD-RISC-10 to a candidate six-item version. After item reduction, the CD-RISC-6 maintained high internal consistency, a favourable post-selection one-factor fit pattern, substantial item information, and directionally consistent associations with the original CD-RISC-10 and occupational burnout in the development sample. Therefore, the CD-RISC-6 can be considered a candidate short form, and its psychometric significance and applied value are further examined in the Discussion.