Article

Reduced-Order Modelling of Wall Heat Flux in Rotating Detonation Rocket Combustors with One-Dimensional Coolant Coupling


Institute of Space Propulsion, German Aerospace Center (DLR), 74239 Lampoldshausen, Germany
*
Author to whom correspondence should be addressed.
Aerospace 2026, 13(7), 637; https://doi.org/10.3390/aerospace13070637
Submission received: 2 June 2026 / Revised: 29 June 2026 / Accepted: 8 July 2026 / Published: 14 July 2026
(This article belongs to the Section Aeronautics)

Abstract

Rotating detonation engines combine compact geometry with the potential for higher specific impulse compared to deflagration-based propulsion, enabled by pressure-gain combustion. However, their increased thermal loads present a major challenge. In the current literature, thermal characterisation of rotating detonation hardware relies either on experimental reconstructions or on high-fidelity simulations. A predictive and coolant-coupled low-order heat transfer model for rotating detonation rocket engines is not yet available in the open literature. This paper introduces such a reduced-order predictive tool for rotating detonation combustors, capable of estimating both cycle-averaged wall heat flux and coolant thermal behaviour. Implemented in Python, the tool supports any propellant available in NASA’s Chemical Equilibrium with Applications and CoolProp, handles single-phase thermodynamic regimes, and spans geometric and operating ranges from laboratory-scale test rigs to engine-relevant conditions. With computation times below one second, it enables rapid trade studies, model-based screening, and sensitivity analyses. Benchmarking was performed against experimental test cases covering H 2 / O 2 , CH 4 / O 2 and C 2 H 4 / O 2 mixtures, as well as multiple injector geometries and chamber configurations. The approach complements existing high-fidelity tools by offering a low-order alternative grounded in transparent assumptions and benchmarked against multiple datasets.

1. Introduction

Future liquid rocket systems increasingly demand higher performance, reduced structural mass, reduced costs and improved reusability. Pressure-gain combustion [1] concepts such as rotating detonation rocket engines (RDREs) address these needs [2,3,4] by completing combustion within a thin detonation layer that travels azimuthally within the chamber, enabling compact engine architectures and potentially higher cycle efficiency. Despite these advantages, several practical challenges remain open, including wave-mode stability, initiation behaviour, and the management of strong local thermal loads. Among these aspects, the prediction of wall heat fluxes is of particular relevance for early design studies, since it directly determines cooling-system requirements and strongly influences material selection and chamber layout. Efficient methods to estimate these loads at the preliminary stage are therefore valuable for enabling rapid iteration and system-level trade-offs.
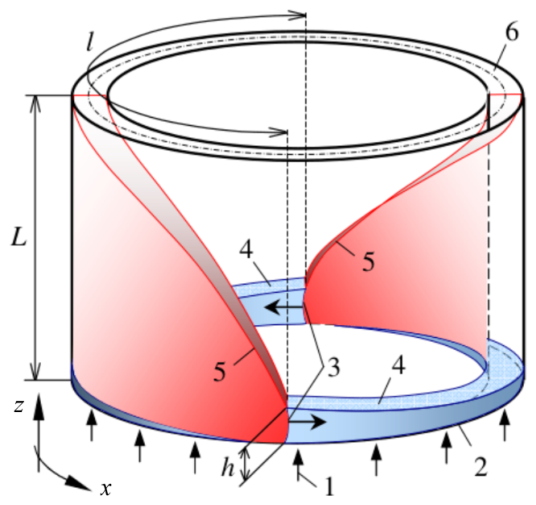
Detonative propulsion was first proposed by Zeldovich in 1940, who analytically demonstrated that detonative combustion could offer higher thermodynamic efficiency than conventional deflagrative processes [5]. Over the years, different engine topologies have been investigated [6], with pulse detonation engines [7] and rotating detonation engines (RDEs) being the most studied. The latter includes air-breathing RDEs and rotating detonation rocket engines, which are the focus of this work. The basic principle of the detonation process inside a rotating detonation combustor (RDC) is illustrated in Figure 1. A fresh propellant layer is periodically consumed by an azimuthally propagating detonation front, which produces an oblique shock and expels combustion products through the open end of the chamber.
The detonative combustion process enables significant reductions in chamber length compared to conventional constant-pressure combustors. Because combustion is completed within a very thin region immediately behind the detonation front, the required characteristic length L * is reduced by up to 40–50% [10]. Furthermore, the geometry of RDREs lends itself naturally to integration with aerospike nozzles, offering meaningful potential reductions in engine mass and volume. These advantages motivate continued investigation of RDREs alongside efforts to address remaining challenges such as initiation and deflagration-to-detonation transition control [10], reproducible wave-mode operation [3,11,12], and reliable assessment of chamber thermal loads [13,14,15,16].
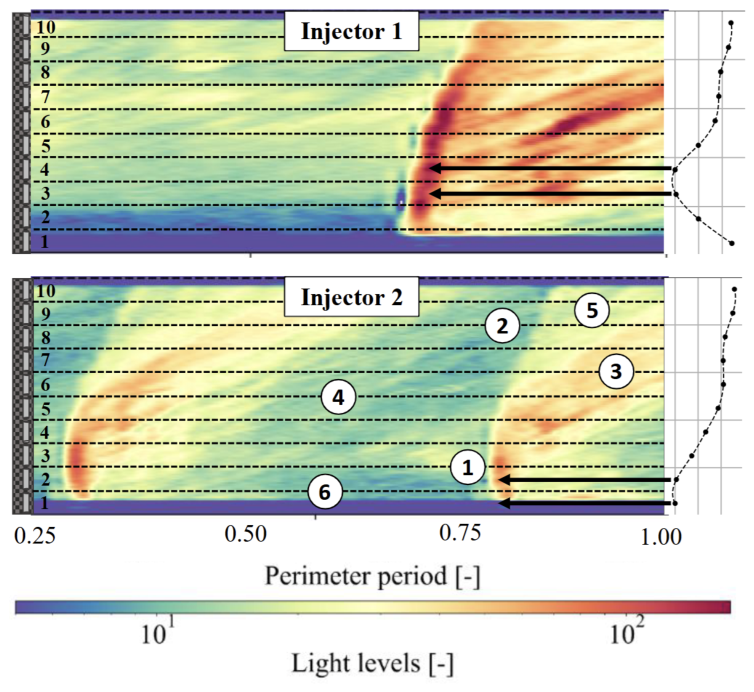
For instance, the region just downstream of the detonation wave is subject to highly transient, localised heat fluxes, as shown in Figure 2. These heat fluxes can reach extreme values that depart from the usual pressure scaling, with strong dependence on injector and wave mode. Although the wave only occupies a small portion of the chamber at any given time, its repeated passage imposes intense thermal loads that quickly damage or degrade unprotected materials. Furthermore, the internal flow field of rotating detonation combustors exhibits severe spatial non-uniformity and unsteadiness. Recent optical diagnostics by Fan et al. [17] demonstrated strong radial and axial stratification within the combustor, identifying detonation-dominant combustion attached to the outer wall and extensive deflagration-dominant combustion in the central zones. This coexistence of detonation, alongside parasitic and commensal deflagration, introduces significant unsteadiness to the thermal environment. While resolving these complex, three-dimensional unsteady structures is essential for detailed flow analysis, it remains computationally prohibitive for rapid parametric sizing.
Predicting heat loads in RDREs is non-trivial because the detonation front generates highly localised and transient thermal environments that deviate from conventional quasi-steady rocket scaling. Peak fluxes depend sensitively on injector design, mixture preparation, chamber geometry, and the evolving detonation structure. Current approaches rely either on hardware testing [13,14,15,16,18,19,20,21,22] or high-fidelity computational fluid dynamics (CFD) [23,24,25,26,27,28,29], both of which provide important insight but remain impractical for fast parametric investigations and design iterations. To complement these methods, this work introduces a reduced-order modelling framework that models RDRE wall heat fluxes by combining a Bartz-based baseline with a canonical RDRE-specific axial profile and coupling it to a one-dimensional coolant-side solver. The resulting approach provides a computationally efficient alternative for estimating thermal loads during preliminary design, enabling rapid exploration of operating points, geometries and cooling configurations while remaining consistent with experimentally observed heat-flux behaviour.

1.1. Experimental Investigations

Early experimental studies already highlighted the distinctive heat transfer behaviour of rotating detonation combustors, which differs significantly from that of conventional deflagrative devices [11] and demonstrated that wall heating is strongly localised near the detonation front [13,14,16,18,19,30].
Micka et al. [30] reported peak heat fluxes of 23.6 MW m−2 close to the injector face of a hydrogen–oxygen chamber. These values likely resulted from higher than average mass fluxes and chamber pressures (10–18 bar), measured using global calorimetry over thermally steady-state operation. Theuerkauf et al. [31] captured high-frequency heat flux variations of 1–9 MW m−2 in a hydrogen/air RDE using fast-response thin-film gauges. While the time-averaged load was lower due to the reduced density of the air-breathing mixture, the data highlighted the strong temporal fluctuations imposed by the detonation process. Maybee et al. [13] utilised axially resolved water calorimetry in a methane–oxygen engine, recording average values of 5–12 MW m−2 in a straight annulus. A constricted throat geometry shifted the thermal load distribution, elevating peak fluxes to 18 MW m−2 near the nozzle convergence. Aliakbari et al. [18] tested an additively manufactured calorimetric combustor with methane–oxygen at moderate mass flows (0.1–0.25 kg s−1). They reported peak heat fluxes of 3.4–9.0 MW m−2 localised near the detonation front, confirming the density-driven nature of the thermal load. Additional information on the experimental setup can also be found in Michalski et al. [32] Ditsche et al. [15] investigated a small-scale hydrogen–oxygen RDC using capacitive cooling and the inverse heat conduction problem method via embedded thermocouples. Although the short test durations prevented the hardware from reaching global thermal steady-state, the transient data established a strong linear coupling between total mass flow rate (0.045–0.070 kg s−1) and wall heat flux. Goto et al. [14] performed ethylene–oxygen firing tests with varying nozzle throat contraction ratios to modulate chamber pressure independent of mass flow. They demonstrated that geometric choking significantly amplifies the chamber pressure p c and consequently the wall heat flux, validating the necessity of including pressure-dependent terms in heat transfer correlations. Petty et al. [22] compiled an extensive dataset consisting of over 30 measurements across five different geometries and pressure ranges from 10 to 50 bar. Through this data, they quantified the difference in heat flux between the inner and outer walls of a combustor, observing a reduction of approximately 25%. Finally, Ma et al. [16] analysed a compact methane–oxygen RDE using high-frequency sensors to distinguish between instantaneous peaks and time-averaged loads. Their characterisation of heat flux distortion (the ratio between peak and average loads) under varying equivalence ratios ϕ provides a critical dataset for validating the safety margins of the methane cooling circuit and assessing the impact of unsteady detonation dynamics on thermal management.
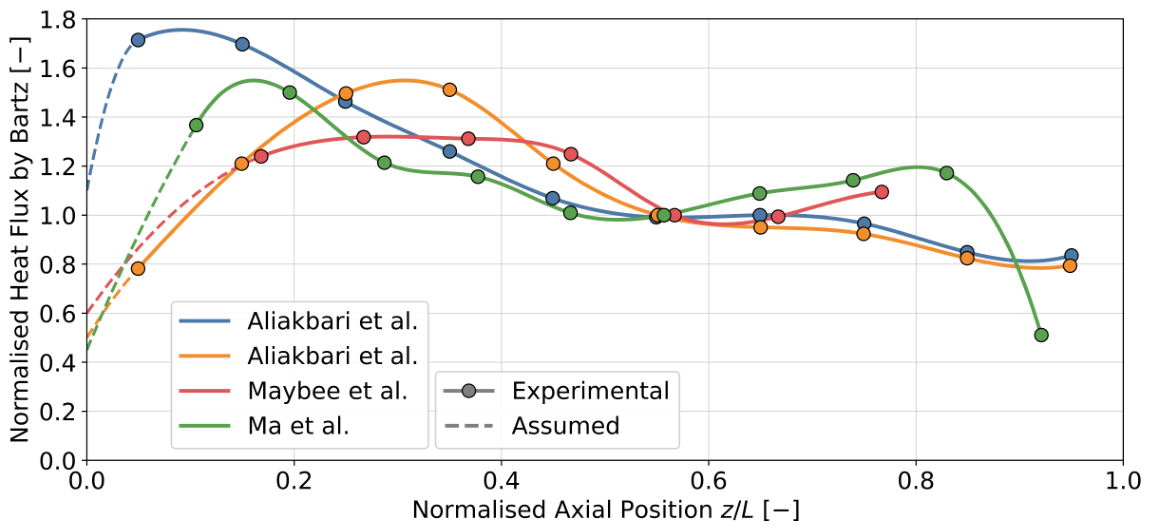
Beyond the absolute magnitude of thermal loads, the axial distribution of heat flux in RDREs presents a unique profile shape that is critical for cooling system design. Unlike conventional rocket engines, where peak heating typically occurs at the nozzle throat, RDREs exhibit a front-loaded profile. As illustrated in Figure 3, experimental data from axially resolved calorimetry consistently show that heat flux peaks in the immediate vicinity of the injector face, coinciding with the detonation wave location, before decaying rapidly to a lower plateau downstream [13,16,18,19,30,33]. A secondary increase in heat flux is frequently observed further downstream when a geometric throat restricts the combustor exit.
The ratio between this near-injector peak and the downstream average is a key design parameter. Literature values generally indicate a peak-to-average ratio in the range of 1.25–1.7, depending on the specific injection geometry and propellant combination, though outliers have been noted, such as the high-load profile presented in the NASA’s early career initiative (ECI) report [33]; it shall be noted that this profile was inferred from various tests rather than being directly measured.

1.2. Numerical Approaches

Various numerical approaches have been developed to investigate heat transfer in rotating detonation engines. The most common approach remains high-fidelity simulations. For example, Frolov et al. [23] performed a three-dimensional simulation of a hydrogen–air RDC, showing that the local heat flux near the injector can reach up to 16 MW m−2. Hou et al. [24] investigated instantaneous and average wall loads, showing that the heat flux depends strongly on inlet conditions and is generally higher at the outer wall than at the inner wall. Roy et al. [25,26] combined CFD-derived heat flux profiles with analytical models to predict transient wall temperature evolution under periodic loading, demonstrating that extending short-duration CFD profiles with peaks around 3 MW m−2 provides a reasonable approximation of long-term behaviour. Randall et al. [27] conducted a combined experimental and numerical study of hydrogen–air RDEs, which confirmed that downstream heat fluxes dropped by orders of magnitude compared to the region adjacent to the detonation wave.
A different approach consists of reduced-order models, such as the one presented in this study. Various models have been developed over the years, one of the most recent being from Braun et al. [34], who studied a hydrogen-air combustor. Their work utilised a previously developed in-house tool by Sousa et al. [35] that uses the method of characteristics to compute the combustor flow fields; the heat flux is then calculated using integral boundary layer equations and an empirical correlation. The results were compared against URANS simulations, showing good agreement with a medium-to-fine refinement of the characteristics net, and computation times on the order of hundreds of seconds. Other low-order approaches to model RDEs have been developed and used mostly for preliminary performance evaluation of RDREs and not for heat transfer. Fievisohn et al. [36] introduced a model that uses the method of characteristics to investigate the effects of geometrical parameters and operating conditions on engine performance and detonation characteristics. This work focuses on steady-state conditions to identify suitable design spaces that can later be investigated using high-fidelity simulations. Similarly, Mizener et al. [37] presented a model for rotating detonation rocket engines, where a semi-empirical control-volume approach is used to investigate performance and conduct a parametric analysis, suggesting high-level requirements to improve overall engine performance.

1.3. Comparison of the Inner and Outer Wall Heat Flux

Literature consistently reports lower heat fluxes on the inner wall compared to the outer wall. An experimental study by Petty et al. [22] compiled an extensive dataset consisting of over 30 measurements across five different geometries and pressure ranges from 10 to 50 bar. Through these data, they quantified the difference in heat flux between the inner and outer walls of a combustor, observing a reduction of approximately 25% on the inner wall. Stevens et al. [21] studied different materials and geometries, in particular comparing copper and Inconel architectures. They reported heat loads for the centre bodies to be 50% to 60% of the outer body for copper, and equal heat loads for Inconel, though accompanied by a 60% increase in temperature. Numerically, Hou et al. [24] investigated the dependence of heat loads on the number of waves and mass flow rate. Unsurprisingly, an increase in the number of waves and mass flow is linearly followed by higher heat loads. However, they also compared the inner and outer bodies, showing inner wall heat loads to be 33% to 35% lower depending on the case.

2. Modelling Approach

The aim of this work is threefold. First, a low-computational-cost method is introduced to model the heat flux in straight annular rotating detonation combustors during the preliminary design phase. Second, this methodology is coupled with a one-dimensional cooling model to enable rapid parametric investigations and to support the assessment of RDRE dimensional scalability. Finally, the proposed approach is compared with selected experimental heat-flux datasets available in the literature. The comparison shows encouraging agreement within the bounds of the underlying assumptions and simplifications, and demonstrates that the framework can deliver fast and informative predictions for early-stage design. The modelling framework is developed using Python 3.12 combining zero- and one- dimensional approaches. The zero-dimensional elements provide fast thermodynamic estimates and operating-point selection, while the one-dimensional modules resolve coolant flow and heat pick-up along discretised channel segments.
The tool accepts the combustor geometry, propellant pair, operating conditions, and material selections as inputs, and returns (i) an imposed hot-gas heat-flux distribution representative of an RDRE, (ii) coolant thermal and hydraulic states along the chamber, and (iii) channels performance measured as pressure-losses and wall temperatures.

2.1. Assumptions and Limitations

The development of the simulation tool relies on a set of modelling assumptions chosen to balance physical fidelity with computational efficiency.
The hot-gas-side thermal load is prescribed through an axially varying heat-flux profile of fixed canonical shape representative of an RDRE, derived from aggregated experimental literature [13,14,16,18,19,30,33], and scaled by a global peak level and an overall combustion-efficiency factor, with an empirical reduction applied to the inner body to reflect observed wall differences. This choice is deliberate, driven both by the tool’s intended use case and by the current state of the literature. The framework is designed for early-stage engine sizing and trade studies, a phase at which injector designs and internal geometries are rarely frozen; introducing highly specific profile shapes would over-constrain the model and reduce its general utility. For the purpose of sizing regenerative cooling channels, the total bulk temperature rise of the coolant is governed by the integral heat load across the chamber; while the fixed profile may exhibit spatial offsets in the exact peak location, it successfully bounds the macro-level energy balance required to evaluate cooling feasibility. The associated limitation is that the prescribed profile does not adapt to changes in wave number, mixture ratio, contraction ratio, or transient detonation dynamics, and the local peak position may therefore differ from that of a specific hardware configuration. Implementing heat flux profiles, which are dependent on operating conditions or RDC geometries, could theoretically be easily integrated in the presented modelling framework. However, experimental studies on RDRE heat fluxes are still rare and for that reason, there is currently not sufficient publicly available data to derive correlations of the influence of geometrical aspects or operating conditions on the specific axial location of the rotating detonation waves and thus the heat flux peak. For that reason, the canonical profile was chosen for the current implementation, but could be extended to be a function of experimental conditions in future work.
On the coolant side, the propellants are assumed to operate at supercritical pressure throughout the cooling passages. Depending on inlet conditions, the coolant may enter in a transcritical state, pressure above critical, temperature below critical, and undergo a pseudo-boiling transition as it absorbs heat from the chamber wall, or it may already be in a fully supercritical, gas-like condition from the outset. In both cases, all thermophysical properties are obtained from Helmholtz-energy-explicit equations of state through the CoolProp library [38], which is valid across the entire considered range and implicitly captures the steep property variations near the pseudocritical temperature. Formation of a truly subcritical fluid (at simultaneously low pressure and low temperature) is not modelled; in practice this is an unlikely outcome, since the pressure losses along the channels are accompanied by a substantial temperature increase that keeps the propellant within the supercritical-pressure domain. No dedicated model for heat transfer deterioration in the near-critical zone is implemented beyond the Gnielinski correlation used for coolant-side convection; these phenomena near the pseudocritical point, which depend sensitively on local wall-to-bulk temperature ratio, heat flux, and mass flux, are documented in the rocket propellant cooling literature [39,40] but are not explicitly resolved by the present one-dimensional formulation.
The coolant flow model adopts assumptions standard in one-dimensional reduced-order thermal analyses of conventional liquid rocket engines: flow is treated as steady, fully developed, turbulent, and single-phase within each axial segment, and is assumed to be equally distributed across all channels at the wall. These simplifications are a necessary consequence of the one-dimensional discretisation, which cannot resolve entrance effects, azimuthal cross-flow, or manifold maldistribution without three-dimensional geometry data unavailable at the preliminary design stage. Property gradients within a segment are not iteratively coupled to the heat transfer correlations, consistent with the first-order upwind energy balance used to advance the bulk coolant temperature.
The combustor geometry is modelled as a straight annulus with rectangular cooling channels of uniform circumferential distribution; axial variations in channel height are permitted. Conjugate heat transfer through the wall is simplified to one-dimensional radial conduction without lateral spreading or contact resistances, and wall material thermal conductivity is treated as constant over the operating range, with surface roughness set to values representative of additive-manufactured channel finishes. Radiative heat transfer on the gas side is neglected, consistent with standard practice in forced-convection-dominated regimes at the pressures and temperatures considered here. Finally, while recent high-frequency measurements have demonstrated the extreme, highly unsteady nature of the thermal loads imposed by the passage of individual rotating detonation waves [17], these rapid transients are not propagated into the solid domain in the present model. Instead, the framework operates on a cycle-averaged heat flux, as the thermal inertia of the wall material effectively attenuates these periodic fluctuations in the solid temperature field. This simplification is supported by recent conclusions by Athmanathan et al. [41] that steady thermal boundary approximations provide a sufficient baseline for evaluating RDRE thermal management strategies.

2.2. Workflow Overview

The simulation tool was designed as a modular Python framework, enabling clear separation of the physical models for hot-gas heat flux estimation and coolant-side regenerative cooling. The general workflow proceeds from user-defined input parameters to post-processed outputs, and is organised into distinct stages. Figure 4 illustrates this sequence schematically, while the following paragraphs describe the details of each stage.

2.3. Input and Pre-Processing Calculations

The first stage of the workflow consists of user inputs and pre-processing. The operating point is specified by the total mass flow rate m ˙ and the mass flux G; together with the annular gap width Δ , these uniquely determine the chamber area A c and the inner and outer body diameters I D and O D . Finally, using the prescribed length-to-diameter ratio ( L / D ) c h , the chamber length L is obtained.
For the thermodynamic set-up, the propellant pair (hydrogen/oxygen, methane/ oxygen, or ethanol/oxygen at this stage), the propellant state (gaseous or liquid), the mixture ratio, and the inlet temperatures and pressures (consistent with facility capability) must be provided. The cooling system configuration is specified by the number of channels per wall N c h , the hot-wall thickness t w , the rib thickness t r i b , and the cross-sectional geometry, which is characterised by the width w, height h, and hydraulic diameter D h of each channel. Structural materials are selected from predefined options (CuCr1Zr, GRCop-42, or Inconel-718) consistent with additive manufacturing practice. Once the user inputs are defined, the initialisation step performs a series of calculations to derive all quantities required for the subsequent analyses. These operations can be summarised as follows:
  • The geometry of the RDE is computed using m ˙ , G, Δ , and L / D . Chamber area, inner body and outer body diameters, and length are computed using Equations (1)–(3).
    A c = m ˙ G ,
    I D = A c π Δ Δ , O D = I D + 2 Δ ,
    L = ( L / D ) c h O D .
  • The fuel and oxidiser mass flow rates are determined from the total propellant flow rate and the specified mixture ratio.
  • The chamber pressure p c is obtained iteratively. It is defined by the balance in Equation (4), where m ˙ is the total mass flow rate, c * is the characteristic velocity, and A t is the nozzle throat area. The characteristic velocity is computed as in Equation (5), where R is the specific gas constant of the mixture, T c is the chamber temperature obtained from NASA’s Chemical Equilibrium with Applications (CEA) [42], and the Vandekerckhove function Γ is defined by Equation (6). Both terms of Equation (6), T c and the specific heat ratio γ , depends on p c , consequently the characteristic velocity c * varies accordingly. The iteration is closed by solving for p c with the secant method until a tolerance of 10 3 is reached. (To accelerate convergence, the initial guess for p c is interpolated from the linear relation reported by Davidenko et al. [43], which expresses the mean chamber pressure p c as a function of mass flux G for annular RDREs.)
    p c = m ˙ c * A t ,
    c * = R T c Γ ,
    Γ = γ 2 γ + 1 γ + 1 γ 1 .
  • Once convergence is reached, the chamber temperature T c and the equilibrium composition are fixed from the CEA solution corresponding to the calculated chamber pressure.
It should be noted that the CEA calculations are currently performed in “rocket” mode for a constant-pressure deflagration, utilising “frozen” composition properties. Since actual pressure gain in RDREs remains unachieved so far, to the authors’ knowledge, and their global performance approaches that of conventional combustors, this provides a realistic baseline. This pragmatic approach is supported by recent literature. Lim et al. [44] compared constant-pressure CEA calculations against experimental RDRE heat flux data and found that equilibrium chemistry tends to overpredict thermal loads, whereas utilising frozen flow compositions yields a much better match. Similarly, Smallwood [45] extensively analysed the selection of reference combustion temperatures for RDRE heat transfer, concluding that constant-pressure deflagration values serve as the most reliable baseline. Although this does not perfectly represent the highly transient thermodynamic state immediately behind the detonation wave, it establishes a common basis for comparing and scaling cooling system analyses against traditional rocket combustors. Adopting this methodology allows designers to make use of proven convective heat transfer models to conduct rapid trade studies for preliminary design selections. In future updates, the module could be modified to perform Chapman-Jouguet detonation calculations, provided that higher-resolution experimental data becomes available to reliably calibrate such thermodynamic states.
These pre-processing steps provide the thermodynamic operating point and boundary conditions required to scale the hot-side heat flux profile and to initialise the coolant- side calculations.

2.4. Heat Flux Module

The hot-gas-side heat flux distribution is generated by a module that combines a baseline computed using Bartz’s correlation with an annular straight RDRE heat flux profile. The first step of the module is the computation of a baseline flux using the Bartz correlation [46] to evaluate the convective heat-transfer coefficient h g using Equation (8). In this equation, D * is the throat diameter, μ is the dynamic viscosity in the chamber, c p is the constant-pressure specific heat of the gases in the chamber, and P r is the Prandtl number. Additionally, r c represents the radius of the chamber; however, for a straight combustor, both the diameter ratio D * / r c and the throat-to-local area ratio A t / A reduce to unity. This formulation includes a correction factor σ , reported in Equation (9), which accounts for deviations between wall and reference properties. The equation for the correction factor introduces the ratio of the hot-gas-side wall temperature, T w , h , to the adiabatic wall temperature, T a w . Furthermore, the Mach number M of the gases in the chamber is taken into account. The adiabatic wall temperature T a w , defined in Equation (7), is used to account for an energy loss due to the radiation of the slow-moving gases near the wall towards the free stream; a recovery factor r for turbulent boundary layers is introduced by Bartz [46]. Thermodynamic properties and conditions in the chamber, namely c p , μ , P r , γ , c * , and M, are obtained using CEA, while the relevant geometric parameters are provided by the engine configuration to ensure consistency with operating conditions. Once h g has been determined, the reference heat flux q ˙ r e f is evaluated via Equation (10), assuming a constant hot-gas-side wall temperature T w , h . This parameter is intentionally decoupled from the overall thermal solver to preserve the code’s modularity, enabling heat flux estimations independent of a specific cooling channel geometry. This choice is justified by the fact that, given the magnitude of the adiabatic wall temperature T a w , variations in T w , h on the order of ± 50 K have a negligible impact on the calculated heat flux.
T a w = T c 1 + r γ 1 2 M 2 ,
h g = 0.026 D * 0.2 μ 0.2 c p P r 0.6 p c c * 0.8 D * r c 0.1 A t A 0.9 σ ,
σ = ρ r e f ρ 0.8 μ r e f μ 0.2 = 1 2 T w , h T a w 1 + γ 1 2 M 2 + 1 2 0.68 1 + γ 1 2 M 2 0.12 ,
q ˙ r e f = h g ( T a w T w , h ) .
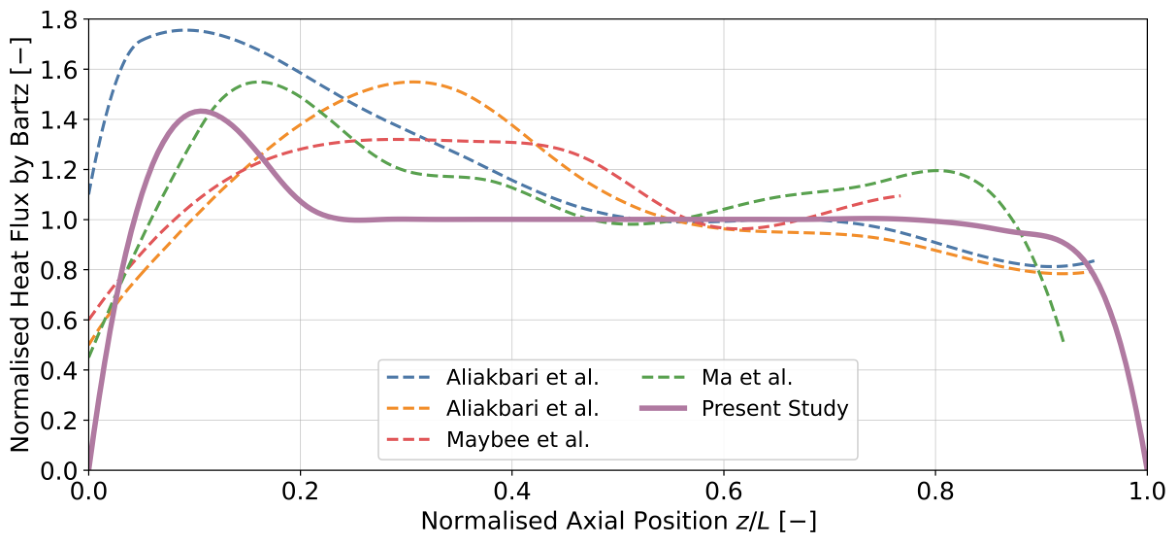
In the present methodology, the heat flux q ˙ r e f derived from Equation (10) is not applied uniformly; instead, it serves as the magnitude for the stable downstream plateau. To capture the front-loaded thermal loads characteristic of RDREs, the near-injector region is scaled relative to this baseline. Based on the experimental peak-to-plateau ratios identified in the literature [13,16,18,19,30] and introduced beforehand, this work adopts scaling factors between 1.33 and 1.43. Consequently, the Bartz-derived baseline represents approximately 70–75% of the peak thermal load. A comparison of the resulting distribution q ˙ ( z ) scaled with respect to the Bartz baseline is shown in Figure 5 with respect to the studies of Aliakbari et al. [18], Maybee et al. [13] and Ma et al. [16].
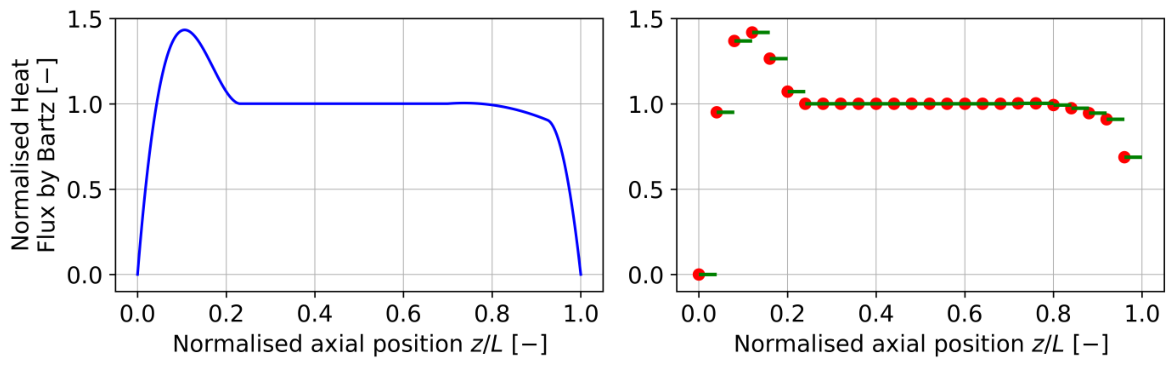
The resulting distribution q ˙ ( z ) is generated as a smooth spline function and is subsequently discretised into a piecewise-constant form averaged over a segment, q ˙ ¯ i , for coupling with the coolant solver, as shown in Figure 6. Additionally, the model accounts for the heat flux asymmetry typical of annular combustors. To incorporate this effect, a 20% reduction is applied to the inner-wall heat flux profile, following the findings reported in Section 1.3. This value is chosen to be conservative to intentionally overpredict inner-body heat loads, since the discrepancies reported in the literature are typically greater.

2.5. Coolant Temperature Module

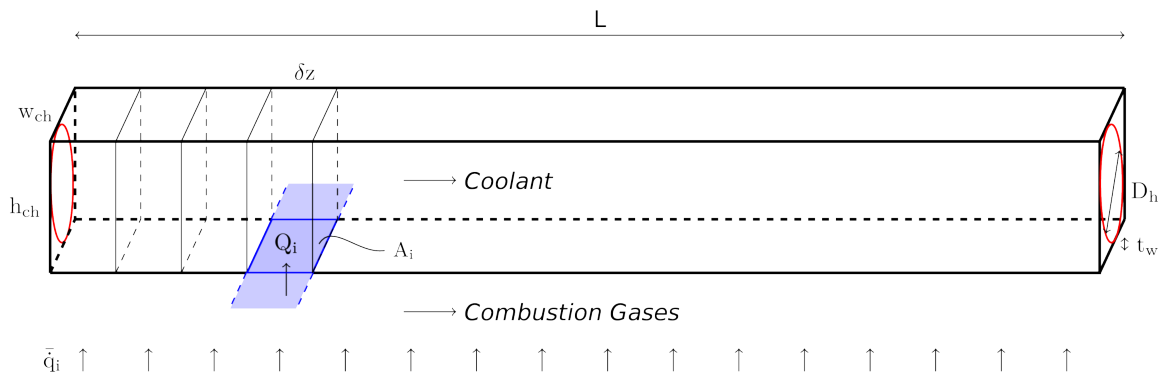
The coolant-side analysis is performed with a one-dimensional axial discretisation of the chamber into N segments of length δ z = L / N . For each interval [ z i , z i + 1 ] , the imposed average hot-gas-side heat flux q ˙ ¯ i is applied over a section of area A i , illustrated in Figure 7.
The segment exchange area and associated heat load follow from the imposed flux and local chamber diameter. They are written in Equations (11) and (12).
A i = π D δ z ,
Q i = q ˙ ¯ i A i .
In these calculations, D denotes the relevant inner or outer wall diameter.
The coolant bulk temperature is advanced explicitly along the axis according to the energy balance in Equation (13).
T c o o l , i + 1 = T c o o l , i + Q i m ˙ c p T c o o l , i .
The heat capacity c p is evaluated at the upstream bulk temperature. This corresponds to a first-order upwind discretisation in which the segment heat load Q i is applied uniformly.
For post-processing, coolant temperatures are also reported at cell centres, as defined in Equation (14).
T c o o l , c e l l , i = 1 2 T c o o l , i + T c o o l , i + 1 .

2.6. Channels and Wall Temperatures Module

The wall temperatures T w , h and T w , c are determined at the cell centres, where each channel is treated as a one-dimensional duct with uniform flow split among N c h channels. For a rectangular channel of width w and height h, the hydraulic diameter is defined as D h = 4 A c h / P w e t . The discretisation and channel dimensions are shown in Figure 7.
The per-channel mass flow rate and bulk velocity are given in Equations (15) and (16).
m ˙ c h = m ˙ w a l l N c h ,
v = m ˙ c h ρ A c h .
The Reynolds and Prandtl numbers are evaluated from the local coolant state using Equations (17) and (18), where k c is the coolant thermal conductivity.
R e = ρ v D h μ ,
P r = c p μ k c .
The Darcy friction factor f follows from the Colebrook relation in Equation (19), which accounts for the surface roughness ϵ . Subsequently, the axial pressure loss for each segment is computed from the Darcy–Weisbach relation in Equation (20).
1 f = 2 log ϵ / D h 3.7 + 2.51 R e f ,
Δ p = f ρ v 2 2 δ z D h .
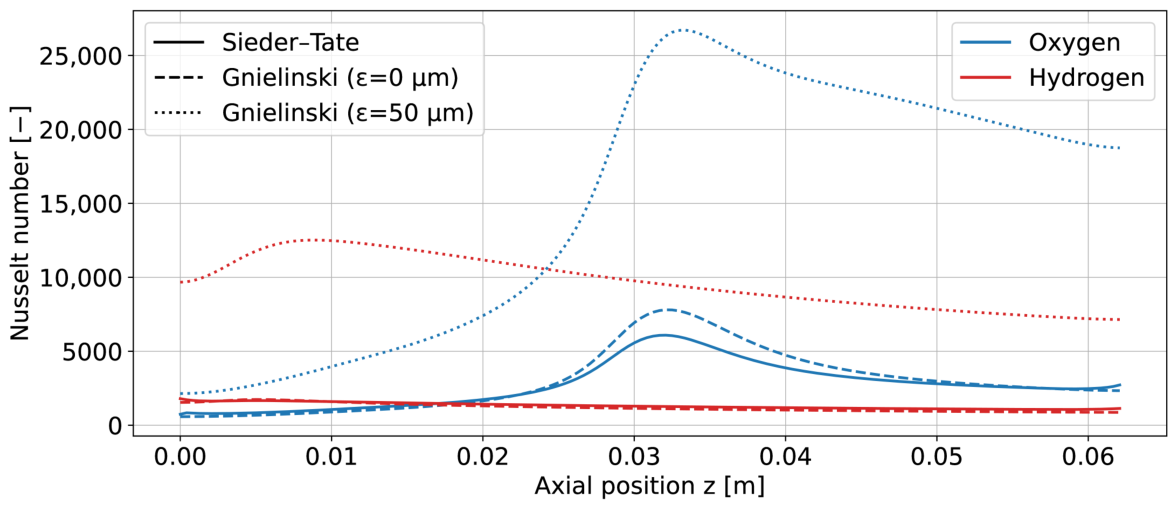
Convective heat transfer on the coolant side is obtained from the Gnielinski correlation [47] through Equations (21) and (22). The suitability of this choice is supported by the comparison in Figure 8, which shows that Gnielinski reproduces the Sieder–Tate [48] prediction for smooth walls and yields consistently higher Nusselt numbers in the presence of roughness, in line with the increased friction factor.
N u = ( f / 8 ) ( R e 1000 ) P r 1 + 12.7 ( f / 8 ) 1 / 2 ( P r 2 / 3 1 ) ,
h c = N u k c D h .
The coolant-side wall temperature follows from the local heat balance in Equation (23), while the hot-gas-side wall temperature is obtained by conduction through the wall thickness using Equation (24), where k w is the wall thermal conductivity.
T w , c = T c o o l + q ˙ ¯ i h c ,
T w , h = T w , c + q ˙ ¯ i t w k w .
All quantities are evaluated at the cell centres z i . Geometry variations are mapped to z i , and coolant properties ( ρ , μ , k c , c p ) are taken at the local state T c o o l ( z i ) , p c o o l ( z i ) . The wall-side property evaluation uses the circuit inlet pressure, while the axial pressure profile is accumulated separately from Equation (20).

3. Results

3.1. Benchmarking of the Heat Flux Module

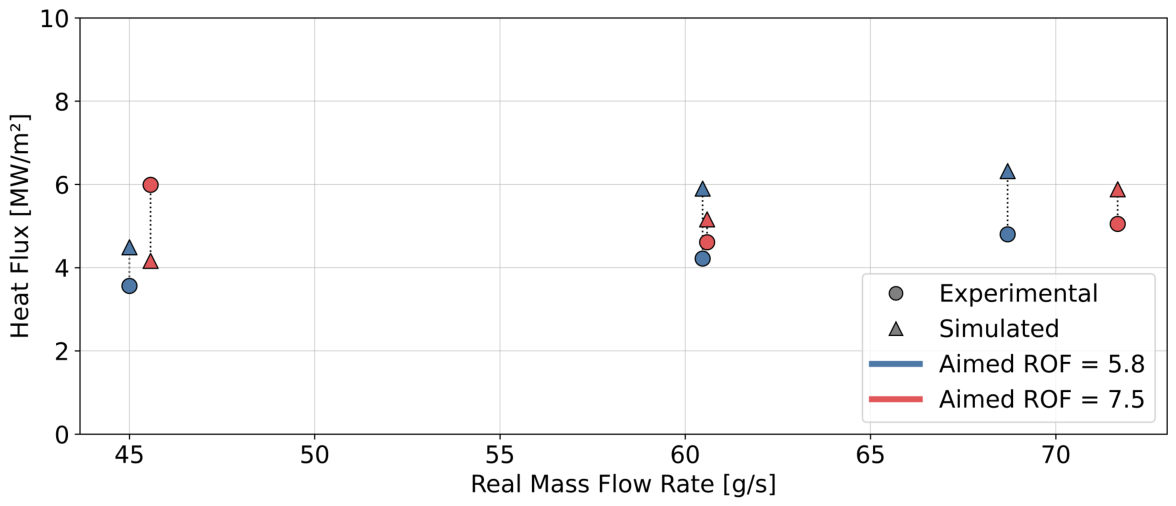
To assess the reliability of the reduced-order heat flux model, predictions were benchmarked against five independent experimental datasets available in the literature: Ditsche et al. [15], Maybee et al. [13], Stechmann [20], Goto et al. [14], and Ma et al. [16]. These datasets cover a broad range of propellant combinations, chamber geometries, and operating pressures, as summarised in Table 1. For datasets lacking explicit mass flow documentation (specifically Stechmann [20]), a bypass routine was implemented to derive mass flow from the reported chamber pressure, c * , and T c .
The simulation tool was executed for each reported operating point using the specific chamber geometry and boundary conditions, with validation results summarised in Table 2. To provide a rigorous assessment of the model’s predictive capability across datasets of varying magnitude, we employ four complementary error metrics: the Mean Absolute Percentage Error (MAPE), the Signed Percentage Bias ( μ ), the standard deviation of the error ( σ ), and the Root Mean Square Percentage Error (RMSPE). The MAPE quantifies the global average magnitude of the prediction error, and its formulation is reported in Equation (25).
M A P E = 100 % N i = 1 N q ˙ s i m , i q ˙ e x p , i q ˙ e x p , i
The Signed Percentage Bias ( μ ) identifies systematic model tendencies, where positive values denote over-prediction ( q ˙ s i m > q ˙ e x p ) and negative values indicate under-prediction, as defined in Equation (26).
μ = 100 % N i = 1 N q ˙ s i m , i q ˙ e x p , i q ˙ e x p , i
To convey model precision, we evaluate the standard deviation ( σ ) of the percentage error, as shown in Equation (27).
σ = 1 N i = 1 N q ˙ s i m , i q ˙ e x p , i q ˙ e x p , i μ 100 % 2 × 100 %
Furthermore, the RMSPE is calculated to penalise large localised outliers, with its formulation shown in Equation (28).
R M S P E = 1 N i = 1 N q ˙ s i m , i q ˙ e x p , i q ˙ e x p , i 2 × 100 %
Finally, we report the percentage of data points falling within a ± 30 % accuracy band. This threshold reflects the inherent uncertainty of baseline empirical correlations, such as the Bartz relation, used in traditional liquid rocket engine design. Collectively, these metrics demonstrate that while the model exhibits localised variance, it maintains a consistently positive bias, providing a conservative, safe-side estimate that is useful for preliminary regenerative cooling sizing.
The simulation tool was executed for each reported operating point using the specific chamber geometry and boundary conditions, with validation results summarised in Table 2. Across the five datasets, the MAPE ranges from 18.03% to 33.19%, with four of the five cases falling below 25%. The signed bias is predominantly positive, indicating a systematic tendency toward conservative overprediction, with values ranging from +5.38% to +33.19% across most datasets; the sole exception is Ma et al., which exhibits a negative bias of −8.84%. The standard deviation of the percentage error varies considerably across datasets, from 0.22% for Stechmann, reflecting a highly consistent, near-uniform scaling behaviour, to 26.71% for Ma et al., which exhibits greater scatter attributable to the sensitivity of thermochemical conditions near stoichiometry. In terms of the ±30% accuracy band, most datasets exceed 75% compliance; only Goto et al. falls below this threshold at 50%, for reasons discussed in the following paragraphs. The RMSPE values, which penalise large localised outliers, remain within 5 percentage points of the corresponding MAPE for most cases, confirming the absence of severe isolated deviations beyond those already captured by the mean error. Collectively, these metrics demonstrate that the model maintains a conservative, safe-side prediction bias that is appropriate and preferred for preliminary regenerative cooling sizing.
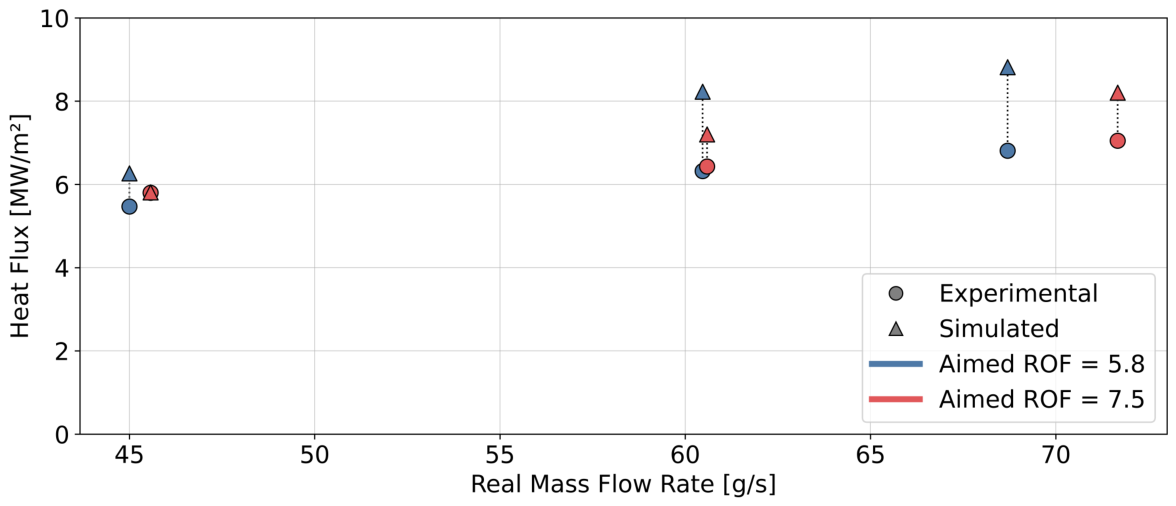
Detailed comparisons reveal specific model capabilities and limitations across the different experimental setups. In Figure 9 and Figure 10, the comparison with Ditsche et al. [15] at discrete axial locations ( z = 8 and 35 mm) confirms the model’s ability to reasonably bracket thermal loads in the combustor head region.
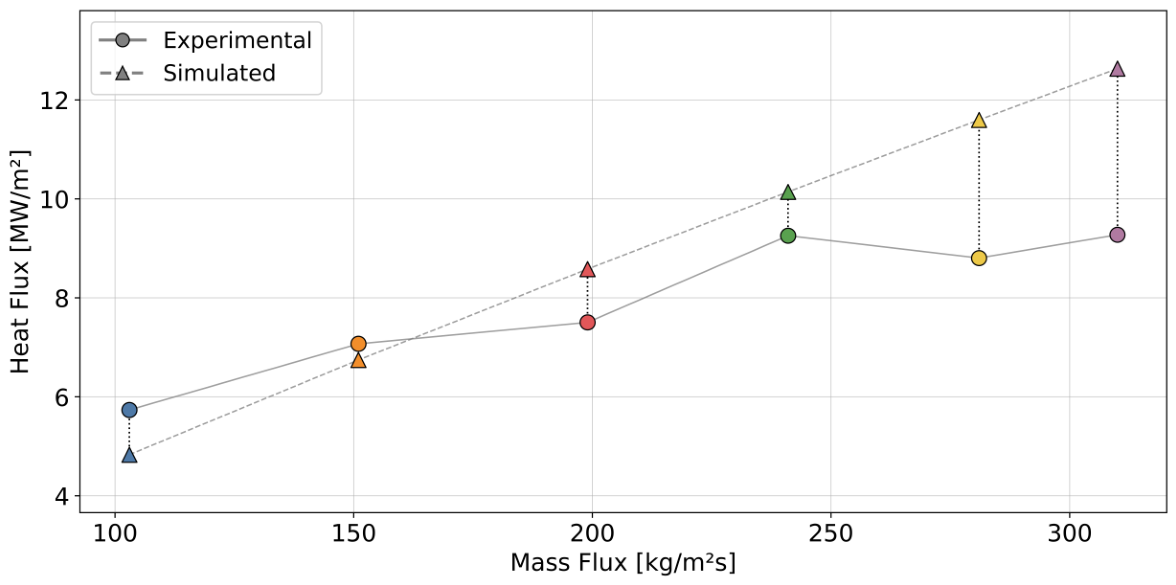
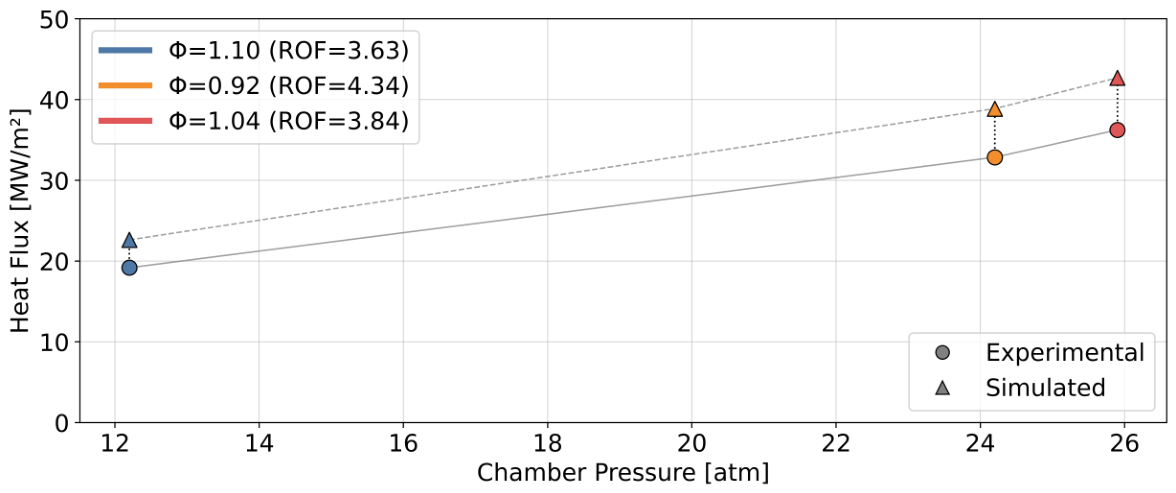
However, the full axial reconstruction against Maybee et al. [13], reported in Figure 11, highlights a discrepancy in the spatial distribution: the experimental peak heat flux occurs further downstream ( z / L 0.25 ) compared to the profile imposed by the model ( z / L 0.1 ). This spatial shift is purely morphological and is likely attributable to specific injector dynamics and wave stand-off distances that the fixed 1D canonical formulation does not explicitly resolve. Distinct from the spatial profile morphology, the model’s response to mass flux variations is evaluated independently in Figure 12. The results show that the simulated heat flux exhibits a steeper increase with respect to mass flux G compared to the experimental data. Consequently, the model slightly underpredicts the heat flux at low mass fluxes and overpredicts at higher mass fluxes. This crossing trend is consistent across different axial locations. While the exact physical mechanism driving this divergence is not yet fully understood, it highlights a limitation in applying the classical Bartz correlation to RDREs. Bartz scales convective heat transfer aggressively, whereas the actual RDRE mass flux sensitivity may be dampened by varying combustion efficiencies or non-conventional boundary layer developments. Nevertheless, the scaling behaviour captures the correct order of magnitude without introducing a flat, systematic error across all pressure regimes. This pressure scaling behaviour is further validated in Figure 13, where the simulated heat flux effectively follows the linear trend reported by Stechmann [20] across a range of chamber pressures (12–26 atm).
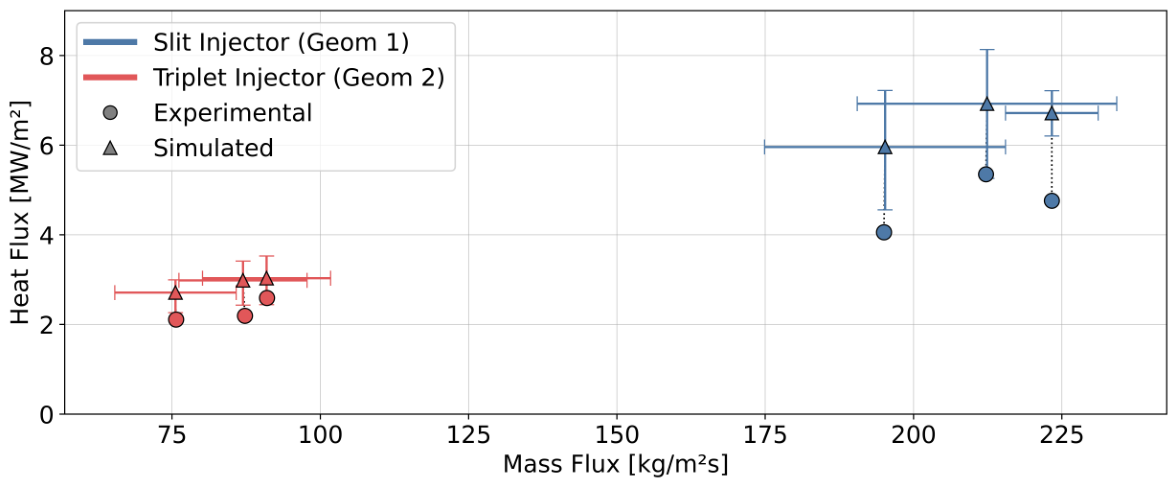
The influence of injector geometry and mass flux is further analysed in Figure 14 using data from Goto et al. [14]. The model correctly predicts the trend of increasing heat flux with mass flux across both slit and triplet injector configurations, although it cannot capture the absolute offset caused by the different mixing efficiencies of the two designs. Furthermore, this overprediction could be physically attributed to the applicability limits of the Bartz correlation at these specific operating conditions. The Bartz scaling inherently assumes a fully developed, highly turbulent boundary layer. Under the lower mass-flux conditions present in the Goto et al. dataset, the flow likely deviates from the fully turbulent assumptions. Consequently, convective heat transfer is less aggressive than the model anticipates, leading the Bartz baseline to systematically overpredict the thermal loads measured in the experiment.
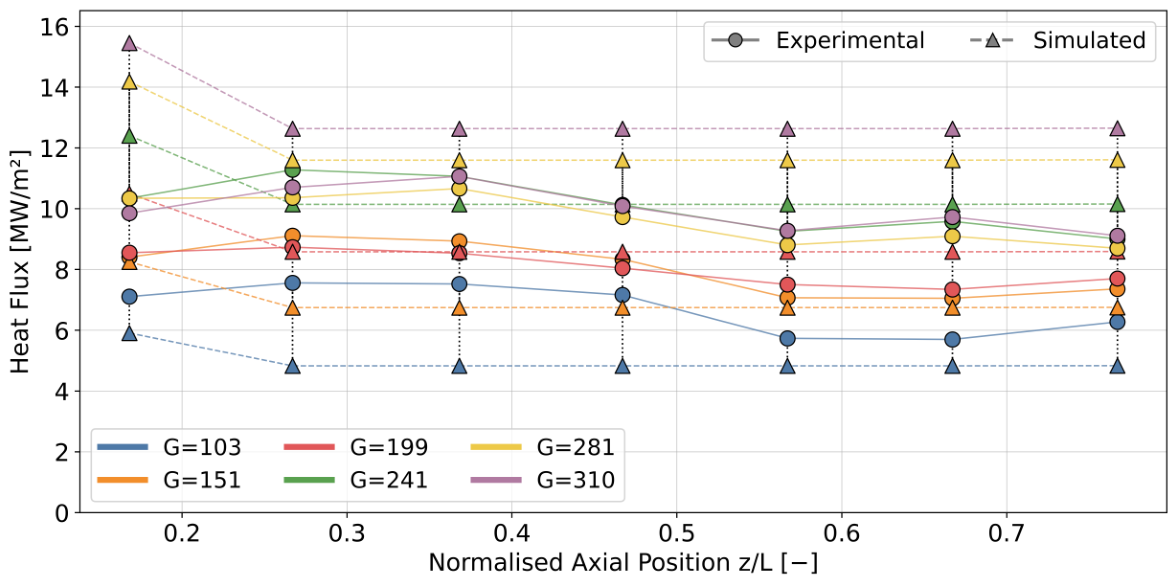
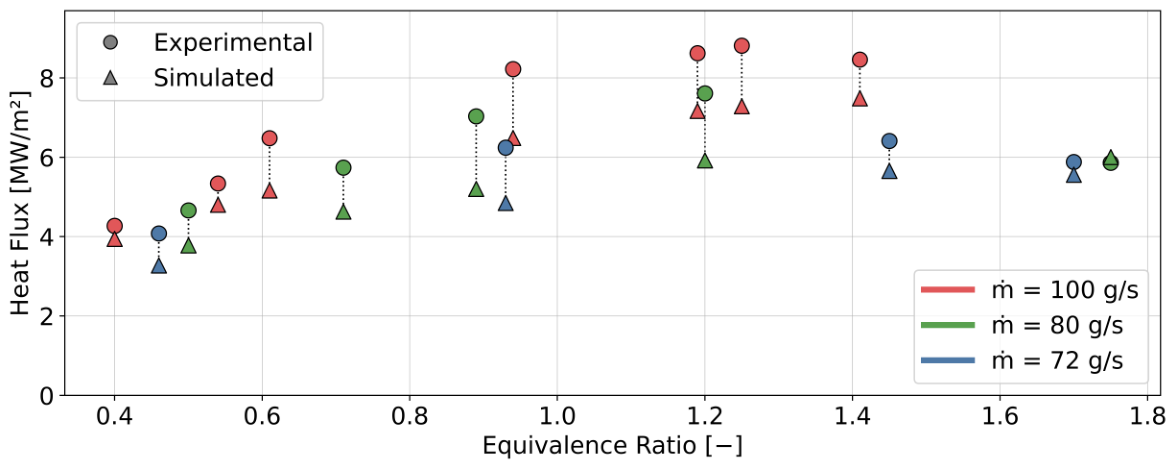
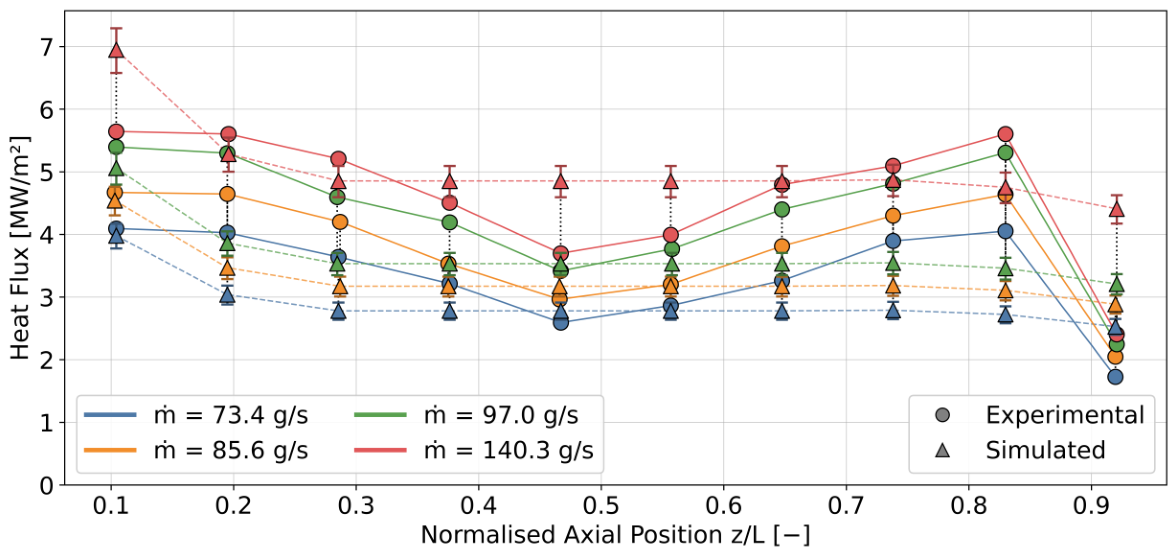
Finally, comparisons with the high-resolution dataset from Ma et al. [16] confirm the model’s sensitivity to propellant loading. Figure 15 shows the dependence of average heat flux on mass flow and equivalence ratio ϕ . While the model predictions align well with experimental data at both low and high equivalence ratios, a more significant divergence is observed as ϕ approaches unity. The exact physical mechanism driving this specific discrepancy at near-stoichiometric conditions remains unclear to the authors. However, the fact that the simulated heat flux exhibits a complex, non-linear trend rather than a simple linear scaling demonstrates that the framework, despite its limitations, successfully captures intricate thermochemical variations and interactions. Furthermore, the axial profile comparison in Figure 16 captures the characteristic near-injector peak and subsequent decay. The divergence observed at the end of the profile in Figure 16 is due to a geometric throat in the experimental hardware, which induces a local heat flux recovery not present in the constant-area simulation.

3.2. Reference Regenerative Cooling Simulation: NASA’s ECI

The NASA early career initiative project [33] represents a significant benchmark in the development of RDREs, featuring one of the largest combustors tested with cryogenic propellants to date. Consequently, this campaign is of great interest for assessing the capabilities of the proposed cooling model. However, the public data available for this specific hardware is limited; notably, explicit values for wall heat flux and local coolant temperature evolution were not published.
To enable a comparative assessment, the simulation inputs were reconstructed from the available experimental reports. The geometry of the NASA’s ECI annular combustor is provided and used in the simulations. For each of the nine steady-state test cases, the oxidiser-to-fuel ratio R O F , the total mass flow rate m ˙ , the corresponding experimental chamber pressure p c and the combustion efficiency η c were provided in the report. In the numerical procedure, the model computed a simulated chamber pressure based on the imposed mass flow rate and R O F to also verify the accuracy of this prediction, subsequently evaluating the wall heat flux and coolant temperature evolution for both propellant circuits. This approach allows for a consistency check of the thermal model against the operational envelope of a flight-weight combustor, rather than a direct validation against local heat transfer measurements.
Table 3 summarises the input conditions and the resulting model predictions. The simulated chamber pressures ranged between 22 and 27 bar, with values matching closely the experimental ones, and exhibited the expected linear dependence on the total mass flow. The model predicts peak wall heat fluxes ranging from 29 to 38 MW m−2. The corresponding temperature rise Δ T for methane and oxygen was typically between 60 and 75 K. The initial temperature values were not provided in the report, so typical values of 95 K and 110 K were taken, respectively, for oxygen and methane.
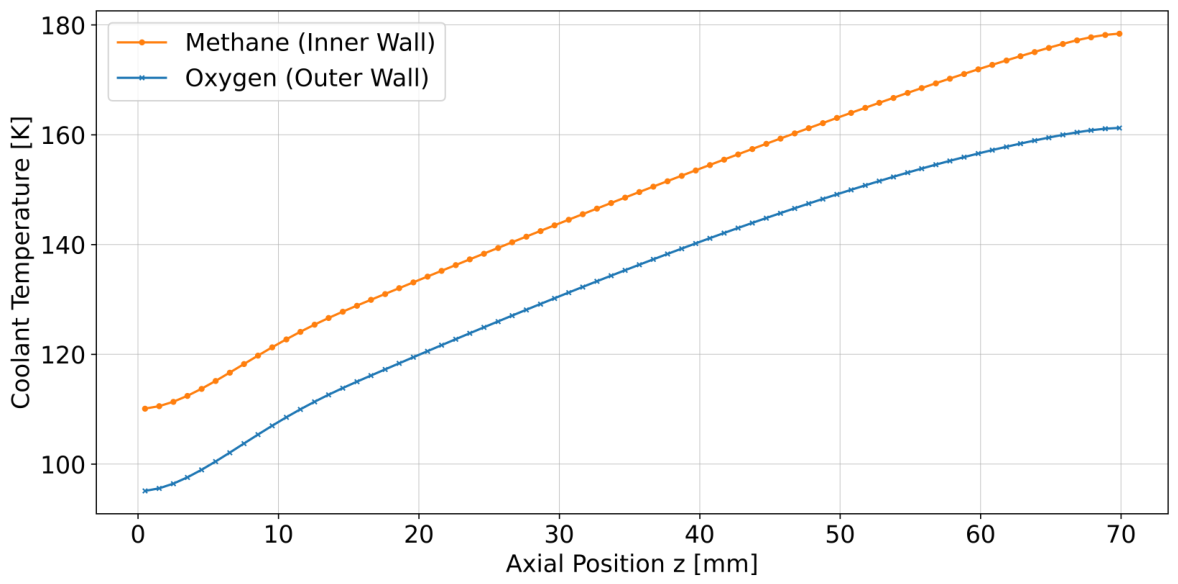
A representative coolant temperature evolution for Test 4 is shown in Figure 17. Both propellants exhibit a monotonic temperature increase along the annulus. Although experimental heat flux measurements are not available for direct comparison, the predicted temperature increments are moderate. These results align with qualitative reports stating that the hardware operated stably without material degradation [33].
Furthermore, the model results predict no excessively high temperature rises in the regenerative coolants or unfeasible injection temperatures. These results show that regenerative cooling of a rotating detonation rocket engine of this scale and thrust class is feasible, as was demonstrated experimentally by NASA.

4. Discussion

The results presented in this work show that a reduced-order modelling framework, combining a modified Bartz correlation with a canonical heat-flux profile, can capture the primary thermal characteristics of RDREs with sufficient accuracy for preliminary design. While high-fidelity CFD remains necessary for detailed flow physics, the computational efficiency of the proposed 1D framework allows for the rapid exploration of the design space, specifically regarding the engine sizing and coolant selection, which is critical in the early phases of engine development.
A key finding from the benchmarking is that the heat flux in an RDRE follows a power-law scaling with chamber pressure and mass flux. This behaviour aligns with conventional turbulent boundary layer theory, despite the inherently unsteady and supersonic nature of the detonation waves. This suggests that, from a thermal management perspective, the RDRE can be effectively treated as a high-performance deflagrative engine with a superimposed, localised peak load depending on the injector geometry and throat localisation. The successful replication of these scaling trends justifies the use of the Bartz correlation as a baseline scaling factor, provided it is modulated by an RDRE-specific shape function to account for the detonation wave topology.
Despite the successful global energy balance, an investigation of the error metrics (Table 2) reveals systematic discrepancies that can be categorised into spatial or morphological errors and absolute magnitude errors. Regarding spatial errors, discrepancies in the axial location of the peak heat flux were observed, particularly in the comparison with Maybee et al. [13]. The fixed canonical profile used in this study assumes a peak flux near z / L 0.1 . However, experimental data indicates that the location of the detonation wave anchoring point varies significantly with injector design (e.g., slit vs. triplet for the case from Goto et al. [14]) and propellant mixing scales. Since the current framework does not resolve the injection mixing length or induction delay, it cannot inherently predict this spatial shift. While this spatial error could theoretically be eliminated by adjusting the axial coordinates of the canonical profile to match specific hardware, doing so would require a-priori knowledge of the combustion dynamics, thereby negating the tool’s predictive utility for preliminary sizing.
Regarding absolute magnitude errors, the model exhibits a predominantly positive Signed Percentage Bias. This is a deliberate consequence of the selected global peak multiplier, which is tuned to ensure conservative, safe-side predictions for cooling system sizing rather than a perfect statistical mean. However, specific boundary conditions exacerbate these magnitude errors. Ultimately, adjusting the global scaling multipliers or introducing Reynolds-dependent dampening factors could force the Mean Absolute Percentage Error (MAPE) closer to zero for any individual dataset. However, such parameter tuning represents empirical over-fitting. By maintaining a fixed, generalised parameter set, the model reliably brackets the integral heat load—equal to the enthalpy gain of the coolant—across wildly different architectures, confirming its value as a robust preliminary sizing tool.
The simulation of the NASA’s ECI test cases highlights this practical utility through the coupled 1D coolant solver. While direct experimental thermal data was not available for comparison, the model yielded propellant temperature rises that are thermodynamically consistent with the reported stable operation of the hardware. These results suggest that the simplified framework is sufficiently representative to size cooling channels and determine mass budgets for dual-cooling architectures without the need for hardware-specific tuning.

5. Conclusions & Outlook

5.1. Conclusions

Thermal management remains one of the most critical aspects to increasing the technology readiness level of RDREs. While other simple heat transfer models have been proposed, a generalised, computationally efficient tool that can couple these unique thermal loads with a cooling system solver for arbitrary geometries and propellant pairs is currently lacking in the open literature for rotating detonation rocket engines. To address this gap, this study introduced a reduced-order predictive framework based on the classical Bartz correlation, adapted for annular geometry and coupled with a 1D coolant solver. The model was subsequently benchmarked against experimental data from published test campaigns.
Comparisons with calorimetric data indicated that the simplified framework captures the global thermal energy balance. However, spatial discrepancies remain, particularly regarding the exact axial location of the peak heat flux. This discrepancy highlights a systematic limitation of the generalised 1D approach, which cannot dynamically account for injector-specific characteristics. While identifying the exact axial location of the peak is undoubtedly critical for detailed thermal stress analysis and cooling channel design, it represents a secondary concern for preliminary thermal management compared to capturing the peak’s magnitude and the integral heat load. For the intended use case of this framework for preliminary designing RDREs and feasibility studies of a cooling system, capturing the integral heat load is the primary requirement, as it drives the prediction of the coolant bulk temperature rise, while the magnitude of the peak dictates boiling margins and critical heat flux limits. Ultimately, while this tool successfully bounds the macro-level energy balance, we acknowledge that it cannot replace the higher-fidelity analyses required for later stage in the design loop of a regeneratively cooled RDRE.
Despite these local deviations, the model demonstrated the ability to generate realistic thermal boundary conditions for initial sizing and mass budget definitions. Consequently, while the proposed approach is inherently simplified, it serves as a baseline for establishing cooling architectures.

5.2. Outlook

Future development will focus on two parallel tracks: expanding the validation database, as more studies will be published, and refining the physical fidelity of the heat flux profile. As more experimental results with broader operating ranges and higher spatial resolution become available, further benchmarking will be essential to reduce the uncertainties.
To mitigate the observed spatial discrepancies, future model iterations will investigate the scaling of the peak heat flux region. A promising approach involves linking the axial distribution to detonation wave parameters to improve the physical fidelity of the profile. For example, Bykovskii et al. [11] report that the height of the combustible mixture layer, h f i l l , is usually proportional to the detonation cell size, λ . With this knowledge, and recognising that the peak heat flux is located at the coordinate of the detonation front, an estimation of h f i l l can be made for a given engine geometry and propellant pair. Consequently, this would allow for a more educated guess of the peak location in future iterations of the model. Furthermore, the current monotonic decay could be adapted to feature a secondary peak near the combustor exit, thereby capturing the thermal effects of geometric choking where applicable. However, calibrating such functions necessitates a broader database of axially resolved heat flux measurements.
The model’s versatility could also be enhanced by integrating a wave-number dependency, as mode transitions can significantly alter thermal load distributions [18]. Finally, extending the coolant-side solver to handle two-phase flow and heat transfer deterioration would enable the analysis of storable propellants and deep-throttling scenarios where subcritical boiling or pseudo-boiling may occur.

Author Contributions

Conceptualization, V.P.M. and W.A.; methodology, V.P.M. and W.A.; software, V.P.M.; validation, V.P.M.; formal analysis, V.P.M.; investigation, V.P.M.; resources, V.P.M., W.A., M.B., and J.S.H.; data curation, V.P.M. and W.A.; writing—original draft preparation, V.P.M., and W.A.; writing—review and editing, V.P.M., W.A., M.B., and J.S.H.; visualization, V.P.M.; supervision, W.A. and M.B.; project administration, J.S.H. and M.B.; funding acquisition, J.S.H. All authors have read and agreed to the published version of the manuscript.

Funding

This research received no external funding.

Data Availability Statement

The original contributions presented in this study are included in the article. Further inquiries can be directed to the corresponding authors.

Conflicts of Interest

The authors declare no conflicts of interest.

Abbreviations

The following abbreviations are used in this manuscript:
RDRERotating Detonation Rocket Engine
RDERotating Detonation Engine
RDCRotating Detonation Combustor
CFDComputation Fluid Dynamics
CEAChemical Equilibrium with Applications
ECIEarly Career Initiative
RMSPERoot Mean Square Percentage Error
MAPEMean Absolute Percentage Error

References

  1. Wintenberger, E.; Shepherd, J.E. Thermodynamic Cycle Analysis for Propagating Detonations. J. Propuls. Power 2006, 22, 694–698. [Google Scholar] [CrossRef]
  2. Nicholls, J.A.; Cullen, R.E.; Ragland, K.W. Feasibility Studies of a Rotating Detonation Wave Rocket Motor. J. Spacecr. Rocket. 1966, 3, 893–898. [Google Scholar] [CrossRef] [PubMed]
  3. Heister, S.D.; Smallwood, J.; Harroun, A.; Dille, K.; Martinez, A.; Ballintyn, N. Rotating Detonation Combustion for Advanced Liquid Propellant Space Engines. Aerospace 2022, 9, 581. [Google Scholar] [CrossRef]
  4. Bennewitz, J.W.; Bigler, B.R.; Ross, M.C.; Danczyk, S.A.; Hargus, W.A.; Smith, R.D. Performance of a Rotating Detonation Rocket Engine with Various Convergent Nozzles and Chamber Lengths. Energies 2021, 14, 2037. [Google Scholar] [CrossRef]
  5. Zeldovich, Y.B. To the Question of Energy Use of Detonation Combustion. J. Propuls. Power 2006, 22, 588–592. [Google Scholar] [CrossRef]
  6. Ma, J.Z.; Luan, M.Y.; Xia, Z.J.; Wang, J.P.; Zhang, S.j.; Yao, S.b.; Wang, B. Recent Progress, Development Trends, and Consideration of Continuous Detonation Engines. AIAA J. 2020, 58, 4976–5035. [Google Scholar] [CrossRef]
  7. Roy, G.; Frolov, S.; Borisov, A.; Netzer, D. Pulse Detonation Propulsion: Challenges, Current Status, and Future Perspective. Prog. Energy Combust. Sci. 2004, 30, 545–672. [Google Scholar] [CrossRef]
  8. Davidenko, D.M.; Gökalp, I.; Kudryavtsev, A.N. Numerical simulation of the continuous rotating hydrogen-oxygen detonation with a detailed chemical mechanism. In Proceedings of the West-East High Speed Flow Field Conference, Moscow, Russia, 19–22 November 2007. [Google Scholar]
  9. Davidenko, D.; Eude, Y.; Gokalp, I.; Falempin, F. Theoretical and numerical studies on continuous detonation wave engines. In Proceedings of the 17th AIAA International Space Planes and Hypersonic Systems and Technologies Conference, San Francisco, CA, USA, 11–14 April 2011; p. 2334. [Google Scholar]
  10. Teasley, T.W.; Fedotowsky, T.M.; Gradl, P.R.; Austin, B.L.; Heister, S.D. Current State of NASA Continuously Rotating Detonation Cycle Engine Development. In Proceedings of the AIAA SCITECH 2023 Forum, National Harbour, MD, USA, 23–27 January 2023. [Google Scholar] [CrossRef]
  11. Bykovskii, F.A.; Zhdan, S.A.; Vedernikov, E.F. Continuous Spin Detonations. J. Propuls. Power 2006, 22, 1204–1216. [Google Scholar] [CrossRef]
  12. Lu, F.K.; Braun, E.M. Rotating Detonation Wave Propulsion: Experimental Challenges, Modeling, and Engine Concepts. J. Propuls. Power 2014, 30, 1125–1142. [Google Scholar] [CrossRef]
  13. Maybee, M.; Hemming, M.R.; Durkee, K.J.; Byers, J.; Hernandez-McCloskey, J.; Xu, K.G.; Bennewitz, J.W.; Teasley, T.W. Average Heat Flux Measurements in a Gaseous Detonation-Based Rocket Engine. In Proceedings of the AIAA SCITECH 2025 Forum, Orlando, FL, USA, 6–10 January 2025. [Google Scholar] [CrossRef]
  14. Goto, K.; Nishimura, J.; Kawasaki, A.; Matsuoka, K.; Kasahara, J.; Matsuo, A.; Funaki, I.; Nakata, D.; Uchiumi, M.; Higashino, K. Propulsive Performance and Heating Environment of Rotating Detonation Engine with Various Nozzles. J. Propuls. Power 2019, 35, 213–223. [Google Scholar] [CrossRef]
  15. Ditsche, F.; Petersen, J.; Propst, M.; Armbruster, W.; Börner, M.; Hardi, J.; Tajmar, M.; Bach, C. Heat Flux Measurements in a small-scale Oxygen-Hydrogen Rotating Detonation Rocket Combustor. In Proceedings of the 35th International Symposium on Space Technology and Science, Tokushima, Japan, 12–18 July 2025. [Google Scholar]
  16. Ma, J.Z.; Hou, Y.; Zhang, X.; Wang, Y.; He, X.; Wang, J.P. Experimental Study of Average and High-Frequency Wall Heat Flux Characteristics in a Compact Rotating Detonation Engine. Aerosp. Sci. Technol. 2025, 164, 110458. [Google Scholar] [CrossRef]
  17. Fan, W.; Peng, H.; Liu, S.; Yan, C.; Zhang, H.; Yuan, X.; Zhong, S.; Liu, W. Combustion Characteristics of Continuous Rotating Detonation in the Hollow Combustor through Synchronous Chemiluminescence Imaging. Combust. Flame 2026, 287, 114920. [Google Scholar] [CrossRef]
  18. Aliakbari, R.; Michalski, Q.; Mason-Smith, N.; Pudsey, A.; Wenzel, M.; Paull, N. Heat Flux Measurements of a Methane-Oxygen Rotating Detonation Rocket Engine. In Proceedings of the International Workshop on Detonation Propulsion, Berlin, Germany, 15–19 August 2022. [Google Scholar]
  19. Hernandez-McCloskey, J.; Teasley, T.W.; Petty, D.M.; Reutlinger, S.A.; Pineda, D.I. Calorimeter Heat Flux Trends in NASA’s Subscale Rotating Detonation Rocket Engine. In Proceedings of the AIAA SCITECH 2025 Forum, Orlando, FL, USA, 6–10 January 2025. [Google Scholar] [CrossRef]
  20. Stechmann, D.P. Experimental Study of High-Pressure Rotating Detonation Combustion in Rocket Environments. Ph.D. Thesis, Purdue University, West Lafayette, IN, USA, 2017. [Google Scholar]
  21. Stevens, C.A.; Fotia, M.; Hoke, J.; Schauer, F. An Experimental Comparison of the Inner and Outer Wall Heat Flux in an RDE. In Proceedings of the AIAA Scitech 2019 Forum, San Diego, CA, USA, 7–11 January 2019. [Google Scholar] [CrossRef]
  22. Petty, D.M.; Teasley, T.W.; Hernandez-McCloskey, J.; Goldman, A.D. Parameterized Study of Heat Load Trends in a Subscale Rotating Detonation Rocket Engine. In Proceedings of the AIAA SCITECH 2025 Forum, Orlando, FL, USA, 6–11 January 2025. [Google Scholar] [CrossRef]
  23. Frolov, S.M.; Dubrovskii, A.V.; Ivanov, V.S. Three-Dimensional Numerical Simulation of the Operation of the Rotating-Detonation Chamber. Russ. J. Phys. Chem. B 2012, 6, 276–288. [Google Scholar] [CrossRef]
  24. Hou, Y.; Cheng, M.; Sheng, Z.; Wang, J. Unsteady Conjugate Heat Transfer Simulation of Wall Heat Loads for Rotating Detonation Combustor. Int. J. Heat Mass Transf. 2024, 221, 125081. [Google Scholar] [CrossRef]
  25. Roy, A.; Strakey, P.; Sidwell, T.; Ferguson, D.H. Unsteady Heat Transfer Analysis to Predict Combustor Wall Temperature in Rotating Detonation Engine. In Proceedings of the 51st AIAA/SAE/ASEE Joint Propulsion Conference, Orlando, FL, USA, 27–29 July 2015. [Google Scholar] [CrossRef]
  26. Roy, A.; Strakey, P.; Sidwell, T.; Ferguson, D.; Sisler, A.; Nix, A. Development of a Three-dimensional Transient Wall Heat Transfer Model of a Rotating Detonation Combustor. In Proceedings of the 54th AIAA Aerospace Sciences Meeting, San Diego, CA, USA, 4–8 January 2016. [Google Scholar] [CrossRef]
  27. Randall, S.; Anand, V.; St. George, A.C.; Gutmark, E.J. Numerical Study of Heat Transfer in a Rotating Detonation Combustor. In Proceedings of the 53rd AIAA Aerospace Sciences Meeting, Kissimmee, FL, USA, 5–9 January 2015. [Google Scholar] [CrossRef]
  28. Ramanagar Sridhara, S.; Sandri, U.; Nassini, P.C.; Andreini, A.; Polanka, M.D.; Bohon, M.D. Quantification of Heat Loads in Rotating Detonation Combustors for Gas Turbines. J. Propuls. Power 2026, 42, 149–159. [Google Scholar] [CrossRef]
  29. Cocks, P.A.; Holley, A.T.; Rankin, B.A. High Fidelity Simulations of a Non-Premixed Rotating Detonation Engine. In Proceedings of the 54th AIAA Aerospace Sciences Meeting, San Diego, CA, USA, 4–8 January 2016. [Google Scholar] [CrossRef]
  30. Micka, D.J.; Daines, G.; Sosa, J.; Burke, R.F.; Ahmed, K.A.; Paulson, E.; Bennewitz, J.W.; Danczyk, S.; Hargus, W.A. Heat Transfer Measurements in an Elevated Pressure RDRE Combustor. In Proceedings of the AIAA Propulsion and Energy 2021 Forum, Virtual, 9–11 August 2021. [Google Scholar] [CrossRef]
  31. Theuerkauf, S.W.; Schauer, F.; Anthony, R.; Hoke, J. Average and Instantaneous Heat Release to the Walls of an RDE. In Proceedings of the 52nd Aerospace Sciences Meeting, National Harbor, MD, USA, 13–17 January 2014. [Google Scholar] [CrossRef]
  32. Michalski, Q.; Aliakbari, R.; Mason-Smith, N.; Paull, N.; Wenzel, M.; Pudsey, A. Structure of rotating detonation in mixtures of natural gas and oxygen. Combust. Flame 2024, 260, 113253. [Google Scholar] [CrossRef]
  33. Teasley, T. ECI Final Report: Closing of Critical Technology Gaps for Rotating Detonation Rocket Engines; Technical Report; NASA: Washington, DC, USA, 2024.
  34. Braun, J.; Sousa, J.; Paniagua, G. Numerical Assessment of the Convective Heat Transfer in Rotating Detonation Combustors Using a Reduced-Order Model. Appl. Sci. 2018, 8, 893. [Google Scholar] [CrossRef]
  35. Sousa, J.; Braun, J.; Paniagua, G. Development of a Fast Evaluation Tool for Rotating Detonation Combustors. Appl. Math. Model. 2017, 52, 42–52. [Google Scholar] [CrossRef]
  36. Fievisohn, R.T.; Yu, K.H. Steady-State Analysis of Rotating Detonation Engine Flowfields with the Method of Characteristics. J. Propuls. Power 2017, 33, 89–99. [Google Scholar] [CrossRef]
  37. Mizener, A.R.; Lu, F.K. Low-Order Parametric Analysis of a Rotating Detonation Engine in Rocket Mode. J. Propuls. Power 2017, 33, 1543–1554. [Google Scholar] [CrossRef]
  38. Bell, I.H.; Wronski, J.; Quoilin, S.; Lemort, V. Pure and Pseudo-pure Fluid Thermophysical Property Evaluation and the Open-Source Thermophysical Property Library CoolProp. Ind. Eng. Chem. Res. 2014, 53, 2498–2508. [Google Scholar] [CrossRef] [PubMed]
  39. Pizzarelli, M.; Urbano, A.; Nasuti, F. Numerical Analysis of Deterioration in Heat Transfer to Near-Critical Rocket Propellants. Numer. Heat Transf. Part A Appl. 2010, 57, 297–314. [Google Scholar] [CrossRef]
  40. Pizzarelli, M.; Nasuti, F.; Onofri, M.; Roncioni, P.; Votta, R.; Battista, F. Heat Transfer Modeling for Supercritical Methane Flowing in Rocket Engine Cooling Channels. Appl. Therm. Eng. 2015, 75, 600–607. [Google Scholar] [CrossRef]
  41. Athmanathan, V.; Wang, R.B.; Webb, A.M.; Huber, K.; Rödiger, T.; Braun, J.; Roy, S.; Fugger, C.A.; Meyer, T.R. MHz Rate In-Situ Direct Surface Heat-Flux Measurements in a Rotating-Detonation Engine. In Proceedings of the AIAA SCITECH 2025 Forum, Orlando, FL, USA, 6–10 January 2025. [Google Scholar] [CrossRef]
  42. Gordon, S.; McBride, J.M.B. Computer Program for Calculation Complex Chemical Equilibrium Compositions and Applications; Technical Report NASA RP-1311; NASA Lewis Research Center: Cleveland, OH, USA, 1994.
  43. Davidenko, D.; Gökalp, I.; Kudryavtsev, A. Numerical Study of the Continuous Detonation Wave Rocket Engine. In Proceedings of the 15th AIAA International Space Planes and Hypersonic Systems and Technologies Conference, Dayton, OH, USA, 28 April–1 May 2008. [Google Scholar] [CrossRef]
  44. Lim, D.; Heister, S.D.; Humble, J.; Harroun, A.J. Experimental Investigation of Wall Heat Flux in a Rotating Detonation Rocket Engine. J. Spacecr. Rocket. 2021, 58, 1444–1452. [Google Scholar] [CrossRef]
  45. Smallwood, J.S. Thermal and Structural Characterization of A Rotating Detonation Rocket Engine. Ph.D. Thesis, Purdue University, West Lafayette, IN, USA, 2024. [Google Scholar] [CrossRef]
  46. Bartz, D. Turbulent Boundary-Layer Heat Transfer from Rapidly Accelerating Flow of Rocket Combustion Gases and of Heated Air. In Advances in Heat Transfer; Elsevier: Amsterdam, The Netherlands, 1965; Volume 2, pp. 1–108. [Google Scholar] [CrossRef]
  47. Gnielinski, V. New Equations for Heat and Mass Transfer in the Turbulent Flow in Pipes and Channels. NASA STI/Recon Tech. Rep. A 1975, 41, 8–16. [Google Scholar] [CrossRef]
  48. Sieder, E.N.; Tate, G.E. Heat Transfer and Pressure Drop of Liquids in Tubes. Ind. Eng. Chem. 1936, 28, 1429–1435. [Google Scholar] [CrossRef]
Figure 1. Schematic of the working principle of an RDE, adapted from Davidenko et al. [8,9]. 1—propellant injection; 2—injection plane; 3—detonation front; 4—fresh propellant layer; 5—oblique shock; 6—exit plane.
Aerospace 13 00637 g001
Figure 2. High-speed imaging of the RDE chemiluminescence flow field for two different injector geometries; adapted from Aliakbari et al. [18]. Cooling channels relative position are overlaid. The corresponding axial heat flux distributions are reported on the right. 1—detonation front; 2—oblique shock; 3—slip line; 4—expansion region; 5—post-shock region; 6—refreshing gas region.
Aerospace 13 00637 g002
Figure 3. Comparison of experimental wall heat flux distributions from literature [13,16,18]. The profiles consistently exhibit a front-loaded distribution, with peak thermal loads occurring near the injector face. The dashed segments represent a slope-preserving extrapolation connecting the first experimental data point to the injector face ( z = 0 ).
Aerospace 13 00637 g003
Figure 4. Schematic workflow of the simulation tool. The dashed and dash-dotted lines represent alternative paths where only some modules of the programme can be used with a reduced set of inputs. Solid lines represent nominal workflow for heat flux prediction and cooling system coupling.
Aerospace 13 00637 g004
Figure 5. Comparison of normalised heat flux profiles along the axial position z / L . The profile used in the present study is shown alongside experimental and numerical data from literature [13,16,18].
Aerospace 13 00637 g005
Figure 6. Normalised RDRE heat flux distribution. (Left): spline-based profile scaled to the inferred peak. (Right): piecewise-constant approximation was used to sample q ˙ at axial locations z for subsequent calculations (the average over each segment is denoted q ˙ ¯ i ). The presented approximation is deliberately coarse to better visualise the segments.
Aerospace 13 00637 g006
Figure 7. Schematic of the axial discretisation used for the coolant-side and wall temperature calculations.
Aerospace 13 00637 g007
Figure 8. Nusselt number along the channel for oxygen and hydrogen along the cooling passage. Solid: Sieder–Tate. Dashed: Gnielinski with ϵ = 0 μ m . Dotted: Gnielinski with ϵ = 50 μ m . For smooth walls, the two correlations collapse, whereas with roughness Gnielinski predicts higher N u consistently with the increased friction factor.
Aerospace 13 00637 g008
Figure 9. Comparison with Ditsche et al. [15] of wall heat flux measured at z = 8 mm.
Aerospace 13 00637 g009
Figure 10. Comparison with Ditsche et al. [15] of wall heat flux measured at z = 35 mm.
Aerospace 13 00637 g010
Figure 11. Axial wall heat flux comparison with Maybee et al. [13] at ϕ = 1.1 .
Aerospace 13 00637 g011
Figure 12. Wall heat flux dependence on the mass flux G for a fixed axial location ( z / L 0.57 ) . Comparison with Maybee et al. [13] at ϕ = 1.1 .
Aerospace 13 00637 g012
Figure 13. Wall heat flux comparison for various chamber pressures and mixture ratios (Stechmann [20]).
Aerospace 13 00637 g013
Figure 14. Comparison of measured and simulated wall heat fluxes for slit and triplet injector geometries (Goto et al. [14]).
Aerospace 13 00637 g014
Figure 15. Comparison of measured and simulated wall heat fluxes for varying mass flows and equivalence ratios (Ma et al. [16]).
Aerospace 13 00637 g015
Figure 16. Comparison of axial wall heat flux q as a function of normalised length for varying m ˙ and constant ϕ = 0.50 ± 0.04 (Ma et al. [16]).
Aerospace 13 00637 g016
Figure 17. Simulated coolant temperature profiles for Test 4.
Aerospace 13 00637 g017
Table 1. Experimental datasets used for benchmarking.
ReferencePropellantsGeometry [mm]Operating ConditionsMaterial
Ditsche et al. [15]H2/O2 O D = 68 , Δ = 4.5 m ˙ = 45 –70 g s−1CuCr1Zr
Maybee et al. [13]CH4/O2 O D = 76.8 , Δ = 6.65 G = 103 –310 kg m−2 s−1GRCop-42
Stechmann [20]CH4/O2 O D = 98.3 , Δ = 7.6 p c = 12 –26 atmCopper C110
Goto et al. [14]C2H4/O2Two geometries * m ˙ = 125 –160 g s−1Copper C1100
Ma et al. [16]CH4/O2 O D = 58 , Δ = 6 m ˙ = 72 –100 g s−1Inconel 718
* For Goto et al.: geometry 1: O D = 66.9 mm, Δ = 3.2 mm, L = 48 mm, slit injector; geometry 2: O D = 78.0 mm, Δ = 8.0 mm, L = 75 mm, triplet injector.
Table 2. Benchmarking results: simulated versus experimental wall heat flux.
ReferenceExp. q ˙ Range
[MW m−2]
Sim. q ˙ Range
[MW m−2]
MAPEBias ( μ ± σ )Within ± 30 % RMSPE
Ditsche et al. [15]3.56–7.054.16–8.8221.61%+16.52% ± 17.66%66.7%24.19%
Maybee et al. [13]5.70–11.284.83–12.6318.91%+5.38% ± 22.08%78.6%22.73%
Stechmann [20]19.18–36.2422.63–42.6918.03%+18.03% ± 0.22%100.0%18.04%
Goto et al. [14]2.11–5.352.71–6.9333.19%+33.19% ± 9.65%50.0%34.56%
Ma et al. [16]4.08–8.813.27–7.2822.54%−8.84% ± 26.71%78.6%28.14%
Table 3. Summary of simulated NASA’s ECI cold-flow tests and corresponding model outputs.
Data from ECI ReportSimulated
Test ROF m ˙ [kg s−1] p c [bar] q ˙ peak [MW m−2] Δ T CH 4 [K] Δ T O 2 [K]
12.457.8222.3328.7857.2863.30
22.438.4224.1030.8056.6863.16
32.458.4124.0930.9257.1563.28
42.819.3427.2538.4768.2966.12
52.838.6825.4837.4871.2167.72
62.838.0823.1131.4365.4763.94
73.298.3723.9534.5074.7464.71
83.259.0125.3934.1769.8661.58
93.279.0125.3934.1670.0161.47
Disclaimer/Publisher’s Note: The statements, opinions and data contained in all publications are solely those of the individual author(s) and contributor(s) and not of MDPI and/or the editor(s). MDPI and/or the editor(s) disclaim responsibility for any injury to people or property resulting from any ideas, methods, instructions or products referred to in the content.