Abstract
Active clearance control (ACC) is an effective means of reducing engine fuel consumption. Recently, an innovative fuel-cooled ACC (FCACC) scheme has been developed to improve engine performance by utilizing fuel from the aircraft fuel thermal management system (AFTMS) to precool bleed air, creating a trade-off between fuel supply and thermal management capabilities. To maximize flight endurance through FCACC, this paper firstly elucidates its mechanism for conserving both fuel and fuel heat sink when the thermal management flow path (TMFP) operates in the full recirculation state (FRS), benefiting from the configuration of the recirculation fuel supply branch (RFSB). Calculation results indicate that flight endurance can be extended by 2.28% and 11.62% under the standard condition and extreme mission, respectively. Then, the impact of further utilizing fuel heat sink on flight endurance at the critical transition from FRS to partial recirculation state (PRS) is investigated. In this case, thermal failure, rather than fuel depletion, dominates and shortens flight endurance. Based on this, a novel dynamic regulation strategy for fuel/bleed air heat exchange is established, which is applicable across various operating conditions. Finally, a common mission demonstrates that FCACC can reduce takeoff weight by 20.33 kg, enabling the aircraft to carry additional devices.
1. Introduction
The increasing complexity of flight missions has positioned high-performance aircraft as a pivotal focus for future advancements in the field of aviation, which are characterized by features such as high speed [1], superior maneuverability [2], stealth capabilities [3], and the integration of artificial intelligence [4]. Moreover, to meet the demands of long-distance flight operations, it is imperative to enhance the endurance capabilities of modern aircraft [5,6]. As a result, flight endurance, defined as the maximum duration that an aircraft can operate normally under specified constraints, has emerged as a critical metric for assessing aircraft performance.
Fuel capacity is a key determinant of flight endurance, as flight operations must be terminated once the fuel in the fuel tank is depleted. Therefore, reducing the fuel consumption rate of aircraft is an important measure for extending flight endurance. Additionally, since the engine serves as the primary source of fuel consumption, scholars have dedicated their efforts to improving engine performance to achieve reductions in fuel consumption in recent years [7,8,9]. Dik et al. [10] optimized the component parameters of a three-shaft turbofan engine to reduce specific fuel consumption (SFC), resulting in the larger fan and bypass duct. Among various methods, enhancing turbine efficiency, defined as the ratio of actual output work to the ideal isentropic expansion work for the turbine, has been shown to effectively reduce engine fuel consumption [11], as it directly determines engine performance. In addition, this parameter is significantly affected by turbine tip clearance (TTC) [12], which refers to the clearance between the blade tip and the shroud. A previous study has indicated that reducing the TTC by 1% of the blade length could result in a 2% increase in turbine efficiency [13]. Thus, it is necessary to control the TTC size during flight for saving fuel, as it experiences dynamic changes due to both thermal and mechanical loads when the engine operates under varying conditions [14]. Based on different operating principles, TTC control modes can be categorized into two types: passive clearance control (PCC) and active clearance control (ACC). In PCC systems, the deformation of the rotor and stator is suitably matched to optimize the size of TTC by selecting appropriate materials and geometries [15]. Nevertheless, to ensure engine safety during flight phases with the minimum TTC (pinch points), such as takeoff, PCC systems often leave a larger TTC when cruising [12]—the longest phase of the flight, thereby leading to an undesired fuel consumption rate, which needs to be further optimized.
In comparison to PCC, ACC exhibits superior adaptability and enables flexible dynamic adjustments of TTC throughout the entire flight profile. Also, ACC systems can be further categorized into mechanical and thermal types according to their operating principles. Mechanical ACC uses linkages and some actuation to change the TTC [12]. Kratz et al. [16] investigated the requirements for a generic ACC actuator in fast response processes and conducted a parametric study. DeCastro et al. [17] explored the feasibility of employing high-temperature shape memory alloy actuators in ACC and designed a sufficiently compact structure for the actuator to accommodate the limited space outside the high-pressure turbine (HPT) case. Jia et al. [18] proposed a piezoelectric actuator and developed a fuzzy algorithm to actively control the TTC. However, the drawback of mechanical control lies in the increased number of components and system complexity, and accurately measuring the TTC also poses a severe challenge to sensor technology [19,20].
Thermal ACC is an efficient method for managing TTC during the whole flight, which has already been implemented in the JT9D-59/70 and PW4000 engines, manufactured by Pratt & Whitney, located in East Hartford, CT, USA. [20], garnering widespread attention recently. In the active thermal control process, bleed air extracted from the compressor is typically utilized to cool the shroud, thereby varying the size of TTC. Precisely calculating the thermo-mechanical deformations of the rotor and stator and mastering their impact on engine performance are essential for thermal ACC systems to effectively regulate TTC. Chapman et al. [14] created a detailed simulation platform integrating TTC and engine models, and a sensitivity analysis of parameter influence was carried out. Similarly, Sheng et al. [21] comprehensively considered the factors affecting the accuracy of TTC calculations and quantified the impact of TTC on turbine efficiency and fuel consumption during the cruise phase. It is obvious that the effectiveness of thermal ACC is limited by the cooling capability of the bleed air. However, since the pressure ratio of the compressor continues to increase in advanced engines, the bleed air is becoming too hot to sufficiently cool the shroud, compromising turbine efficiency due to the failure of thermal ACC. To deal with this issue, Gou et al. [22] innovatively proposed a scheme that utilizes fuel in the aircraft fuel thermal management system (AFTMS) to precool the bleed air in thermal ACC, referred to as fuel-cooled ACC (FCACC). This approach effectively decreased the bleed air temperature by utilizing the fuel heat sink, successfully maintaining appropriate TTC sizes throughout the flight mission. Additionally, the superior heat transfer capability of the fuel enables the newly installed fuel/bleed air heat exchanger to be designed in a compact manner. Calculation results revealed that total fuel consumption could be reduced by 2.59% compared to the original scheme. Furthermore, this fuel-cooled technology has the potential to decrease the required bleed air, thereby contributing to improved compressor performance.
In the FCACC scheme, the thermal management performance of the aircraft is coupled with engine performance due to the heat transfer process. In addition, the AFTMS is required to provide adequate fuel heat sink for active TTC control. Unfortunately, increasing heat loads and harsher heat dissipation conditions present significant thermal challenges to the AFTMS in advanced aircraft, as the carried capacity of fuel heat sink is limited, even leading to thermal failure under extreme conditions [23,24,25]. Once thermal failure occurs, the aircraft’s flight endurance becomes directly constrained by temperature limitations rather than fuel depletion, resulting in a waste of the remaining fuel capacity for subsequent flights. Consequently, fuel overtemperature should be avoided. A desired state for extending flight endurance is to ensure that all temperature limitations within the AFTMS are satisfied before the fuel tank becomes empty. To achieve this objective, scholars have made efforts to enhance the system’s thermal management capability through architectural optimization, employing strategies such as the dual-tank system [26], additional internal branches [27], multi-return flow paths [28] and N-tank configuration [29]. Furthermore, optimizing control parameters within the AFTMS represents another important approach [30]. It is gratifying that the desired state can be achieved in most cases following these optimizations. Nevertheless, the substantial heat load transferred from the bleed air to the fuel in the FCACC scheme may still impair the thermal management performance of the AFTMS if it exceeds the heat dissipation capability of the fuel flow paths, thereby increasing the risk of thermal failure. In summary, it is essential to appropriately regulate the utilization of the fuel heat sink in the FCACC scheme during flight, as this is critical for maximizing flight endurance under the dual constraints of both fuel thermal failure and fuel depletion failure in the AFTMS—an important aspect that has been overlooked in prior research. By addressing this gap, the operational efficiency and thermal safety of the aircraft can be significantly enhanced.
In this paper, the mechanism of the FCACC scheme in extending flight endurance is firstly elucidated in detail. Then, the impact of using fuel as a heat sink in thermal ACC on the overall performance of the AFTMS is explored, particularly regarding its thermal management capability. Based on this analysis, a dynamic regulation strategy is established to safely cool the bleed air by utilizing the fuel heat sink, thereby preventing thermal failure and fully unleashing the potential of FCACC in extending flight endurance. Finally, a specific flight mission is calculated to demonstrate the role of FCACC in reducing the initial weight of fuel carried by the aircraft. This work proposes a theoretical analysis method that addresses the trade-off between fuel capacity and fuel heat sink capacity in determining flight endurance, which is also applicable to various fuel thermal management architectures.
2. Methodology
2.1. FCACC Scheme
The FCACC system consists of the AFTMS and the engine, as illustrated in Figure 1, and they interact with each other through heat exchangers and the fuel nozzle [22]. The AFTMS not only supplies combustion fuel to the engine combustor as required, but also absorbs the oil and bleed air heat loads from the engine. In this configuration, the bleed air used for cooling the shroud can be precooled by the fuel, thereby enhancing its capability for thermal ACC.
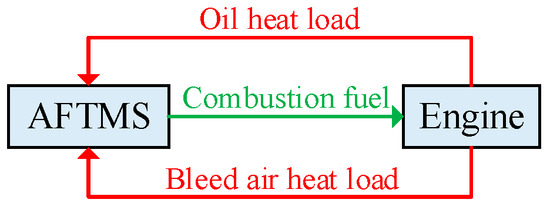
Figure 1.
Schematic diagram of the heat and mass transfer between the AFTMS and the engine in FCACC.
In addition, it can be observed from Figure 1 that the engine primarily provides a heat and mass transfer boundary for the AFTMS. Therefore, the analysis of the FCACC scheme in this paper can be conducted from the perspective of the AFTMS, where the engine, including the TTC section, is simplified to the oil heater (OH), bleed air heater (BH) and combustor, as illustrated in Figure 2. Moreover, to maximize the available fuel heat sink for cooling the bleed air, the optimized architecture of the AFTMS with superior heat dissipation performance established in Reference [27] is adopted here.
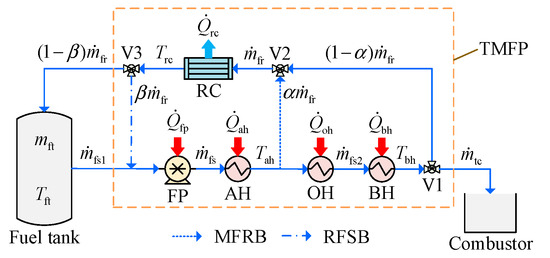
Figure 2.
Architecture of the AFTMS in the FCACC scheme.
The thermal management flow path (TMFP) depicted in Figure 2 constitutes the core part of the AFTMS, responsible for absorbing heat loads and dissipating waste heat to guarantee the system’s thermal safety. Initially, fuel is extracted from the fuel tank by the fuel pump (FP) and supplied to the airborne heater (AH) to cool airborne equipment. The FP is designed as a variable-speed pump to well match its flow rate and rotational speed, achieving efficient operation. The heated fuel then flows sequentially through the OH and BH to absorb heat loads from the engine lubrication oil () and the bleed air in thermal ACC (), respectively. The fuel/bleed air heat exchange process is regulated by a distribution valve [22], which determines the proportion of bleed air directed into the BH, thereby varying
. V1–V3 are three fuel flow regulating valves. To meet the requirements for fuel coking prevention and component cooling, the fuel flow supplied by the FP () is typically larger than the fuel flow required by the combustor (), with the surplus fuel () regulated back to the plane, termed the hot fuel return (HFR). Subsequently, the HFR is cooled by ram air in the ram air cooler (RC) before returning to the fuel tank. The configuration of the middle fuel return branch (MFRB) and recirculation fuel supply branch (RFSB) in Figure 2 can significantly enhance the heat dissipation capability of the TMFP, thereby mitigating the risk of thermal failure for the AFTMS [27]. Specifically, V2 regulates a portion of the HFR to the plane before the OH (,
) to raise the temperature of the combustion fuel, thereby increasing the waste heat dissipated through combustion. Furthermore, V3 regulates a portion of the HFR to the inlet of the FP (,
) to raise the overall fuel temperature within the TMFP, thereby augmenting the heat dissipation power of the ram air () under the increase of
, since more HFR flows into the RC.
In addition, the temperature of the fuel tank () may rise when the HFR carries back some waste heat from the TMFP to the fuel tank. To ensure the thermal safety of the AFTMS, four typical temperature thresholds are established by considering the fuel coking risk and the system’s cooling requirements. The corresponding temperature limit points include
, the outlet fuel temperature of the AH (), the outlet fuel temperature of the BH (), and the outlet fuel temperature of the RC (). Their respective temperature limit values, denoted as
,
,
and
, are listed in Table 1 [26,27,30].

Table 1.
List of temperature limit values in the AFTMS.
2.2. Simulation Model
In this paper, the same modeling method described in References [26,27] is employed for the flow and heat transfer calculations in the AFTMS. The accuracy and effectiveness of this method have been validated through experiments [31], demonstrating its suitability for the thermal analysis of the AFTMS across various architectures. In addition, the simulation of the AFTMS is implemented using the Python 3.9 language, with minimal residuals ensuring the rigorous convergence of the system’s equations. It is assumed that the changes in fuel mechanical energy result in minor variations in fuel temperature, which can be neglected in comparison to the effects of heat loads. Therefore, internal energy is utilized for thermal management calculations here [26]. This assumption is effective in assessing flight endurance, despite the potential for small errors. However, when focusing on accurate temperature predictions in the future, the impact of mechanical energy changes on fuel temperature should be further refined. The governing equations for the fuel tank can be derived based on the principles of mass and energy conservation, assuming a uniformly distributed
:
where
is the fuel mass in the fuel tank,
is the time,
is the fuel mass flow rate out of the fuel tank,
is the specific internal energy of the fuel, which is a function of the fuel temperature ().
In the fuel supply line, the fuel is heated by the FP and heaters, and the variation of
can be uniformly described by the following equation:
where
is the increase in
,
is the fuel mass flow rate,
is the heating power, which can be the heat loads from the FP (), the airborne equipment (),
or
.
When the fluid passes through the pump, a portion of the input work is converted into the fluid’s internal energy due to mechanical losses, reflecting the heating effect of the pump on the fluid. To quantify this process,
is determined by [32]
where
and
are the overall efficiency and total pressure rise in the pump,
is the volume flow rate.
After acquiring
, the fuel temperature can be derived from the corresponding relationship between
and
. The variation of
in the RC can also be calculated based on Equation (3), while
is replaced by
. In this study, the RC is designed as a counterflow, in-line tube bundle heat exchanger, with the fuel flowing inside the tubes and the ram air flowing across the external surfaces of the tubes. The expression for the calculation of
is [33]
where
is the overall heat transfer coefficient (HTC),
is the heat transfer area,
is the logarithmic mean temperature difference (LMTD).
In addition, to obtain an accurate value of
, the determination of
in Equation (5) is given by the following classical convective heat transfer correlations for the internal [34,35] and external [36] surfaces of the tubes:
where
,
and
are the Nusselt number, Reynolds number and Prandtl number, respectively, the subscripts “f” and “ra” represent the fuel and ram air, respectively,
is the tube length,
is the tube inner diameter,
is the Darcy friction factor, obtained from the Konakov formula [37]. Here, the complex correction terms for flow and heat transfer are omitted, as this study focuses on assessing flight endurance from a system perspective rather than the performance of the heat exchanger. Moreover, this approach leads to only minor errors in the calculations of flight endurance.
At the flow path junctions within the AFTMS, the conservation of mass and energy must be satisfied:
where the subscripts “in” and “out” represent the inflow and outflow at the junction point, respectively.
It should be noted that the above component models within the TMFP neglect the transient thermal effects induced by the heat capacities of both the fluid and the solid, employing a quasi-steady state assumption. In this case, the temperature response delay is eliminated. This assumption is highly suitable for slow temperature variations, but it may lead to inaccuracies in predicting rapid temperature responses. Nevertheless, since the rapid phase transitions constitute only a quite small portion of the entire flight time, this modeling approach remains effective for the assessment of flight endurance.
The component parameters of the AFTMS used in this paper are listed in Table 2, where
and
are, respectively, the numbers of transversely and longitudinally arranged tubes in the RC,
,
,
and
represent the inner diameter, outer diameter and length of a single tube, as well as the tube pitch in the tube bundle, respectively. These values are selected based on practical engineering data, ensuring sufficient cooling of the HFR by the ram air. Here, the selected fuel is JP-8 aviation kerosene, the RC is made of stainless steel, the ram air is regarded as dry air, with their thermophysical properties sourced from References [38,39,40].

Table 2.
List of component parameters in the AFTMS.
A standard condition is established for subsequent analysis based on the typical cruise phase of an aircraft, and the specific operating parameters for this condition are listed in Table 3, where
and
are the flight altitude and Mach number, respectively,
is the engine thrust,
,
and
are the incoming mass flow rate, temperature and pressure of the ram air into the RC, respectively [26,41]. Here, the engine performance is matched with the thrust requirement of the aircraft, and the designed high-pressure shaft speed (
) is 87% during cruising ().

Table 3.
List of operating parameters for the standard condition.
The simulation of engine performance is conducted using the aero-engine thermal management simulation software developed by Nanjing University of Aeronautics and Astronautics (NUAA), abbreviated as ATMSS 1.0. As shown in Figure 3, this software employs detailed component models, and the calculation results demonstrate a high degree of consistency with those obtained from the commercial software GasTurb 11, with a maximum deviation of 3.5% [22]. In addition, this simulation platform has been validated for accuracy through extensive experiments [42]. In addition, the accuracy of the fuel consumption calculations for the engine performance model employed in this paper is further validated, as detailed in Appendix A. In the engine model, external airflow is initially drawn into the inlet by the fan and divided into bypass and core flows. The core flow is then further pressurized by the compressor and undergoes a combustion reaction with the fuel in the combustor. Subsequently, the core gas sequentially impacts the HPT and low-pressure turbine (LPT) to provide input work for the compressor and fan, respectively. Next, the core gas mixes with the bypass flow in the mixer and undergoes further combustion in the afterburner. Finally, the total gas is expelled at the nozzle with high velocity, thereby generating thrust. In this study, the afterburner is closed, since the calculations are performed based on the cruise state of the aircraft.
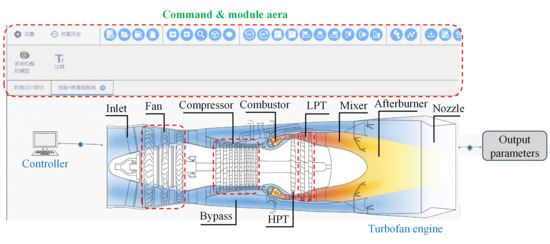
Figure 3.
Interface of the engine integrated thermal management software.
To quantitatively assess the impact of fuel cooling on the fuel consumption rate in the FCACC scheme, the TTC model described in Reference [22] is adopted in this paper, and its accuracy has been experimentally validated, with relative errors below 10%. The detailed calculation process of the TTC is illustrated in Figure 4. Figure 4a demonstrates the application of the FCACC scheme in the HPT. During the cruise phase, both the blade and rotor on the shaft, along with the shroud, undergo mechanical and thermal deformations, resulting in a large TTC size (
) due to excessive deformation of the shroud, which reduces the efficiency of the HPT (). In this case, it is essential to cool the shroud using bleed air to decrease its deformation. Additionally, the utilization of the fuel heat sink enhances the bleed air’s ability to maintain the TTC within appropriate sizes, thereby reducing fuel consumption by improving turbine performance. The governing equations for various deformations can be found in Reference [22]. Figure 4b provides the parameter transfer mode between the TTC model and the engine model, which is embedded in the integrated thermal management simulation platform depicted in Figure 3. Moreover, the relationship between
and
is derived from practical engineering data.

Figure 4.
Schematic diagram of the TTC model and the corresponding parameter transfer mode. (a) TTC model. (b) Parameter transfer mode.
After calculation, the variations of
,
and
with
under the standard condition are depicted in Figure 5, where the thrust requirement of the aircraft is consistently satisfied.
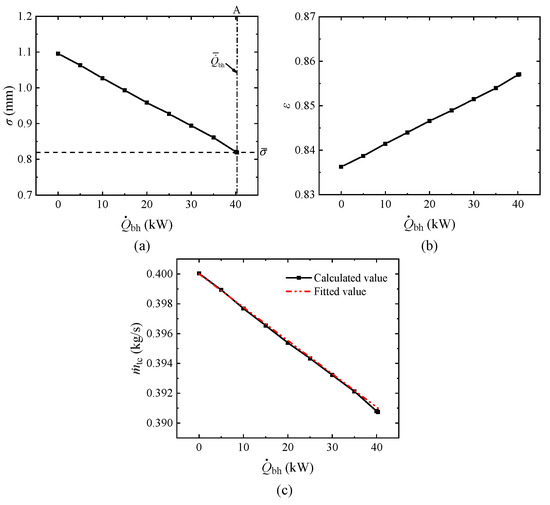
Figure 5.
Variations of
,
and
with
under the standard condition. (a) The size of TTC. (b) HPT efficiency. (c) Mass flow rate of the combustion fuel.
It can be seen from Figure 5a that
decreases as
increases in a specific operating state (constant
), thereby increasing
and further reducing
, as shown in Figure 5b,c. In addition, a linear relationship can be observed between
and
. To facilitate subsequent calculations, the following equation (corresponding to the fitted values in Figure 5c) is adopted through fitting for the standard condition, demonstrating good consistency with the calculated values:
For engine safety, there exists a minimum limit for
() during flight, which corresponds to a maximum limit for
() under a certain condition. Figure 5a indicates that the safety boundary of the HPT is reached at point A under the standard condition, and
is 40.3 kW in this case. Note that
is only influenced by
,
and
for a given engine. Subsequently,
is regarded as an independent control variable of the FCACC scheme to regulate fuel heat sink utilization in this paper, which varies within the range of
.
2.3. Temperature Control
As previously mentioned, multiple temperature limit points are established within the AFTMS. Additionally, there exist three temperature control parameters in Figure 2:
,
and
, which are regulated by the rotational speed of the FP and the opening ratios of V2 and V3, respectively. The current primary objective is to determine the optimal combination of these temperature control parameters to ensure that the AFTMS operates under efficient thermal management. To evaluate the cooling capability of the fuel in the fuel tank, Yang et al. [27] introduced the concept of fuel heat sink capacity (FHSC,
), defined as the maximum amount of heat that the fuel in the fuel tank can safely absorb, and its expression is
where
is the fuel coking temperature, equivalent to
.
In addition, the concept of fuel heat sink consumption rate (FHSCR,
) is also proposed to quantify the amount of fuel heat sink consumed in the fuel tank per second [27], which is equivalent to the negative of the change rate for
. The expression of
for the AFTMS in Figure 2 is given by
The first term on the right side of Equation (12) represents the consumption rate of fuel heat sink due to the combustion process, denoted as
, which is inevitable. Additionally, the second and third terms stand for the consumption rate and recovery rate of fuel heat sink caused by heat loads and the heat dissipation process, respectively, where
is the waste heat dissipation power through the combustion fuel, denoted as
. Under the effect of variable speed,
constitutes only a quite small portion of the system’s heat loads, which has a minimal impact on thermal management analysis.
Evidently, a larger
corresponds to more robust thermal management performance. Therefore, the combination of temperature control parameters that minimizes
while maintaining thermal safety is deemed optimal for the TMFP. This optimization problem can be formulated as follows under multiple constraints:
where
is the fuel flow upper limit of the FP, set as 3 kg/s [27].
Then, a solving algorithm for Equations (13)–(20) is developed based on the influence pattern of temperature control parameters in the TMFP on
, as illustrated in Figure 6. Since
monotonically decreases with the increase in both
and
[27], their individual maximum values are chosen as the optimal solution for a specific
. In this case,
becomes the sole independent variable influencing
under the optimal
and
. After obtaining the variation of
with
, a graphical method is employed to determine
that minimizes
. Note that if there are multiple values of
corresponding to the minimum
in some cases, the maximum value among them is selected as the optimal solution. This solving algorithm is applicable to the TMFP without temperature response delay, and it can be further improved to address the rapid phase transitions in practical engineering. Additionally, when focusing on the accuracy of temperature control during rapid variations in the future, it is necessary to refine the transient thermal effects of the components described in Section 2.2, particularly the thermal response characteristics of the heat exchanger.
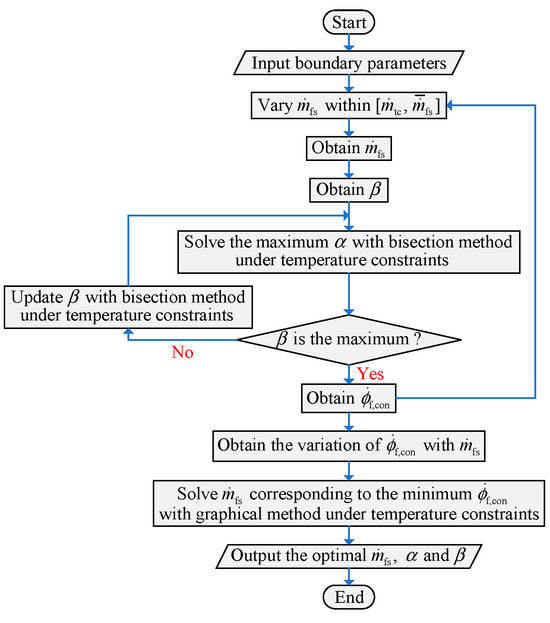
Figure 6.
Flow chart of the solving algorithm for the optimal
,
and
.
3. Results and Discussion
3.1. Extension of Flight Endurance
The simulation models and temperature control strategy described in Section 2 are used for the subsequent calculations of flow and heat transfer in the AFTMS, where
is defined as the minimum available fuel capacity in the fuel tank. Meanwhile, as previously mentioned, flight endurance is determined by the following two failure modes:
In this subsection, the mechanism of the FCACC scheme in extending flight endurance will be elucidated in detail through illustrative examples. Firstly, the flight endurance under the standard condition is considered, and the initial state of the fuel tank in Figure 2 is set as:
and
, where the subscript “0” represents the initial value. Here, the aircraft is designed to maintain continuous flight for 2497 s during the cruise phase, with a fuel consumption rate of 0.4 kg/s. A comparative calculation of the AFTMS is conducted between the scenarios without FCACC () and with FCACC () under the standard condition, and the results are illustrated in Figure 7, where
is the flight endurance, the subscripts “wt” and “w” denote the scenarios without and with FCACC, respectively.
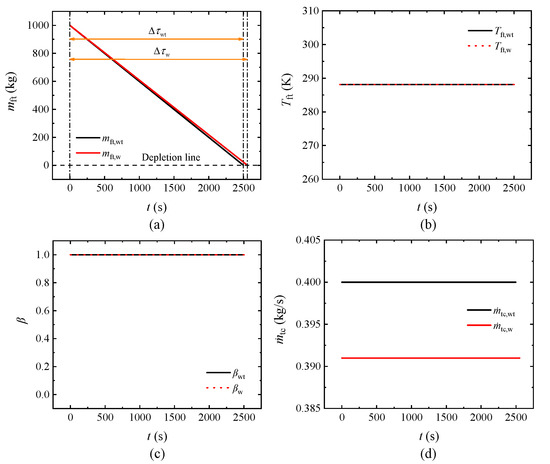
Figure 7.
Comparison results between the two scenarios under the standard condition. (a) Fuel mass in the fuel tank. (b) Fuel temperature in the fuel tank. (c) Mass flow rate ratio of V3. (d) Mass flow rate of the combustion fuel.
Figure 7a indicates that
decreases more slowly than
with
due to the smaller
shown in Figure 7d, where the linear trends are determined by the unchanged
, thereby the occurrence of fuel depletion is delayed in the FCACC scheme. After calculation,
is only 2497 s while
is extended to 2554 s, which means that flight endurance can be extended by 2.28% through FCACC under the standard condition. This example demonstrates the role of FCACC in enhancing the fuel supply capability of the fuel tank by reducing the engine fuel consumption rate, which is effective in extending flight endurance limited by fuel depletion failure. It should be noted that the proximity of the two lines in Figure 7a is attributed to the relatively small percentage decrease of
compared to
, specifically 2.25%. Although this improvement seems minor, it represents a significant advancement in the field of engine optimization. Furthermore, it can be seen from Figure 7b that both
and
remain at
during the entire flight. The reason for this phenomenon is that both
and
are kept at 1, as shown in Figure 7c, meaning that no HFR actually flows into the fuel tank to mix with the cold fuel in either scenario. This condition is referred to as the full recirculation state (FRS) of the TMFP. Therefore, the utilization of the fuel heat sink in FCACC has no effect on
once the TMFP is in the FRS.
Next, a comparison of thermal management performance is conducted. The variations of
and
with
under the two scenarios are calculated, and the results are depicted in Figure 8.
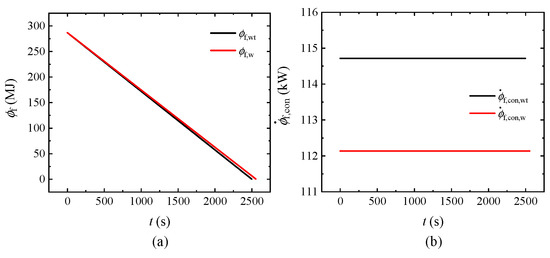
Figure 8.
Comparison results of fuel heat sink under the standard condition. (a) Fuel heat sink capacity. (b) Consumption rate of fuel heat sink.
Figure 8a reveals that
also decreases more slowly than
with
during the whole flight, which is attributed to the smaller
in Figure 8b. Also, the linear characteristic of
with
here is caused by the unchanged
. To explain the variation mechanism of fuel heat sink consumption, it can be inferred that the second and third terms in Equation (12) cancel each other out in the FRS, resulting in that
equals to
. Consequently, the smaller
in Figure 7d induces a smaller
when
equals to
due to the reduction in
. As a result, the saved fuel through FCACC in the FRS also possesses the potential to improve the system’s thermal management performance, which can delay the occurrence of thermal failure under conditions with extreme heat loads. Similarly,
is close to
here due to the relatively small change in
.
It is important to note that the fuel heat sink conservation capability of the FCACC scheme under the standard condition benefits from the superior thermal management performance of the RFSB. To demonstrate this function, a comparative calculation without the RFSB () is conducted using the same initial and boundary parameters as those in Figure 7, and the results are illustrated in Figure 9.
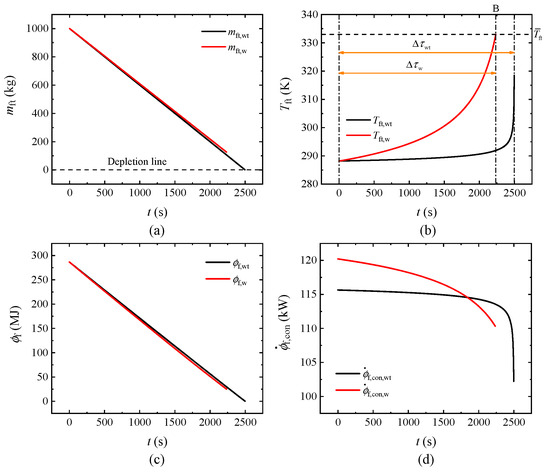
Figure 9.
Comparison results under the standard condition without the RFSB. (a) Fuel mass in the fuel tank. (b) Fuel temperature in the fuel tank. (c) Fuel heat sink capacity. (d) Consumption rate of fuel heat sink.
Similarly, Figure 9a indicates that
decreases more slowly than
with
due to the reduced combustion fuel flow. However, after implementing the FCACC scheme, the amount of waste heat carried back to the fuel tank by the HFR increases significantly, leading to a faster rise in
compared to
with
, as shown in Figure 9b. This process increases
and accelerates the consumption of the fuel heat sink in the fuel tank, as illustrated in Figure 9c,d, leading to the disappearance of the fuel heat sink saving effect of FCACC under the standard condition. Here,
remains close to
, as a portion of the introduced
is dissipated through ram air, without inducing a significant increase in
. In this case,
rises to
at point B in Figure 9b, triggering a thermal failure in the AFTMS. In contrast, the flight of the system without FCACC ends with fuel depletion. After calculation,
is still 2497 s, while
is shortened to 2234 s due to thermal failure, resulting in a reduction in flight endurance by 10.53%. This example highlights the importance of incorporating the RFSB into the FCACC scheme, as it provides robust support for mitigating the detrimental impact of fuel/bleed air heat exchange on the system’s thermal management performance. The configuration of the RFSB enables the enhancement of both fuel supply capability and fuel thermal management capability, which keeps active in the subsequent discussion.
Subsequently, an example is provided to exhibit the extension of flight endurance through the thermal management capability enhancement in the FCACC scheme. This example considers an extreme flight mission, as outlined in Table 4, which comprises three flight phases. The aircraft operates under the standard condition during the cruise phase, with only
varying compared to the standard condition during other two phases. The egress cruise phase represents the process during which the aircraft exits the combat zone and re-enters a cruise state, as mentioned in Reference [26]. In the high-power combat phase,
increases significantly on account of the activation of all airborne weapons. Conversely,
in the egress cruise phase decreases slightly because of the shutdown of some airborne equipment. Likewise, a comparative calculation of the AFTMS is carried out for scenarios without and with FCACC under the extreme mission. Here, the values of
for each phase are set based on the overall performance of the AFTMS, and the initial sate of the fuel tank is consistent with that in Figure 7.

Table 4.
List of operating parameters for the extreme mission.
The comparison results under the extreme mission are illustrated in Figure 10. Note that since the calculation results for both scenarios during the cruise phase are identical to those in Figure 7 and Figure 8, they are not displayed in Figure 10 for brevity.
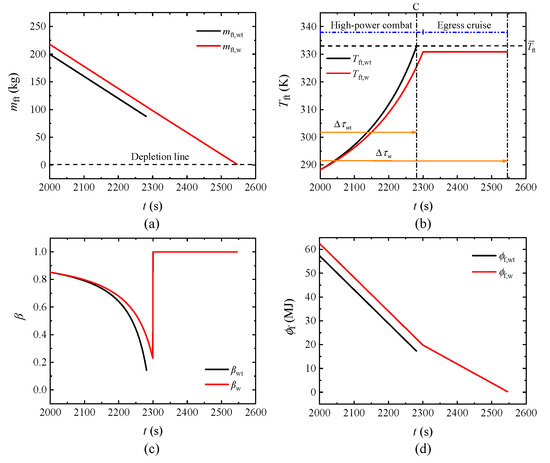
Figure 10.
Comparison results between the two scenarios under the extreme mission. (a) Fuel mass in the fuel tank. (b) Fuel temperature in the fuel tank. (c) Mass flow rate ratio of V3. (d) Fuel heat sink capacity.
Figure 10a shows that
is larger than
at the end of the cruise phase under the effect of FCACC, thereby
in Figure 10d is larger than
due to the constant
at the end of the cruise phase, which enhances the system’s capability to withstand subsequent extreme heat loads. Once the aircraft enters the high-power combat phase, both
and
exhibit a congruent rate of decline because
. In addition, it can be observed from Figure 10b,c that the FRS of the TMFP is disrupted for both scenarios during this phase, transitioning into the partial recirculation state (PRS), which corresponds to
, thereby leading to a rapid rise in
with
under the effect of the HFR that flows back to the fuel tank. For the system without FCACC,
reaches
at point C in Figure 10b, resulting in thermal failure during the high-power combat phase, thereby
is 2281 s in this case. However, since the system with FCACC owns more fuel heat sink at the beginning of the high-power combat phase,
rises more slowly than
in this phase, effectively managing the extreme heat loads and avoiding thermal failure. Furthermore, the TMFP re-enters the FRS in the egress cruise phase, allowing the aircraft to continue flying normally until the fuel in the fuel tank is depleted. Under the FCACC scheme,
is extended to 2546 s, which is 11.62% longer than
. Through this example, the conserved fuel heat sink in the FCACC scheme proves to be highly effective in extending flight endurance constrained by thermal failure.
3.2. Dynamic Regulation Strategy
Section 3.1 demonstrates that employing the FCACC scheme while maintaining the TMFP in the FRS can not only enhance the fuel supply capability of the fuel tank (saving the fuel), but also improve the system’s thermal management performance (saving the fuel heat sink), thereby effectively extending flight endurance. Now, an important issue appears that when the TMFP is on the verge of transitioning into the PRS and
has not reached
, whether it is necessary to further utilize the fuel heat sink to cool the bleed air by increasing
to improve engine performance, thereby reducing fuel consumption. Evidently, further increasing
in this case is beneficial for delaying fuel depletion, but may compromise the system’s thermal management performance once the TMFP enters the PRS, as some waste heat is carried into the fuel tank by the HFR, which can promote thermal failure. Consequently, it is essential to establish a dynamic regulation strategy for
in the FCACC scheme to maximize flight endurance while ensuring the aircraft’s thermal safety, and the trade-off between the fuel capacity and the fuel heat sink capacity in determining flight endurance will be discussed in this subsection.
Here, calculations are performed under a low-power combat phase, and its operating parameters are identical to those of the standard condition in Table 3 except for
, which increases to 130 kW. In addition, the same initial state of the fuel tank as that in Figure 7 is selected as well. By varying
from 0 kW to
, the flight endurance under different levels of fuel heat sink utilization in the FCACC scheme can be obtained, and the calculation results are illustrated in Figure 11, where the subscript “e” represents the endpoint of the flight endurance.
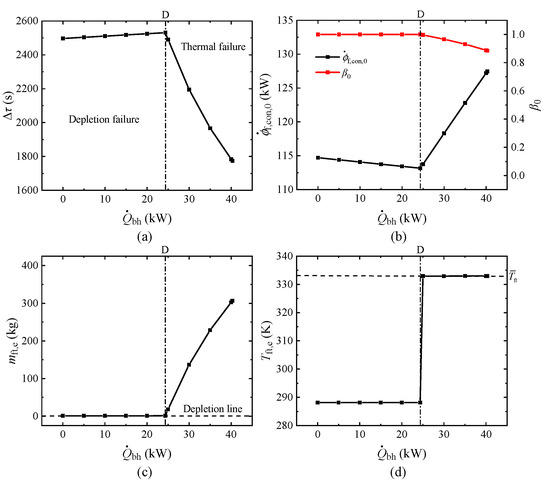
Figure 11.
Variations in system parameters with
under the low-power combat phase. (a) Flight endurance. (b) Initial consumption rate of fuel heat sink and mass flow rate ratio of V3. (c) Fuel mass in the fuel tank at the end of the flight. (d) Fuel temperature in the fuel tank at the end of the flight.
Figure 11a exhibits that
initially increases and then rapidly decreases with the increase of
, indicating the existence of an optimal
() that maximizes
at point D, which represents the transition point from depletion failure to thermal failure. The reason for this phenomenon lies in the different failure modes at the endpoint of the flight. It can be detected from Figure 11b,c that the TMFP remains in the FRS throughout the flight to the left of point D, thereby the flight ends with fuel depletion. In this case, the increase in
leads to a reduction in
, thereby extending
. However, the TMFP transitions into the PRS to the right of point D, where the HFR flowing into the fuel tank causes
to increase as
increases, leading to the flight ending with system overtemperature, as shown in Figure 11d. In this case, thermal failure makes a portion of the hot fuel left in the fuel tank at the end of the flight, ultimately shortening
due to the waste of available fuel for continuous flight, even though the larger
has reduced fuel consumption. Therefore, extending
by enhancing engine performance at the expense of the thermal management performance of the AFTMS is not feasible. Specifically, the implementation of the FCACC scheme should avoid the TMFP transitioning from the FRS to the PRS under the action of fuel heat sink utilization. Furthermore, it can be inferred that extending flight endurance through the implementation of the FCACC scheme necessitates that the TMFP possesses the capability to further dissipate additional heat loads while maintaining operations in the FRS. This premise is commonly satisfied under typical system parameters in practical engineering, as the optimized TMFP architecture exhibits superior heat dissipation performance. However, it should be noted that the effectiveness of FCACC may disappear under extreme parameters, such as excessively low
in the RC or excessively high
.
Based on the preceding analysis, it can be concluded that
corresponds to the critical
() that makes the TMFP enter into the PRS if
. Therefore,
plays a crucial role in the regulation of the fuel heat sink utilization for FCACC. Subsequently, the influence of boundary parameters on
is explored using the standard condition with a moment that
(a typical system initial temperature) as a baseline, and the calculation results are depicted in Figure 12.
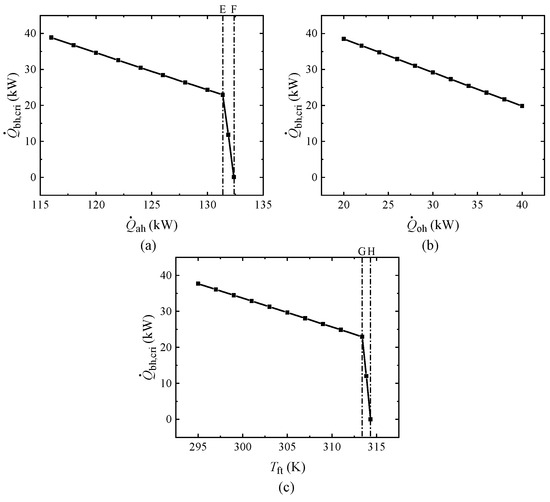
Figure 12.
Variations of
with boundary parameters under the baseline. (a) With airborne heat load (b) With lubricating oil heat load (c) With fuel temperature in the fuel tank.
Figure 12a,b reveal the variations of
with the system’s heat loads, where the increase in both
and
results in a decrease in
. Meanwhile, it can be seen from Figure 12c that
also decreases with the rise of
. In addition,
exhibits a linear variation tendency with all three boundary parameters in the early stages. This is because the terms that correspond to the heat loads and heat dissipation in Equation (12) are equal in the critical state (a characteristic of the FRS), and changes in the three boundary parameters only lead to significant linear variations in
,
and
(approximate), respectively, thereby determining the change features of
. However, this linear trend ceases at points E and G for
and
, respectively, as
reaches 1. In this case, the critical state of the TMFP can only be maintained by increasing
as
and
continue to increase, which is achieved through the rapid decrease of
, since the variation of
no longer directly affects the HFR. Moreover,
decreases to 0 at points F and H, respectively. In contrast, the increase of
slightly decreases
, preventing it from reaching 1, thereby consistently keeping the linear trend.
It should be noted that
may not exist within the range of
when the system’s heat loads are extremely low or high in some cases, which should be prejudged before solving the critical value. Up to now, an efficient dynamic regulation strategy for
in the FCACC scheme to determine
under any operating conditions can be established after adding the above constraints, as illustrated in Figure 13, and
is always set to
during flight. The most significant advantage of this dynamic regulation strategy lies in that it can sufficiently save the fuel while also improving the system’s thermal management performance. In this case, for any moment during flight, the extension of
is always optimized regardless of any operating conditions that arise in the future, which means that it is universally beneficial for the FCACC scheme. In the next subsection, its application effectiveness will be demonstrated.
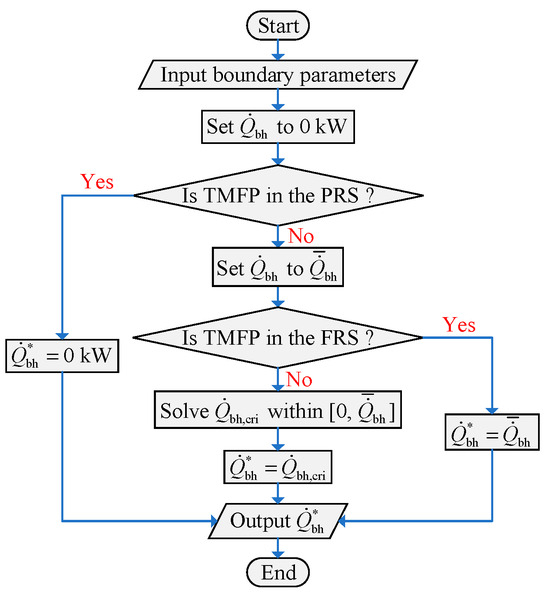
Figure 13.
Flow chart of determining
for a certain condition.
3.3. Reduction in Takeoff Weight
As flight endurance can be extended for a given fuel capacity through FCACC based on the above discussion, the amount of fuel required to be carried by the aircraft can also be reduced for a given flight mission. Consequently, the role of the FCACC scheme in reducing the takeoff weight of the aircraft will be discussed in this subsection. Firstly, a common mission is considered for the subsequent calculations, as outlined in Table 5, and the boundary parameters for each phase have been introduced previously. In addition, the same initial state of the fuel tank as that in Figure 7 and the dynamic regulation strategy in Section 3.2 are employed here.

Table 5.
List of operating parameters for the common mission.
Then, comparative calculations between the scenarios without and with FCACC under the common mission are carried out, and the results are illustrated in Figure 14.
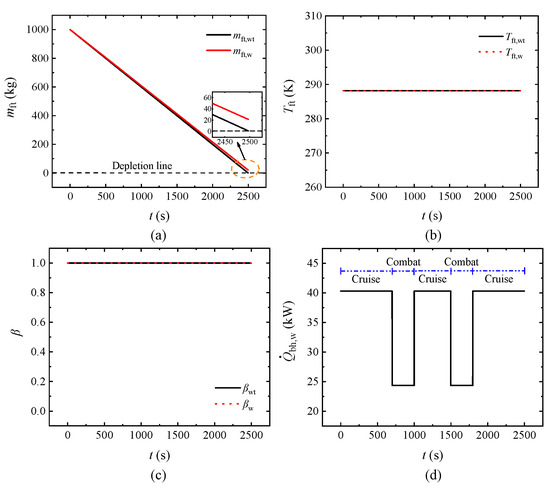
Figure 14.
Comparison results between the two scenarios under the common mission. (a) Fuel mass in the fuel tank. (b) Fuel temperature in the fuel tank. (c) Mass flow rate ratio of V3. (d) Bleed air heat load.
Figure 14a demonstrates that
decreases to
at the end of the common mission, while there is still a portion of fuel left in the fuel tank at the same point after implementing FCACC. Moreover, Figure 14b,c indicate that the TMFP operates in the FRS in both scenarios, thereby no HFR flows back to the fuel tank and
remains at its initial value all the time. Thus, the left fuel in the fuel tank can be directly removed at the beginning of the flight for the FCACC scheme, while the aircraft can still normally complete the whole flight mission in this case. After calculation, the FCACC scheme can reduce the aircraft’s takeoff weight by 20.33 kg through saving the fuel, which accounts for 2.03% of
, allowing the aircraft to carry additional heat sinks, equipment and weapons for more complex missions. It is worth mentioning that Figure 14d displays the effectiveness of the dynamic regulation strategy proposed in this paper for the fuel heat sink utilization in the FCACC scheme, which provides
for dynamically regulating
in different phases under the common mission, and
is 24.34 kW during the low-power combat phase.
From the above examples, it can be theoretically inferred that as long as the fuel/bleed air heat exchange process in the FCACC scheme is activated under the dynamic regulation strategy during flight (), both the aforementioned extension of flight endurance and reduction in takeoff weight are applicable and effective. These benefits are not constrained by the complexity of operating conditions or mission profiles.
4. Conclusions
To better extend the aircraft’s flight endurance through FCACC, its mechanism of action and the impact of fuel heat sink utilization on the overall performance of the AFTMS, especially the thermal management capability, are comprehensively analyzed in this paper. The main conclusions are as follows:
- (1)
- When the TMFP operates in the FRS, cooling the bleed air with fuel not only reduces fuel consumption, but also preserves the system’s fuel heat sink, which benefits from the superior thermal management capability of the RFSB. In this case, flight endurance can be effectively extended, regardless of whether the flight ends with fuel depletion or fuel overtemperature. Calculation results indicate that the flight endurance under the standard condition and extreme mission can be extended by 2.28% and 11.62% through FCACC, respectively.
- (2)
- Once the TMFP enters the PRS, further using fuel to cool the bleed air is harmful to the system’s thermal management performance, despite a reduction in engine fuel consumption. In this case, thermal failure dominates over the limitation of flight endurance, resulting in shorter flight endurance. Therefore, there exists an optimal utilization level of fuel heat sink that maximizes flight endurance, which should be set as the critical value that transitions the TMFP from the FRS to the PRS if possible. Additionally, calculation results demonstrate that the critical fuel/bleed air heat exchange rate decreases as heat loads and fuel tank temperature increase. Furthermore, an efficient dynamic regulation strategy for fuel heat sink utilization is developed to extend flight endurance while ensuring thermal safety, displaying universal effectiveness across various operating conditions. The theoretical analytical approach regarding the trade-off between fuel supply capability and thermal management capability in determining flight endurance is also applicable to the regulation processes of other schemes that aim to reduce engine fuel consumption by utilizing fuel heat sink or at the expense of the thermal management capability of the TMFP.
- (3)
- The implementation of the FCACC scheme has the potential to reduce the required fuel capacity of the aircraft under a specific mission. Taking the common mission as an example, calculation results reveal that the required fuel mass can be reduced by 20.33 kg through FCACC, effectively decreasing the takeoff weight. This function also provides the possibility for high-performance aircraft to carry more heat sinks and equipment. At the current stage, the assessment of the dynamic regulation effects of FCACC is limited to theoretical analysis under high-fidelity models. In the future, relevant experimental verification will be carried out.
Author Contributions
Conceptualization, S.Y. and W.G.; Data curation, W.G., Y.L. and B.S.; Formal analysis, X.L.; Funding acquisition, X.X., X.L. and B.S.; Investigation, S.Y., W.G. and Y.L.; Methodology, S.Y., W.G. and X.X.; Project administration, X.X., X.L. and B.S.; Resources, X.L. and B.S.; Software, S.Y., W.G., Y.L. and X.X.; Supervision, X.X., X.L. and B.S.; Validation, W.G. and Y.L.; Visualization, S.Y. and Y.L.; Writing—original draft, S.Y.; Writing—review and editing, X.L. All authors have read and agreed to the published version of the manuscript.
Funding
This work is supported by Tsinghua University Initiative Scientific Research Program (20244186002) and National Science and Technology Major Project of China (2019-III-0001-0044).
Data Availability Statement
The original contributions presented in this study are included in the article. Further inquiries can be directed to the corresponding authors.
Conflicts of Interest
The authors declare no conflicts of interest.
Nomenclature
| Heat transfer area, m2 | |
| Diameter, m | |
| Darcy friction factor | |
| Thrust, N | |
| Altitude, m | |
| Overall heat transfer coefficient, W/(m2·K) | |
| Length, m | |
| Mass, kg | |
| Mass flow rate, kg/s | |
| Limit value of mass flow rate, kg/s | |
| Mach number | |
| Rotational speed, % | |
| Number | |
| Nusselt number | |
| Pressure, Pa | |
| Total pressure difference in the pump, Pa | |
| Prandtl number | |
| Heat transfer rate, W | |
| Limit value of heat transfer rate, W | |
| Reynolds number | |
| Time, s | |
| Temperature, K | |
| Limit value of temperature, K | |
| Temperature difference, K | |
| Specific internal energy, J/kg | |
| Specific internal energy difference, J/kg | |
| Volume flow rate, m3/s | |
| Abbreviations | |
| ACC | Active clearance control |
| AFTMS | Aircraft fuel thermal management system |
| AH | Airborne heater |
| ATMSS | Aero-engine thermal management simulation software |
| BH | Bleed air heater |
| FCACC | Fuel-cooled ACC |
| FHSC | Fuel heat sink capacity |
| FHSCR | Fuel heat sink consumption rate |
| FP | Fuel pump |
| FRS | Full recirculation state |
| HFR | Hot fuel return |
| HPT | High-pressure turbine |
| HTC | Heat transfer coefficient |
| LMTD | Logarithmic mean temperature difference |
| LPT | Low-pressure turbine |
| MFRB | Middle fuel return branch |
| NUAA | Nanjing University of Aeronautics and Astronautics |
| OH | Oil heater |
| PCC | Passive clearance control |
| PRS | Partial recirculation state |
| RC | Ram air cooler |
| RFSB | Recirculation fuel supply branch |
| SFC | Specific fuel consumption |
| TMFP | Thermal management flow path |
| TTC | Turbine tip clearance |
| V1–V3 | Fuel flow regulating valves |
| Greek symbols | |
| Mass flow rate ratio | |
| Mass flow rate ratio | |
| Overall efficiency of the pump | |
| Pitch, m | |
| Turbine tip clearance size, m | |
| Limit value of TTC size, m | |
| Turbine efficiency | |
| Heat sink capacity, J | |
| Change rate of heat sink capacity, W | |
| Flight endurance, s | |
| SFC, g/(s·N) | |
| Subscripts | |
| 0 | Initial state |
| ah | Airborne heater |
| bh | Bleed air heater |
| c | Combustion |
| cok | Fuel coking |
| con | Consumption |
| cri | Critical value |
| e | Endpoint |
| f | Fuel |
| fp | Fuel pump |
| fr | Fuel return |
| fs | Fuel supply |
| fs1 | Fuel supply from the fuel tank |
| ft | Fuel tank |
| h | Heating |
| i | Inner |
| in | Inflow |
| lon | Longitudinally arranged |
| m | Mean |
| min | Minimum value |
| o | Outer |
| oh | Oil heater |
| out | Outflow |
| ra | Ram air |
| rc | Ram air cooler |
| s | High-pressure shaft |
| t | Tube |
| tc | To combustor |
| tra | Transversely arranged |
| w | With FCACC |
| wt | Without FCACC |
| Superscripts | |
| com | Combustion |
| * | Optimal value |
Appendix A
The engine performance model employed in this study is further validated under the ground design condition, without the fuel/bleed air heat exchange process. The calculation results of SFC () at different
, obtained using the self-developed ATMSS 1.0 and the commercial software GasTurb 11, respectively, are illustrated in Figure A1, demonstrating a satisfactory level of consistency. In addition, the absolute values of relative errors for all comparison points are less than 2%, which supports the credibility of the conclusions presented in this paper.
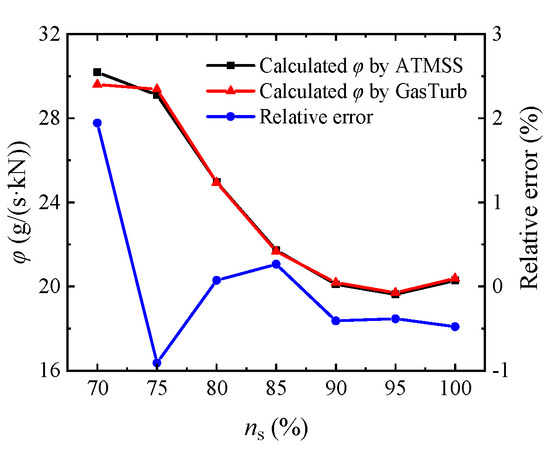
Figure A1.
Comparison results of the variation of
with
under the ground design condition.
References
- Pollock, L.; Wild, G. An examination of high-speed aircraft—Part 1: Past, present, and future. Transp. Eng. 2024, 18, 100290. [Google Scholar] [CrossRef]
- De Marco, A.; D’oNza, P.M.; Manfredi, S. A deep reinforcement learning control approach for high-performance aircraft. Nonlinear Dyn. 2023, 111, 17037–17077. [Google Scholar] [CrossRef]
- Ayar, M.; Karakoc, T.H. Comparison of 5th-generation fighters: Evaluation of trends in military aviation. In New Achievements in Unmanned Systems, ISUDEF 2021, Sustainable Aviation; Springer: Cham, Switzerland, 2023. [Google Scholar] [CrossRef]
- Yang, W. Development of future fighters, Acta Aeronaut. Astronaut. Sin. 2020, 41, 524377. Available online: https://hkxb.buaa.edu.cn/EN/10.7527/S1000-6893.2020.24377 (accessed on accessed on 2 September 2025).
- Jo, B.W.; Majid, T. Enhanced range and endurance evaluation of a camber morphing wing aircraft. Biomimetics 2023, 8, 34. [Google Scholar] [CrossRef]
- Mahadevappa, R.; Virupaksha, T.; Raghavendra, L. A practical approach to enhance the flight endurance of a fixed-wing UAV. In Proceedings of the National Aerospace Propulsion Conference, Lecture Notes in Mechanical Engineering; Springer: Singapore, 2021. [Google Scholar] [CrossRef]
- Andriani, R.; Ingenito, A.; Gamma, F.; Agresta, A. Low-fuel consumption gas turbine engines for extended-range UAVs. In Proceedings of the 52nd Aerospace Sciences Meeting, National Harbor, MD, USA, 13–17 January 2014. [Google Scholar] [CrossRef]
- Guo, H.; Zhang, Y.; Yu, B. Research on optimization technology of minimum specific fuel consumption for triple-bypass variable cycle engine. Aerospace 2025, 12, 10. [Google Scholar] [CrossRef]
- da Fonseca Filho, V.F.; Ribeiro, R.F.G.; Lacava, P.T. Turbofan engine performance optimization based on aircraft cruise thrust level. J. Braz. Soc. Mech. Sci. Eng. 2019, 41, 64. [Google Scholar] [CrossRef]
- Dik, A.; Bitén, N.; Zaccaria, V.; Aslanidou, I.; Kyprianidis, K. Conceptual design of a 3-shaft turbofan engine with reduced fuel consumption for 2025. Energy Procedia 2017, 142, 1728–1735. [Google Scholar] [CrossRef]
- Zeinalpour, M.; Mazaheri, K.; Irannejad, A. Sensitivity analysis of gas turbine fuel consumption with respect to turbine stage efficiency. In Proceedings of the ASME 2012 International Mechanical Engineering Congress and Exposition, Houston, TX, USA, 9–15 November 2012. [Google Scholar] [CrossRef]
- Lattime, S.; Steinetz, B. Turbine engine clearance control systems: Current practices and future directions. In Proceedings of the 38th Joint Propulsion Conference and Exhibit, Indianapolis, IN, USA, 7–10 July 2002. [Google Scholar] [CrossRef]
- Kurzke, J.; Halliwell, I. Propulsion and Power An Exploration of Gas Turbine Performance Modeling; Springer: Cham, Switzerland, 2018. [Google Scholar] [CrossRef]
- Chapman, J.W.; Guo, T.-H.; Kratz, J.L.; Litt, J.S. Integrated turbine tip clearance and gas turbine engine simulation. In Proceedings of the 52nd AIAA/SAE/ASEE Joint Propulsion Conference, Salt Lake City, UT, USA, 25–27 July 2016. [Google Scholar] [CrossRef]
- Wei, J.; Fu, Y.; Zhou, K.; Yang, H.; Zheng, X. A comprehensive study of tip clearance control based on a multidimensional transient clearance prediction approach. In Proceedings of the 2023 Asia-Pacific International Symposium on Aerospace Technology, Lingshui, China, 16–17 October 2023. [Google Scholar] [CrossRef]
- Kratz, J.L.; Chapman, J.W.; Guo, T. A parametric study of actuator requirements for active turbine tip clearance control of a modern high bypass turbofan engine. In Proceedings of the ASME Turbo Expo 2017: Turbomachinery Technical Conference and Exposition, Charlotte, NC, USA, 26–30 June 2017. [Google Scholar] [CrossRef]
- DeCastro, J.; Melcher, K.; Noebe, R. System-level design of a shape memory alloy actuator for active clearance control in the high-pressure turbine. In Proceedings of the 41st AIAA/ASME/SAE/ASEE Joint Propulsion Conference & Exhibit, Tucson, AZ, USA, 10–13 July 2005. [Google Scholar] [CrossRef]
- Jia, B.; Zhang, X.; Hou, Y. Active control of turbine tip clearance by fuzzy parameter self-setting PID algorithms. In Proceedings of the 2012 IEEE International Conference on Automation Science and Engineering, Seoul, Republic of Korea, 20–24 August 2012. [Google Scholar] [CrossRef]
- Guo, X.; Liu, H.; Zhou, Z. Improving the blade tip clearance measurement method based on blade tip timing: Accounting for rotor speed variations and non-uniform blade-by-blade tip clearance. Measurement 2024, 242, 115777. [Google Scholar] [CrossRef]
- Wang, W.; Shao, H.; Shao, X.; Song, K. Investigation on the turbine blade tip clearance measurement and active clearance control based on eddy current pulse-trigger method. In Proceedings of the ASME Turbo Expo 2017: Turbomachinery Technical Conference and Exposition, Charlotte, NC, USA, 26–30 June 2017. [Google Scholar] [CrossRef]
- Sheng, H.; Liu, T.; Zhao, Y.; Chen, Q.; Yin, B.; Huang, R. New model-based method for aero-engine turbine blade tip clearance measurement. Chin. J. Aeronaut. 2022, 36, 128–147. [Google Scholar] [CrossRef]
- Gou, W.; Yang, S.; Lin, Y.; Shao, F.; Liang, X.; Shi, B. Dynamic blade tip clearance control of aero-engine by the integration of cooling air with fuel thermal management system. Appl. Therm. Eng. 2024, 261, 125042. [Google Scholar] [CrossRef]
- van Heerden, A.; Judt, D.; Jafari, S.; Lawson, C.; Nikolaidis, T.; Bosak, D. Aircraft thermal management: Practices, technology, system architectures, future challenges, and opportunities. Prog. Aerosp. Sci. 2022, 128, 100767. [Google Scholar] [CrossRef]
- German, B.J. Tank heating model for aircraft fuel thermal systems with recirculation. J. Propuls. Power 2012, 28, 204–210. [Google Scholar] [CrossRef]
- Li, D.; Hang, J.; Li, Y.; Dong, S. Fuel flowrate control for aeroengine and fuel thermal management for airborne system of aircraft—An overview. Appl. Sci. 2021, 12, 279. [Google Scholar] [CrossRef]
- Doman, D.B. Fuel flow topology and control for extending aircraft thermal endurance. J. Thermophys. Heat Transf. 2018, 32, 35–50. [Google Scholar] [CrossRef]
- Yang, S.; Lin, Y.; Yu, H.; Xu, X.; Liang, X. Thermal management of fuel heat sink in aircraft via flow path optimization. Appl. Therm. Eng. 2024, 246, 122880. [Google Scholar] [CrossRef]
- Yang, S.; Lin, Y.; Xu, X.; Liang, X. Extension of aircraft thermal endurance by multi-return fuel tank system. In Proceedings of the 6th China Aeronautical Science and Technology Conference, Jiaxing, China, 26–27 September 2023. [Google Scholar] [CrossRef]
- Sigthorsson, D.; Oppenheimer, M.W.; Doman, D.B. N-tank thermal management system framework for thermal endurance enhancement. In Proceedings of the AIAA SCITECH 2022 Forum, San Diego, CA, USA, 3–7 January 2022. [Google Scholar] [CrossRef]
- Sigthorsson, D.; Oppenheimer, M.W.; Doman, D.B. Flight endurance enhancement via thermal management system control subject to multiple limitations. In Proceedings of the AIAA Scitech 2020 Forum, Orlando, FL, USA, 6–10 January 2020. [Google Scholar] [CrossRef]
- Huang, G.P.; Doman, D.B.; Rothenberger, M.J.; Hencey, B.; DeSimio, M.P.; Tipton, A.; Sigthorsson, D.O. Dimensional analysis, modeling, and experimental validation of an aircraft fuel thermal management system. J. Thermophys. Heat Transf. 2019, 33, 983–993. [Google Scholar] [CrossRef]
- Sojoudi, A.; Nourbakhsh, A.; Shokouhmand, H. Experimental evaluation of temperature rise in centrifugal pumps at partial flow rates. J. Braz. Soc. Mech. Sci. Eng. 2018, 40, 183. [Google Scholar] [CrossRef]
- Tao, W. Heat Transfer, 5th ed.; Higher Education Press: Beijing, China, 2019. [Google Scholar]
- Sieder, E.N.; Tate, G.E. Heat transfer and pressure drop of liquids in tubes. Ind. Eng. Chem. 1936, 28, 1429–1435. [Google Scholar] [CrossRef]
- Gnielinski, V. New equations for heat and mass transfer in turbulent pipe and channel flow. Int. Chem. Eng. 1976, 16, 359–368. [Google Scholar]
- Žukauskas, A. Heat transfer from tubes in crossflow. Adv. Heat Transf. 1972, 8, 93–160. [Google Scholar] [CrossRef]
- Konakov, P.K. A new correlation for the friction coefficient in smooth tubes. Izv. SSSR 1946, 51, 503–506. [Google Scholar]
- Bruno, T.J.; Huber, M.; Laesecke, A.; Lemmon, E.; McLinden, M.; Outcalt, S.L.; Perkins, R.; Smith, B.L.; Widegren, J.A. Thermodynamic, transport, and chemical properties of reference JP-8. In Proceedings of the NIST Interagency/Internal Report, Gaithersburg, MD, USA, 15 December 2010; Available online: https://tsapps.nist.gov/publication/get_pdf.cfm?pub_id=904848 (accessed on 10 January 2025).
- Mills, K.C. Recommended Values of Thermophysical Properties for Selected Commercial Alloys; Woodhead Publishing: Cambridge, UK, 2002. [Google Scholar]
- Bell, I.H.; Wronski, J.; Quoilin, S.; Lemort, V. Pure and pseudo-pure fluid thermophysical property evaluation and the open-source thermophysical property library CoolProp. Ind. Eng. Chem. Res. 2014, 53, 2498–2508. [Google Scholar] [CrossRef] [PubMed]
- Yang, S.; Gou, W.; Lin, Y.; Xu, X.; Liang, X.; Shi, B. Heat generation analysis of aeroengine fuel system integrated with aircraft thermal management evaluation. Appl. Therm. Eng. 2025, 279, 127571. [Google Scholar] [CrossRef]
- Yang, S.; Gou, W.; Lin, Y.; Xu, X.; Shi, B.; Liang, X. Steady state simulation program of aero-engine thermal management system. In Proceedings of the 6th China Aeronautical Science and Technology Conference, Jiaxing, China, 26–27 September 2023. [Google Scholar] [CrossRef]
Disclaimer/Publisher’s Note: The statements, opinions and data contained in all publications are solely those of the individual author(s) and contributor(s) and not of MDPI and/or the editor(s). MDPI and/or the editor(s) disclaim responsibility for any injury to people or property resulting from any ideas, methods, instructions or products referred to in the content. |
© 2025 by the authors. Licensee MDPI, Basel, Switzerland. This article is an open access article distributed under the terms and conditions of the Creative Commons Attribution (CC BY) license (https://creativecommons.org/licenses/by/4.0/).