Abstract
This study investigates the non-equilibrium radiation characteristics during the high-speed re-entry of a lunar-return-type capsule under rarefied atmospheric conditions. A line-by-line spectral model was developed to compute atomic emission and absorption coefficients for excited nitrogen and oxygen atoms. Coupled with the Direct Simulation Monte Carlo (DSMC) method, the Photon Monte Carlo (PMC) method was employed to solve the radiative energy transport equation. The model was validated against the FIRE II flight experiment at 1631 s and 1634 s, showing improved agreement with experimental heat flux data compared to previous numerical results. A detailed sensitivity analysis was conducted to examine the influence of spectral discretization and the number of emitted photons per computational cell. Results indicate that low spectral resolution can cause non-physical fluctuations in wall heat flux, while increasing the number of photons improves local smoothness. Optimal parameters were identified as 50,000 spectral points and 5000 photons per cell. The model was further applied to a lunar-return-type capsule re-ntering at 90 km and 95 km altitudes. It was found that radiative heating is spatially decoupled from aerodynamic heating and primarily governed by excited species concentration and line-of-sight geometry. At 90 km, radiative heating accounted for over of the aerodynamic heating, more than double that at 95 km. These results underscore the necessity of considering radiation effects in the design of thermal protection systems, particularly at high re-entry velocities and large angles of attack.
1. Introduction
Upon mission completion, spacecraft typically re-enter the atmosphere either in a controlled or uncontrolled manner. Modern high-speed vehicles can reach re-entry speeds approaching Mach 30. As the vehicle descends, atmospheric density increases significantly, and the viscous effects of the gas mixture become more pronounced. In the bow shock region ahead of the vehicle, the gas undergoes extreme compression, leading to a sharp reduction in the local mean free path and an increase in particle collision frequency. The kinetic energy of high-speed particles is rapidly exchanged with internal energy modes—such as rotational, vibrational, and electronic energies—resulting in a steep rise in gas temperature. Under such high-temperature conditions, various chemical reactions are triggered, accompanied by rotational, vibrational, and electronic excitations to higher energy states. The subsequent relaxation of these excited states releases energy, primarily in the form of radiative emission.
During the re-entry of high-speed spacecraft, intense aerodynamic and radiative heating impose severe thermal loads on the thermal protection system (TPS). Prolonged exposure to such high heat flux environments can lead to surface pyrolysis and ablation of the TPS materials [1,2]. The Stardust probe re-entered the Earth’s atmosphere at a speed exceeding the second cosmic velocity, with radiative heat flux at the forebody accounting for more than of the total non-ablative heat load [3,4]. The FIRE-I and FIRE-II missions, launched in 1964 and 1965, respectively, were both equipped with heat flux gauges and radiometers capable of spectrally resolved measurements. In the FIRE-II experiment, the probe re-entered the atmosphere at a velocity of approximately 11.4 km/s. At lower altitudes, radiative heating at the vehicle’s forebody contributed nearly of the total convective–radiative heat flux [5]. Notably, although the re-entry speed of FIRE-II was lower than that of Stardust, its radiative heat contribution was significantly higher. This discrepancy is primarily attributed to the larger nose radius and steeper re-entry angle of the FIRE-II vehicle [6]. Subsequent Apollo missions—Apollo 4 and Apollo 6—were also equipped with radiometers, yielding a wealth of radiation data that continues to be widely referenced in research [7,8]. Cruden conducted arc-heated shock tube experiments at NASA Ames to investigate the spectral characteristics of gas mixtures, including CO2–N2–Ar (Martian atmosphere) and O2–N2 (Earth atmosphere). From these measurements, key parameters such as electron density, rotational temperature, vibrational temperature, and electronic temperature were extracted. The results revealed that under high-speed flow conditions, all these quantities deviate significantly from thermodynamic equilibrium [9].
In the field of radiative modeling under high-speed non-equilibrium conditions, Nicolet was among the first to recognize that gas-phase radiation within the shock layer could significantly influence the shock structure. He incorporated radiation theory into the computation of radiative heating within the shock layer and developed the early radiation solver RAD [10]. Building upon Nicolet’s work, Park, with support from NASA, developed the first version of the NEQAIR code in 1985 [11]. Designed primarily for simulating high-temperature non-equilibrium gas radiation, the initial version of NEQAIR supported only a limited number of species and functionalities. Through continuous development over several decades, NEQAIR has evolved into its current version, NEQAIR-V15, with substantially enhanced capabilities and databases [12,13]. In 1996, the European Plasma Research Center faced an urgent need to establish a radiative prediction tool for planetary re-entry environments. This led to the development of the first-generation PARADE (Plasma Radiation Database) code, which calculates spectral emission and absorption coefficients based on flowfield particle data. With the support of ESA’s “Aurora Programme,” PARADE underwent a major update and was released in 2005 as Version 2, featuring significantly expanded molecular radiation modules [14,15]. In 2009, Perrin introduced the HTGR code [16], which employs a line-by-line method and the Statistical Narrow-Band (SNB) model to perform radiative transfer calculations. The code was used to simulate gas radiation during atmospheric re-entry into both Earth and Mars, establishing a comprehensive gas radiation property database that provided valuable insights for the design of spacecraft thermal protection systems.
In addition to well-established radiation software, several in-house radiation codes have also demonstrated remarkable performance in high-speed rarefied environments. Colonna developed a self-consistent plasma physics model that incorporates non-equilibrium vibrational kinetics, a collisional–radiative model for atomic species, and a Boltzmann solver for the electron energy distribution function, applying it to investigate non-equilibrium phenomena in high-enthalpy flows of Jupiter’s atmosphere [17]. Similarly, Panesi, starting from a traditional CFD framework, constructed a one-dimensional flow solver coupled with a collisional–radiative model to account for non-Boltzmann distributions of atomic and molecular electronic energy levels and successfully applied it to accurately analyze the behavior of electronically excited states in the FIRE II re-entry flight experiment [18].
Radiative heat flux resulting from gas-phase radiation is a critical component in the thermal protection system (TPS) design of re-entry vehicles. When the re-entry velocity exceeds 10 km/s and the vehicle descends to altitudes around 60 km, the bow shock layer ahead of the vehicle becomes highly compressed and heated. Under these extreme conditions, the gas undergoes internal energy excitation, dissociation, and ionization, resulting in substantial radiative energy emission. In the ultraviolet and near-infrared spectral bands, radiative heating can contribute up to approximately of the total convective–radiative heat flux. Notably, over of this radiative energy originates from electronic transitions of atomic nitrogen and oxygen [19,20,21,22].
Motivated by these phenomena, the present study focuses on modeling and analyzing non-equilibrium atomic gas radiation in rarefied flow regimes using the Direct Simulation Monte Carlo (DSMC) method. The goal is to provide a physically accurate and numerically robust foundation for predicting the aerothermal environment and guiding the design of thermal protection systems for lunar-return-type high-speed vehicles.
2. Atomic Electronic Excitation
Traditional internal energy models typically account only for translational, rotational, and vibrational energy modes, while electronic excitation is often neglected. However, in non-equilibrium high-enthalpy flows, such as those encountered during atmospheric re-entry or within shock layers, the effects of electronic excitation become increasingly significant and cannot be ignored. To accurately capture these effects, it is necessary to construct a structured electronic energy level model, which incorporates the number of electronic states, their degeneracies, and the corresponding characteristic excitation temperatures. In this work, guided by the modeling strategies used in quantum kinetic chemistry frameworks [23] and considering the discrete particle nature of the Direct Simulation Monte Carlo (DSMC) method, a discrete-level electronic excitation model is developed to represent energy transitions among atomic electronic states.
At thermodynamic equilibrium, the distribution of electrons among energy levels follows the Boltzmann equation. Each electronic level i is associated with a specific energy and degeneracy .
At an electronic temperature , the population distribution across different electronic states is governed by the Boltzmann law, and the fractional population at level i is given by:
where is the number of particles in level i, n is the total number of particles, is the Boltzmann constant, and is the electronic partition function:
According to the excitation energy , the maximum accessible electronic level J can be determined by comparing the effective excitation temperature corresponding to each level with the effective temperature derived from . Substituting J into the electronic partition function yields:
The electronic excitation of colliding particles follows the Boltzmann distribution. However, due to potentially large differences in probability between energy levels (especially at low temperatures), the cumulative distribution function (CDF) may be difficult to invert directly to obtain level-specific probabilities. As such, the acceptance–rejection method is used, which is suitable when direct sampling from the distribution is impractical. A random number is drawn to select a preliminary excitation level:
Assuming the collisional excitation leads the particle to level j, the corresponding level information is substituted into the following probability density function to obtain the normalized probability for level j:
The obtained probability is then compared with another random number to determine whether level j is accepted. If , the excitation is accepted; otherwise, steps (4) and (5) are repeated until acceptance is achieved. The electronic level information for each species can be referenced from the NIST database [24].
Unlike translational temperature, which can be directly obtained from the linear relation between total kinetic energy and degrees of freedom, the electronic excitation temperature cannot be evaluated in the same way because of the discrete distribution of electronic energy levels. Instead, the concept of the mean electronic excitation energy is introduced as an intermediate quantity.
For each computational cell, the sampled mean electronic excitation energy is calculated statistically as
where N denotes the number of particles of a given species in the cell, and represents the excitation energy of the n-th particle occupying level j.
From a theoretical perspective, the mean electronic excitation energy can be obtained from the Boltzmann distribution, expressed as
where is the degeneracy of level j, is the excitation energy of level j, k is the Boltzmann constant, and is the electronic excitation temperature to be determined.
In practice, the excitation temperature is obtained by iteratively adjusting its value (using, for example, a bisection root-finding method) until the theoretical mean excitation energy matches the sampled value within a prescribed tolerance. This ensures a consistent definition of the electronic excitation temperature in each computational cell.
3. Gas-Phase Chemical Reaction Model with Ionization
During atmospheric entry at velocities approaching 20 Ma, gas particles undergo frequent collisions in the high-temperature, high-energy environment. When the collision energy exceeds the activation energy required for chemical reactions, a series of gas-phase chemical reactions are triggered. These reactions not only change the chemical species and their energy states but also significantly affect the overall energy distribution of the gas.
Without considering ionization, the major atmospheric species are primarily composed of , , , , and . The possible types of chemical reactions include:
Dissociation reactions: A diatomic molecule (e.g., , , ) collides with another particle M (commonly referred to as a “third body” or “catalyst”, such as , , , , or ). If the total collision energy exceeds the activation energy required for dissociation, the following reaction occurs:
The energy consumed in dissociation is converted into the relative translational energy of A and B, as well as the kinetic and internal energy of M.
Exchange reactions: A diatomic molecule (e.g., , , ) collides with an atom C (e.g., or ), possibly resulting in an atom-exchange process:
The total collision energy is redistributed into the translational energy of and B and the internal energy of .
Recombination reactions: Recombination can be regarded as the reverse of dissociation, typically involving a three-body collision mechanism:
The translational energy of A and B, together with the kinetic energy of M, is redistributed to satisfy conservation of energy. Because of their low probability, recombination reactions are often not modeled directly in DSMC but treated as the inverse process of dissociation.
At the initial stage of the flow field, the free-stream gas is primarily composed of and . As the temperature increases, particles undergo high-energy collisions, gradually experiencing dissociation, recombination, and exchange reactions, leading to a system of five species: , , , , and , with 19 primary reaction pathways.
When ionization is included, additional reactions occur:
Associative ionization: At the early stages of ionization, the primary source of free electrons is associative ionization, which does not require high-energy electrons but instead occurs via the interaction of two excited atoms:
Reverse associative ionization: The reverse process involves recombination of an ion with a free electron:
Direct electron-impact ionization: An electron collides with a neutral atom A, and if the collision energy exceeds the ionization threshold, ionization occurs:
Electron-ion recombination: The reverse of direct ionization, where a positive ion recombines with an electron:
Ion-exchange reactions: Ion-charge transfer processes can be represented as:
After ionization, the gas composition expands from the original five species to eleven: , , , , , , , , , , and .
The reaction rates are determined by the Arrhenius-type expression:
where C and n are constants, is the activation energy, is the Boltzmann constant, and T is the reference temperature.
In the DSMC method, chemical reactions occur probabilistically. When the total collision energy satisfies , the reaction probability can be expressed as:
where is the reactive cross section, is the total cross section; is the symmetry factor, with when the reactants A and B are identical, and otherwise; is the average degree of freedom, and is the mean viscosity index of the collision pair .
The gas-phase chemical reaction model employed in this study consists of an 11-species ionized reaction mechanism (Table 1), which includes a total of 41 elementary chemical reactions.

Table 1.
11-species chemical reaction parameters set.
4. Radiative Transfer Equation and Spectral Coefficients
The Radiative Transfer Equation (RTE) describes the transport of radiative energy through a medium, including emission, absorption, and scattering processes. Neglecting scattering, the RTE can be simplified as [25]:
where is the spectral radiative intensity at wavelength , is the emission coefficient representing the radiative power emitted by the medium per unit wavelength, and is the absorption coefficient representing the medium’s ability to absorb radiation per unit length. By examining Equation (18), it can be seen that radiative energy transfer is a process in which energy emitted at a specific wavelength is gradually attenuated by the medium as it propagates. The emission and absorption coefficients are the key parameters controlling this process.
In this work, a line-by-line (LBL) approach is adopted to solve Equation (18), where the emission and absorption coefficients are computed based on known spectral parameters, gas composition, energy level information, and temperature. This method is particularly suitable for high-temperature gaseous radiation modeling, such as combustion or high-speed re-entry radiation heat transfer.
At equilibrium, the spontaneous emission coefficient for a transition from a higher energy level j to a lower level i, corresponding to a spectral line centered at wavelength , is expressed as:
where c is the speed of light, is the Einstein coefficient for spontaneous emission from level j to i, is the number density of particles in level j, and is the line shape function.
Similarly, the spectral absorption coefficient at wavelength is given by:
Here, and are the number densities of energy levels i and j, respectively, and , are the corresponding degeneracies. The line shape function accounts for various broadening mechanisms and is normalized such that .
Two primary types of broadening are typically considered: Doppler broadening, caused by the thermal motion of particles, is usually modeled by a Gaussian profile. Pressure (collision) broadening, resulting from perturbations due to collisions with other particles, is often described using Lorentzian profiles. In most practical applications, a Voigt profile—a convolution of Doppler and Lorentzian shapes—is used to represent the combined effects of both broadening mechanisms. Additional broadening mechanisms such as Stark broadening (due to electric fields) or turbulent broadening may also be considered depending on the plasma environment.
Based on the developed line-by-line (LBL) spectral calculation method, the spectral emission and absorption coefficients of atomic nitrogen were computed under non-equilibrium conditions with a translational temperature of 20,000 K and an electronic temperature of 10,000 K, across the visible and vacuum ultraviolet (VUV) range from 200 nm to 1000 nm, as shown in Figure 1.
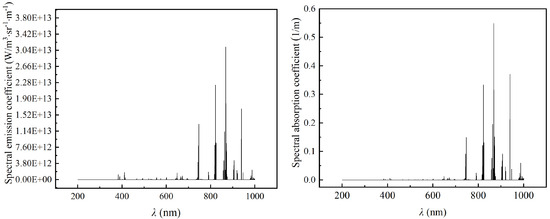
Figure 1.
Spectral emission and absorption of nitrogen atoms due to bound–bound transitions (200–1000 nm).
In addition, using the LBL radiation module integrated into the custom-designed DSMC framework, the bound–bound triplet transitions of atomic nitrogen near the wavelength of 868 nm were calculated. The corresponding emission and absorption coefficients are presented in Figure 2. The results demonstrate excellent agreement with the expected spectral characteristics of the triplet bound states of atomic nitrogen, successfully capturing their radiative behavior.
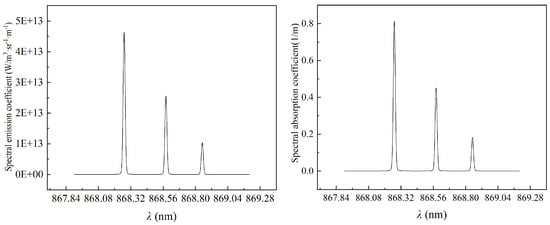
Figure 2.
Spectral emission and absorption of nitrogen atoms due to bound–bound transitions at 868 nm.
5. Photon Monte Carlo (PMC) Method
The Monte Carlo method was first introduced to radiative heat transfer problems by Fleck [26], initiating its widespread application in the field of thermal radiation modeling. The core idea of the method is to use random sampling techniques to simulate the transport paths of discrete energy packets—referred to as “photons.” Therefore, this method is commonly known as the Photon Monte Carlo (PMC) method. Within the PMC framework, radiative emission, scattering, reflection, and absorption are all modeled in a probabilistic manner. By statistically accumulating a large number of photon trajectories, the statistical mean characteristics of the radiation field can be effectively obtained, enabling the prediction of key quantities such as surface temperature distributions and adiative heat fluxes [27]. As the number of photon paths increases, the PMC solution gradually converges to the analytical solution of the radiative transfer equation (RTE), providing good accuracy and physical interpretability.
In performing radiative transfer simulations using the PMC method, it is necessary to determine the number of photons emitted from each cell or region in the computational domain. Currently, two main photon emission strategies are commonly employed:
1. Uniform photon number per cell: A fixed number of photons is emitted from each computational grid cell, regardless of the local emission strength. This ensures equal statistical sampling but results in each photon carrying different amounts of energy due to spatial variation in emissivity, potentially leading to non-uniform energy resolution.
2. Uniform energy per photon: Each photon carries the same amount of energy, causing the number of emitted photons per cell to vary based on local emissivity. This leads to denser photon sampling in high-radiation regions, enhancing local resolution but increasing variance in low-emissivity regions.
In this work, a uniform photon number per grid cell strategy is adopted, ensuring an even spatial distribution of photon emission across the entire computational domain. This approach maintains sufficient statistical accuracy in both low and high-radiation regions. Compared to energy-weighted strategies, this method allows for more consistent control over statistical noise and radiative energy deposition effects, especially in complex geometries. While it may sacrifice local resolution in regions of strong radiation, it proves to be more robust and broadly applicable in engineering analyses such as thermal protection system design and aerothermal radiation coupling.
Similar to the DSMC method where particles are randomly distributed within each computational cell, the initial emission position of photons must also be sampled within the spatial volume of the grid cell. In this study, surface emission effects are not considered, and therefore the photon emission location is randomly distributed uniformly within each grid cell. Given the grid cell center coordinates and the cell dimensions , three random numbers are used to compute the initial photon emission position as:
Once the emission location is determined, the emission direction must be sampled to define the photon’s propagation path. Assuming isotropic emission over a unit sphere, the emission direction can be sampled using two independent random numbers to obtain the azimuthal angle and polar angle :
Transforming the spherical coordinates into Cartesian coordinates, the emission direction unit vector is given by:
The radiative energy carried by a photon bundle is a key indicator of radiative intensity. Assuming the spectral emission coefficient over a small wavelength interval ∼ is , the total energy emitted over this wavelength range is:
By introducing a probability density function , the cumulative probability for a photon to be emitted within a given wavelength range can be determined based on the spectral emission distribution.
After the photon’s emission position, direction, and wavelength are determined, the next step is to simulate photon propagation and absorption within each computational grid cell (scattering is neglected in this study). To ensure that the photon wavelength is sampled according to the spectral distribution, a random number is compared with the cumulative probability function , defined as:
If , the corresponding wavelength is selected for emission.
As photons travel through the computational domain, absorption is computed for each grid cell the ray passes through. Due to spatially varying absorption coefficients, Lambert–Bouguet’s law is applied to model the attenuation of spectral intensity within each cell. The absorbed portion of the photon energy E while traveling a distance d in a cell with absorption coefficient is given by:
After each absorption step, a check is performed to determine whether the residual photon energy drops below a specified energy threshold (typically set to half the initial energy). If so, the remaining energy is deposited into the cell, and the photon is deleted from the simulation.
When a photon reaches a wall surface, it undergoes a two-step interaction process: First, a random number is compared with the wall absorption coefficient. If the photon is absorbed (i.e., the random number is less than the wall’s absorption probability), its remaining energy is deposited at the wall, and the photon is deleted. If not absorbed, the photon is reflected. The type of reflection—specular or diffuse—is determined based on the surface interaction model (e.g., mirror-like or Lambertian reflection).
The FIRE (Flight Investigation of Reentry Environment) program was a key experimental campaign conducted by the United States during the Apollo era, designed to simulate and measure the intense radiative and convective heating experienced by re-entry vehicles returning to Earth at near-lunar velocities. The project provided essential reference data to support the development of thermal protection systems (TPSs), particularly for the Apollo command module.
In the FIRE II mission, a special high-enthalpy re-entry heat shield system was employed, consisting of a three-component ablation material composed of phenolic, silica, and graphite. This enabled precise measurement of cumulative heat load under extreme re-entry conditions. The heat shield structure was designed to separate thermal components spatially, allowing researchers to quantify radiative heating contributions independently from total heating, even under high-enthalpy non-ablative conditions.
To evaluate the key radiation-dominated phase of the reentry process, two experimental times—1631 s and 1634 s—were selected for validation. FIRE II is one of the few re-entry test cases with publicly available high-velocity trajectory and flow field data [28,29]. The atmospheric altitudes corresponding to these two measurement points were 76.4 km and 84.6 km, respectively. The vehicle flight conditions are summarized in Table 2.

Table 2.
Atmospheric properties at 84.6 km and 76.4 km for FIRE II vehicle.
In the simulation, the VHS (Variable Hard Sphere) molecular model was adopted for binary molecular collisions, and a 5-species reacting air mixture was used. Translational, rotational, and vibrational energy exchanges were handled using the Larsen–Borgnakke model, with relaxation probabilities of 0.2 for rotational modes, 0.02 for vibrational modes, and 0.01 for electronic excitation.
The simulation time step was set to s to ensure that particles do not traverse multiple cells per time step. A locally adaptive meshing strategy was used to guarantee that the number of particles per cell remained between 20 and 35. A total of 60,000 time steps were run to ensure statistical convergence.
Spectral radiation calculations covered the 200–4000 nm wavelength range, encompassing near-ultraviolet, visible, and near-infrared bands. This range includes the dominant atomic and molecular emission lines of excited nitrogen and other species present in high-temperature air. In high-enthalpy, non-equilibrium flow fields relevant to re-entry conditions, this spectral range accounts for the primary contribution to gas-phase radiative emission, making it essential for accurate modeling of radiative heating.
A comparative analysis of the radiative heat flux distributions along the surface of the FIRE II re-entry vehicle at 1634 s was conducted under varying spectral discretization resolutions and photon emission counts per grid cell, as shown in Table 3.

Table 3.
Comparison of spectral discretization and number of emitted photons per cell.
As the number of spectral discretization points increases, the surface radiative heat flux profile gradually converges in Figure 3, with both the peak location and magnitude approaching stable values. In contrast, when the spectral resolution is too low, significant errors arise in the spectral integration of radiative intensity, leading to underestimation of surface heat flux and the appearance of non-physical local oscillations.
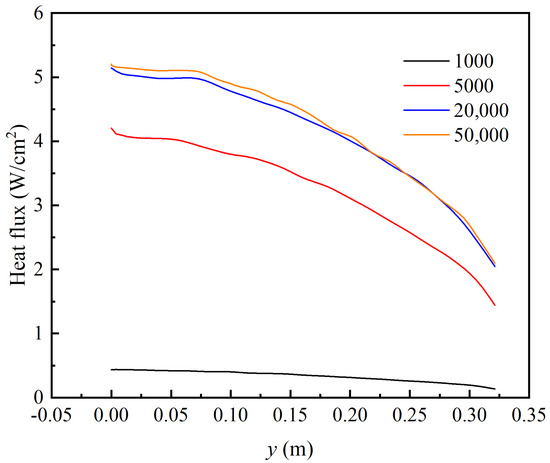
Figure 3.
Surface radiative heat flux distribution of the FIRE II re-entry vehicle at 1634 s under different spectral discretization resolutions.
Further analysis reveals that when the spectrum is discretized into 50,000 wavelength points, the computed radiative heat flux over the 200–4000 nm band—spanning ultraviolet to near-infrared—achieves convergence and satisfies the engineering-level accuracy requirements. Therefore, a spectral resolution of 50,000 points is considered a reasonable choice for simulating non-equilibrium radiative transfer in high-temperature atomic gases within this spectral range.
Figure 4 illustrates the effect of varying the number of photons emitted per grid cell on the heat flux distribution. Unlike spectral resolution, photon count does not significantly affect the overall magnitude of radiative heat flux. However, it strongly influences the smoothness and statistical stability of the computed results.
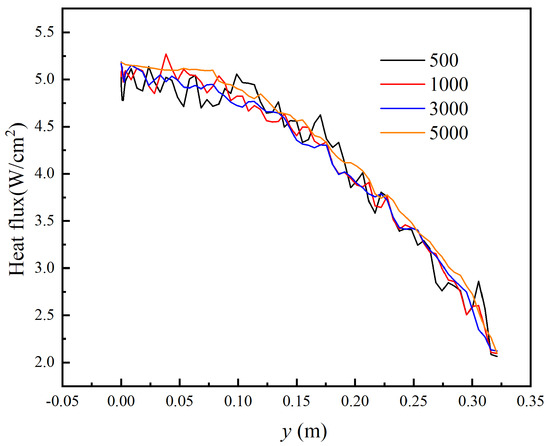
Figure 4.
Surface radiative heat flux distribution of the FIRE II re-entry vehicle at 1634 s under different numbers of emitted photons per cell.
When the number of photons per cell is low (e.g., <1000), the heat flux curve exhibits noticeable numerical fluctuations, indicating large statistical sampling errors. As the number of photons increases, particularly beyond 3000 per cell, these local fluctuations are substantially suppressed. At 5000 photons per cell, the heat flux distribution becomes smooth and statistically converged, providing reliable results for both radiative transfer modeling and engineering evaluation.
Based on the combined analysis of spectral discretization accuracy and statistical convergence, this study adopts 50,000 spectral points and 5000 photon emissions per grid cell as the baseline configuration for subsequent radiative transfer simulations. This setup ensures both spectral fidelity and statistical robustness in high-temperature, non-equilibrium atomic gas radiation modeling.
Experimental data from the FIRE II re-entry mission at the two measurement times of 1631 s and 1634 s is limited, with only surface heat flux sensor readings available near the forebody region of the vehicle. In this study, both the experimental data and values reported in the literature are compared.
Figure 5 presents the distributions of convective wall heat flux at two altitudes—76.4 km and 84.6 km—along the surface of the FIRE II vehicle. It can be observed that, in the absence of radiative contributions, the DSMC-calculated convective heat flux in this work yields better agreement with flight data than the results reported by Fertig [30] and Taylor [31]. At 84 km, the results by Boyd [32] still show noticeable deviations from experimental data. These discrepancies may stem from multiple factors, such as uncertainties in the published flight altitudes and free-stream conditions, local surface ablation effects, sensor response delays, and possible interference or contamination of heat flux sensors by plasma or ablation products.
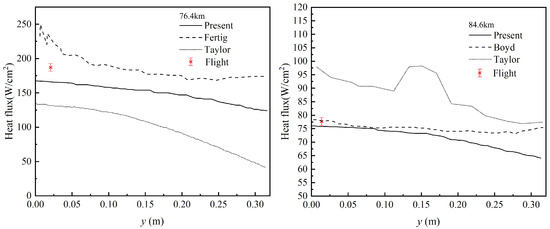
Figure 5.
Surface convective heat flux distribution along the FIRE II re-entry vehicle at flight test times 1634 s (left) and 1631 s (right).
Figure 6 shows the radiative wall heat flux distributions at the two re-entry times, 1631 s and 1634 s. Although some error remains in the predicted results at 1634 s, the present calculation shows closer agreement with experimental measurements compared to Taylor’s results. In contrast, Fertig’s predictions overestimate the radiative heat flux, exceeding 100 W/cm2, which raises questions about their accuracy.
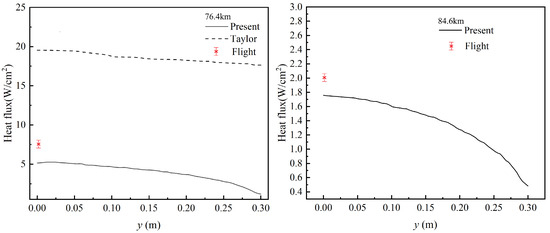
Figure 6.
Surface radiation heat flux distribution along the FIRE II re-entry vehicle at flight test times 1634 s (left) and 1631 s (right).
At 1631 s, the computed radiative heat flux is 3.32 W/cm2 lower than that at 1634 s, highlighting the influence of gas rarefaction on radiative emission. As the flow becomes more rarefied at higher altitudes, the reduced collisional excitation leads to a noticeable decrease in radiative intensity.
6. Radiative Characteristics During the Re-Entry of Lunar-Return- Type Vehicles
According to public reports and the literature [33], the aerodynamic configuration and surface mesh of the lunar-return high-speed re-entry vehicle are shown in Figure 7. During its first re-entry, the capsule reached a velocity exceeding . In this study, two representative altitudes, and , are selected to investigate the radiative characteristics during the re-entry process.
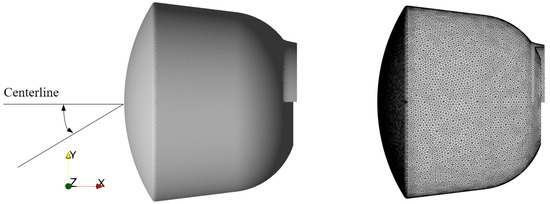
Figure 7.
Lunar-return capsule configuration and surface mesh with five faces.
The free-stream gas composition is assumed to be nitrogen (N2) and oxygen (O2) by volume, and the angle of attack is set to 18°. The specific flow conditions are summarized in Table 4.

Table 4.
Calculation conditions for lunar-return-like capsule re-entry.
An eleven-species ionized air model is employed to describe gas-phase chemical reactions. Energy exchange among translational, rotational, and vibrational modes is treated using the Larsen–Borgnakke model. The relaxation probabilities for energy mode exchanges are set to for rotational energy, for vibrational energy, and for electronic excitation, in accordance with the Larsen–Borgnakke model. The simulation time step is set as to ensure that no particle traverses multiple grid cells within a single step. A locally adaptive mesh refinement strategy is adopted to maintain the number of particles per cell between 20 and 35. A total of 80,000 time steps are performed to ensure statistical convergence. Simulations are conducted on a dual-socket AMD 7B13 server with 128 CPU cores and of RAM. After initialization, the simulation at altitude contains approximately particles.
Figure 8 presents the contour plots of translational, rotational, and electronic temperature distributions at altitudes of 90 km and 95 km. A comparison of the translational temperatures at both altitudes reveals that although the peak values remain unchanged, the area of the high-temperature region increases significantly at higher altitude. This phenomenon can be attributed to the fact that collision frequency is positively correlated with particle number density. As the density decreases, collisions occur less frequently, requiring more time for kinetic energy to be converted into thermal energy.
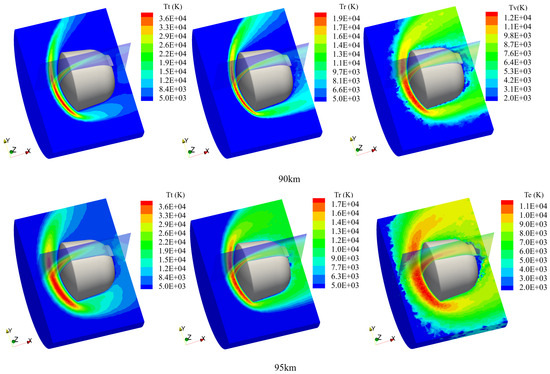
Figure 8.
Distribution of translational, rotational, and electronic temperatures at altitudes of 90 km and 95 km.
Both rotational and electronic temperatures decrease significantly with increasing altitude, indicating that non-equilibrium effects become more pronounced as the gas becomes more rarefied. The electronic temperature exhibits strong fluctuations, especially in low-density regions. This is primarily due to the discrete nature of electronic energy levels, resulting in highly non-continuous energy distributions. Such fluctuations are more evident in regions with low particle number densities.
Figure 9 presents the temperature distribution along the central axis of the flow field surrounding the re-entry capsule. Combined with the temperature contour maps in Figure 8, it can be observed that the temperature profiles at 90 km and 95 km exhibit consistent trends. The translational temperature shows minimal variation with altitude, whereas the rotational, vibrational, and electronic temperatures undergo more significant changes. As the altitude increases, the particle collision frequency decreases, leading to slower energy exchange among internal modes and resulting in increasingly pronounced thermal non-equilibrium effects.
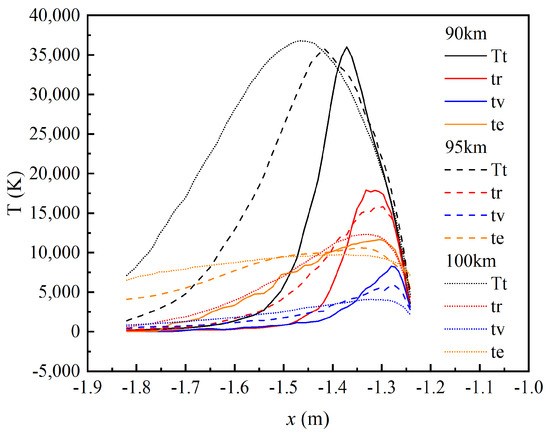
Figure 9.
Temperature profiles along the centerline of the lunar-return-type capsule flow field.
Further analysis of the heat flux and pressure distribution along the capsule surface is presented in Figure 10, which shows the wall pressure and heat flux contours for the lunar-return-type re-entry capsule. Under the same conditions of particle mass, incident velocity, and boundary constraints, the surface pressure is primarily determined by the frequency of particle impacts on the wall. As the altitude increases and the gas becomes more rarefied, the number of particles striking the surface per unit time decreases, leading to a reduction in wall pressure. In addition, the layered structure of surface pressure along the capsule’s rotational face becomes increasingly diffuse with altitude.
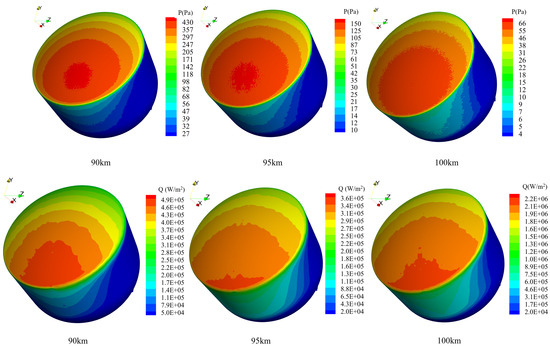
Figure 10.
Wall pressure and heat flux contours of the lunar-return-type re-entry capsule (top: pressure, bottom: heat flux).
The wall heat flux contours reveal that the heat load on the aft base of the capsule decreases with increasing altitude, accompanied by a gradual loss of stratification in the heat flux distribution. Due to the presence of an angle of attack, the heat flux and pressure distributions on the capsule’s aft base exhibit noticeable asymmetry. As shown in Figure 11, which presents the heat flux and pressure profiles along the surface, peak values for both parameters occur below the capsule centerline on the windward side, within the region . This is attributed to the direct exposure of this area to the primary free-stream, where dynamic pressure is concentrated.
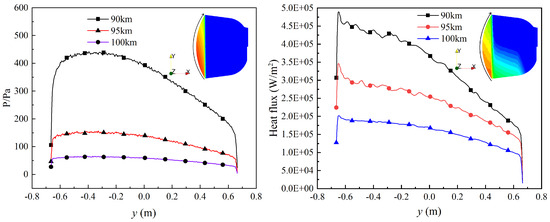
Figure 11.
Pressure and heat flux distributions along the surface of the lunar-return-type re-entry capsule (left: pressure, right: heat flux).
In contrast, for , both heat flux and pressure increase radially outward before dropping sharply near the edge (i.e., the shoulder region). This trend is driven by significant flow deflection, boundary layer thickening, and the downstream transfer of flow kinetic energy, which collectively reduce the thermal and dynamic effects on the surface.
Figure 12 illustrates the surface radiative heat flux distributions for the first lunar-return re-entry of the capsule at altitudes of 95 km and 90 km. Compared with the aerodynamic heat flux distribution shown in Figure 10—where the peak aerodynamic heating is mainly concentrated near the aft shoulder due to the effect of the angle of attack—the peak of radiative heat flux is primarily influenced by the distribution of excited particles and the emission/absorption paths. As a result, the maximum radiative heating still appears on the aft base of the capsule, skewed in the direction of the angle of attack.
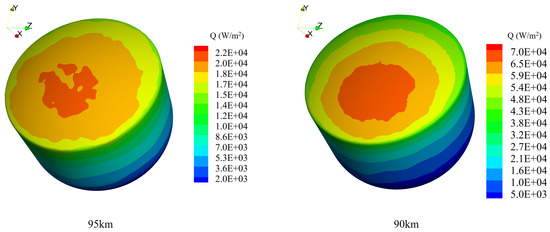
Figure 12.
Wall radiative heat flux contours during the first re-entry of the lunar-return-type capsule.
The comparison of radiative and aerodynamic heat fluxes along the centerline of the windward surface further supports this observation. In the region of , the peak of the radiative heat flux aligns with the region shown in Figure 13, exhibiting a clear offset trend corresponding to the angle of attack.
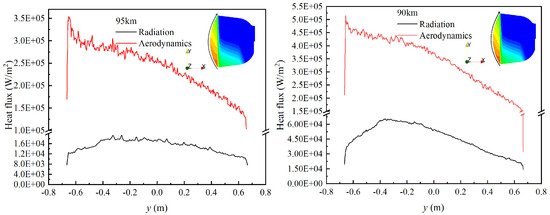
Figure 13.
Distributions of aerodynamic and radiative heat fluxes along the capsule surface.
When comparing the peak radiative heat flux between the two altitudes, it is observed that the maximum value at 90 km is more than three times that at 95 km. Furthermore, at 90 km, radiative heat flux accounts for approximately of the aerodynamic heat flux, while at 95 km, it contributes only . Given that the re-entry velocity remains nearly the same, this difference is primarily attributed to the significant increase in gas density at lower altitudes. The elevated density leads to a higher collision frequency, resulting in more excited-state particles and enhanced effective emission, thereby increasing the total radiative energy output.
7. Conclusions
This study investigates non-equilibrium radiation phenomena during the high-speed re-entry of a lunar-return-type capsule. A line-by-line spectral model was established to compute atomic emission and absorption coefficients under non-equilibrium conditions. The Photon Monte Carlo (PMC) method, compatible with the DSMC framework, was employed to solve the radiative energy transport equation. The influence of spectral discretization and the number of emitted photons per cell on radiation transfer accuracy was analyzed. The main conclusions are as follows:
- The developed non-equilibrium radiation model for atomic gases was applied to simulate the re-entry of the FIRE II vehicle at 1631 s and 1634 s. Compared to previous studies by Fertig and Taylor, the results presented in this work show better agreement with experimental measurements, demonstrating the accuracy and reliability of the proposed radiation model.
- The effects of varying the number of spectral discretization points and photon emissions per cell were investigated. When the spectral resolution was too low, spurious local oscillations appeared in the surface radiative heat flux. As the number of discretization points increased, both the peak location and magnitude of the radiative heat flux stabilized. While the total magnitude of radiative heat flux was relatively insensitive to the number of emitted photons per cell, local smoothness was significantly improved. Based on eight representative cases and considering computational cost, a discretization of 50,000 spectral points and 5000 photons per cell was found sufficient to ensure solution accuracy.
- Using the optimized model parameters, the non-equilibrium radiative characteristics during the re-entry of a lunar-return-type capsule were further analyzed. It was found that regions of peak radiative heat flux did not coincide with those of peak aerodynamic heating, indicating that gas-phase radiation is less affected by the angle of attack. Most of the radiation emitted by excited species escapes to space, with only a small portion absorbed by the gas and capsule surface. The surface heat flux is influenced by both atmospheric density and re-entry velocity, with the latter playing a dominant role. In high-angle-of-attack re-entry scenarios, particular attention should be paid to the shoulder region of the capsule in the thermal protection system (TPS) design to ensure adequate thermal margins.
- Although this study employs an eleven-species ionized reaction model coupled with DSMC and radiation analysis, several limitations remain. The chemical kinetics are simplified using Arrhenius-type rate coefficients, and the simulations are restricted to altitudes between 80 and 100 km and a specific velocity regime. Radiation transport assumptions and the neglect of surface catalysis and ablation may also affect the accuracy of the results. Future work will aim to extend the reaction mechanism, improve radiation modeling, and incorporate surface chemistry to achieve a more comprehensive description of re-entry flows.
Author Contributions
J.-Z.H.: Writing—original draft, Validation, Methodology, Investigation. Z.-H.L.: Supervision, Project administration, Funding acquisition. Y.-D.L.: Supervision, Formal analysis, Conceptualization. All authors have read and agreed to the published version of the manuscript.
Funding
The authors acknowledge the support from the Academician Workstation Fund of the China Aerodynamics Research and Development Center.
Data Availability Statement
Dataset available on request from the authors.
Conflicts of Interest
The authors declare no conflicts of interest.
Correction Statement
This article has been republished with a minor correction to the Data Availability Statement. This change does not affect the scientific content of the article.
Abbreviations
The following abbreviations are used in this manuscript:
| DSMC | Direct Simulation Monte Carlo |
| PMC | Photon Monte Carlo |
| FIRE | Flight Investigation of Reentry Environment |
| NEQ | Non-Equilibrium |
| LTE | Local Thermodynamic Equilibrium |
| UV | Ultraviolet |
| IR | Infrared |
| HTS | Heat Transfer System |
References
- Mansour, N.N.; Panerai, F.; Lachaud, J.; Magin, T. Flow mechanics in ablative thermal protection systems. Annu. Rev. Fluid Mech. 2024, 56, 549–575. [Google Scholar] [CrossRef]
- Candler, G.V. Rate effects in high speed flows. Annu. Rev. Fluid Mech. 2019, 51, 379–402. [Google Scholar] [CrossRef]
- Jenniskens, P.; Wercinski, P.; Olejniczak, J.; Allen, G.; Desai, P.N.; Raiche, G.; Kontinos, D.; Revelle, D.; Hatton, J.; Baker, R.L.; et al. Preparing for hyperseed MAC: An observing campaign to monitor the entry of the genesis sample return capsule. Mod. Meteor Sci. Interdiscip. View 2005, 95, 336–360. [Google Scholar]
- Surzhikov, S.T.; Shang, J.S. Coupled radiation-gasdynamic model for stardust earth entry simulation. J. Spacecr. Rocket. 2012, 49, 875–888. [Google Scholar] [CrossRef]
- Richardson, N.R. Project Fire Instrumentation for Radiative Heating and Related Measurements; NASA: Washington, DC, USA, 1966; pp. 35–79.
- Gnoffo, P.A.; Weilmuenster, K.J.; Hamilton, H.H.; Olynick, D.R.; Venkatapathy, E. Computational aerothermodynamic design issues for hypersonic vehicles. J. Spacecr. Rocket. 1999, 36, 21–43. [Google Scholar] [CrossRef]
- Park, C. Stagnation-point radiation for apollo 4—A review and current status. In Proceedings of the 35th AIAA Thermophysics Conference, Anaheim, CA, USA, 11–14 June 2001; American Institute of Aeronautics and Astronautics: Reston, VA, USA, 2001; p. 3070. [Google Scholar]
- White, T.T.; Hard, A.C. Apollo 4 and 6 radiation analysis. J. Spacecr. Rocket. 1970, 7, 785–788. [Google Scholar] [CrossRef]
- Cruden, B.A.; Prabhu, D.; Martinez, R. Absolute radiation measurement in Venus and Mars entry conditions. J. Spacecr. Rocket. 2012, 49, 1069–1079. [Google Scholar] [CrossRef]
- Nicolet, W.E. Advanced Methods for Calculating Radiation Transport in Ablation-Product Contaminated Boundary Layers; NASA: Washington, DC, USA, 1970.
- Park, C. Nonequilibrium Air Radiation (Nequair) Program: User’s Manual: REPT-85185. 1985. Available online: https://ntrs.nasa.gov/citations/19850022467 (accessed on 20 June 2024).
- Cruden, B.A.; Schulz, J.C.; Dean, T.M.; Hill, J.P.; Brandis, A.M. New features of the NEQAIR radiation code. In Proceedings of the 9th International Workshop on Radiation of High Temperature Gases, Azores, Portugal, 12–16 September 2022. [Google Scholar]
- Brandis, A.M.; Cruden, B.A. NEQAIR v15. 0 Release Notes: Nonequilibrium and Equilibrium Radiative Transport and Spectra Program; NASA: Washington, DC, USA, 2019.
- Pfeiffer, B.; Fertig, M.; Winter, M.; Auweter Kurtz, M. PARADE—A program to calculate the radiation of atmospheric re-entry in different atmospheres. Radiat. High Temp. Gases Atmos. Entry 2003, 533, 85–91. [Google Scholar]
- Dubois, J.; Smith, A.J. ESA PlasmA RAdiation DatabasE (PARADE). Development history, status, current developments and future prospects. Radiat. High Temp. Gases Atmos. Entry 2006, 629, 10. [Google Scholar]
- Perrin, M.Y.; Rivière, P.; Soufiani, A. Radiation Database for Earth and Mars Entry; NATO Research and Technology Organisation: Brussels, Belgium, 2009; pp. 8.1–8.40. [Google Scholar]
- Colonna, G.; D’Ammando, G.; Pietanza, L.D.; Capitelli, M. Excited-state kinetics and radiation transport in low-temperature plasmas. Plasma Phys. Control. Fusion 2014, 57, 014009. [Google Scholar] [CrossRef]
- Panesi, M.; Magin, T.E.; Bourdon, A.; Bultel, A.; Chazot, O. Electronic excitation of atoms and molecules for the FIRE II flight experiment. J. Thermophys. Heat Transf. 2011, 25, 361–374. [Google Scholar] [CrossRef]
- Song, X.X.; Zhang, S.; Zhang, J.F.; Zheng, Y. Study on the variation of gas radiation characteristics of hypersonic reentry vehicles. Aiaa J. 2023, 61, 5277–5287. [Google Scholar] [CrossRef]
- Du, Y.; Sun, S.; Tan, M.; Huang, H.; Yan, C.; Meng, X.; Chen, X.; Wang, H. Numerical study on the non-equilibrium characteristics of high-speed atmospheric re-entry flow and radiation of aircraft based on fully coupled model. J. Fluid Mech. 2023, 977, A39. [Google Scholar] [CrossRef]
- Carlson, A.B.; Hassan, H.A. Radiation modeling with direct simulation monte carlo. J. Thermophys. Heat Transf. 1992, 6, 631–636. [Google Scholar] [CrossRef]
- Ozawa, T.; Li, Z.; Sohn, I.; Levin, D. Modeling of electronic excitation and radiation for hypersonic Re-entry flows in DSMC. In Proceedings of the 48th AIAA Aerospace Sciences Meeting Including the New Horizons Forum and Aerospace Exposition, Orlando, FL, USA, 4–7 January 2010; American Institute of Aeronautics and Astronautics: Reston, VA, USA, 2010. [Google Scholar]
- Civrais, C.H.B.; Pfeiffer, M.; White, C.; Steijl, R. Modeling of the electronic excited states in high-temperature flows. Phys. Fluids 2024, 36, 086112. [Google Scholar] [CrossRef]
- Martin, A.; Przybocki, M. The NIST 1999 speaker recognition evaluation—An overview. Digit. Signal Process. 2000, 10, 1–18. [Google Scholar] [CrossRef]
- Modest, M.F.; Mazumder, S. The radiative transfer equation in participating media (RTE). Radiat. Heat Transf. 2013, 43, 279–302. [Google Scholar]
- Fleck, J.A., Jr.; Cummings, J.D., Jr. An implicit monte carlo scheme for calculating time and frequency dependent nonlinear radiation transport. J. Comput. Phys. 1971, 8, 313–342. [Google Scholar] [CrossRef]
- Howell, J.R.; Mengüç, M.P.; Daun, K.; Siegel, R. Thermal Radiation Heat Transfer; CRC Press: Boca Raton, FL, USA, 2020. [Google Scholar]
- Ma, X.; Quataert, E.; Wetzel, A.; Hopkins, P.F.; Faucher-Giguère, C.A.; Kereš, D. No missing photons for reionization: Moderate ionizing photon escape fractions from the FIRE-2 simulations. Mon. Not. R. Astron. Soc. 2020, 498, 2001–2017. [Google Scholar] [CrossRef]
- Hopkins, P.F.; Wetzel, A.; Kereš, D.; Faucher-Giguère, C.A.; Quataert, E.; Boylan-Kolchin, M.; Murray, N.; Hayward, C.C.; Garrison-Kimmel, S.; Hummels, C.; et al. FIRE-2 simulations: Physics versus numerics in galaxy formation. Mon. Not. R. Astron. Soc. 2018, 480, 800–863. [Google Scholar] [CrossRef]
- Fertig, M.; Winter, M.; Herdrich, G.; Röser, H.P. Modelling of high speed earth entry study note. In ESA Study Note; ESA: Paris, France, 2008. [Google Scholar]
- Taylor, J.C.; Carlson, A.B.; Hassan, H.A. Monte carlo simulation of radiating re-entry flows. J. Thermophys. Heat Transf. 1994, 8, 478–485. [Google Scholar] [CrossRef]
- Boyd, I.; Farbar, E. Simulation of fire II reentry flow using the direct simulation monte carlo method. In Proceedings of the 40th Thermophysics Conference, Seattle, WA, USA, 23–26 June 2008; American Institute of Aeronautics and Astronautics: Washington, DC, USA, 2008. [Google Scholar]
- Lu, Y.; Li, Q.; Geng, Y. Aerodynamic design and verification technologies of lunar-return high-speed reentry capsule. Sci. China Technol. Sci. 2015, 45, 132–138. [Google Scholar]
Disclaimer/Publisher’s Note: The statements, opinions and data contained in all publications are solely those of the individual author(s) and contributor(s) and not of MDPI and/or the editor(s). MDPI and/or the editor(s) disclaim responsibility for any injury to people or property resulting from any ideas, methods, instructions or products referred to in the content. |
© 2025 by the authors. Licensee MDPI, Basel, Switzerland. This article is an open access article distributed under the terms and conditions of the Creative Commons Attribution (CC BY) license (https://creativecommons.org/licenses/by/4.0/).