Article

Analysis of Influencing Factors on the Feasible Operating Range of a Triple-Bypass Adaptive Variable Cycle Engine Compression System

1
Research Institute of Aero-Engine, Beihang University, Beijing 102206, China
2
National Key Laboratory of Science and Technology on Aero-Engine Aero-Thermodynamics, Beihang University, Beijing 102206, China
*
Author to whom correspondence should be addressed.
Aerospace 2025, 12(9), 775; https://doi.org/10.3390/aerospace12090775
Submission received: 16 July 2025 / Revised: 28 July 2025 / Accepted: 26 August 2025 / Published: 28 August 2025
(This article belongs to the Section Aeronautics)

Abstract

The operation range of the adaptive cycle engine (ACE) compression system is constrained by both the compression components and the bypass ducts, resulting in intricate matching mechanisms. Conventional analysis methods struggle to adequately evaluate the feasible operating range or the coupled constraints between components. This study employs an integrated hybrid-dimensional approach, combining zero-dimensional bypass analysis with one-dimensional/quasi-two-dimensional component analysis, to systematically investigate the matching effects of a triple-bypass compression system. The influence of key matching parameters, including the compression component operating points, high-pressure (HP) and low-pressure (LP) shaft speeds, and the core-driven fan stage (CDFS) variable inlet guide vane (VIGV) angles, is investigated. Results indicate that compression component matching primarily influences adjacent downstream bypass ratios, while HP/LP shaft speeds and the CDFS VIGV angle predominantly regulate the first and second bypass ratios. The feasible operating envelope is determined by the superimposed effects of these control parameters. To maximize the total bypass ratio, optimal operation requires increasing the front fan stall margin, elevating LP shaft speed, reducing HP shaft speed, and implementing partial CDFS VIGV closure to enhance pre-swirl. These findings provide critical guidance for control logic refinement and design optimization in advanced variable-cycle compression systems.

1. Introduction

Variable cycle engines (VCEs) adjust their thermodynamic cycles to vary bypass ratios across different flight conditions, allowing optimal performance in both subsonic and supersonic regimes. During subsonic flight, higher bypass ratios enable efficient turbofan-mode operation with lower fuel consumption. For supersonic flight, reduced bypass ratios provide turbojet-like high thrust [1,2]. Building on this core principle of variable cycles, Adaptive cycle engines (ACEs) represent the next evolutionary step, aiming to achieve even greater levels of performance optimization by enhancing bypass modulation capabilities, accompanied by more bypass ducts and variable geometry components. The advanced triple-bypass ACE design offers the greatest flexibility in cycle adjustment and bypass ratio variation [3]. Compared to standard turbofans [4], ACEs have more complex compression systems featuring multiple bypass ducts, extra compression stages, and adjustable components like the Mode Selector Valve (MSV) and the Forward Variable Area Bypass Injector (FVABI). These design features create strong coupling effects between components and bypass ducts, making system integration particularly challenging [5,6,7]. As one of the most promising concepts for the next generation aero-engine, significant progress has been made in ACE research. Comparative studies by Berton et al. [8] confirm that dual/triple-bypass configurations deliver superior performance despite increased structural complexity. Extensive investigations [9,10,11,12,13,14,15,16] have systematically characterized their matching mechanisms and performance attributes, establishing crucial design guidelines. However, conventional simplified models cannot adequately represent the intricate flow interactions in compression systems [17]. To address this, researchers have developed innovative approaches, including integrated through-flow analysis [18] and hybrid-dimensional methods [19,20], achieving significant computational savings without compromising accuracy. Yet the multi-dimensional design space in preliminary phases continues to demand more efficient analysis tools to streamline the optimization process.
During the preliminary compressor design phase, the primary focus is on optimizing fundamental parameters and selecting aerodynamic configurations. At this stage, efficient low-dimensional analysis methods are particularly advantageous as they prioritize computational efficiency over detailed flow field resolution. However, conventional 1D mean-line methods that characterize overall stage performance using just a single streamline prove inadequate for analyzing transonic/supersonic fans with significant radial gradients [21,22,23,24]. These limitations prevent them from meeting the precision requirements of variable cycle compression systems. Furthermore, variable cycle compression systems exhibit strong coupling effects between their multiple bypass ducts, creating matching characteristics that are far more complex than those in conventional engines [25,26]. This multi-duct interdependence dramatically expands the viable configuration space, significantly increasing the challenges in system matching analysis.
To address these challenges, this study proposes a quasi-two-dimensional analysis method based on the mean-line approach, effectively resolving the trade-off between accuracy and efficiency in transonic/supersonic fan performance prediction. Building upon this foundation, we further developed a low-dimensional integrated analysis tool specifically for variable cycle compression systems. Using a representative triple-bypass ACE compression system as the research subject, we systematically investigated the influence mechanisms of key parameters on bypass ratios and system operational envelopes. This research elucidates the multi-parameter coupling mechanisms governing triple-bypass ACE compression systems, providing both theoretical foundations and technical support for the preliminary design optimization of variable cycle engines.

2. Research Methodology

2.1. Research Object

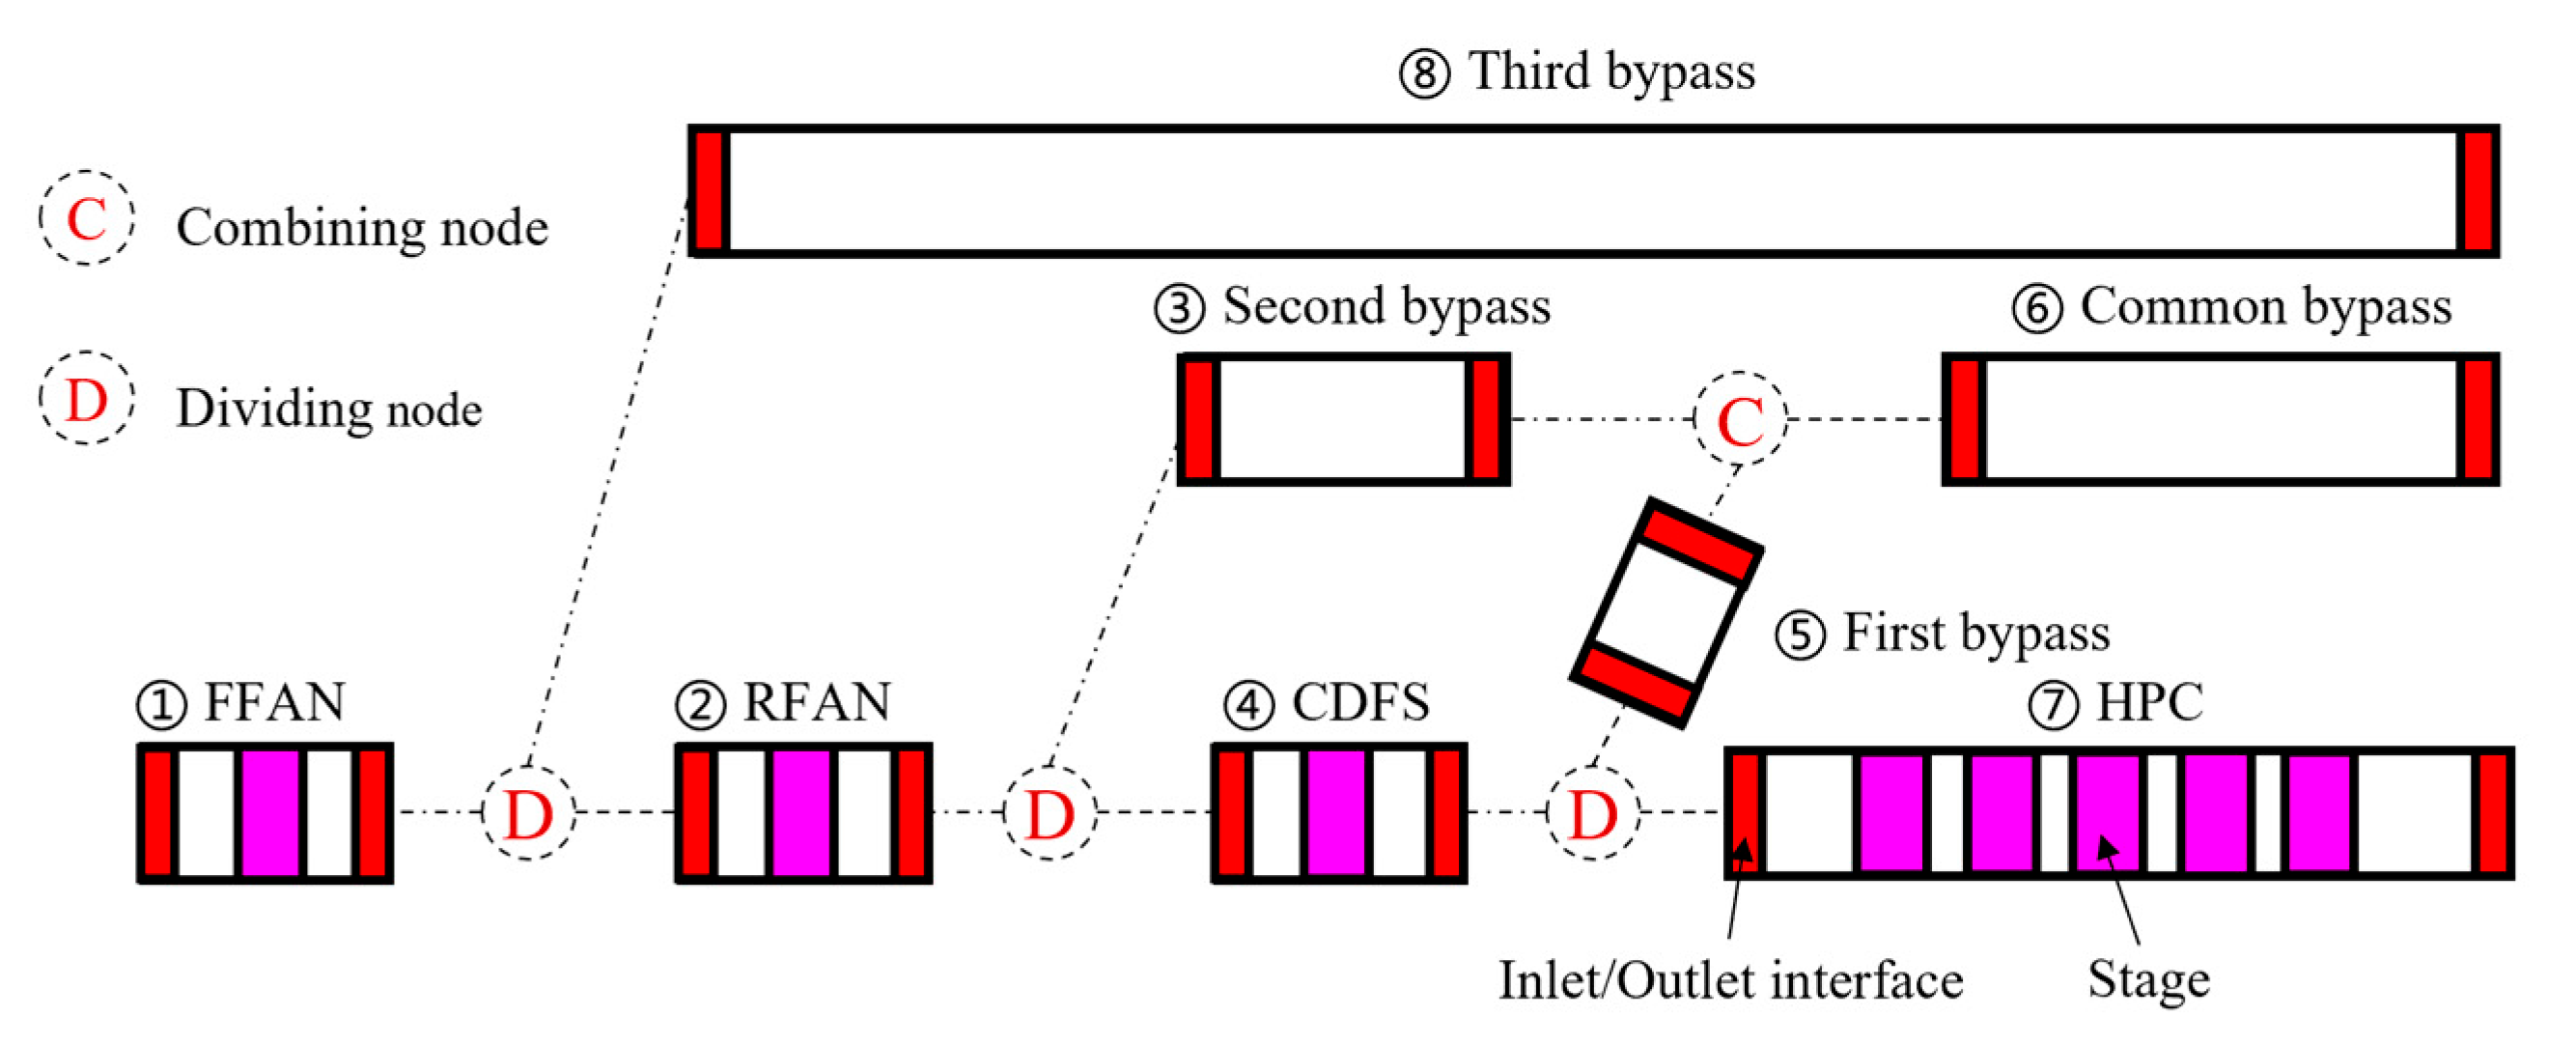
As shown in Figure 1, this study investigates an in-house developed triple-bypass ACE compression system comprising a split-fan configuration with a single-stage front (FFAN) and rear fan (RFAN), a single-stage CDFS equipped with VIGV, and a five-stage high-pressure compressor (HPC). The airflow distribution features three sequential splits: (1) at the FFAN outlet, the flow divides between the third bypass channel and RFAN inlet, defining the third bypass ratio B3; (2) at the RFAN outlet, the flow separates between the second bypass and CDFS, establishing the second bypass ratio B2; and (3) at the CDFS outlet, the flow partitions between the first bypass and the HPC, determining the first bypass ratio B1. The system’s overall performance is characterized by the total bypass ratio Btot, calculated as the sum of all three bypass flows divided by the HPC flow rate, which comprehensively reflects the multi-bypass coupling dynamics of this advanced compression system.
B 3 = m ˙ FFAN , phy m ˙ RFAN , phy 1
B 2 = m ˙ RFAN , phy m ˙ CDFS , phy 1
B 1 = m ˙ CDFS , phy m ˙ HPC , phy 1
B tot = m ˙ FFAN , phy m ˙ HPC , phy 1
where FFAN,phy, RFAN,phy, CDFS,phy, and HPC,phy represent the physical mass flow rates through FFAN, RFAN, CDFS, and HPC, respectively. The physical states are denoted by the subscript “phy”.

2.2. Integrated Analysis Methodology for ACE Compression Systems

To investigate the intrinsic matching mechanisms of the multi-bypass, multi-component ACE compression system, an integrated hybrid-dimension analysis method was developed in this work. This method combines a zero-dimensional bypass analysis model with one-dimensional/quasi-two-dimensional component analysis models, enabling the rapid analysis of diverse aerodynamic configurations. Notably, a state-driven adaptive solving method is proposed. This approach employs an incremental solving strategy that dynamically adjusts the solution procedure based on the state of each component. By tracking component states during computation, it determines incremental solving steps, enabling the dynamic adaptation of the solution path rather than relying on predefined sequences. This capability thus allows autonomous adaptation to diverse aerodynamic configurations.

2.2.1. Overall Framework

The integrated analysis model for the compression system in the present study adopts a modular architecture that constructs flexible aerodynamic configurations through node-duct topological relationships. As illustrated in Figure 2, the triple-bypass compression system comprises four key flow nodes (three dividing nodes and one combining node) and eight fundamental duct units (four functional ducts with compression components and four structural ducts). The inlet/outlet interfaces of each fundamental duct unit are connected to corresponding nodes to form the aerodynamic configuration. This architecture features high scalability, enabling the rapid modeling of different aerodynamic schemes by adjusting the number of nodes/ducts and their interconnection patterns.
The solution process of the integrated model adopts a dual-layer coupling strategy: (1) the duct-level analysis employs zero-dimensional modeling to address flow coupling in multiply connected domains, utilizing flow dividing/combining models [25] to determine flow distribution at nodes; (2) the component-level analysis combines a 1D mean-line method (for high hub-to-tip ratio compressors) and a quasi-2D multi-streamline method [27] (for low hub-to-tip ratio fans) to accurately characterize internal flow features. Through iterative boundary condition exchange, coupled system-level analysis is achieved, thus enabling a comprehensive performance evaluation of the ACE compression system.
This framework effectively integrates the zero-dimensional bypass analysis with the one-dimensional/quasi-two-dimensional component analysis methods, thereby bridging the gap between component-level and system-level design. It supports the preliminary design by guiding component development and enables hybrid optimization when combined with high-fidelity CFD [28]. Leveraging the integrated method’s efficiency and CFD’s accuracy, it also can accelerate optimization while ensuring reliability, providing a foundation for multi-component integrated optimization.

2.2.2. State-Driven Adaptive Solving Method for the Duct-Level

In the context of different aerodynamic layouts, the topological structure constructed based on the node-duct within the integrated analysis program exhibits variations. Due to the differing requirements for boundary conditions among the components (nodes, bypass ducts, and compression component ducts) in the system, and the fact that the flow direction between components and within the ducts consistently moves from the inlet to the outlet, the topological network based on the node-duct, while effectively mapping the intrinsic structure of ACE compression systems under different aerodynamic layouts, inherently possesses anisotropy. Different topological structures inevitably correspond to distinct solving sequences for ducts and nodes.
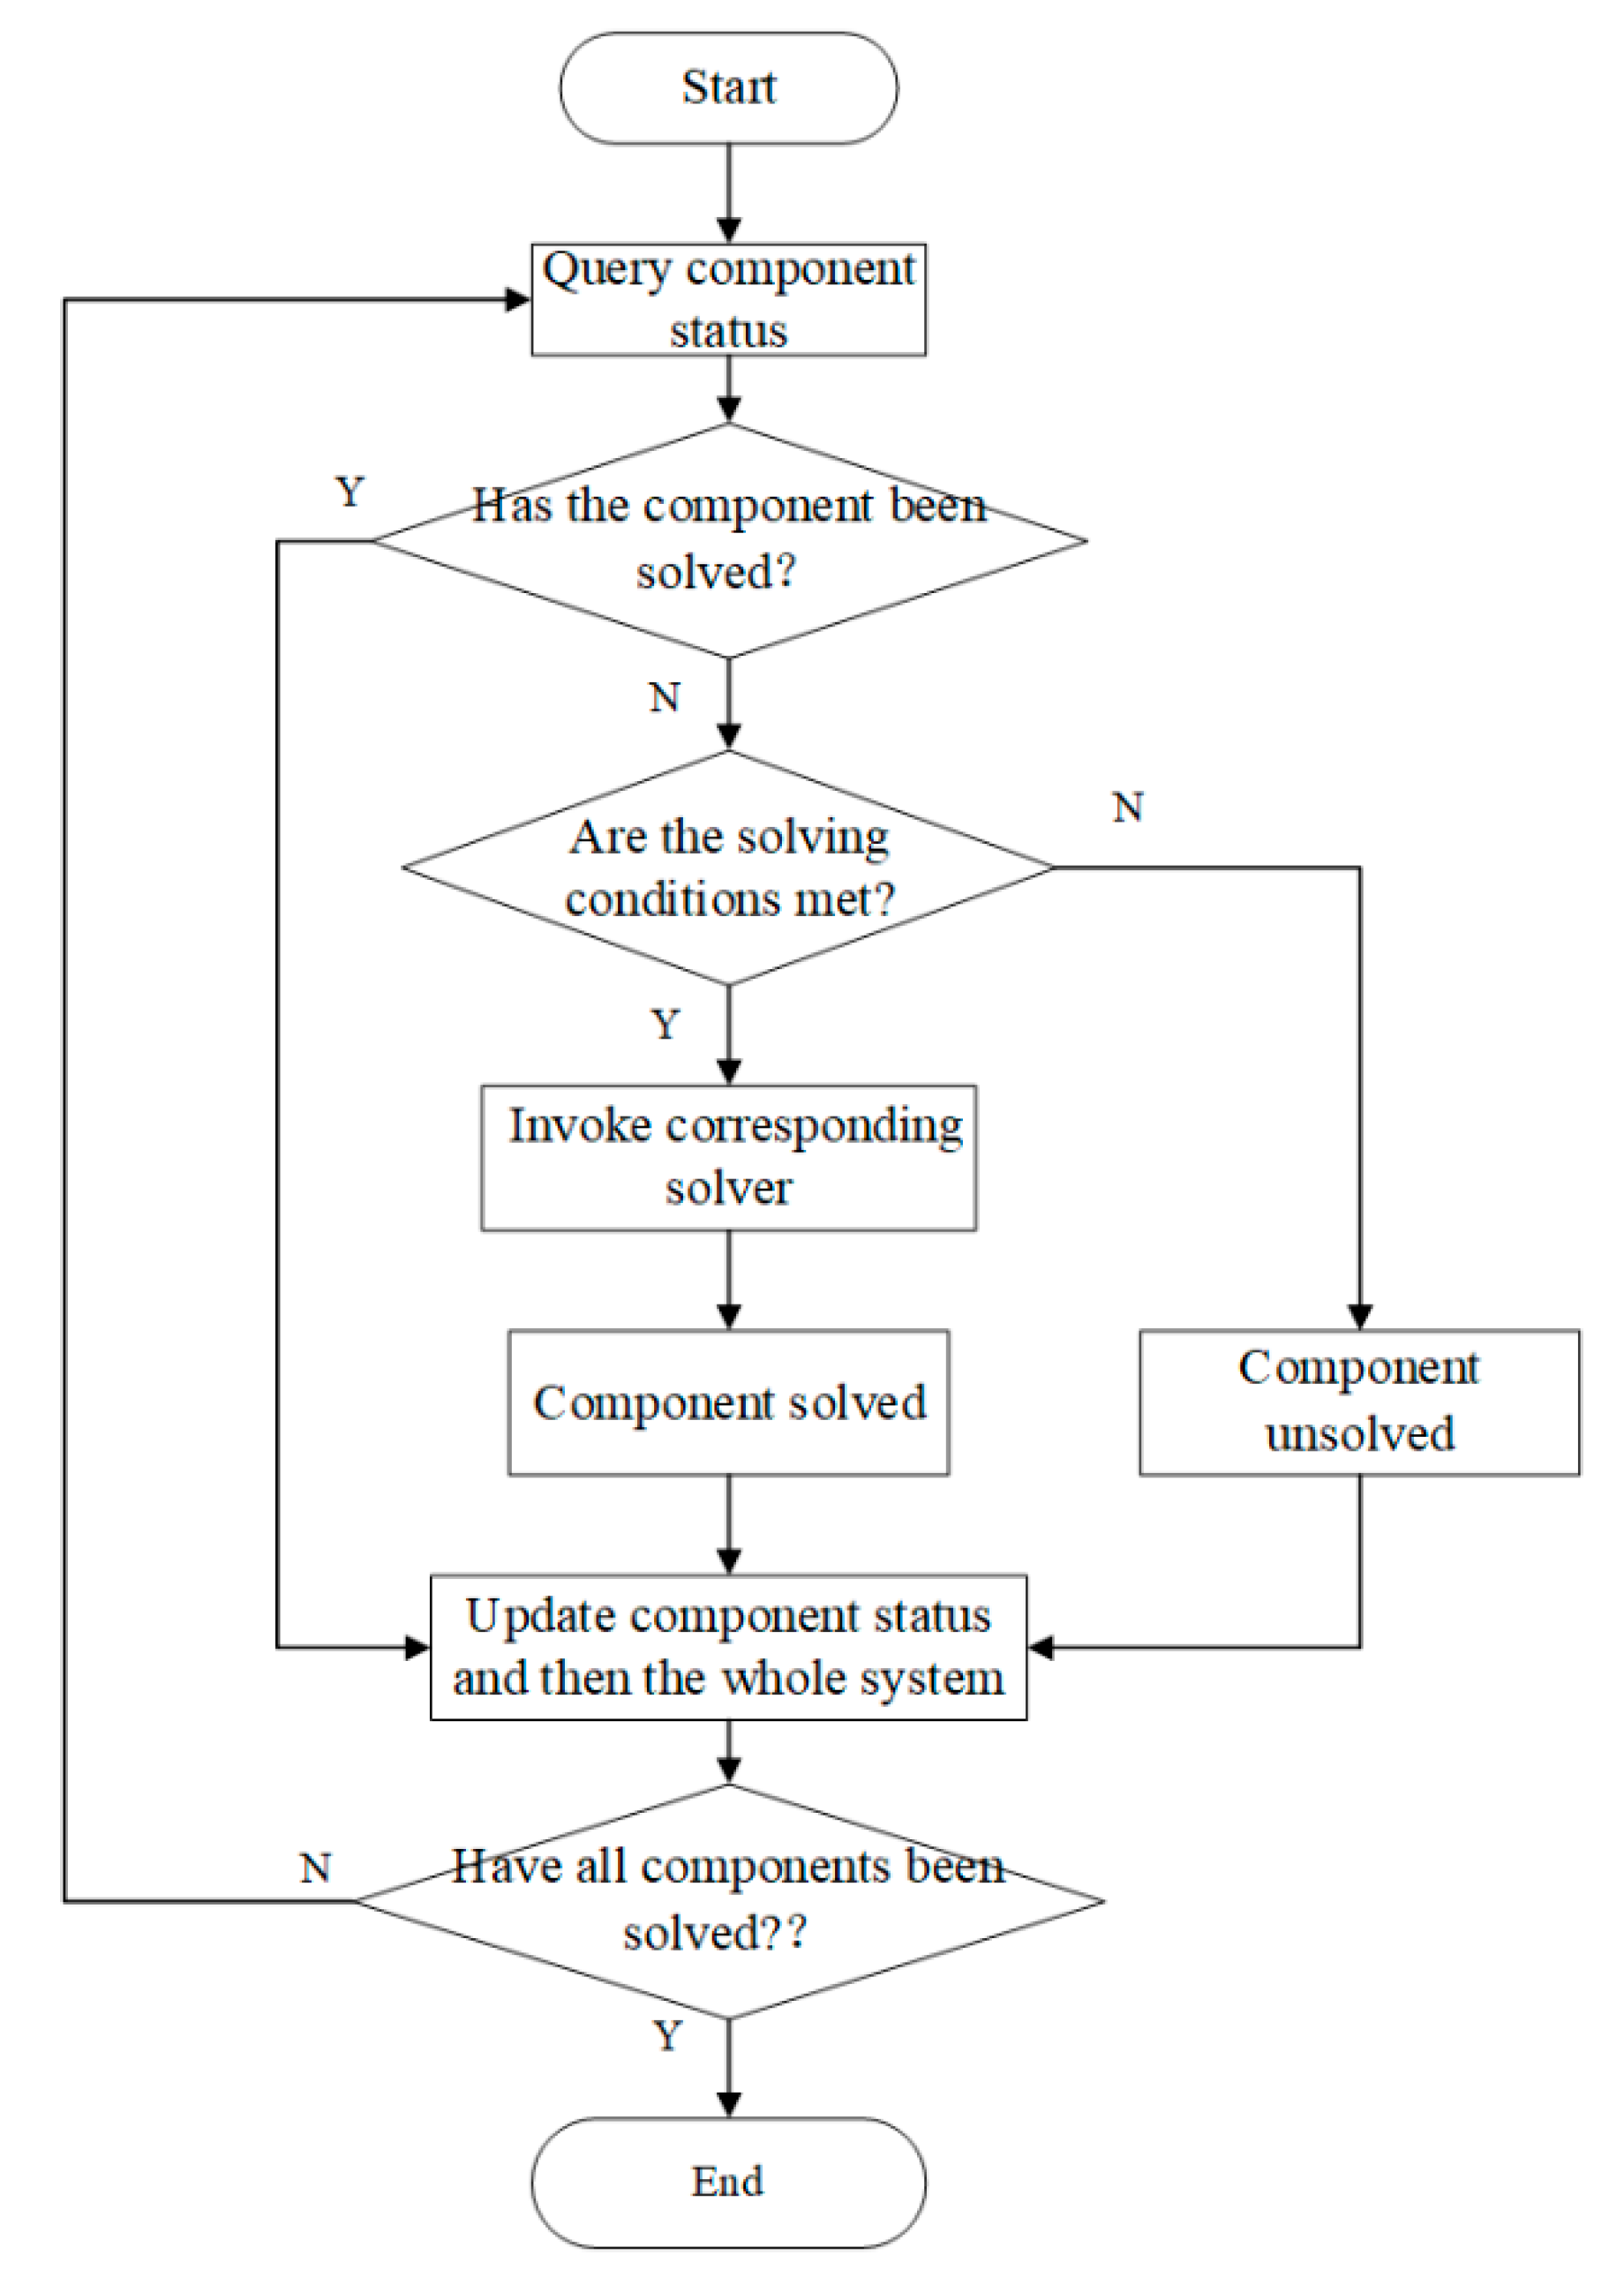
To achieve the solution of compression systems with varying aerodynamic configurations, the solver within the integrated program requires the capability to automatically determine the solving path based on the specific topology. To this end, this paper adopts a state-driven incremental solving method (as illustrated in Figure 3). During the solving process, the solver first queries the solving status of each component. For components that have not yet completed their solution, it assesses whether the current conditions meet the solving requirements specified in Table 1. Components satisfying the conditions are solved; upon completion, their status as well as the whole system is updated, and the process is re-cycled through the component status query phase until all components are solved. Through this incremental solving approach, the solver can process any arbitrary node-duct topology, thereby enabling solutions for different aerodynamic layouts.

2.2.3. Component Models

This study adopts a one-dimensional mean-line method for CDFS and HPC analysis, while employing a quasi-2D multi-streamline approach for more accurate fan performance prediction.
(a)
One-dimensional mean-line model
The mean-line method achieves rapid compressor performance evaluation by solving velocity triangles along the characteristic streamline. The method incorporates three sequential steps: (1) computation of fundamental aerodynamic parameters for the mid-span streamline, (2) efficiency correction via end-wall loss models [29,30], and (3) integration to determine overall performance characteristics. This empirical model-based simplified approach offers superior computational efficiency while maintaining prediction accuracy for high-aspect ratio multistage compressors [31].
(b)
Quasi-two-dimensional model
Unlike the HPC, the fan components in the ACE compression systems exhibit distinct low hub-to-tip ratio characteristics (typically below 0.4) and high blade tip velocities (often exceeding 500 m/s). These features result in significant radial flow gradients: the inlet Mach number at the blade tip region can reach 1.6 (supersonic regime), while the hub region remains in subsonic flow. Such strong flow non-uniformity between tip and hub regions makes conventional 1D mean-line methods inadequate for accurate whole-stage fan performance characterization using a single streamline [32,33].
As shown in Figure 4, to address these challenges, this study introduces a quasi-two-dimensional multi-streamline method [27]. This approach extends the 1D mean-line method by incorporating multiple characteristic streamlines (typically including tip/mid/hub streamlines) and employs a simple radial equilibrium equation to constrain the static pressure distribution between streamlines, enabling coupled multi-streamline solutions. Compared with conventional methods, this technique offers three key advantages: (1) simultaneous capture of both tip-region supersonic and hub-region subsonic flow characteristics; (2) computational efficiency comparable to the mean-line method; and (3) the accurate representation of radial redistribution effects during the off-design operation of low hub-to-tip ratio components. During integrated system analysis, this method significantly improves the reliability of both design-point and off-design performance predictions while maintaining exceptional computational efficiency.

2.2.4. Validation of the Integrated Analysis Methodology

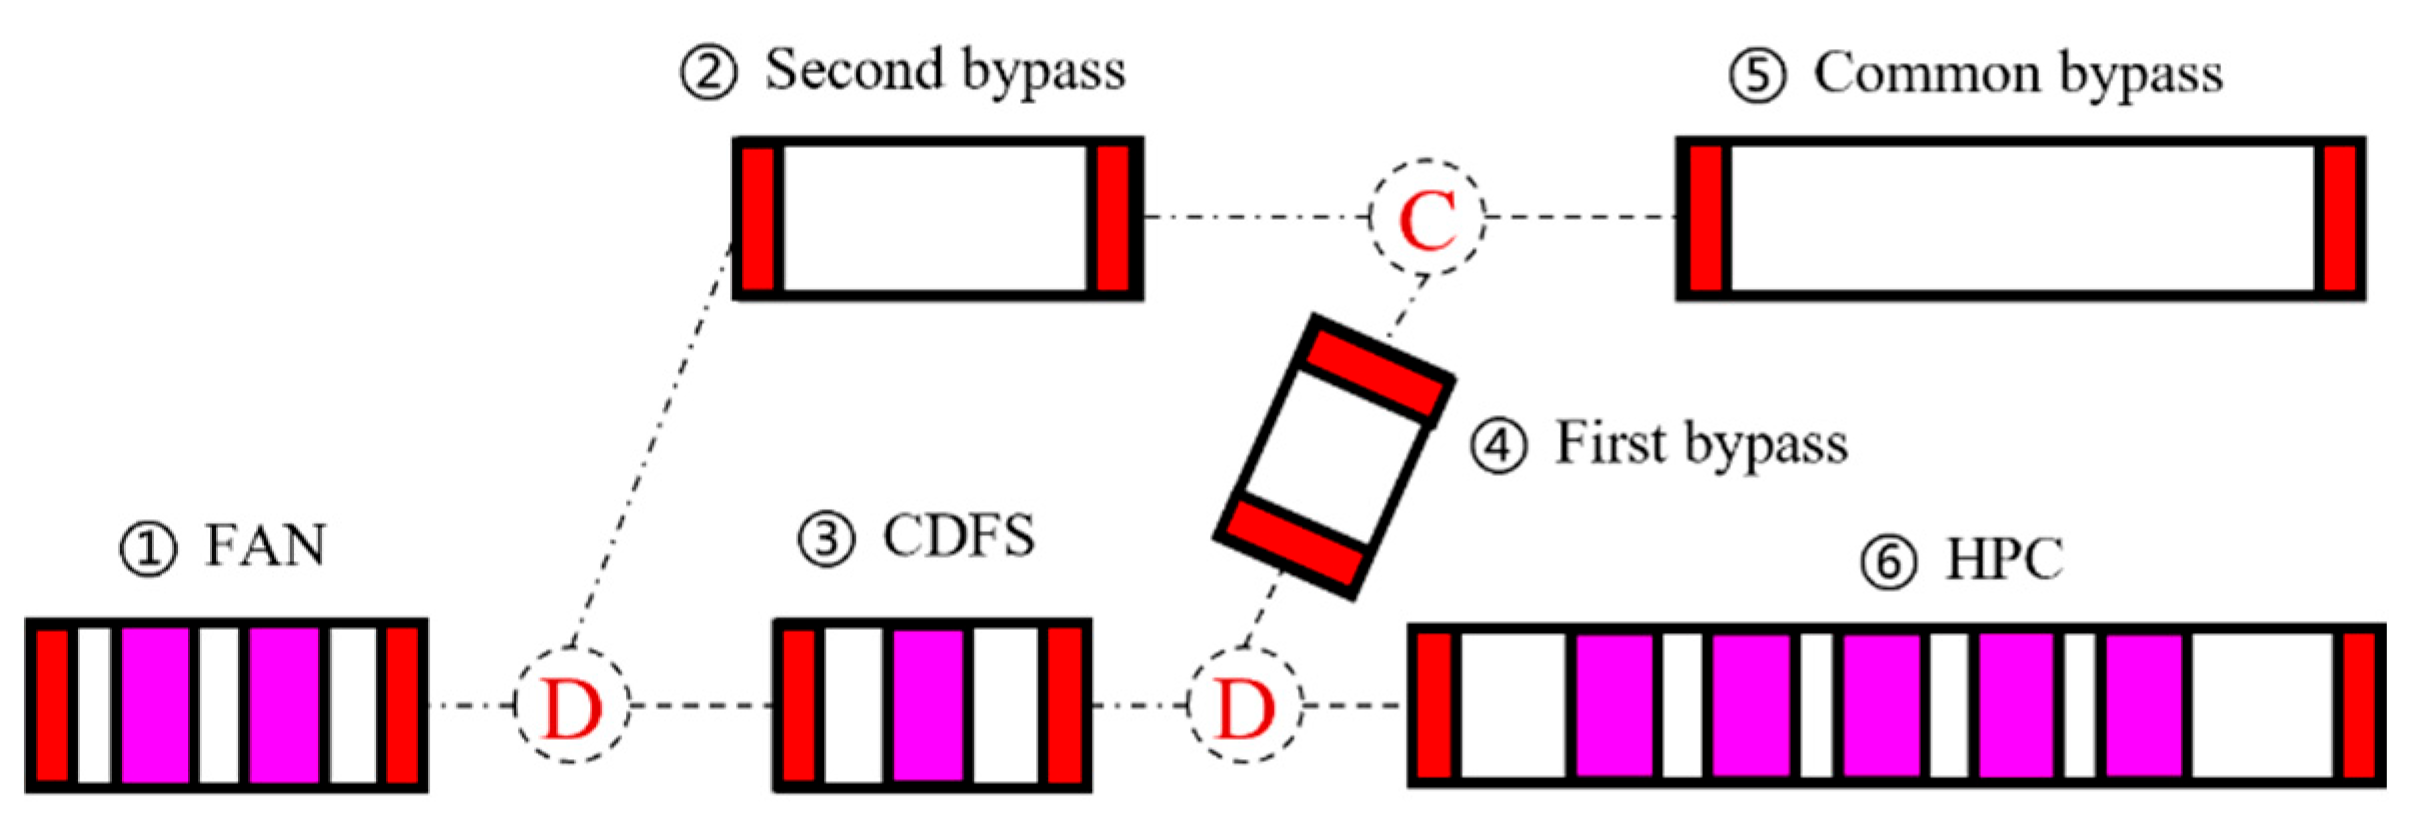
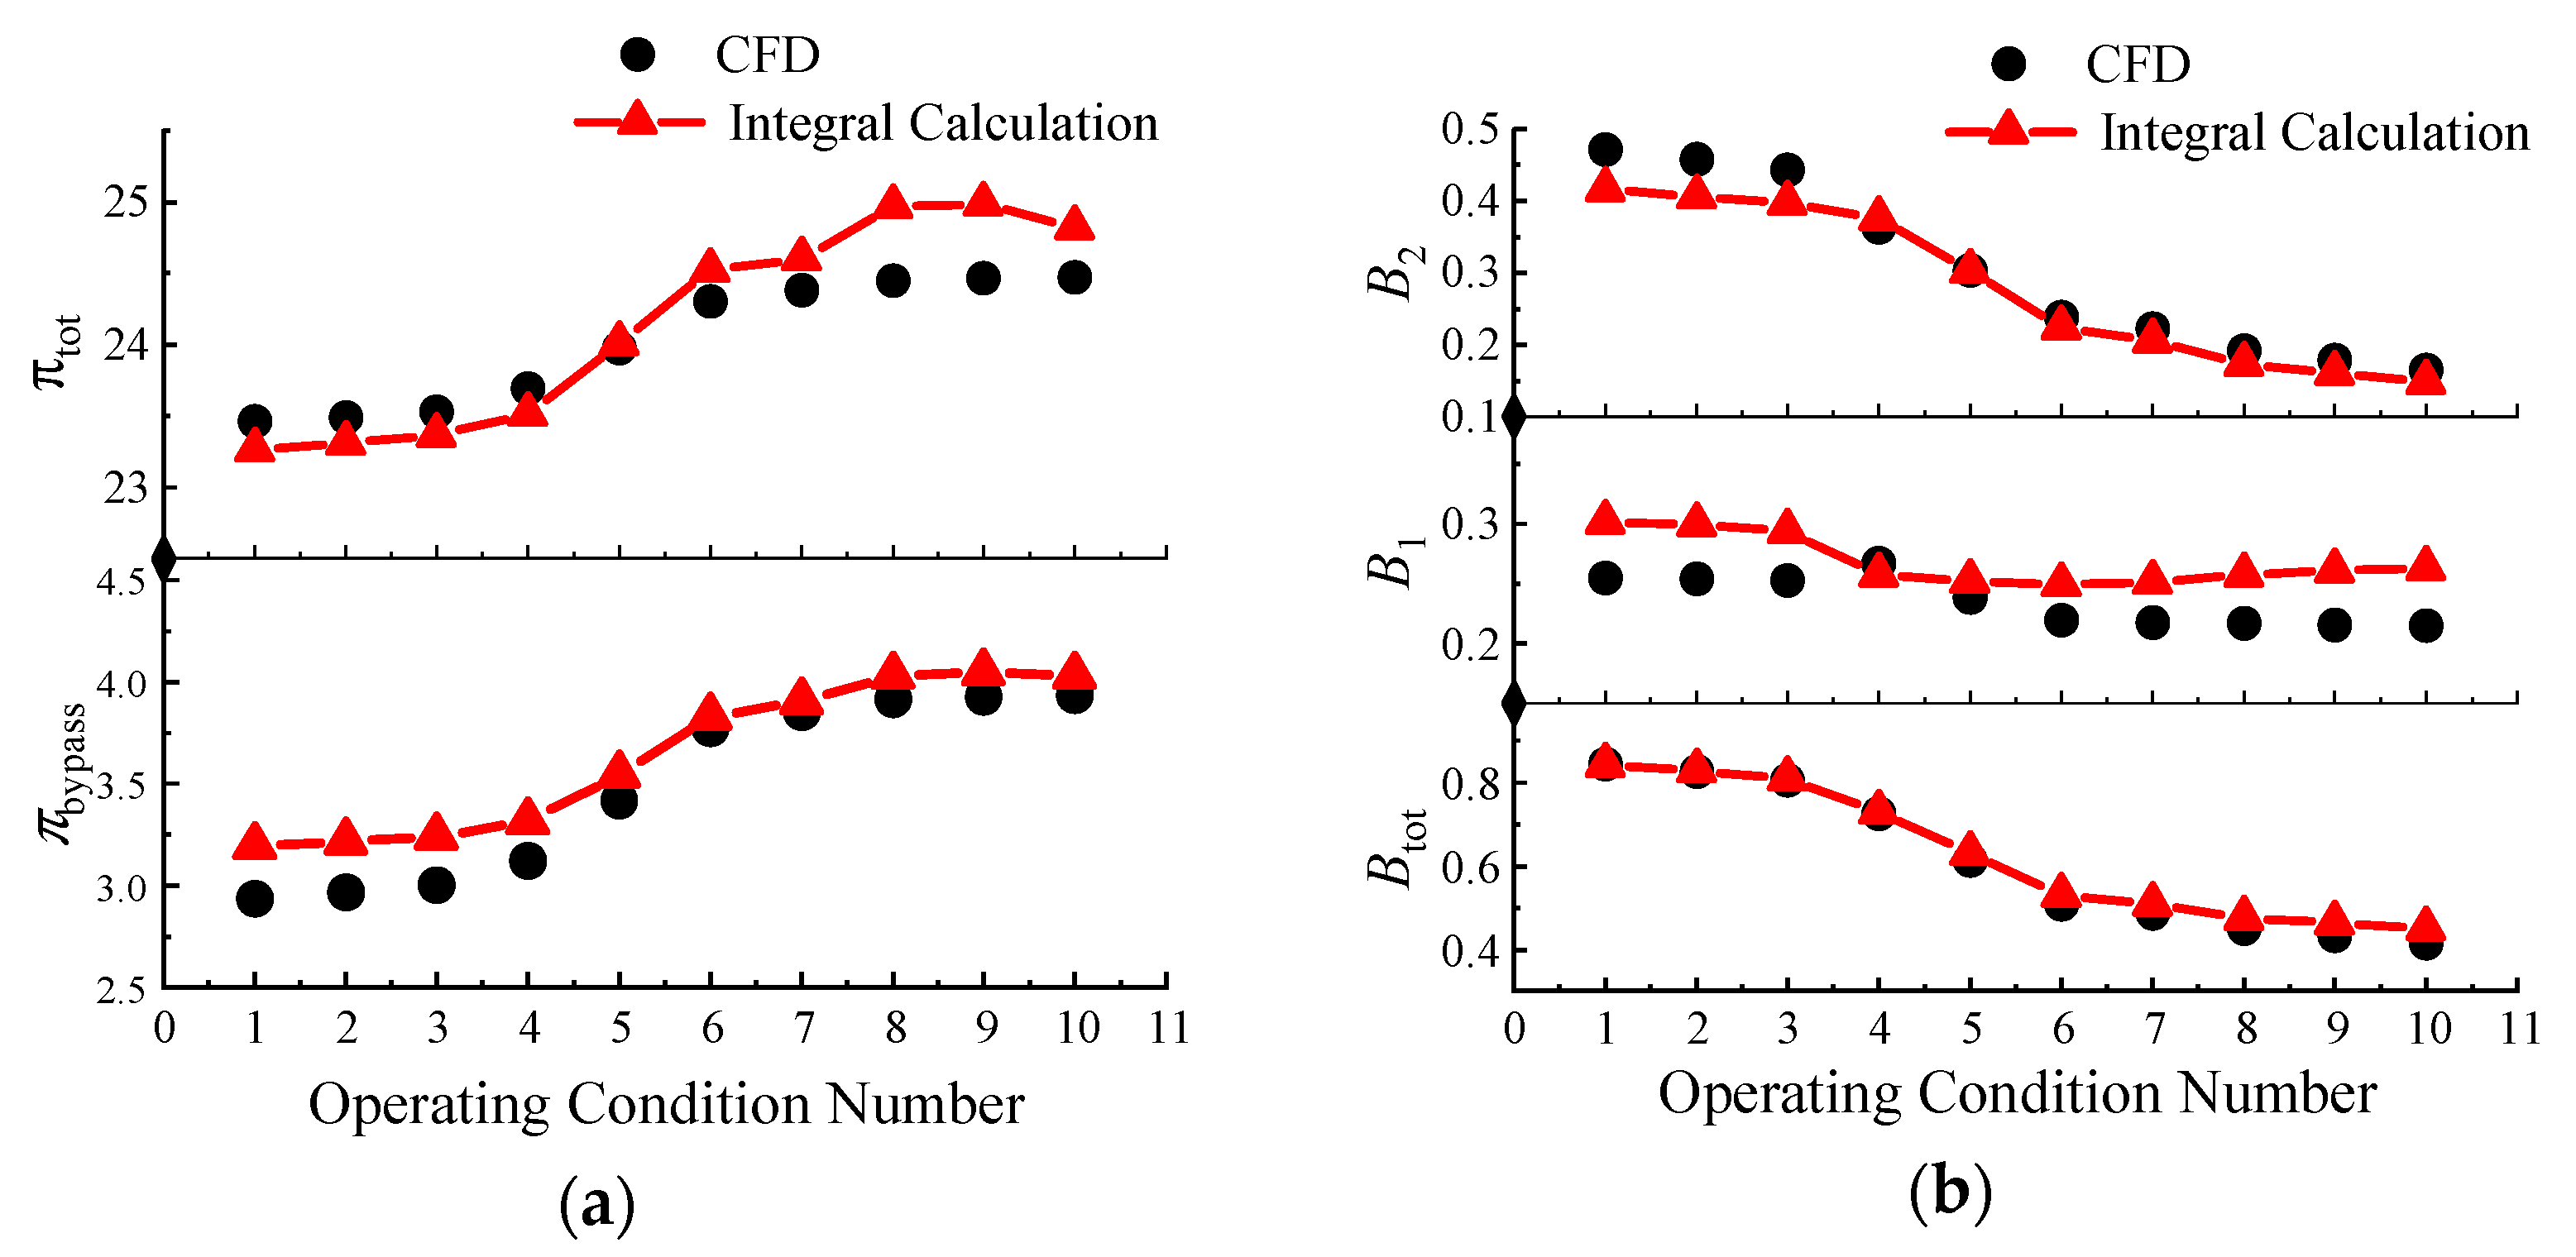
To validate the reliability of the integrated analysis method developed in this study, a double-bypass compression system was selected as the test case. The compression system adopts a three-stage serial layout comprising a two-stage fan, single-stage CDFS, and five-stage HPC [34]. Flow diverters at both the fan and CDFS outlets enable dual-bypass airflow distribution. The framework in the integrated analysis is illustrated in Figure 5. The system’s flow characteristics are characterized by three key parameters: total bypass ratio (Btot), first bypass ratio (B1), and second bypass ratio (B2). Figure 6 presents a comparative evaluation between the integrated analysis method and 3D CFD simulations across ten representative operating conditions (spanning both high and low bypass ratio regimes within the flight envelope). The comparison focuses on three key performance parameters: total pressure ratio (πtot), bypass pressure ratio (πbypass), and bypass ratios. Results demonstrate that the integrated analysis method maintains computational efficiency while accurately predicting the matching characteristics of the double bypass compression system. The close agreement with high-fidelity CFD results confirms the method’s engineering validity for variable-cycle compression system analysis. More importantly, the triple-bypass ACE compression system studied in this work evolved directly from this validated double-bypass compression system. The modifications involved scaling the first stage of the fan based on similarity theory and introducing a flow-splitting ring behind this stage to establish the third bypass. Crucially, this double-bypass compression system shares the same CDFS and HPC as the triple-bypass ACE system under investigation. Thus, the close agreement demonstrated here also confirms the reliability of the subsequent analysis performed on the triple-bypass ACE compression system.

3. The Influence of Component Matching States on Bypass Ratio Regulation Range

This section establishes the operating state of the ACE compression system listed in Table 2 as the datum point. Within the feasible operating range of each component, the impact of changes in the matching state of individual components on each bypass ratio and the feasible operating zone of the compression system is examined using the control variable method. Key influencing factors analyzed include the SMFFAN, the stall margin of the RFAN (SMRFAN), the stall margin of the CDFS (SMCDFS), the stall margin of the HPC (SMHPC), the rotational speeds of the high-pressure (HP) and low-pressure (LP) shafts, and the VIGV angle of the CDFS.

3.1. Analysis of Influencing Factors on the Bypass Ratio

In a triple-bypass ACE compression system, the bypass ratios are typically influenced by multiple compression components due to the coupling between the bypass ducts and components. To reveal the mechanism by which the matching states of components affect the bypass ratio regulation range, it is essential to first identify and analyze the factors that influence the bypass ratios.
(a)
Third bypass ratio
Equation (1) shows that B3 is determined by FFAN,phy and RFAN,phy. The FFAN inlet condition is the standard atmosphere, with standard atmospheric pressure P0 and standard atmospheric temperature T0. Thus, for the FFAN
N FFAN , cor = N FFAN , phy
m ˙ FFAN , phy = m ˙ FFAN , cor
while for the RFAN, it can be derived from similarity theory that:
N RFAN , cor = N RFAN , phy T RFAN , in / T 0
m ˙ RFAN , phy = m ˙ RFAN , cor P RFAN , in / P 0 T RFAN , in / T 0
Assuming the flow is radially uniform and ignoring losses during the diversion process, the FFAN outlet total pressure and temperature are conserved at the RFAN inlet:
T RFAN , in = T FFAN , out P RFAN , in = P FFAN , out
therefore
P RFAN , in / P 0 = π FFAN T RFAN , in / T 0 = τ FFAN
substituting Equation (10) into Equation (7) and Equation (8), respectively, yields
N RFAN , cor = N RFAN , phy τ FFAN
m ˙ RFAN , phy = m ˙ RFAN , cor π FFAN τ FFAN
where N is the rotational speed, τ and π are the total temperature ratio and total pressure ratio, respectively. The subscripts “cor” denote corrected parameters under standard atmospheric conditions, while “in” and “out” designate the component inlet and outlet stations, respectively. For each compression component, the corrected flow scaling factor δ, defined as the ratio of inlet to outlet corrected mass flow rate, is given by
δ = m ˙ cor , in m ˙ cor , out
According to the continuity equation (law of mass conservation), the physical mass flow rate at the compressor inlet equals that at the outlet. Applying similarity theory yields the following relationship between the inlet and outlet corrected mass flow rates:
δ = P 0 / P in T 0 / T in / P 0 / P out T 0 / T out = π τ  
To enhance clarity in thermodynamic analysis, expressed in terms of efficiency instead of temperature ratio:
δ = 1 1 η   π 1 + 1 k + 1 1 η 1 π 2
where η denotes efficiency and k is the specific heat ratio. Equation (12) can then be expressed as
m ˙ RFAN , phy = m RFAN , cor δ FFAN
substituting Equations (6) and (16) into Equation (1), yields
B 3 = m ˙ FFAN , cor m ˙ RFAN , cor 1 δ FFAN 1
Figure 7a presents the contour map depicting variations in δ with pressure ratio and efficiency. As shown, δ increases with rising pressure ratio but decreases with higher efficiency. The parameter δ is predominantly influenced by pressure ratio, while efficiency exerts a secondary effect that diminishes as the pressure ratio increases, though always remaining minimal. For the single-stage compressors (FFAN, RFAN, and CDFS) in the triple bypass ACE compression system, where maximum achievable pressure ratios are approximately 2, a 5% reduction in efficiency corresponds to merely a 0.57% decrease in δ. Figure 7b displays the absolute ratio of δ’s pressure ratio sensitivity (Sπ) to efficiency sensitivity (Sη). Within the operational range of single-stage compressors, |Sπ| exceeds |Sη| by more than eightfold. Therefore, the influence of efficiency on δ can be neglected; and δ is positively correlated with the pressure ratio. This implies that along a constant speed line, δ always decreases as the stall margin increases. According to Equation (17), the bypass ratio is determined by FFAN,cor, RFAN,cor, and δFFAN. When the current operating point of the FFAN is established, both FFAN,cor and δFFAN remain constant. B3 is only related to RFAN,cor. When the RFAN operates near stall conditions, the corrected flow rate is at its minimum, and the bypass ratio reaches its maximum (MaxB). Conversely, the bypass ratio is at its minimum (MinB). The range between the two represents the regulation range of the bypass ratio at this operating point of FFAN.
(b)
Second bypass ratio
Similarly to the third bypass, the second bypass can be analyzed using the same analytical approach, leading to the derivation of its relationships. For the CDFS, as with the RFAN, it can be derived from similarity theory that
N CDFS , cor = N CDFS , phy T CDFS , in / T 0
m ˙ CDFS , phy = m ˙ CDFS , cor P CDFS , in / P 0 T CDFS , in / T 0
while the FFAN and the RFAN are both upstream of the CDFS:
P CDFS , in / P 0 = π FFAN π RFAN T CDFS , in / T 0 = τ FFAN τ RFAN
Substituting Equation (20) into Equation (18) and Equation (19), respectively, yields
N CDFS , cor = N CDFS , phy τ FFAN τ RFAN
m ˙ CDFS , phy = m ˙ C D F S , c o r π FFAN τ FFAN π RFAN τ RFAN
With the δ defined in Equation (14)
m ˙ CDFS , phy = m ˙ C D F S , c o r δ FFAN δ RFAN
Combining Equations (16) and (23) with Equation (2) leads to
B 2 = m ˙ RFAN , cor m ˙ CDFS , cor δ RFAN 1
It is evident from Equation (23) that the influence mechanism of the RFAN on B2 parallels that of the FFAN on B3 (as described in Section 3.1 (a)). Although parameters related to the front fan do not appear in Equation (23), the total outlet temperature of the FFAN will directly affect the NRFAN,cor and NCDFS,cor, thereby altering their corrected flow rates and consequently impacting B2. However, since the influence of the front fan on the corrected flow rates of both components is convergent, according to Equation (23), the effects of the two will offset each other. Given that the CDFS and the RFAN are located on different shafts, changing the physical rotational speed of either shaft will independently alter its corrected rotational speed, which will in turn have a significant influence on B2.
(c)
First bypass ratio
Equation (3) indicates that B1 is determined by CDFS,phy and HPC,phy. Based on the preceding analysis and derivation logic, the following relationships are obtained:
N HPC , cor = N HPC , phy T HPC , in / T 0
m ˙ HPC , phy = m ˙ HPC , cor P HPC , in / P 0 T HPC , in / T 0
P HPC , in / P 0 = π FFAN π RFAN π CDFS T HPC , in / T 0 = τ FFAN τ RFAN τ C D F S
Substituting Equation (27) into Equation (25) and Equation (26), respectively, yields
N HPC , cor = N HPC , phy τ CDFS τ RFAN τ FFAN
m ˙ HPC , phy = m ˙ HPC , c o r π FFAN τ FFAN π RFAN τ RFAN π CDFS τ CDFS
With the δ defined in Equation (14)
m ˙ HPC , phy = m ˙ HPC , cor δ FFAN δ RFAN δ CDFS
Incorporating Equations (30) and (23) into Equation (3) yields
B 1 = m ˙ CDFS , cor m ˙ HPC , cor δ CDFS 1
From Equation (30), it is clear that B1 shares similarities with B2 (as analyzed in Section 3.1 (b)). Although the FFAN, RFAN, and CDFS are all located upstream of the first bypass splitter, only the CDFS—adjacent to the splitter ring—can directly influence B1. The FFAN or RFAN can only indirectly alter B1 by changing NCDFS,cor and NHPC,cor.
(d)
Total bypass ratio
As indicated by Equation (4), the relationship between the total bypass ratio and the individual bypass ratios is derived from Equations (1)–(3):
B tot = 1 + B 3 1 + B 2 1 + B 1 1
substituting Equations (17), (24) and (31) into Equation (32) gives
B tot = m ˙ FFAN , cor m ˙ HPC , cor 1 δ FFAN δ RFAN δ CDFS
According to Equation (33), for components such as the RFAN and CDFS, Btot is related exclusively to their δ parameter and is independent of their mass flow rates. An increase in mFFAN,cor, a decrease in mHPC,cor, and a decrease in δFFAN, δRFAN, and δCDFS will collectively lead to an increase in Btot.

3.2. Influence of Component Matching State on the Bypass Ratio

According to the above analysis, this section will systematically investigate the influence of the matching state of each compression component on the regulation range of the bypass ratios for the studied triple-bypass compression system.

3.2.1. FFAN Matching State

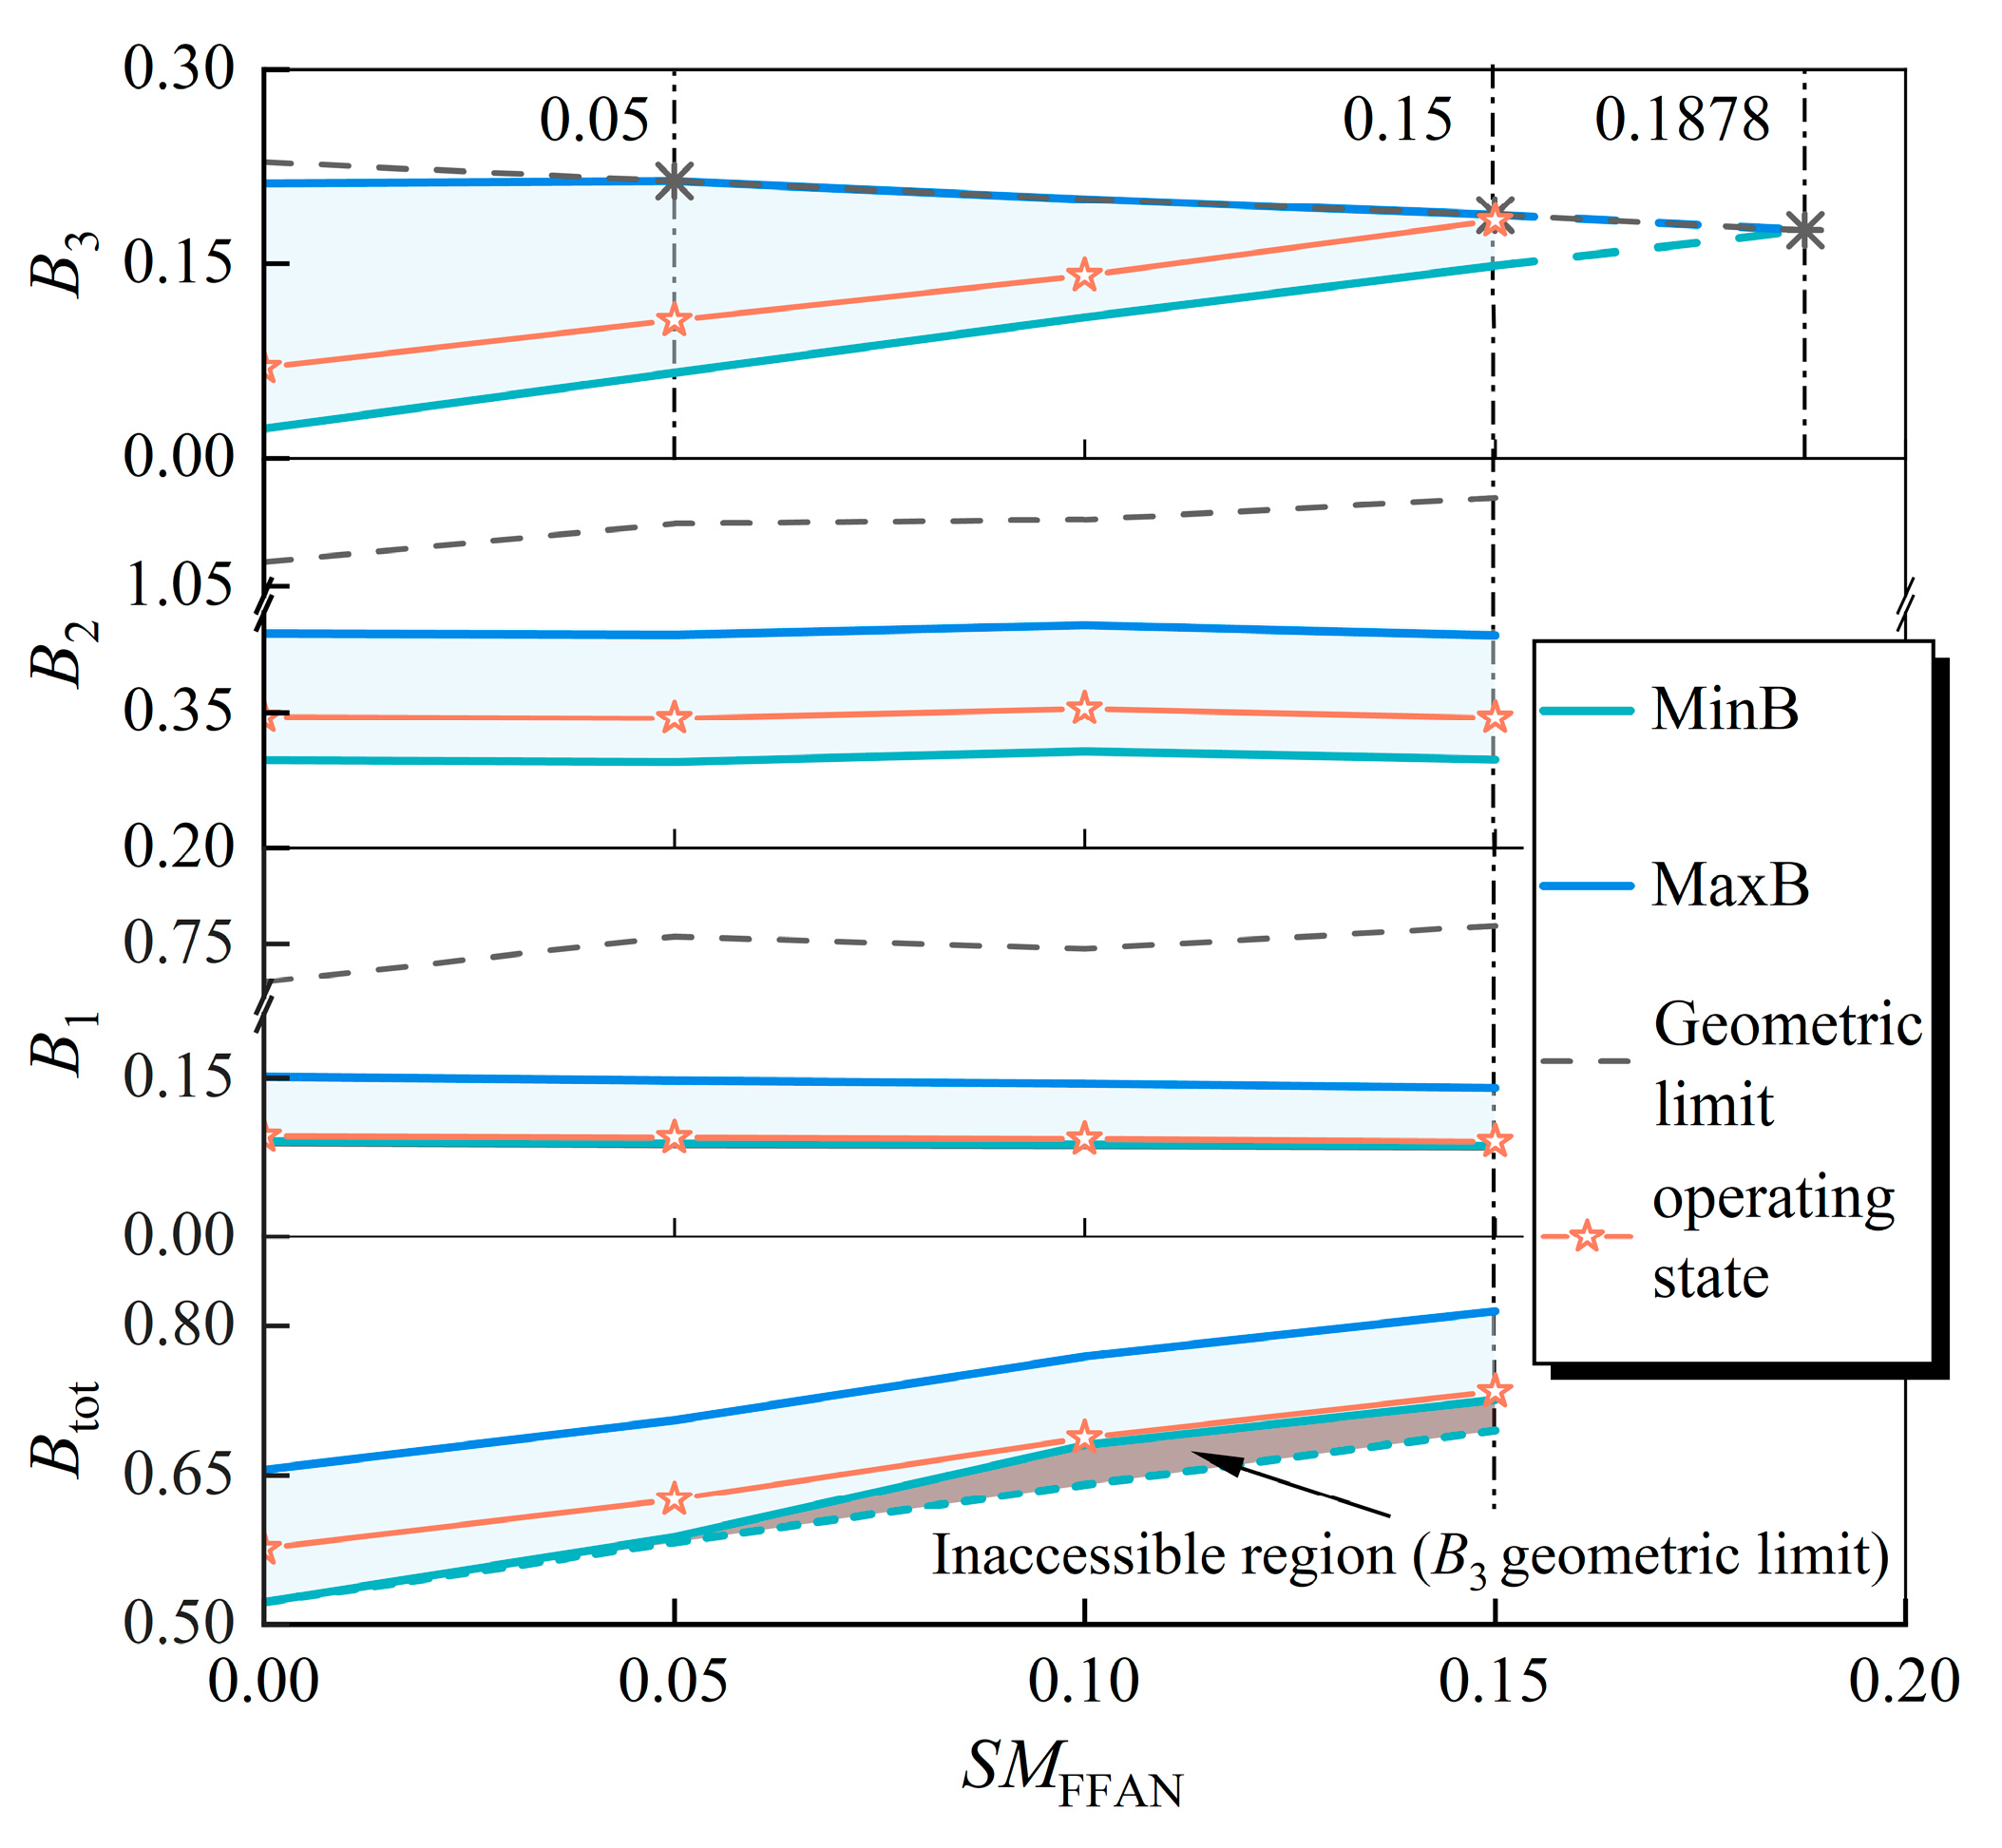
FFAN is located at the most upstream position in the compression system. Its operating state affects all downstream bypasses and components, thereby influencing the bypass ratios of each bypass duct. To isolate the impact, Figure 8 presents the trends of the B3, B2, B1, and Btot with the variation SMFFAN; the other control parameters are kept constant. The geometric limit in the figure refers to the maximum value that the bypass ratio can achieve when the bypass is choked [34]. This can be derived from the Mach number at the throat of the bypass (Mao) and the current bypass ratio (B):
B m a x = 1 q M a o / B + q M a o 1
It can be observed from Figure 8 that as SMFFAN changes, B1, B2, and their regulation ranges remain essentially unchanged. This indicates that components downstream of the FFAN, such as the RFAN, CDFS, and HPC, are insensitive to the match state of the FFAN. Therefore, when SMFFAN changes, the feasible operating ranges and characteristics of the downstream components remain unchanged. Consequently, B1 and B2 remain largely constant, while B3 increases overall due to the increase in FFAN,cor. When SMFFAN reaches 15%, the upper limit of the regulation range for B3 no longer increases upon hitting the bypass geometric limit, while the lower limit continues to rise, resulting in a continuous reduction in the bypass ratio regulation range. When SMFFAN exceeds 18.75%, the lower limit of the regulation range for B3 also reaches the bypass geometric limit. Under this condition, the compression system cannot simultaneously satisfy both component matching and duct matching, rendering the compression system inoperable.
As shown by the matching state indicated by the orange dashed line with a pentagram in Figure 8, while B1 and B2 remain essentially unchanged, B3 increases with SMFFAN, driving an overall increase in Btot. When B3 reaches its maximum state, RFAN operates at the minimum margin, causing δRFAN to peak. According to Equation (33), this results in Btot being at its minimum state. That is, the upper boundary of the B3 regulation range corresponds to the lower boundary of the Btot regulation range. Therefore, the lower limit of the Btot regulation range will also be constrained by the bypass geometric limit, leading to a reduction in the overall regulation range.

3.2.2. RFAN Matching State

The matching state of the RFAN affects the downstream CDFS and HPC, thereby influencing B1 and B2. Figure 9 illustrates the trends of B2, B1, and Btot as SMRFAN varies. As SMRFAN increases, the regulation range of B2 experiences an increase overall, while its regulation range remains unchanged. In contrast, B1 is largely unaffected by changes in SMRFAN. Meanwhile, Btot also shows an overall increase, although its regulation range does not exhibit significant changes. The underlying principle is similar to that of the FFAN: it stems from the insensitivity of the characteristics of downstream components (CDFS and HPC) to changes in the RFAN matching state.

3.2.3. CDFS Matching State

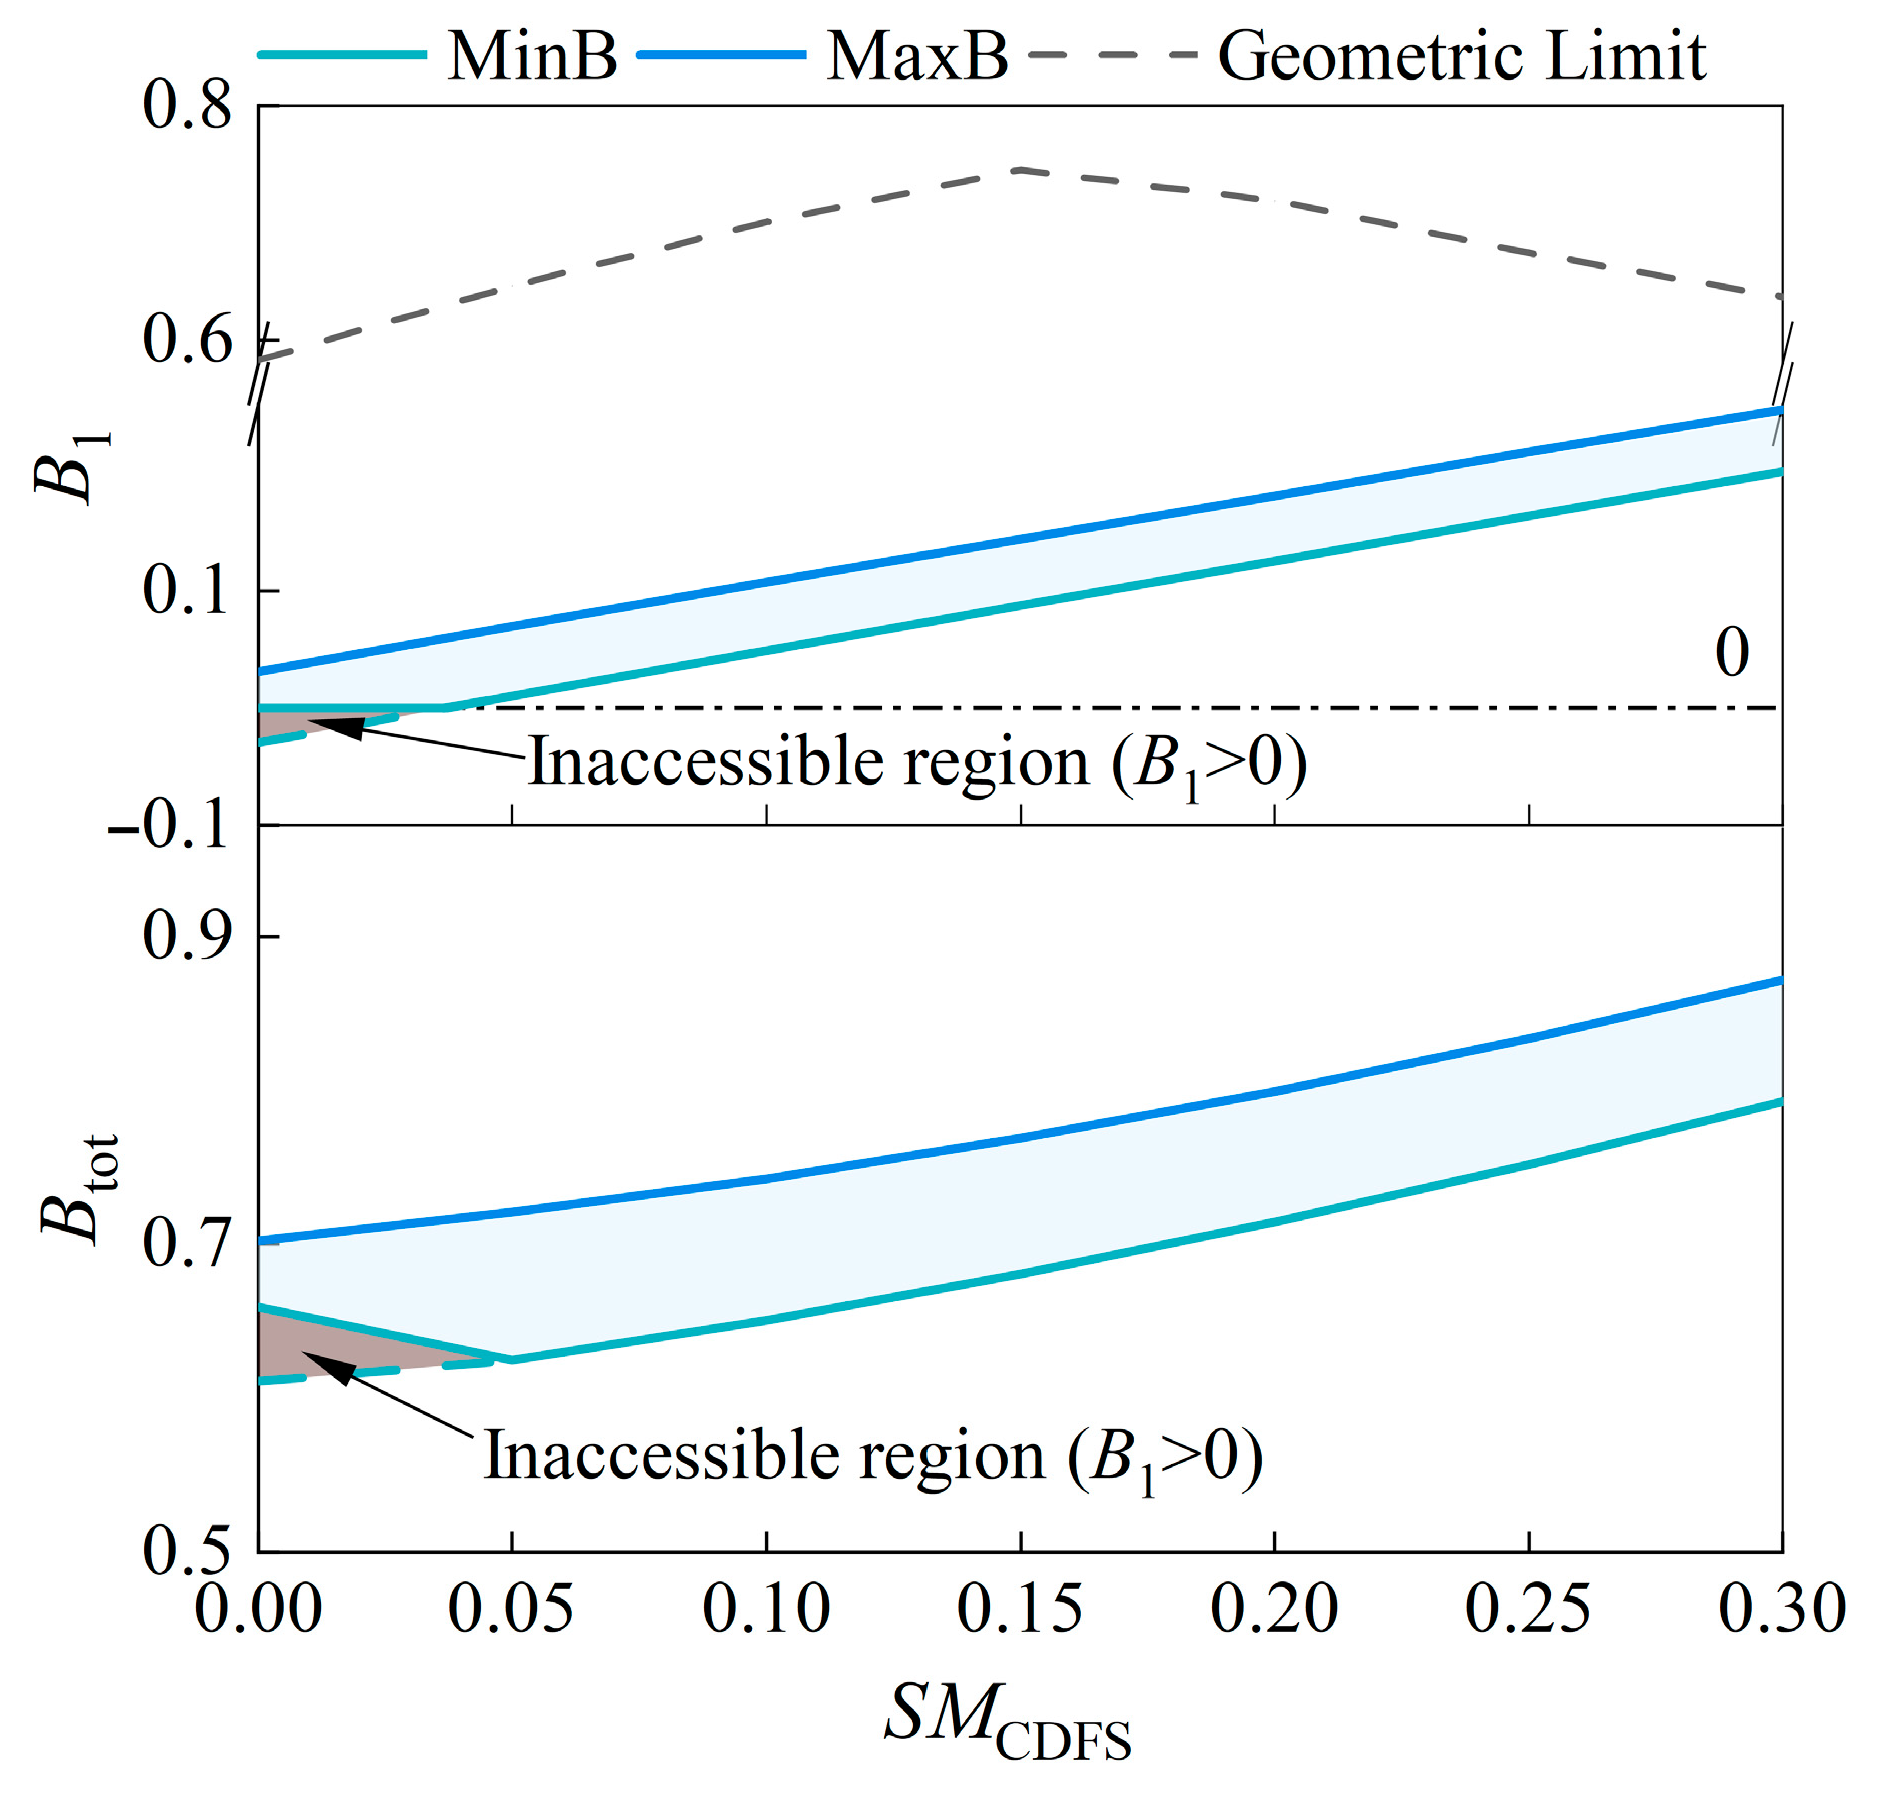
The influence of changes in the CDFS matching state on the regulation range of B1 and Btot is shown in Figure 10. Since the stable operating range of the HPC is insensitive to variations in SMCDFS, as SMCDFS increases, B1 increases overall, while its regulation range remains unchanged until near stall. The regulation range of B1 is reduced due to the reverse flow limitation at the second bypass [30]. Since B3 and B2 remain unchanged during this process, Btot follows the same trend as B1, increasing with SMCDFS.

3.3. Influence of Rotational Speed on the Bypass Ratio

The matching operational speeds of the HP and LP shafts will affect the characteristics of various components, which in turn will influence the bypass ratios. The following analysis will examine the patterns of these impacts.

3.3.1. LP Shaft Speed

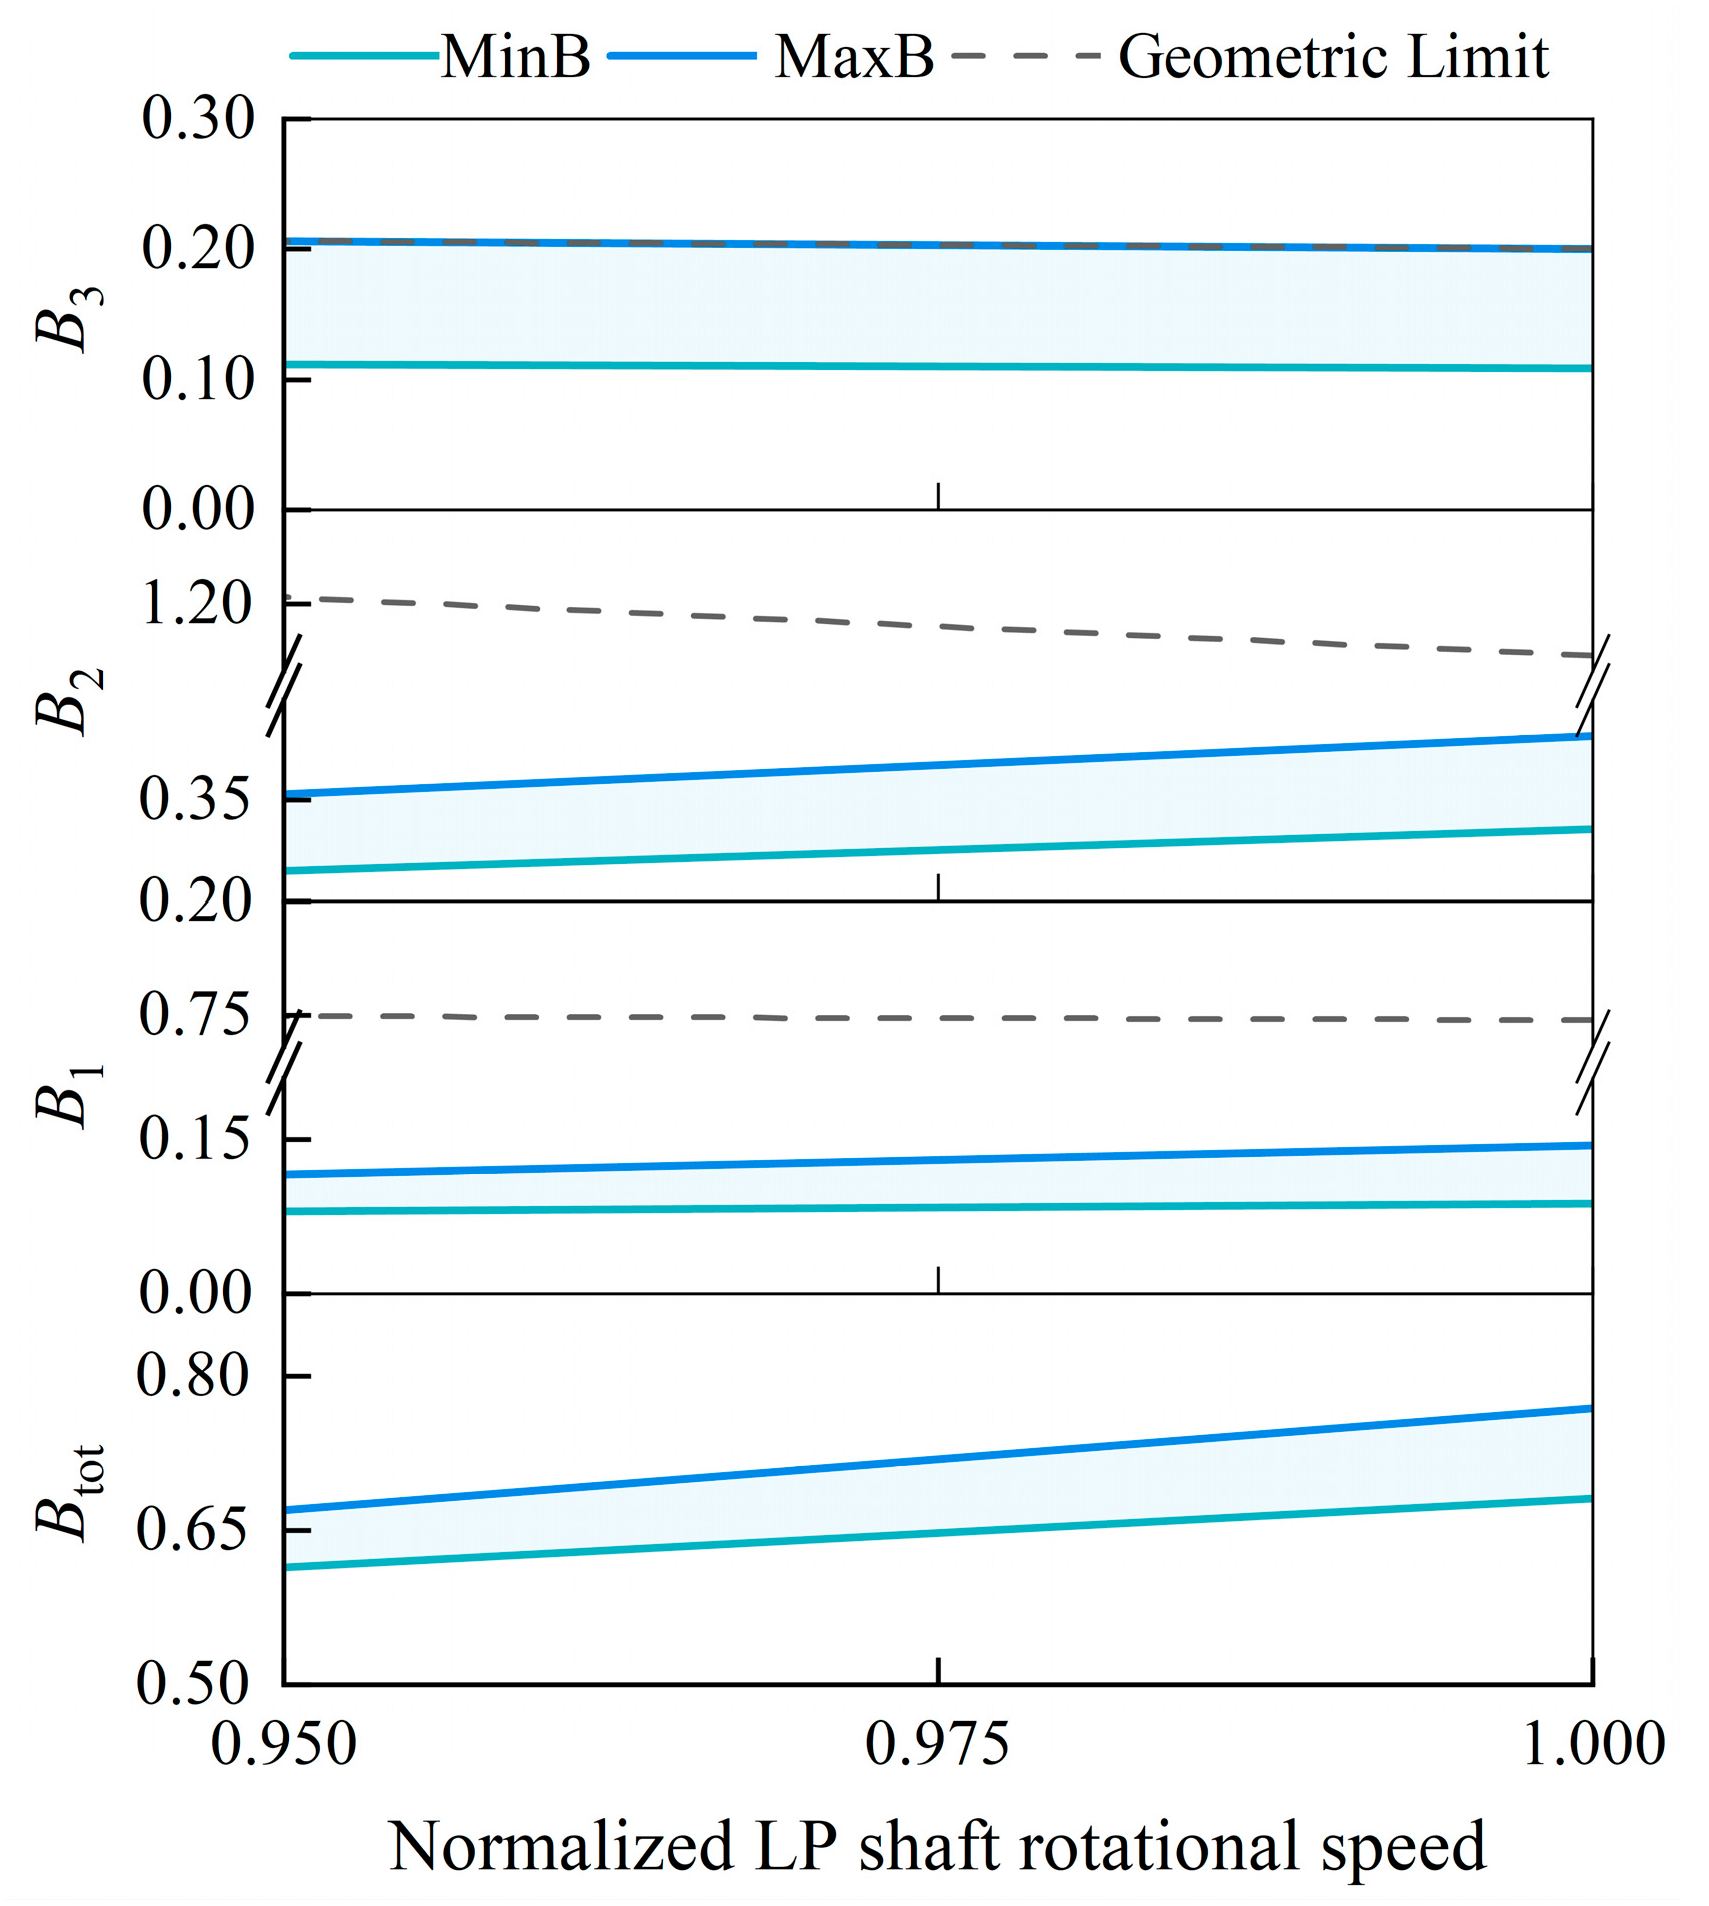
Keeping the matching margin of each component constant, the LP shaft matching speed, normalized by its design value, was reduced to 0.95. It cannot be further reduced because this would cause severe overspeed of the HP shaft. The variations of B3, B2, B1, and Btot are shown in Figure 11. During the reduction in the LP shaft speed, the maximum B3 remains constrained by the bypass geometric limit. It can be observed from Figure 11 that as the LP shaft speed decreases, the upper limit of B3 remains consistent with the bypass geometric limit, showing minimal change, while its lower limit also exhibits little variation. Consequently, the regulation range of B3 remains nearly unchanged throughout this process. In contrast, the B3 ranges of both B2 and B1 gradually decrease. This is manifested by simultaneous reductions in both their upper and lower limits, but the upper limit decreases faster. The reason for this phenomenon is that reducing the LP shaft speed diminishes the work capability and flow capacity of both the front and rear fans. Consequently, the CDFS and HPC operate at higher corrected speeds, enhancing their flow capacities and leading to a decrease in B2. In this configuration, the HPC experiences a greater increase in flow capacity than the CDFS, resulting in a corresponding reduction in B1. Additionally, the elevated corrected speeds reduce the stable operating ranges of both components. Hence, the regulation ranges of B1 and B2 contract. Collectively, these effects cause Btot to decrease as the LP shaft speed is reduced, accompanied by a narrowing of its regulation range.

3.3.2. HP Shaft Speed

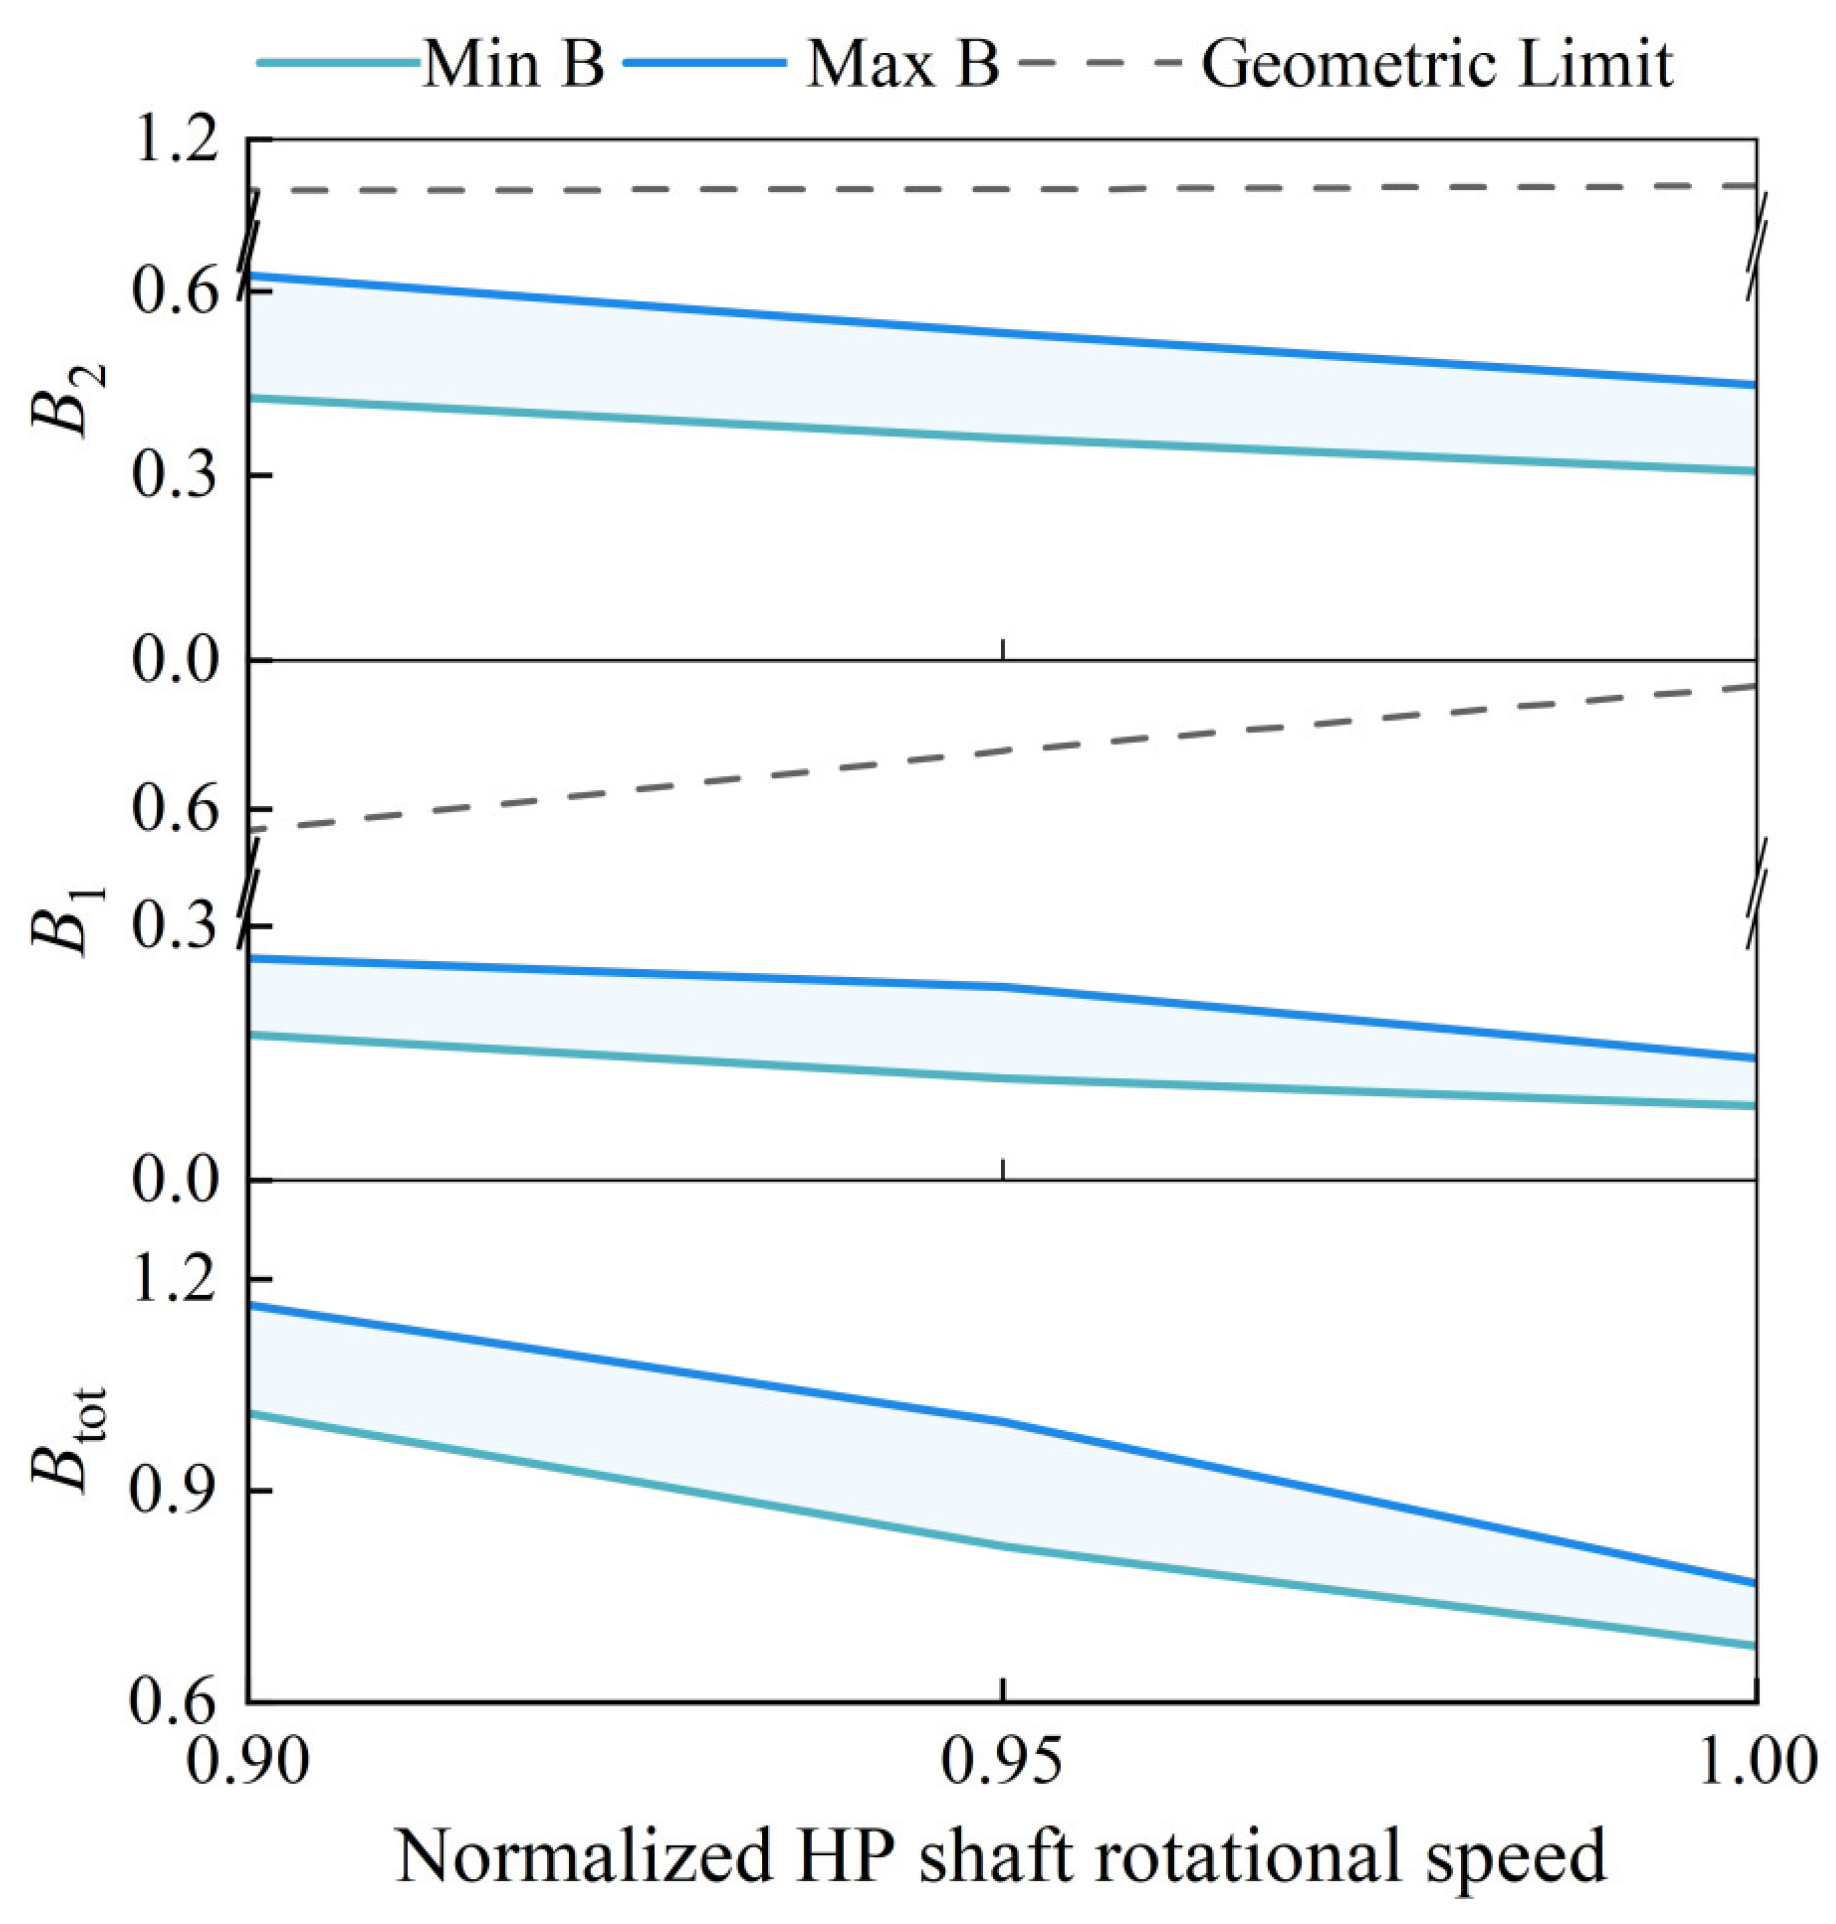
Keeping the matching margin of each component, the LP shaft matching speed, and the CDFS inlet pre-swirl angle constant, the HP shaft matching speed, normalized by its design value, was reduced to 0.95 and 0.90 to study its impact on the regulation range of B3, B2, B1, and Btot. Since changing the HP shaft speed does not affect the matching state of the front and rear fans, B3 remains unchanged. Therefore, the focus here is exclusively on the trends of B2, B1, and Btot. As shown in Figure 12, as the HP shaft speed decreases, the flow capacity of both CDFS and HPC decreases, while their stable operating range increases. Consequently, both B1 and B2, as well as their regulation ranges, increase simultaneously. Under the combined influence of the changes in B1 and B2, Btot also exhibits an overall increase and a wider regulation range. Moreover, compared to the changes in B1 and B2, the variation in Btot shows a more pronounced trend.

3.4. Influence of CDFS VIGV Angle on the Bypass Ratio

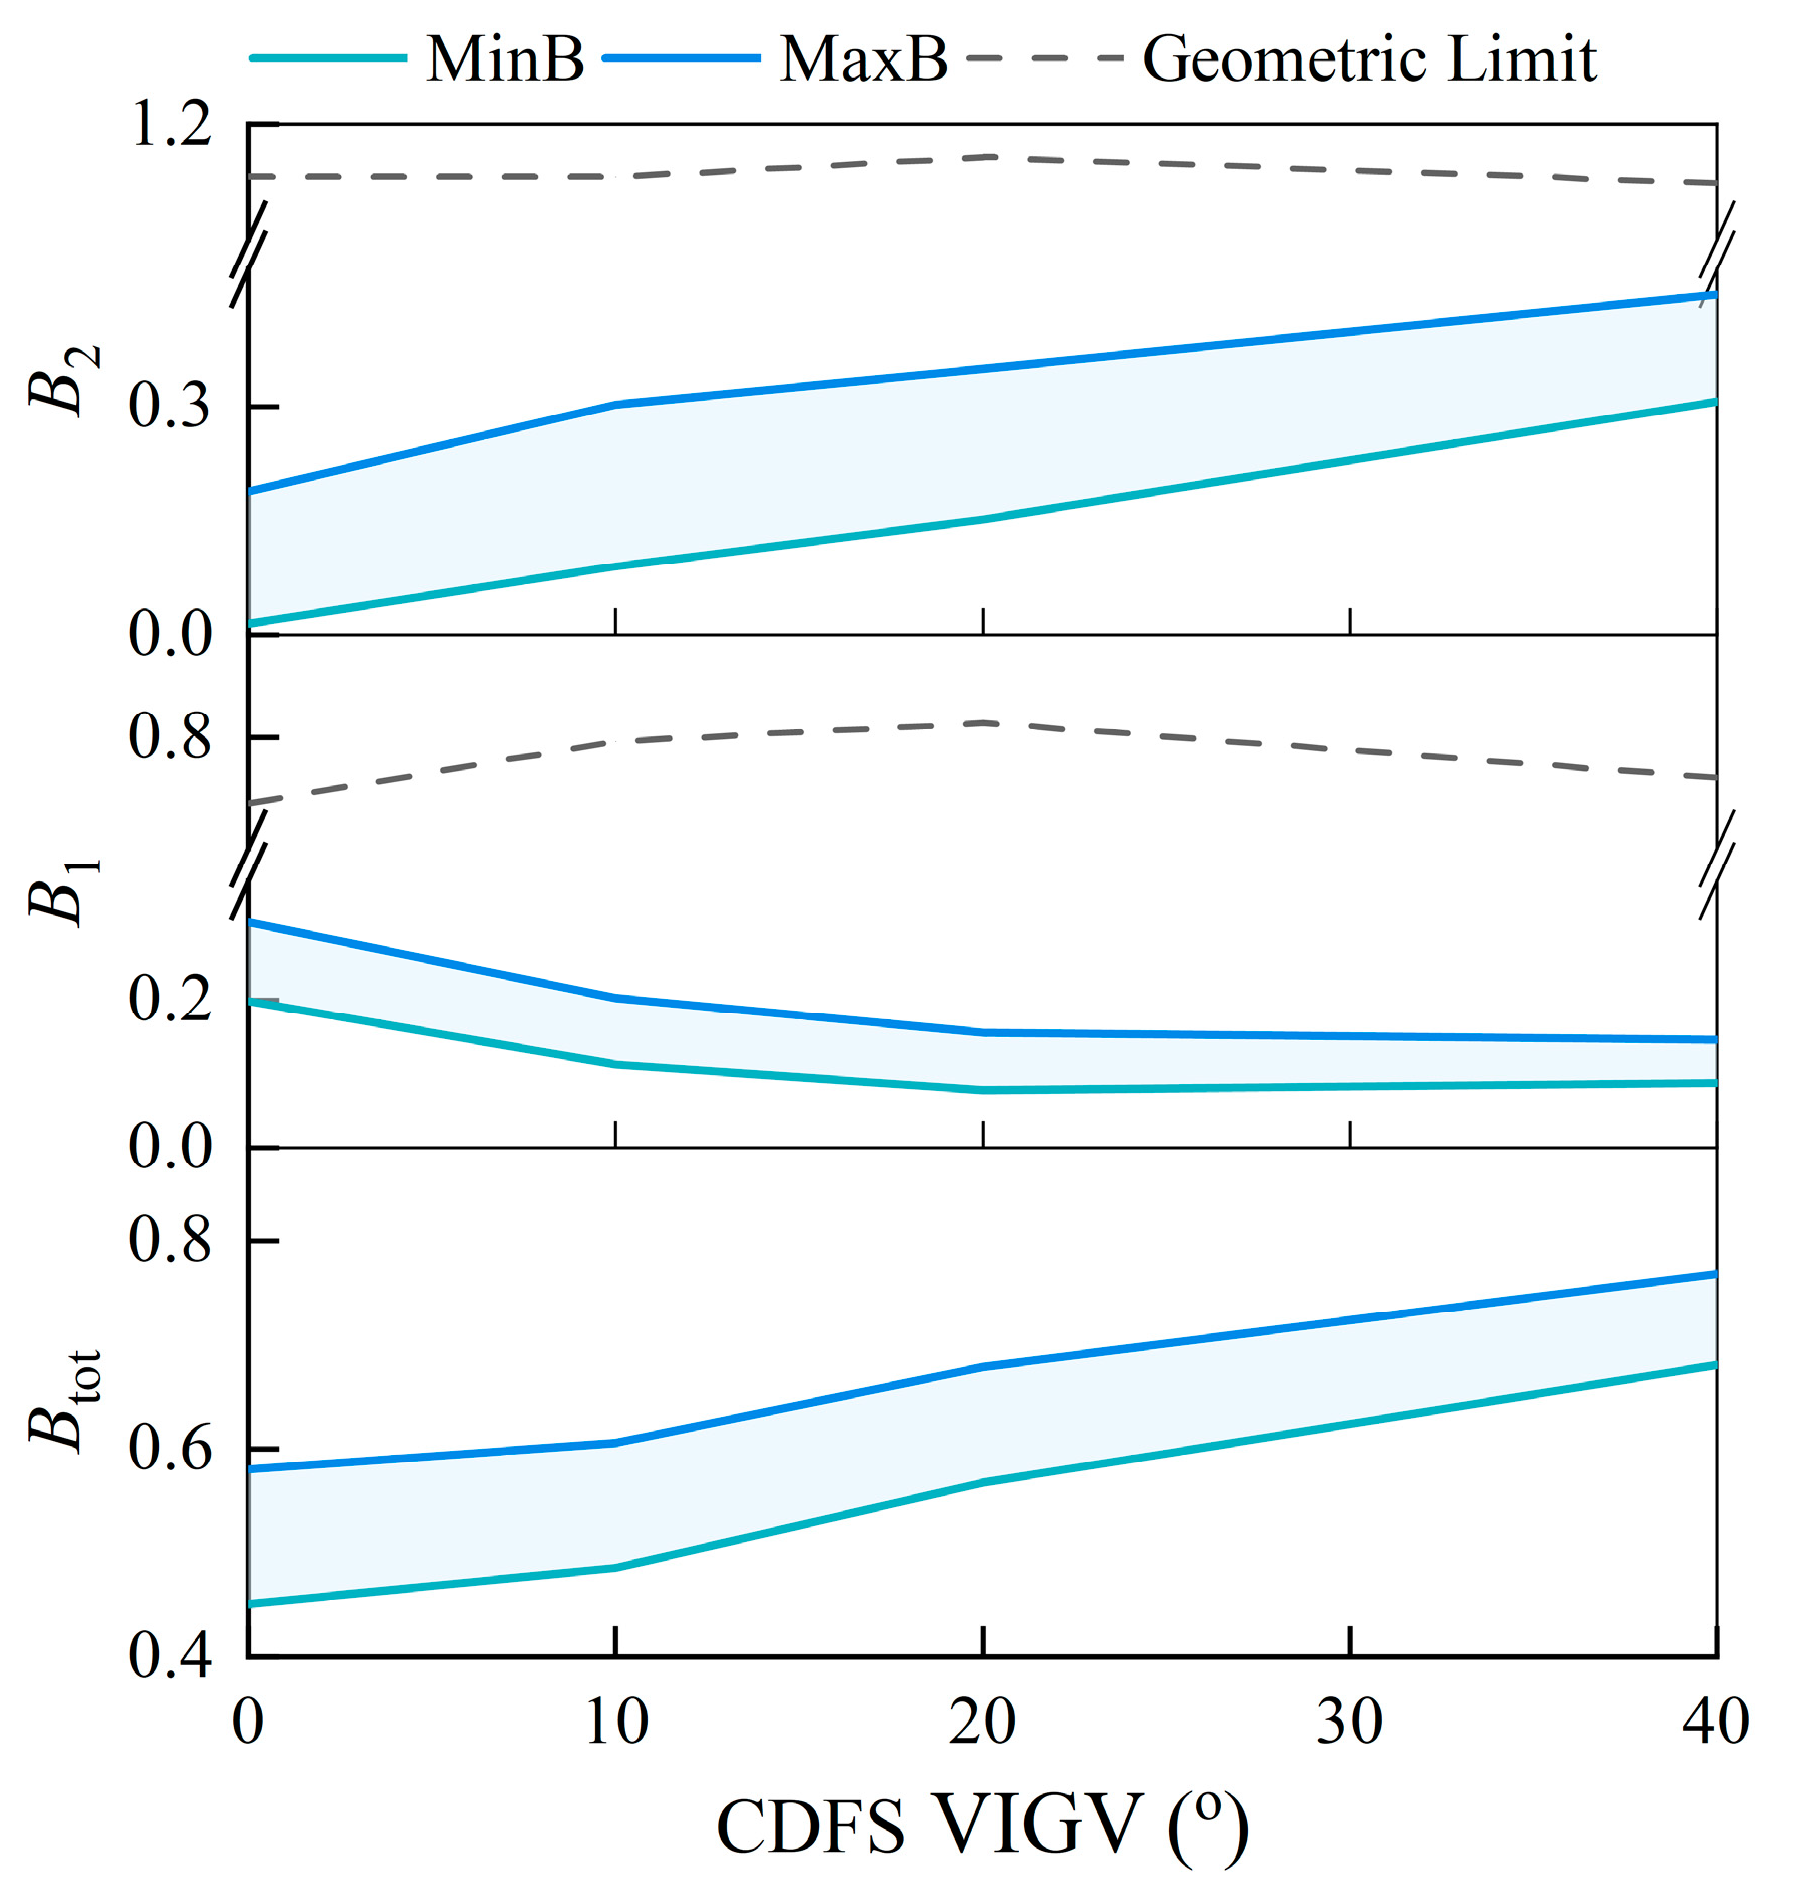
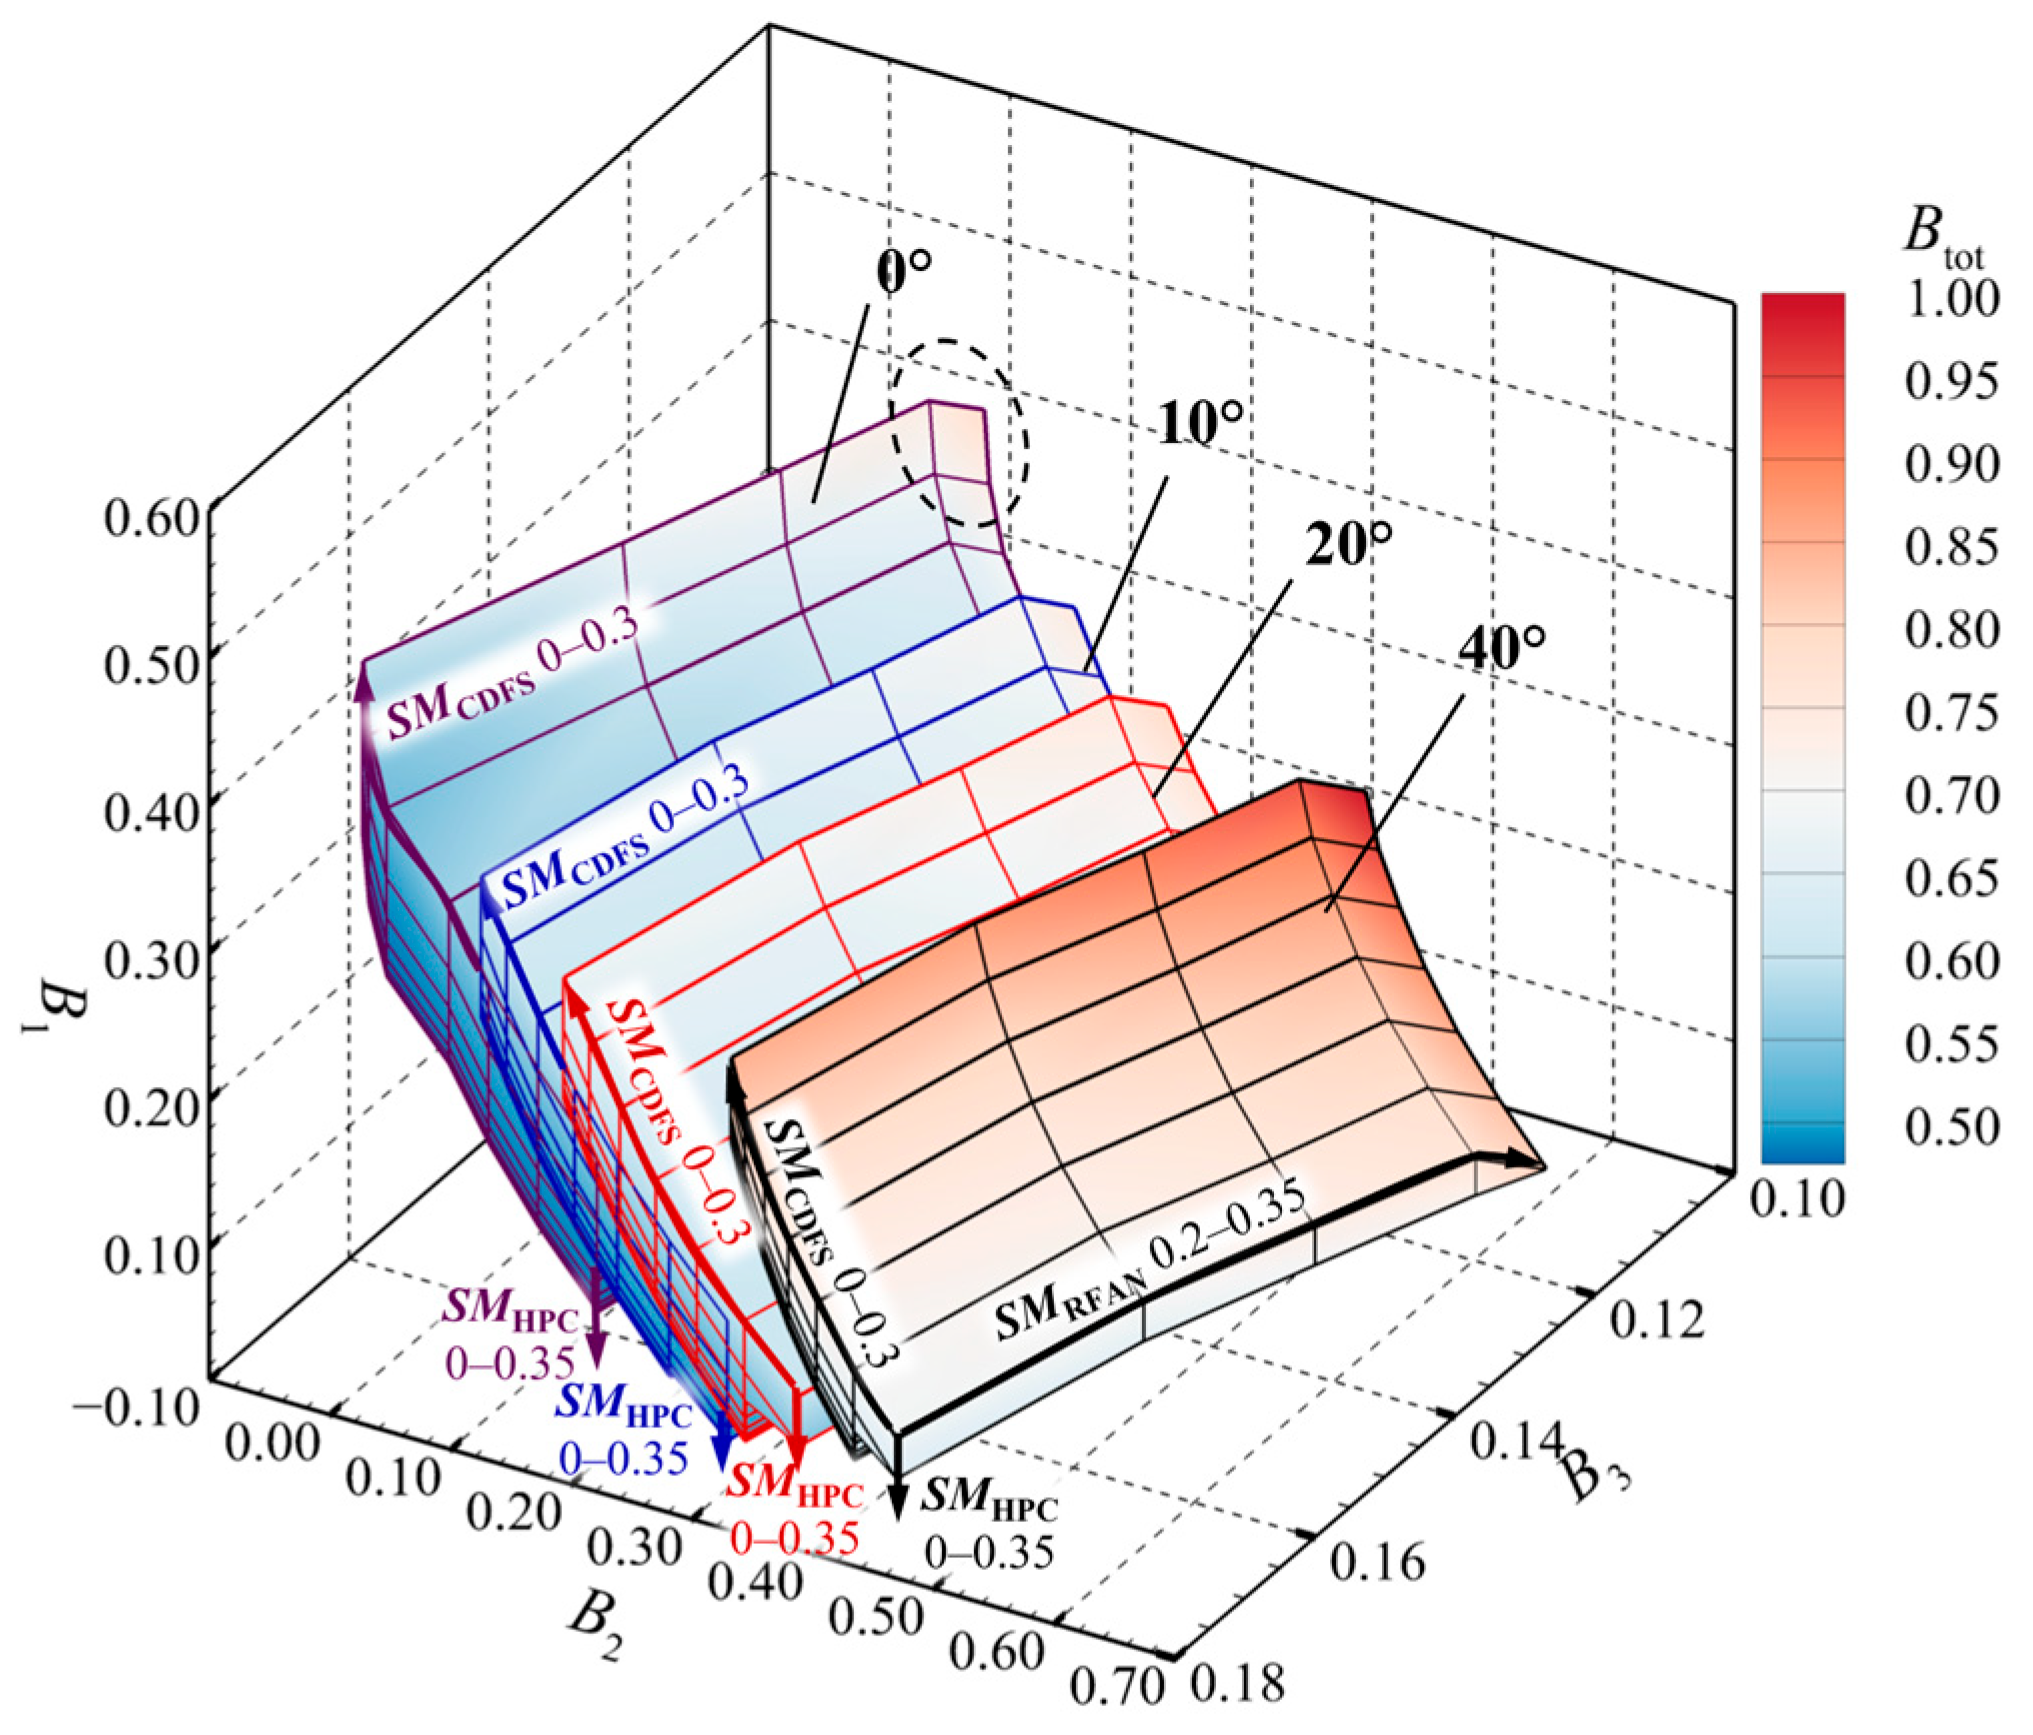
The CDFS is key to achieving wide-range bypass ratio regulation, making the selection of its VIGV angle, which determines the inlet pre-swirl, crucial. As shown in Figure 13, decreasing the CDFS VIGV angle from 40 degrees to 0 degrees gradually enhances the work capability and flow capacity of the CDFS, leading to an increase in the mass flow rate passing through it. This increased flow through the CDFS reduces the mass flow into the second bypass, thereby decreasing B2. Although the increased work capability of the CDFS raises the HPC inlet total pressure and thus improves its flow capacity, the growth in CDFS flow exceeds this improvement. Consequently, the excess flow enters the first bypass, increasing B1. Furthermore, since the mass flow through the HPC increases, Btot decreases accordingly. Thus, decreasing the CDFS VIGV angle causes B2 to decrease overall, and B1 to increase overall, and the trend of Btot aligns with that of B2, decreasing as the angle is reduced.
In summary, the key influences of the primary matching regulation parameters on the regulation range of the system bypass ratios are as follows:
  • Increasing SMFFAN enhances the upper limit of the engine bypass ratio by increasing B3. However, its impact on the bypass ratio regulation range is limited. Care must be taken to ensure that the geometry of the third bypass is compatible with the increase in B3.
  • Increasing SMRFAN or SMCDFS helps raise the upper limit of the engine bypass ratio regulation range. However, this also leads to an increase in the lower limit of the Btot regulation range. Consequently, the overall regulation range of Btot experiences minimal net change.
  • Changes in the matching rotational speeds of the LP and HP shafts have opposite effects on both the bypass ratio regulation range and the overall bypass ratio. Reducing the LP shaft speed decreases both Btot and its regulation range. Conversely, reducing the HP shaft speed enhances both. Furthermore, changes in the HP shaft speed exhibit higher sensitivity to bypass ratio regulation.
  • The CDFS VIGV angle also significantly affects Btot and its regulation range. A larger positive VIGV angle increases the bypass ratio, whereas a larger negative VIGV angle has the opposite effect. Adjustments to the VIGV angle demonstrate low sensitivity to the regulation range of the bypass ratio.
  • The bypass ratio regulation range is primarily constrained by the intrinsic characteristics of the compression components and the flow capacity limits of the bypass ducts. For a given compression component, its inherent bypass ratio regulation range is relatively fixed. However, the overall bypass ratio level (whether increased or decreased) can be achieved by adjusting the matching parameters mentioned above.

4. Influence of Component Coupling Adjustment on the System’s Feasible Operating Zone

Due to strong aerodynamic coupling between components and bypasses in the ACE compression system, the bypass ratios are interdependent. To comprehensively evaluate the system’s operational envelope and accurately determine viable working states, it is necessary to analyze them collectively by examining their coupled regulation range, i.e., the feasible operating zone of the compression system. This section defines the feasible operating zone and briefly analyzes the influence of matching parameters on this zone under coupled conditions.

4.1. Definition of Feasible Operating Zone for the Triple-Bypass ACE Compression System

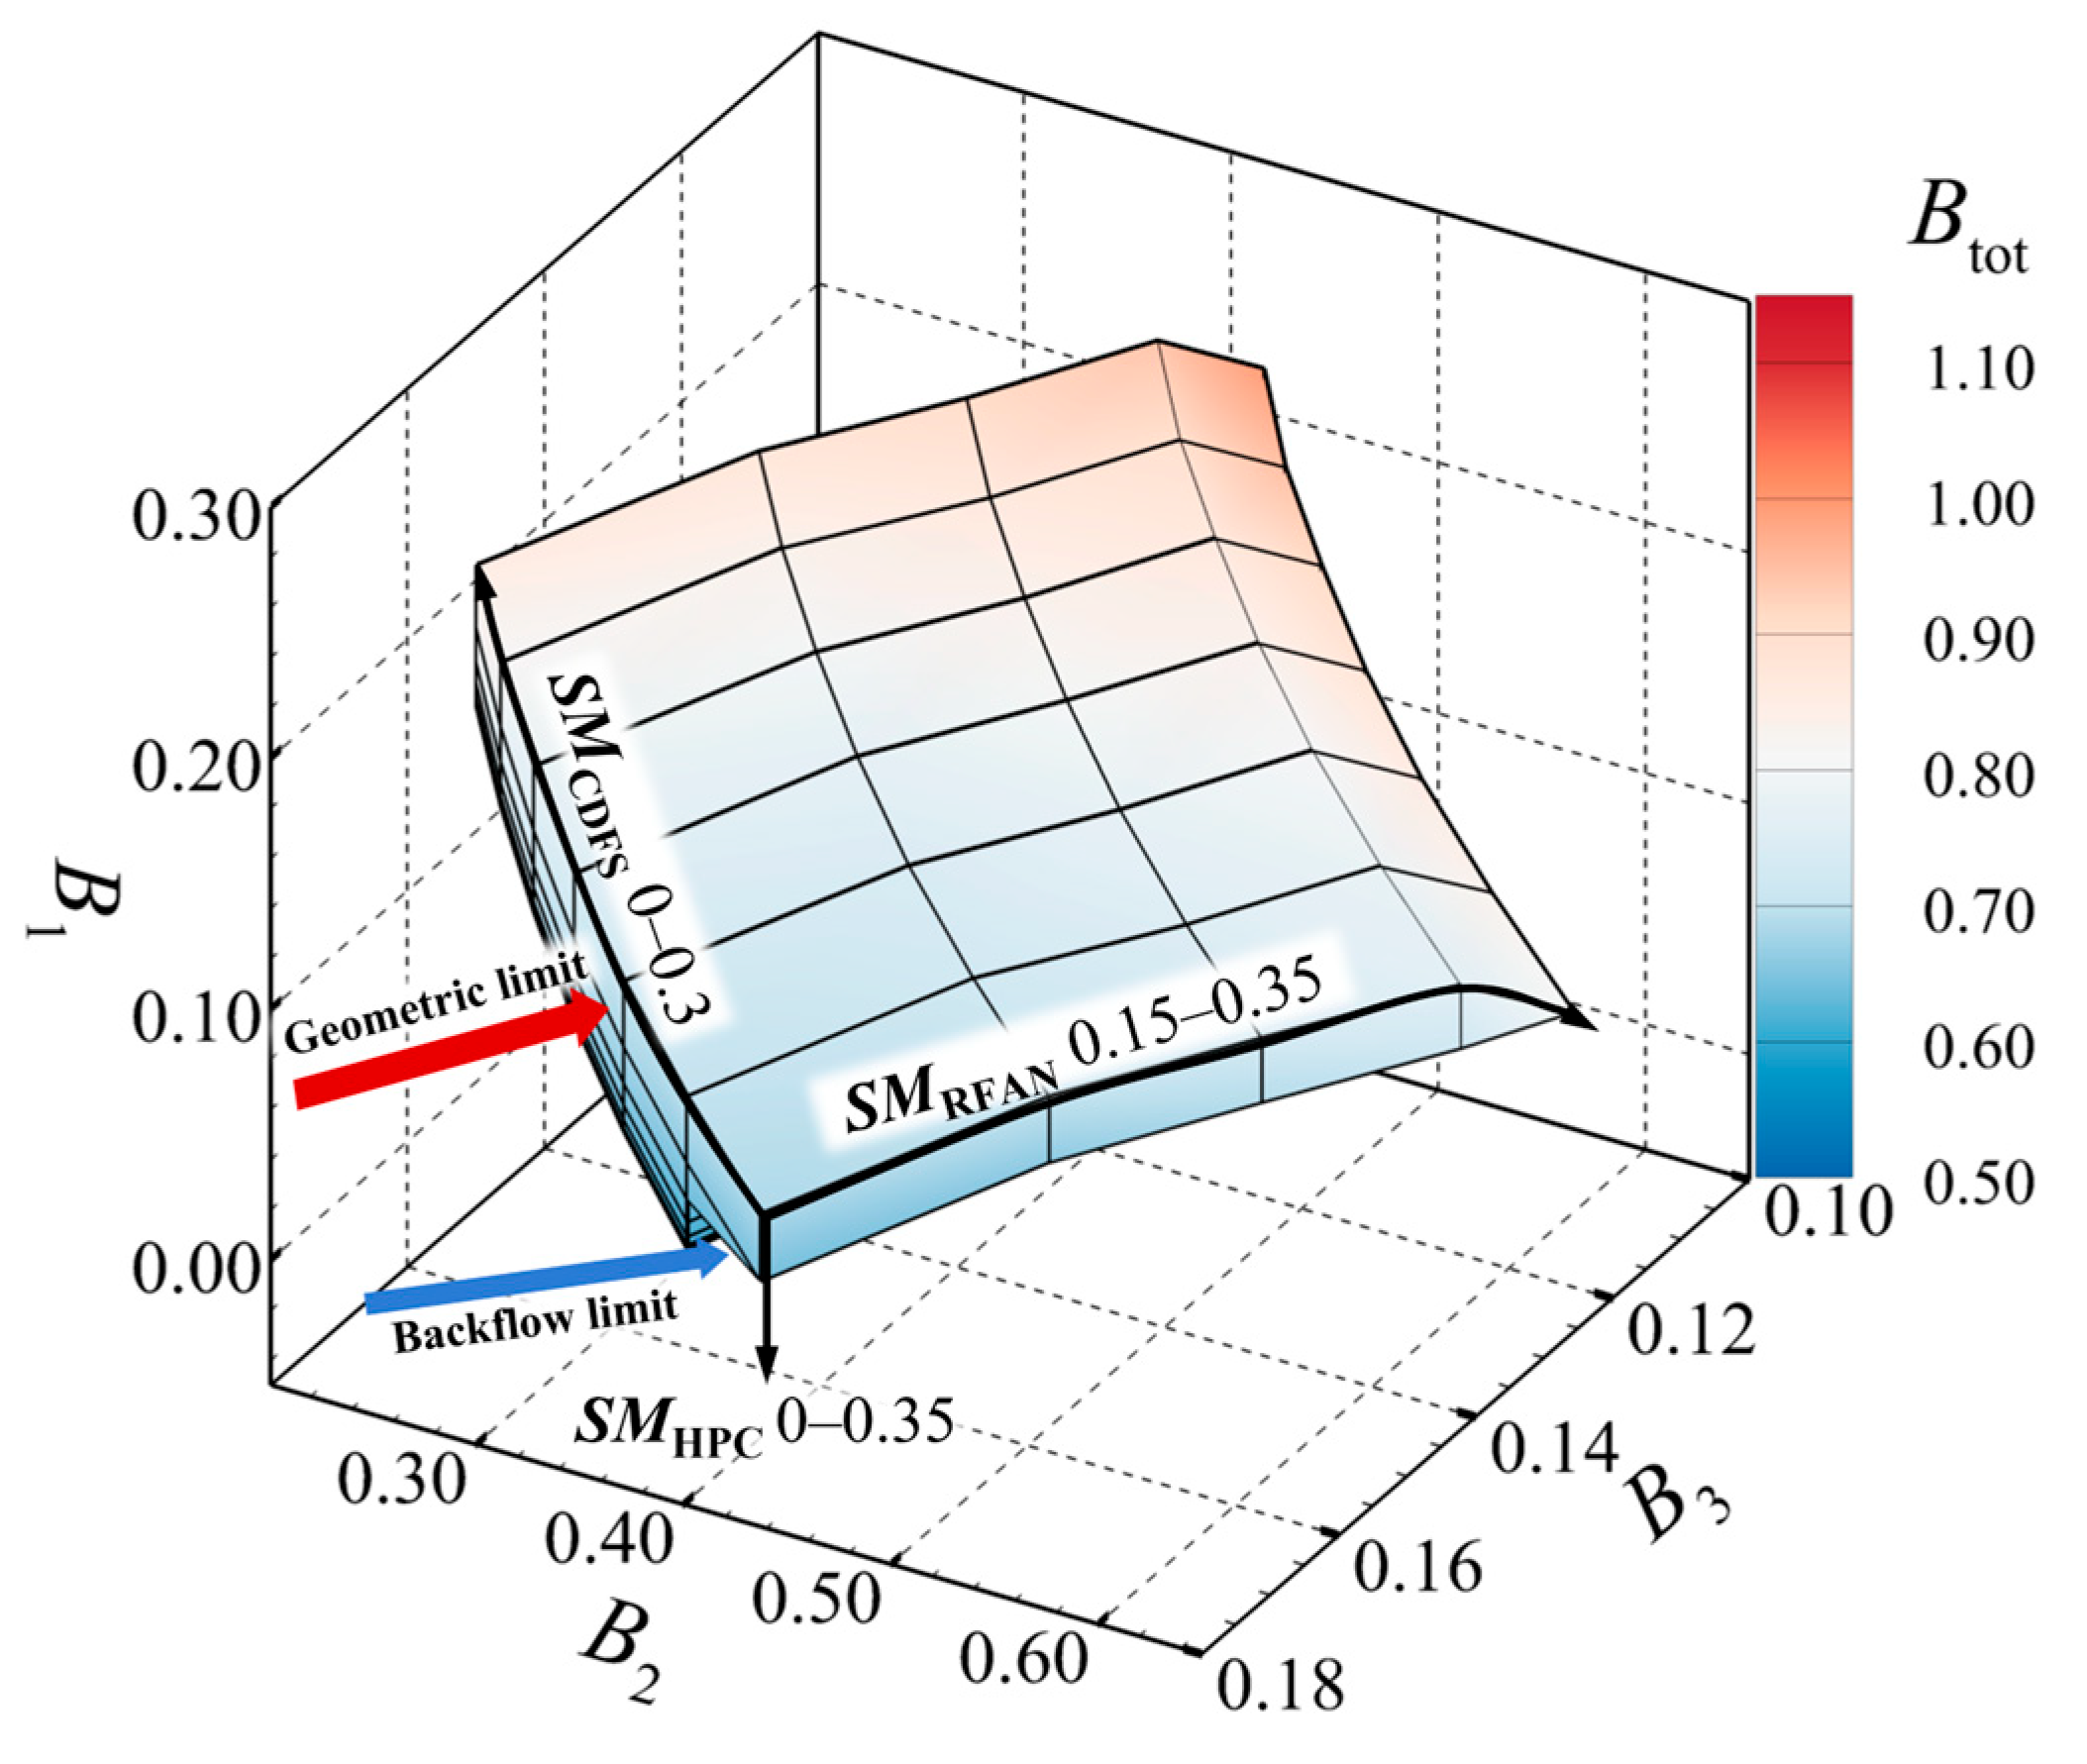
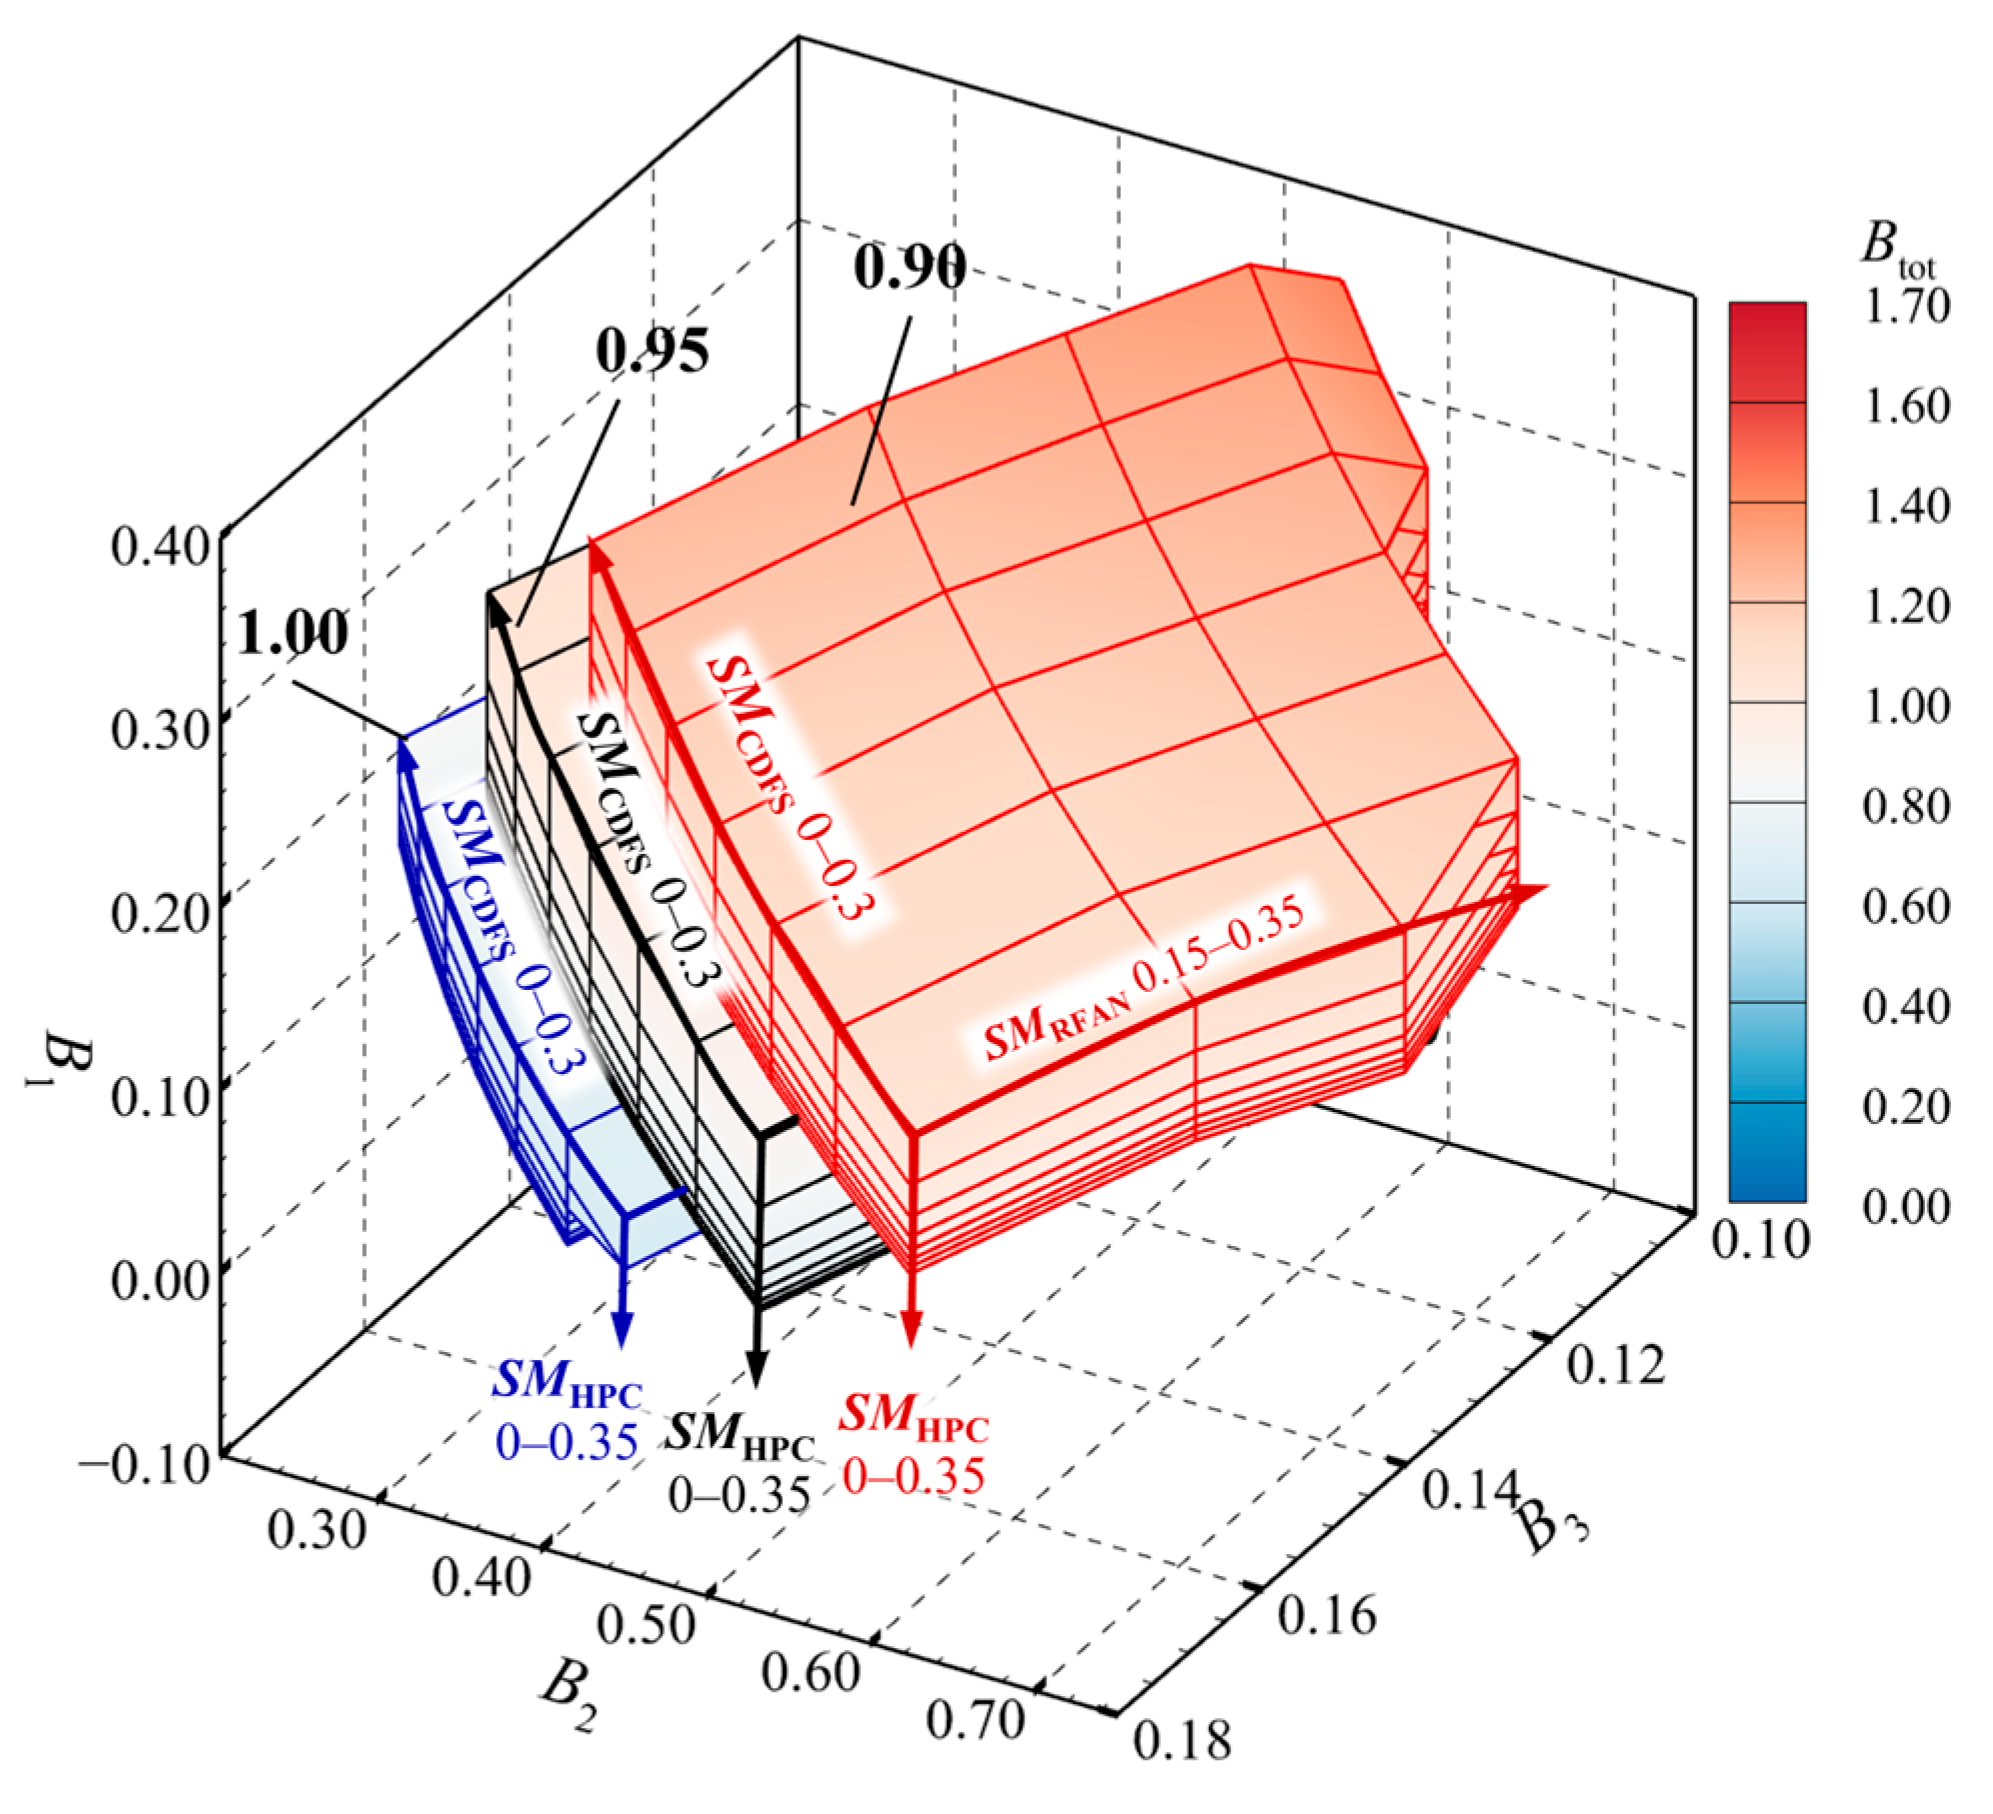
For the triple-bypass ACE compression system, when the operating point of the FFAN is determined, the bypass ratios B1, B2, and B3 uniquely define the system’s operating state. These three bypass ratios collectively form the fundamental feasible operating zone for the engine. As shown in Figure 14, the operating zone is formed by B3, B2, and B1 with the FFAN operating at its datum point. The grid lines on the operating zone surface represent isolines of component matching margin, while the color gradient characterizes the magnitude of Btot. The figure clearly shows that the maximum Btot is achieved when SMRFAN and SMCDFS increase while the matching margin of the HPC (SMHPC) decreases. Furthermore, it can be observed that the stable operating margin of the compression components, bypass choking, and backflow are all constraints defining the boundaries of the feasible operating zone [34,35].

4.2. Influence of Compression System State Adjustment on the Feasible Operating Zone

Since the influence laws of each component’s matching state have been analyzed in detail earlier, the following discussion uses the feasible operating zone corresponding to the studied FFAN baseline operating point as a foundation. The impact of relevant matching regulation parameters, including the FFAN matching state, LP and HP shaft matching speeds, and CDFS IGV angle, on the feasible operating zone of the triple-bypass compression system under coupled conditions will be analyzed briefly.

4.2.1. FFAN Matching State

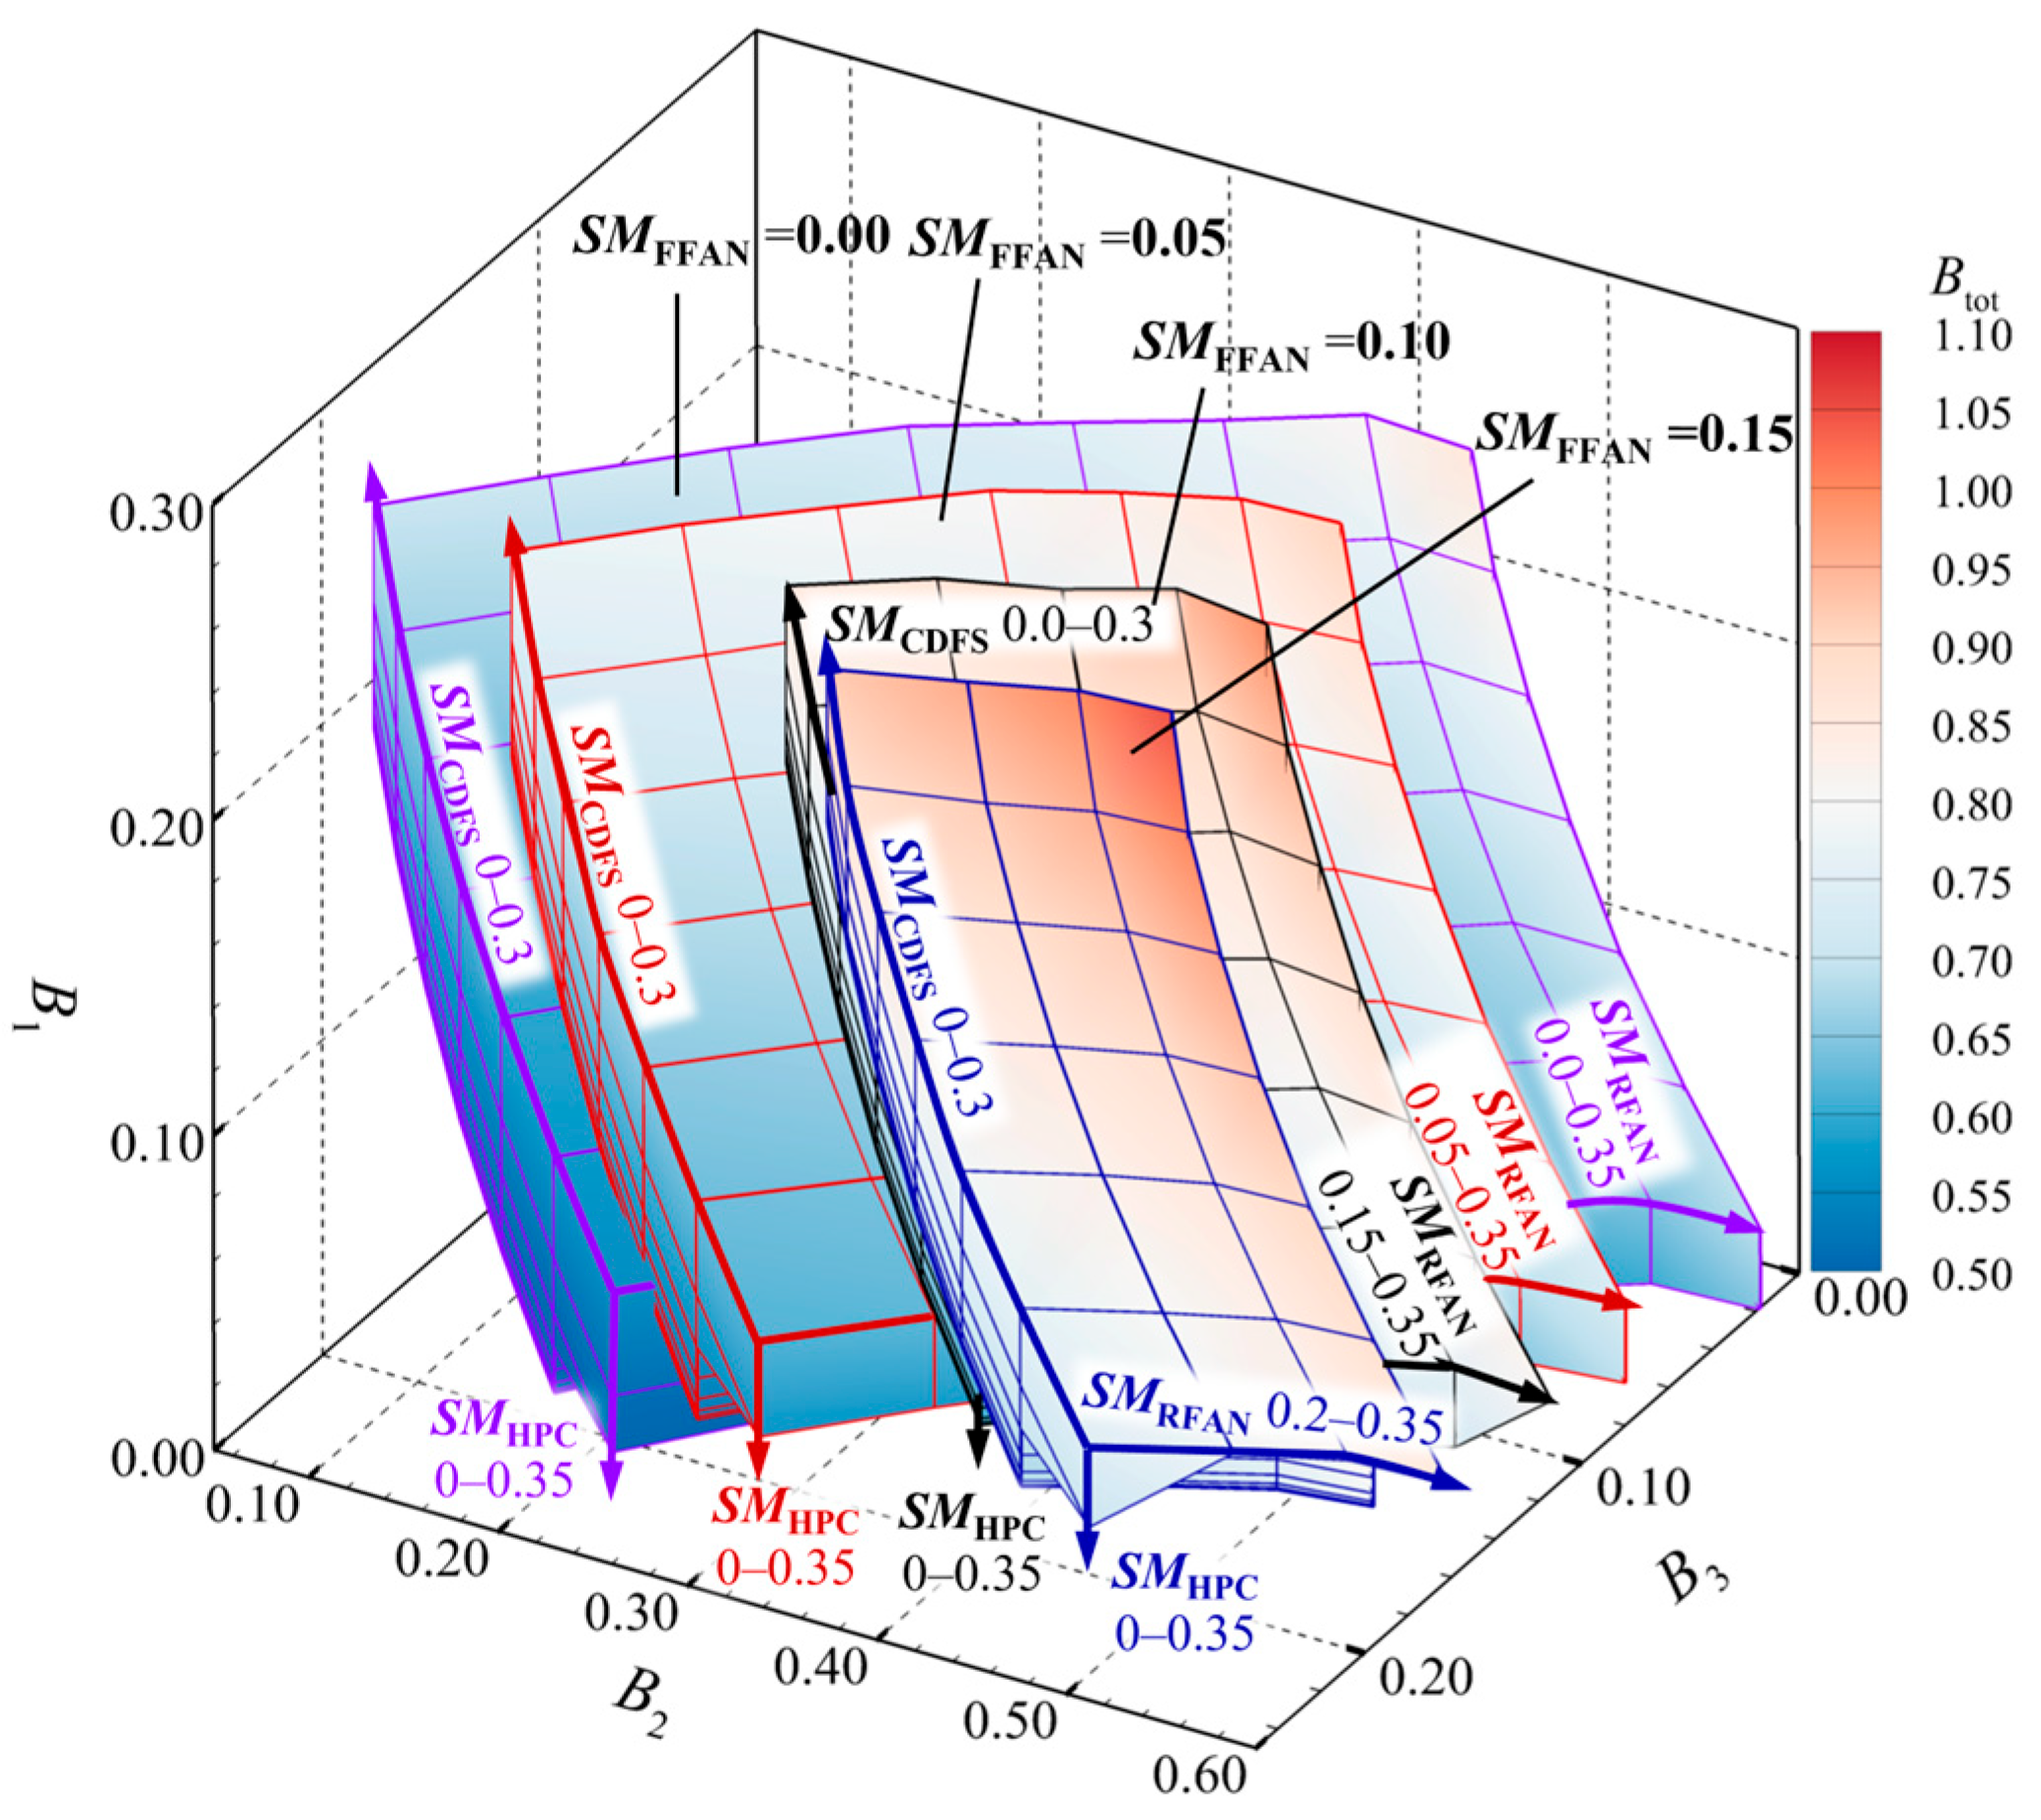
Figure 15 compares the feasible operating zones corresponding to increased and decreased SMFFAN relative to its datum point. As SMFFAN decreases, the entire operating zone shifts towards decreasing B3. During this shift, the maximum achievable bypass ratio within each zone continuously decreases. This can be reasonably inferred from Equation (33): the FFAN matching state primarily influences Btot indirectly through its effect on B3, aligning with the trend observed in Section 3.2.1. Furthermore, the gradual expansion of the operating zone range indicates that for this triple-bypass system, the smaller inlet area of the third bypass forces the RFAN to operate at high-flow states when the FFAN works at larger margin conditions. Figure 15 shows that when SMFFAN is 15%, the usable matching margin range for the RFAN is less than 15%. Conversely, when SMFFAN is 0%, the usable rear fan margin range expands to 35%.

4.2.2. LP Shaft Speed

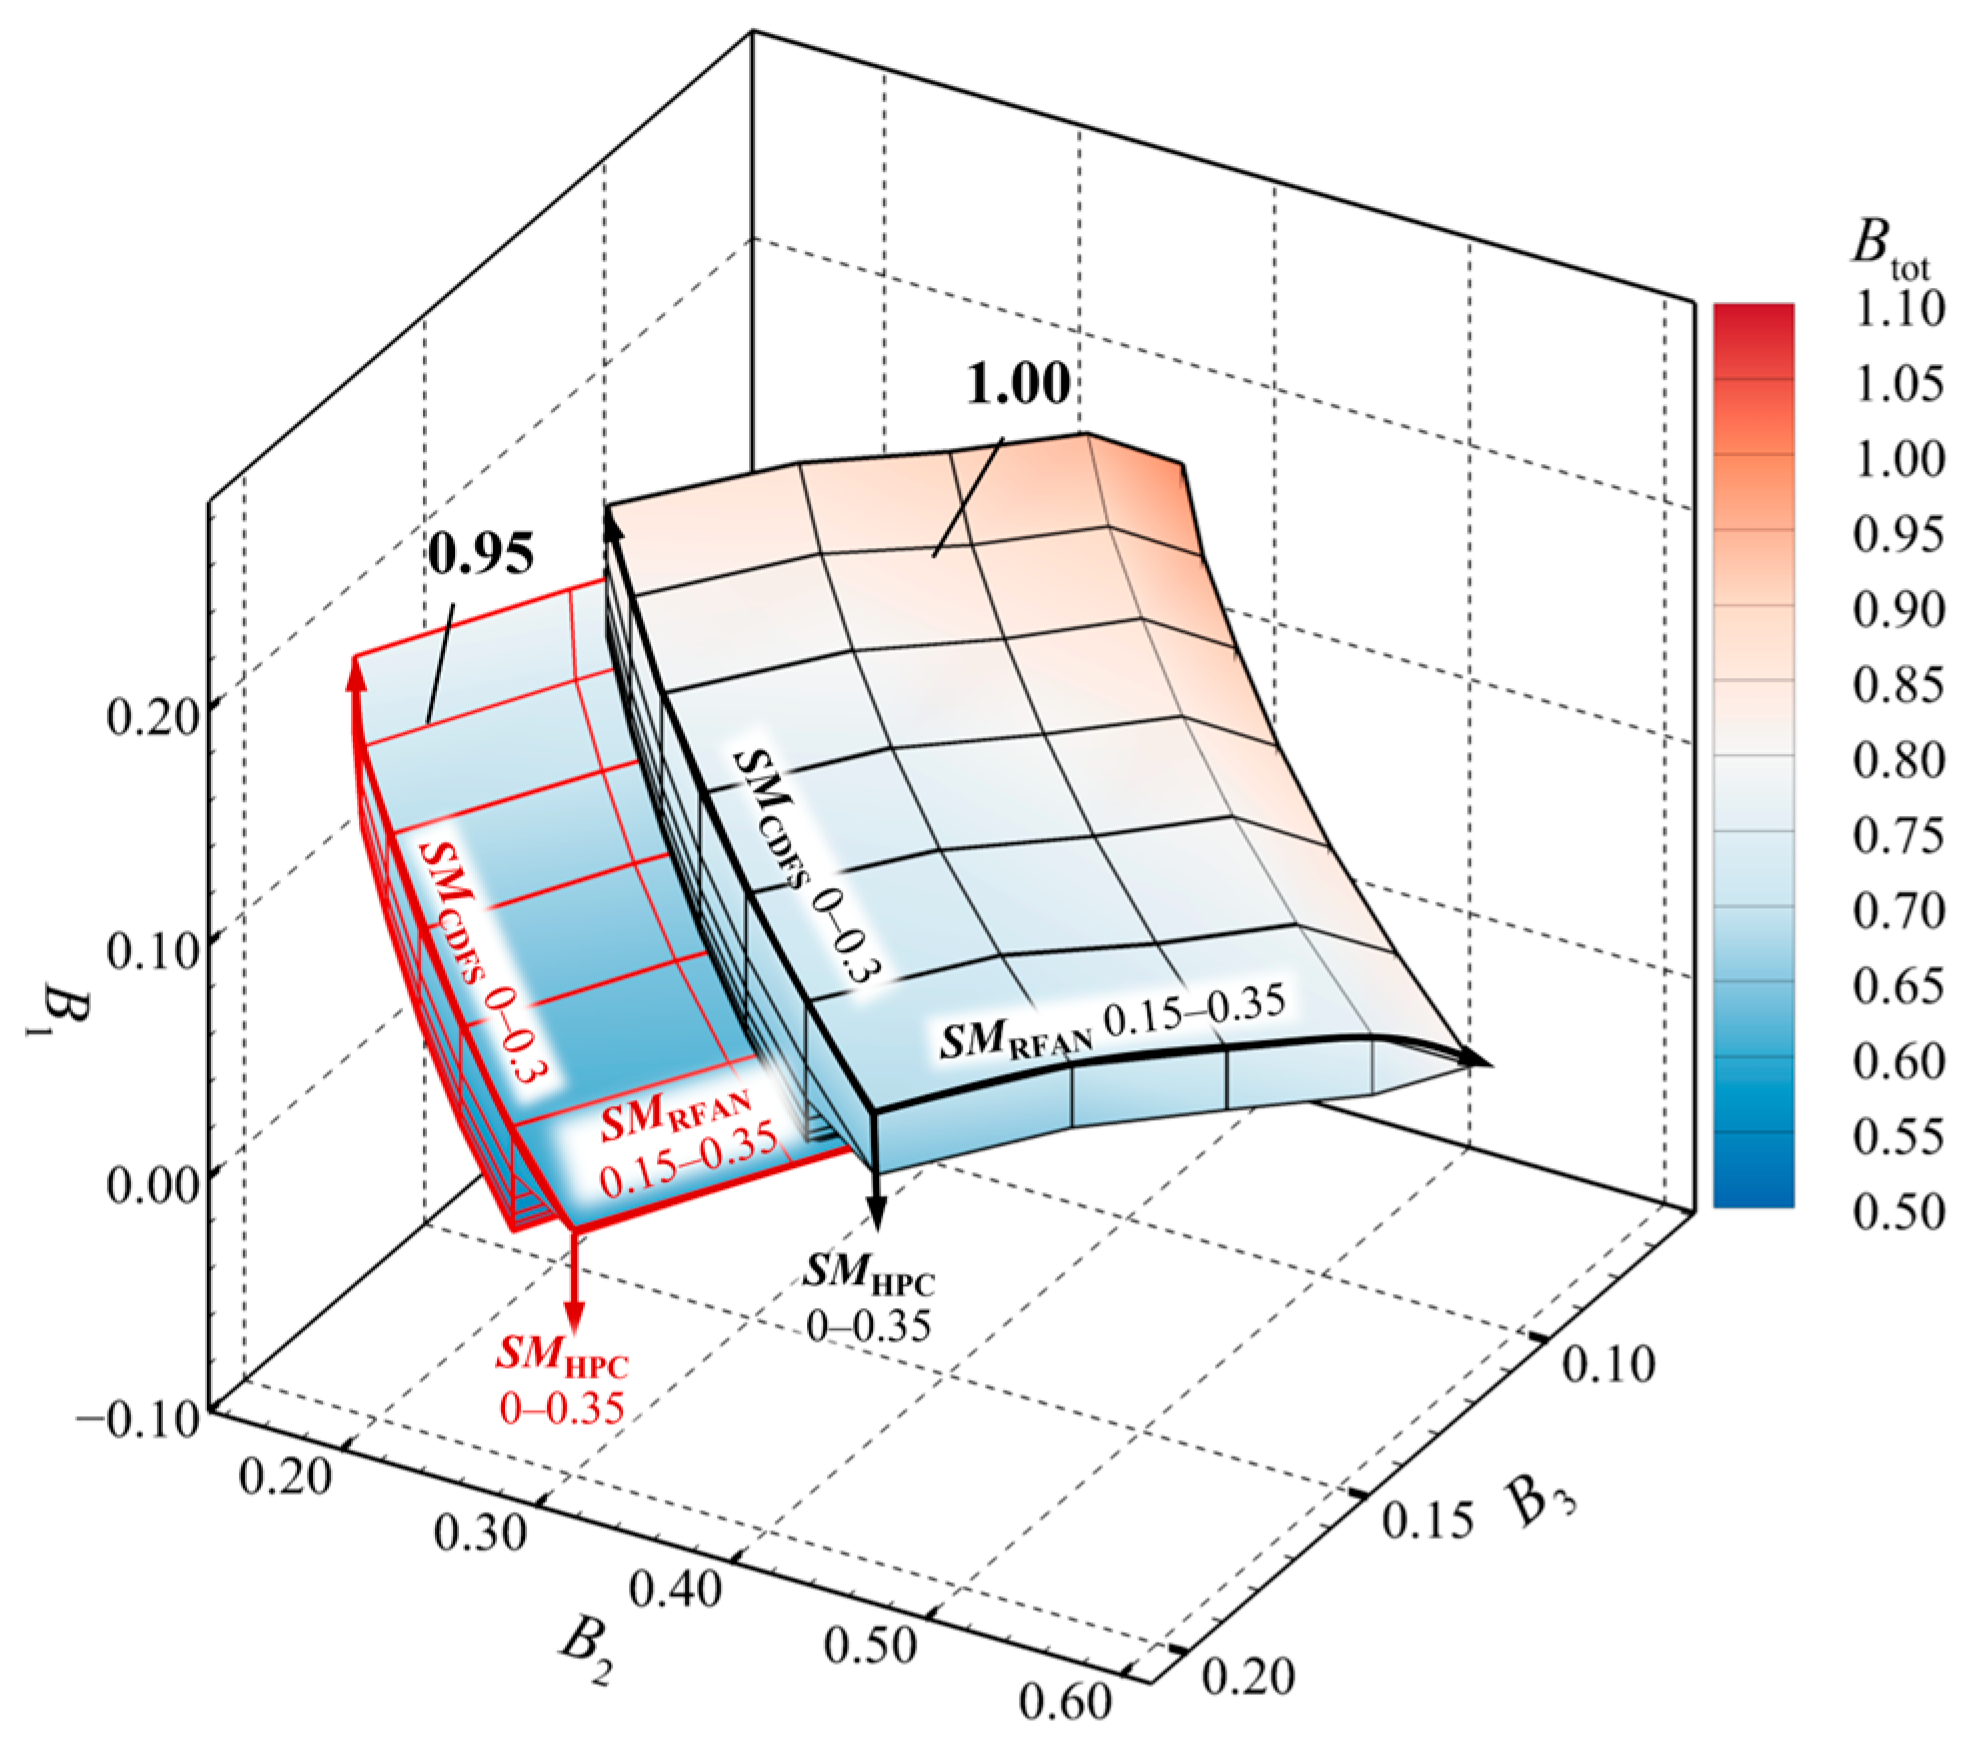
As shown in Figure 16, decreasing the low-pressure shaft speed shifts the feasible operating zone of the compression system towards decreasing B1 and B2, while the zone range progressively contracts. This trend corresponds with the analysis in Section 3.3.1. Therefore, achieving higher bypass ratios and wider regulation ranges requires maximizing the LP shaft speed.

4.2.3. HP Shaft Speed

Figure 17 demonstrates the change in the compression system’s feasible operating zone when the HP shaft speed is varied while keeping the LP shaft speed constant.
Reducing the HP shaft speed shifts the operating zone towards increasing B1 and B2, accompanied by a significant increase in Btot. Combining this with the analysis in Section 3.3.2 reveals that reducing the HP shaft speed increases the maximum bypass ratio by raising B1 and B2. Additionally, the wider stable operating ranges of the CDFS and HPC at lower speeds result in a correspondingly larger feasible operating zone.

4.2.4. CDFS VIGV Angle

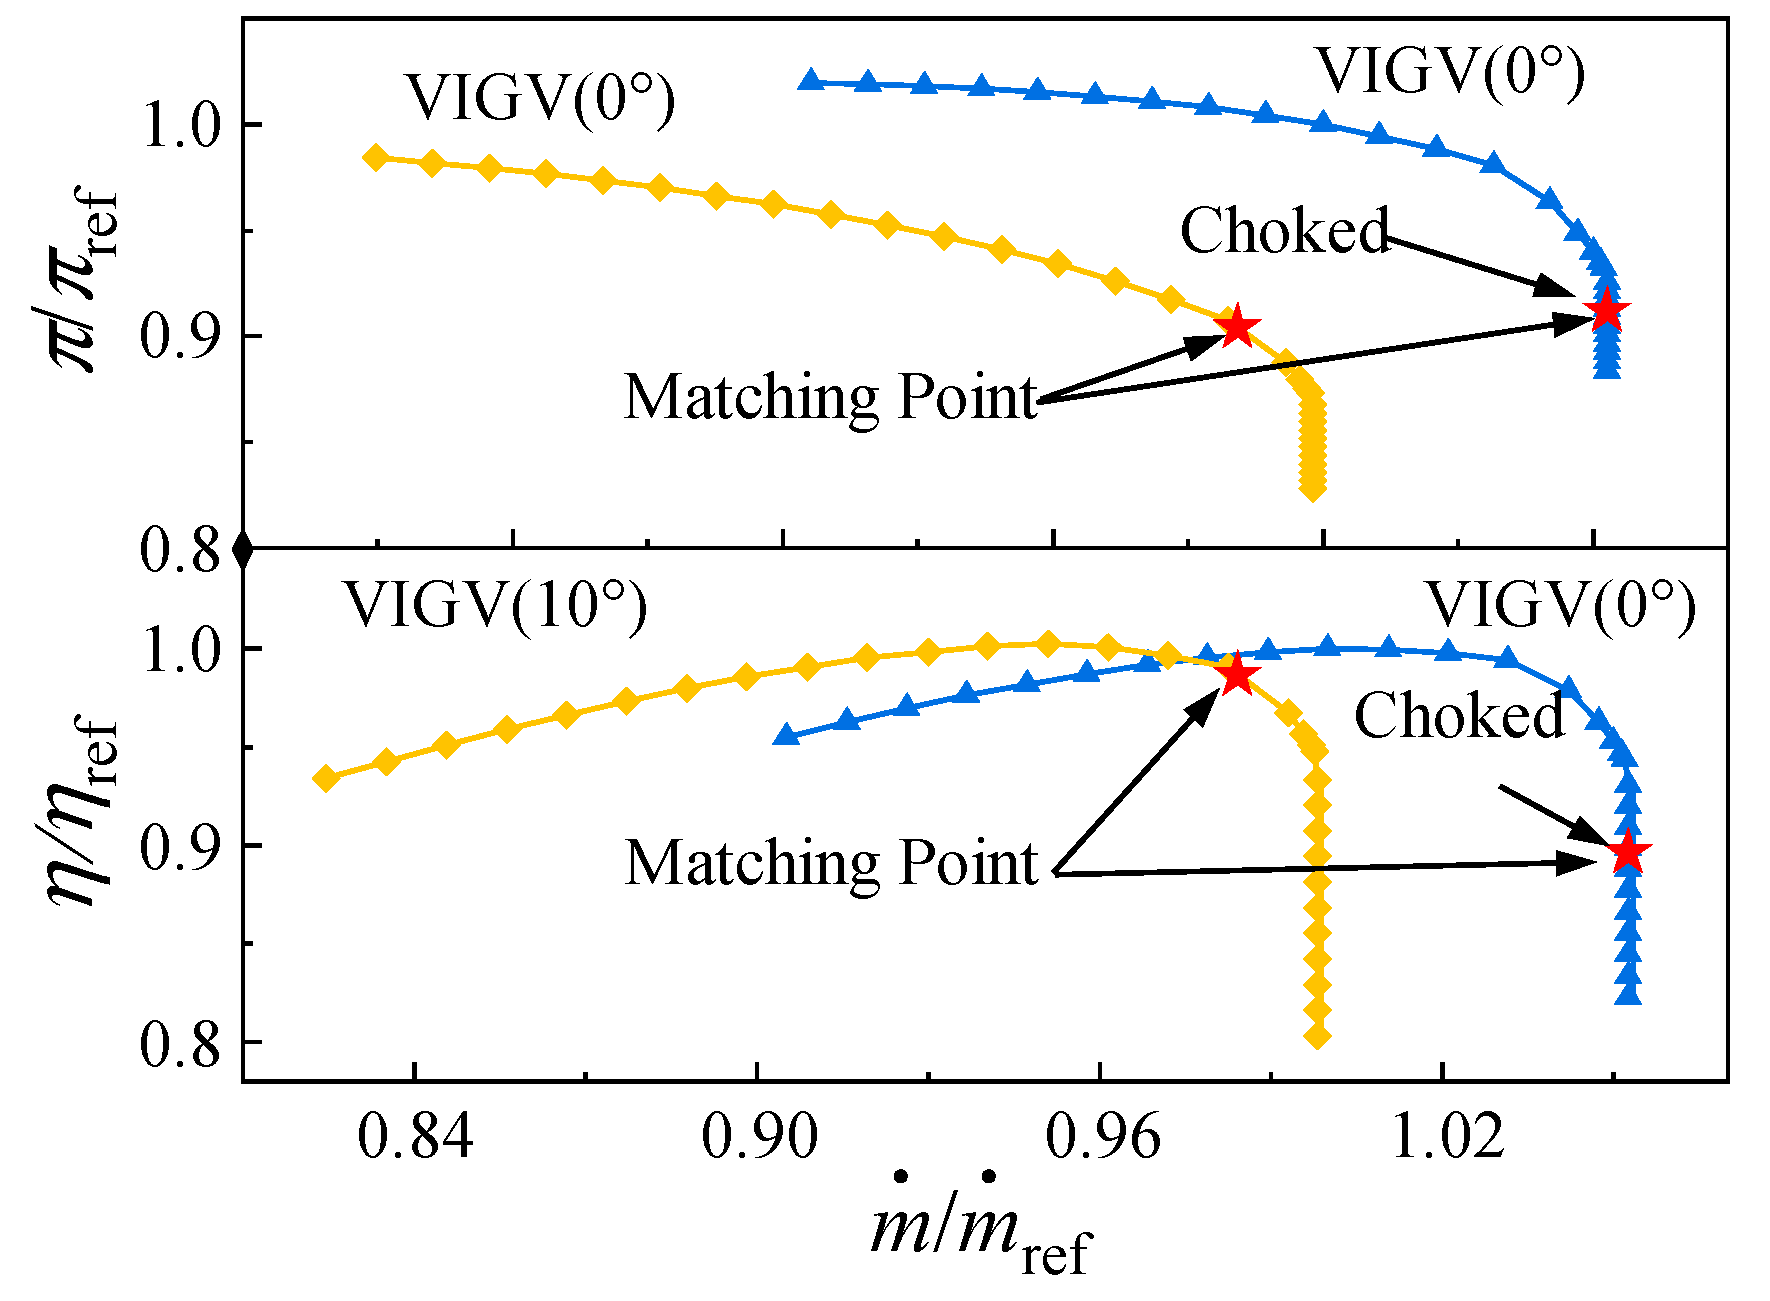
Since the CDFS features independently adjustable VIGV, changing their angle alters the CDFS operating state, enabling the regulation of the entire ACE compression system’s matching and bypass ratios. For the studied system, Figure 18 shows the change in the feasible operating zone with variations in the CDFS VIGV angle. Consistent with Section 3.4, decreasing the CDFS VIGV angle reduces B2 while increasing B1, resulting in an overall decrease in Btot. Notably, an abnormal increase in the maximum bypass ratio occurs when the CDFS VIGV angle is zero (indicated by the dashed ellipse in Figure 18), a phenomenon not observed in Section 3.4. As Figure 19 illustrates, this occurs because the CDFS operates near the choked condition in this anomalous region, causing B1 to increase rapidly and consequently raising the maximum bypass ratio.

5. Conclusions

This study establishes an integrated hybrid-dimensional modeling framework for ACE compression systems, incorporating zero-dimensional bypass analysis with one-dimensional and quasi-two-dimensional component modeling techniques. The proposed methodology is applied to investigate a triple-bypass ACE configuration, successfully elucidating the variation mechanisms of bypass flow distribution and quantitatively characterizing the operational envelope constraints. Key conclusions derived from this systematic investigation include the following:
  • The matching state of each compression system component (FFAN, RFAN, CDFS, HPC) primarily affects the bypass ratio of the adjacent downstream bypass, with a minor impact on the bypass ratios of other bypasses.
  • The rotational speeds of the HP and LP shafts and the CDFS VIGV angle mainly influence B1 and B2, albeit through different mechanisms. The LP shaft speed directly affects B2 by influencing the flow capacity of the FFAN and RFAN. Simultaneously, changes in the flow capacity of these fans alter the inlet conditions of the CDFS, thereby affecting the operating state of HP shaft components and indirectly influencing B1. The HP shaft speed directly affects B1 and B2 by influencing the flow capacity of the CDFS and the HPC. The CDFS VIGV angle primarily affects B1 and B2 by altering the flow capacity of the CDFS.
  • To increase the Btot of the compression system, SMFFAN should be increased, the LP shaft speed should be raised, the HP shaft speed should be reduced, and the CDFS VIGV should be appropriately closed (increasing positive pre-swirl). However, it should be noted that adjusting the HP shaft speed is the most effective measure, while attention must be paid to avoiding HP shaft overspeed during the LP shaft adjustment process.
  • The influence of matching control parameters on the feasible operating zone of the compression system results from the superposition of their effects on each of the bypass ratios. Results obtained by analyzing the influence of each matching control parameter on the bypass ratios using the control variable method align in trend with those obtained through the feasible operating zone analysis. Therefore, the control variable method can be used for the qualitative analysis of the influence laws of matching control parameters on the bypass ratios.

Author Contributions

Conceptualization, X.Y. and B.L.; methodology, D.H. and R.W.; investigation, D.H.; writing—original draft preparation, D.H., S.M. and R.W.; writing—review and editing, X.Y. and R.W.; supervision, X.Y. All authors have read and agreed to the published version of the manuscript.

Funding

This research received no external funding.

Data Availability Statement

The data presented in this study are available on request from the corresponding author.

Conflicts of Interest

The authors declare no conflicts of interest.

Nomenclature

Abbreviations
VCEVariable cycle engine
ACEAdaptive cycle engine
MSVMode Selector Valve
FVABIForward Variable Area Bypass Injector
VIGVVariable inlet guide vane
FFANFront fan
RFANRear fan
CDFSCore-driven fan stage
HPCHigh-pressure compressor
LP shaftLow-pressure shaft
HP shaftHigh-pressure shaft
SMStall margin
MaxBMax bypass ratio
MinBMin bypass ratio
Symbols
BBypass ratio
B1First bypass ratio
B2Second bypass ratio
B3Third bypass ratio
BtotTotal bypass ratio
BmaxMaximum bypass ratio under bypass geometric limit
mass flow
NRotational speed
P*Total pressure
T*Total temperature
P0Standard atmospheric pressure
T0Standard atmospheric temperature
MaoMach number at the throat of the bypass
πTotal pressure ratio
τTotal temperature ratio
ηAdiabatic efficiency
δCorrected flow scaling factor, ratio of inlet corrected mass flow rate to outlet corrected mass flow rate for a compressor
SπPressure ratio sensitivity of corrected flow scaling factor
SηEfficiency ratio sensitivity of corrected flow scaling factor
kSpecific heat ratio
Subscripts
FFANPertaining to the front fan
RFANPertaining to the rear fan
CDFSPertaining to the core-driven fan stage
HPCPertaining to the high-pressure compressor
bypassPertaining to the common bypass of the double-bypass compression system
phyPhysical condition
corCorrected condition (standard atmosphere)
inInlet of compression component
outOutlet of compression component

References

  1. Murthy, S.N.B.; Curran, E.T. Variable Cycle Engine Developments At General Electric-1955-1995. In Developments in High-Speed Vehicle Propulsion Systems; American Institute of Aeronautics and Astronautics: Reston, VA, USA, 1996; pp. 105–158. [Google Scholar] [CrossRef]
  2. Kurzke, J. The Mission Defines the Cycle: Turbojet, Turbofan and Variable Cycle Engines for High Speed Propulsion; RTO Educational Notes; EN-AVT-185 Lecture: Dachau, Germany, 2010; Available online: https://www.sto.nato.int/document/the-mission-defines-the-cycle-turbojet-turbofan-and-variable-cycle-engines-for-high-speed-propulsion/ (accessed on 9 July 2025).
  3. Chen, M.; Deng, L.; Zhang, J.; Tang, H. Review on the development status and performance deign of adaptive cycle engines. Propul. Power Res. 2025, 14, 35–63. [Google Scholar] [CrossRef]
  4. Jafaripanah, S.; Ommi, F.; Saboohi, Z. Off-Design Performance Simulation of Non-mixed Twin-Spool Aero Turbine Engine. J. Inst. Eng. India Ser. C 2024, 105, 101–114. [Google Scholar] [CrossRef]
  5. Wagenknecht, C.D.; Faust, G.K. Individual Bypass Injector Valves for a Double Bypass Variable Cycle Turbofan Engine. U.S. Patent 4,175,384, 27 November 1979. [Google Scholar]
  6. Vdoviak, J.W.; Ebacher, J.A. VCE test bed engine for supersonic cruise research. NASA Langley Res. Cent. Supersonic Cruise Res. 1979, Pt 1, 1980. Available online: https://ntrs.nasa.gov/citations/19810009472 (accessed on 9 July 2025).
  7. Bachelder, K.A.; Welty, D.J. Methods and Apparatus for Supporting Variable Bypass Valve Systems. U.S. Patent US6742324B2, 1 June 2004. [Google Scholar]
  8. Berton, J.J.; Haller, W.J.; Senick, P.F.; Jones, S.M.; Seidel, J.A. A Comparative Propulsion System Analysis for the High-Speed Civil Transport; NASA/TM-2005-213414; NASA: Washington, DC, USA, 2005. Available online: https://ntrs.nasa.gov/citations/20050123580 (accessed on 9 July 2025).
  9. Simmons, R.J. Design and Control of a Variable Geometry Turbofan with an Independently Modulated Third Stream. Ph.D. Thesis, The Ohio State University, Columbus, OH, USA, 2009. [Google Scholar]
  10. Aygun, H.; Cilgin, M.E.; Ekmekci, I.; Turan, O. Energy and performance optimization of an adaptive cycle engine for next generation combat aircraft. Energy 2020, 209, 118261. [Google Scholar] [CrossRef]
  11. Denney, R.K.; Tai, J.C.; Kestner, B.K.; Mavris, D.N. Variable Cycle Optimization for Supersonic Commercial Applications. SAE Trans. 2005, 114, 1354–1361. [Google Scholar]
  12. Lyu, Y.; Tang, H.; Chen, M. A Study on Combined Variable Geometries Regulation of Adaptive Cycle Engine during Throttling. Appl. Sci. 2016, 6, 374. [Google Scholar] [CrossRef]
  13. Zheng, J.; Chen, M.; Tang, H. Matching mechanism analysis on an adaptive cycle engine. Chin. J. Aeronaut. 2017, 30, 706–718. [Google Scholar] [CrossRef]
  14. Yue, X.; Min, C.; Tang, H. Preliminary Design Analysis of Core Driven Fan Stage in Adaptive Cycle Engine. In Proceedings of the 53rd AIAA/SAE/ASEE Joint Propulsion Conference, Atlanta, GA, USA, 10–12 July 2017. [Google Scholar]
  15. Guo, H.; Zhang, Y.; Yu, B. Research on Optimization Technology of Minimum Specific Fuel Consumption for Triple-Bypass Variable Cycle Engine. Aerospace 2025, 12, 10. [Google Scholar] [CrossRef]
  16. Wang, R.; Yu, X.; Zhao, K.; Liu, B.; An, G. Development and Validation of a Novel Control-Volume Model for the Injection Flow in a Variable Cycle Engine. Aerospace 2022, 9, 431. [Google Scholar] [CrossRef]
  17. Lu, S.; Zhou, W.; Huang, J.; Wang, B. Research on a component characteristic adaptive correction method for variable cycle engines. Int. J. Turbo Jet-Engines 2023, 40, 399–410. [Google Scholar] [CrossRef]
  18. Liu, B.; Jia, S.; Yu, X. An Integrated Throughflow Method for the Performance Analysis of Variable Cycle Compression Systems. Int. J. Turbo Jet Engines 2021, 38, 245–261. [Google Scholar] [CrossRef]
  19. Wang, R.; Yu, X.; Liang, C.; Meng, D.; An, G.; Liu, B. Integrated performance evaluation method for variable cycle engine compression system considering influence of complex bypass. Hangkong Dongli Xuebao/J. Aerosp. Power 2022, 37, 2090–2103. [Google Scholar] [CrossRef]
  20. Wang, R.; Yu, X.; Liu, B.; An, G. New insights into component matching mechanism in the compression system of double bypass engine. Propul. Power Res. 2024, 13, 118–131. [Google Scholar] [CrossRef]
  21. Kidikian, J.; Reggio, M. Off-Design Prediction of Transonic Axial Compressors, Part 1: Mean-Line Code and Tuning Factors. In Proceedings of the Asme Turbo Expo: Turbomachinery Technical Conference and Exposition, Oslo, Norway, 11–15 June 2018. [Google Scholar]
  22. Kidikian, J.; Reggio, M. Off-Design Prediction of Transonic Axial Compressors, Part 2: Generalized Mean-Line Loss Modelling Methodology. In Proceedings of the Asme Turbo Expo: Turbomachinery Technical Conference and Exposition, Oslo, Norway, 11–15 June 2018. [Google Scholar]
  23. Zhang, Y.Y.; Zhang, S.J. Performance prediction of transonic axial multistage compressor based on one-dimensional meanline method. Proc. Inst. Mech. Eng. Part A J. Power Energy 2021, 235, 1355–1369. [Google Scholar] [CrossRef]
  24. Mohammadian, P.K.; Saidi, M.H. Mean-line model development for off-design performance prediction of transonic axial compressor of an industrial gas turbine based on computational fluid dynamics database. Proc. Inst. Mech. Eng. Part A J. Power Energy 2022, 236, 1449–1471. [Google Scholar] [CrossRef]
  25. Wang, R.; Liu, B.; Yu, X.; An, G. The exploration of bypass matching limitation and mechanisms in a double bypass engine compression system. Aerosp. Sci. Technol. 2021, 119, 107225. [Google Scholar] [CrossRef]
  26. Zheng, J.; Tang, H.; Chen, M.; Yin, F.-J. Equilibrium running principle analysis on an adaptive cycle engine. Appl. Therm. Eng. 2018, 132, 393–409. [Google Scholar] [CrossRef]
  27. Miller, A.S. Compressor Conceptual Design Optimization. Master’s Thesis, Georgia Institute of Technology, Atlanta, GA, USA, 2015. [Google Scholar]
  28. Hosseini, S.E.; Jafaripanah, S.; Saboohi, Z. CFD simulation and aerodynamic optimization of two-stage axial high-pressure turbine blades. J. Braz. Soc. Mech. Sci. Eng. 2024, 46, 666. [Google Scholar] [CrossRef]
  29. Howell, A.R. Fluid Dynamics of Axial Compressors. Proc. Inst. Mech. Eng. 1945, 153, 441–452. [Google Scholar] [CrossRef]
  30. Madadi, A.; Hajilouy Benisi, A. Performance Predicting Modeling of Axial-Flow Compressor at Design and Off-Design Conditions. In Proceedings of the ASME Turbo Expo 2008: Power for Land, Sea, and Air, Berlin, Germany, 9–13 June 2008; pp. 317–324. [Google Scholar]
  31. Yan, W.; Zheng, Q.; Chi, Z.; Jiang, B. Improving the accuracy of one-dimensional analysis in axial compressor performance prediction. Phys. Fluids 2025, 37, 037150. [Google Scholar] [CrossRef]
  32. Szuch, J.R.; Seldner, K. Real-Time Simulation of F100-PW-100 Turbofan Engine Using the Hybrid Computer; E-8136; NASA: Washington, DC, USA, 1975. [Google Scholar]
  33. Szuch, J.R.; Bruton, W.M. Real-Time Simulation of the TF30-P-3 Turbofan Engine Using a Hybrid Computer; E-7904; NASA: Washington, DC, USA, 1974. [Google Scholar]
  34. Liu, B.; Wang, R.; Yu, X. On the mode transition of a double bypass variable cycle compression system. Aerosp. Sci. Technol. 2020, 98, 105743. [Google Scholar] [CrossRef]
  35. Wang, R.; Yu, X.; Liu, B.; An, G. Exploration of acceptable operating range for a compression system in a double bypass engine. Chin. J. Aeronaut. 2023, 36, 111–122. [Google Scholar] [CrossRef]
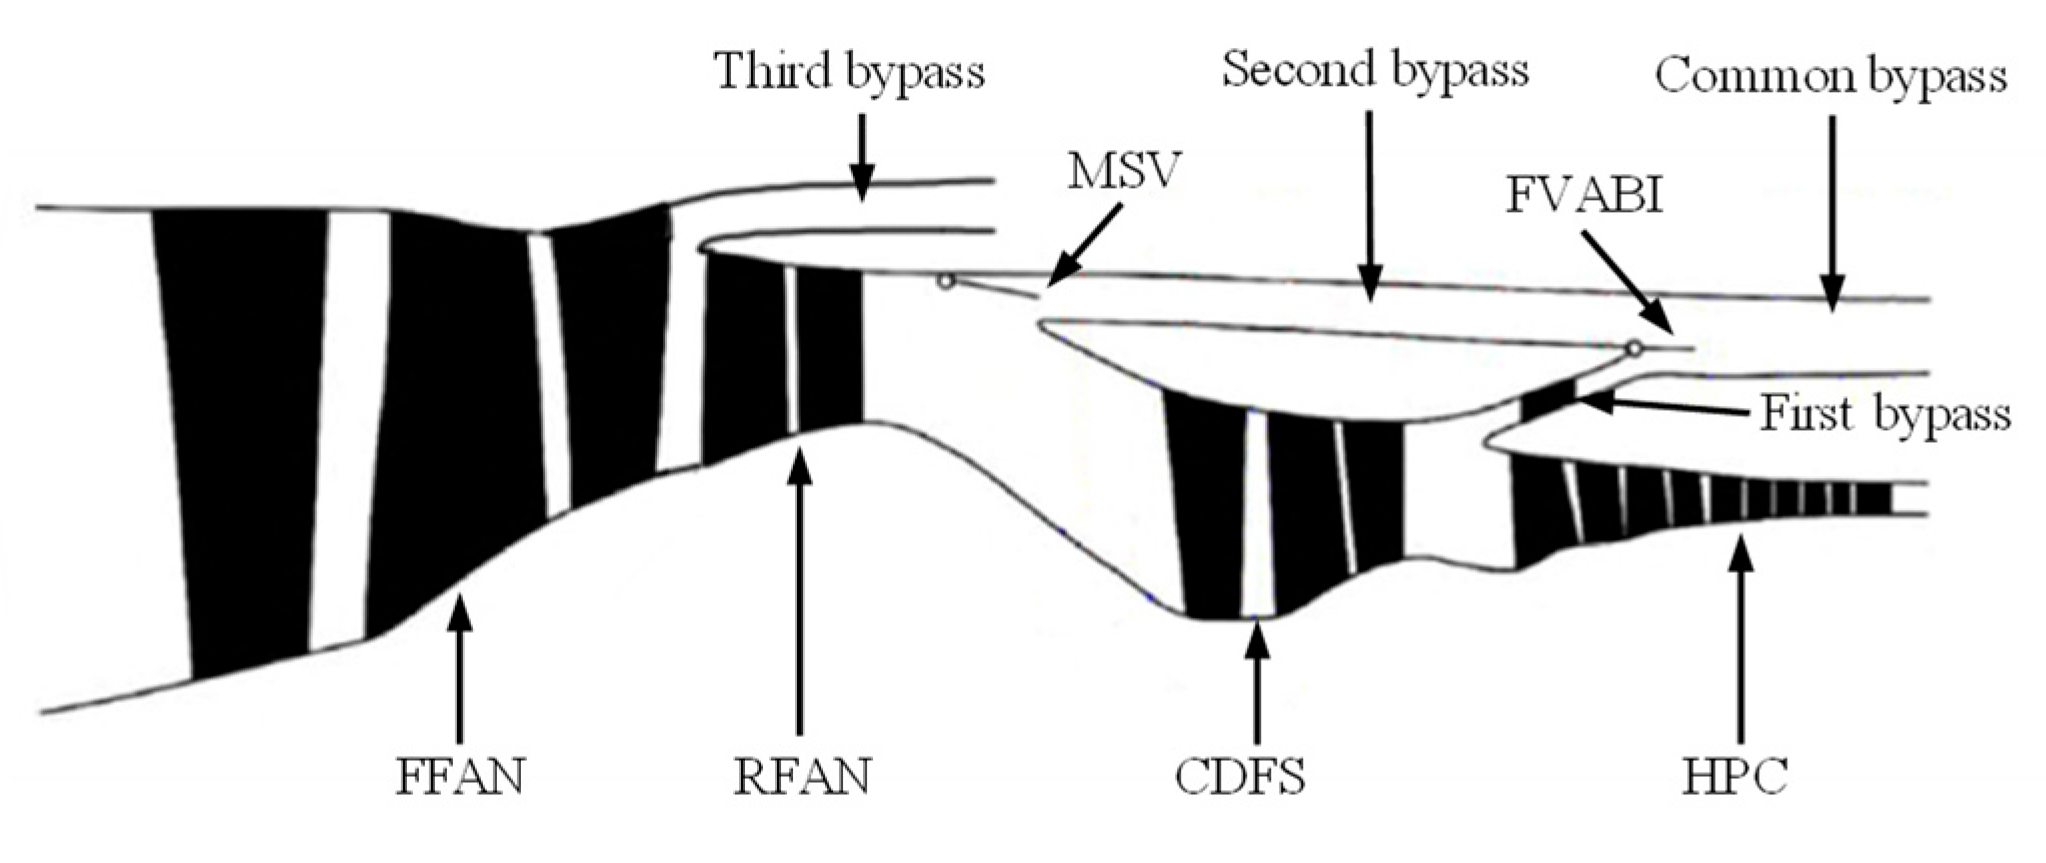
Figure 1. Triple-bypass ACE compression system.
Aerospace 12 00775 g001
Figure 2. Integrated analysis framework of the triple-bypass ACE compression system.
Aerospace 12 00775 g002
Figure 3. State-driven incremental solving process.
Aerospace 12 00775 g003
Figure 4. The multi-streamline method.
Aerospace 12 00775 g004
Figure 5. Integrated analysis framework of the double-bypass compression system.
Aerospace 12 00775 g005
Figure 6. Validation of the integrated analysis program. (a) Total and bypass pressure ratio. (b) Bypass ratios.
Aerospace 12 00775 g006
Figure 7. The distribution of δ and its sensitivity ratio to pressure ratio and efficiency. (a) δ distribution surface. (b) Sensitivity ratio |Sπ|/|Sη|.
Aerospace 12 00775 g007
Figure 8. Influence of SMFFAN on bypass ratio.
Aerospace 12 00775 g008
Figure 9. Influence of SMRFAN on bypass ratio.
Aerospace 12 00775 g009
Figure 10. Influence of SMCDFS on bypass ratio.
Aerospace 12 00775 g010
Figure 11. Influence of LP shaft speed on bypass ratio.
Aerospace 12 00775 g011
Figure 12. Influence of HP shaft speed on bypass ratio.
Aerospace 12 00775 g012
Figure 13. Influence of CDFS VIGV angle on bypass ratio.
Aerospace 12 00775 g013
Figure 14. Feasible operating zone of the FFAN on the datum point.
Aerospace 12 00775 g014
Figure 15. Influence of SMFFAN on feasible operating zone.
Aerospace 12 00775 g015
Figure 16. Effect of LP shaft on feasible operating zone.
Aerospace 12 00775 g016
Figure 17. Influence of HP shaft on feasible operating zone.
Aerospace 12 00775 g017
Figure 18. Influence of CDFS VIGV angle on feasible operating zone.
Aerospace 12 00775 g018
Figure 19. The CDFS matching state when Btot rises abnormally.
Aerospace 12 00775 g019
Table 1. Component solving requirements.
ComponentSolving Requirements
Split nodeInlet total temperature/pressure + Flow distribution
Combine nodeInlet total temperature/pressure (Two inlets) + Flow distribution
Compressor ductInlet total temperature/pressure + Arbitrary state indicator (e.g., Stall Margin, mass flow Rate, Pressure Ratio...)
Bypass ductInlet Total Temperature/Pressure + mass Flow
Table 2. Datum point of the triple bypass engine compression system.
Matching ParameterDatum PointRange
SMFFAN10%0–25%
SMRFAN20%0–35%
SMCDFS15%0–30%
SMHPC20%0–35%
CDFS VIGV angle40°0–40°
Disclaimer/Publisher’s Note: The statements, opinions and data contained in all publications are solely those of the individual author(s) and contributor(s) and not of MDPI and/or the editor(s). MDPI and/or the editor(s) disclaim responsibility for any injury to people or property resulting from any ideas, methods, instructions or products referred to in the content.