Article

Spectral Emissivity Measurement of Supersonic Nozzles for Radiative Cooling Performance Evaluation

by
Su-Wan Choi
1,
Seunghyun Jo
2,
Bu-Kyeng Sung
2,
Jae-Eun Kim
1,
Keon-Hyeong Lee
1,
Gyeong-Ui Mo
1 and
Jeong-Yeol Choi
1,2,*
1
Department of Aerospace Engineering, Pusan National University, Busan 46241, Republic of Korea
2
International Liberal Arts & Science Institute (ILIC), Pusan National University, Busan 46241, Republic of Korea
*
Author to whom correspondence should be addressed.
Aerospace 2025, 12(9), 771; https://doi.org/10.3390/aerospace12090771
Submission received: 26 July 2025 / Revised: 20 August 2025 / Accepted: 25 August 2025 / Published: 27 August 2025
(This article belongs to the Special Issue Space Propulsion: Advances and Challenges (3rd Volume))

Abstract

In this study, emissivity was employed as the primary metric for evaluating the radiative-cooling performance of a supersonic nozzle under flight-like conditions. A supersonic nozzle was fabricated by PBF, after which combustion (hot-fire) tests and emissivity measurements were carried out. These data enabled quantification and visualization of radiant energy in the 8–14 µm-wavelength band during combustion. The hot-fire tests revealed a clear cap-shock pattern, confirming that the nozzle flow was fully developed. Emissivity measurements showed that the additively manufactured surface—subsequently treated by the AMS 5662 heat-treatment process—followed the angular-emission trends reported in previous studies. The surface exhibited a high roughness (Ra ≈ 30 µm) and an emissivity of 0.85 in the 8–14 µm band; a temperature-dependent emissivity fitting function was accordingly derived. By coupling the combustion test results with the emissivity data, the actual temperature distribution along the nozzle surface and the corresponding radiant energy in the 8–14 µm band were quantitatively reconstructed and visualized. The maximum emissive power in this band reached 2214 W m−2, representing at least 16.61% of the total black-body radiation at 700 K.

1. Introduction

Chemical space propulsion systems typically utilize liquid bipropellants to achieve high specific impulse. Representative bipropellants include MonoMethylHydrazine/Nitrogen TetrOxide (MMH/NTO) and hydrazine/NTO [1,2,3,4,5]. Since these propellants can raise the combustion chamber temperature to approximately 3000 K, the chamber must be fabricated from high-temperature-resistant materials [6,7]. Such extreme thermal loads also necessitate active cooling, thereby increasing system complexity. Recently, there have been numerous efforts to apply metal 3D printing technology to liquid bipropellant propulsion systems. These efforts span from large nozzles used in upper-stage rocket engines of launch vehicles to small bipropellant thruster nozzles with throat diameters of less than 1 mm [8,9,10]. The primary motivation behind this trend lies in the geometric complexity of nozzles—particularly those incorporating regenerative cooling—which makes it difficult to manufacture them as a single part using conventional methods. Traditional machining techniques are often time-consuming and costly, whereas metal 3D printing has emerged as a promising alternative to address these limitations. The use of metal 3D printing in the manufacturing of upper-stage rocket engines offers a high degree of geometric freedom and plays a critical role in overcoming challenges associated with complex nozzle geometries [8,11,12,13]. For example, Moriya et al. evaluated the bond strength of two metal 3D printing techniques—Laser Metal Deposition (LMD) and Direct Metal Laser Sintering (DMLS)—for a regeneratively cooled combustor and fabricated a prototype combustor liner [13]. Additionally, Gradl et al. fabricated upper-stage rocket engine nozzles using the Directed Energy Deposition (DED) process with Inconel 625 and JBK-75 alloys, followed by combustion tests. Each nozzle featured regenerative cooling channels [9]. Since the size and cross-sectional area of bipropellant thruster nozzles are significantly smaller than those of upper-stage rocket engines, the application of regenerative cooling to such nozzles becomes challenging. Therefore, a more suitable cooling method is required for these systems. Possible alternatives include ablative cooling and film cooling. However, ablative cooling is not appropriate for bipropellant thrusters that require multiple ignitions, and film cooling suffers from the drawback of reducing specific impulse, resulting in incomplete combustion. As a result, radiative cooling is commonly employed in supersonic nozzle of bipropellant thrusters to enable simpler system integration [14].
Metal 3D printing is a manufacturing method that builds components by adding metal powder layer by layer; therefore, there is no need additional machining process. As a result, using metal 3D printing for rocket nozzle fabrication can significantly reduce both manufacturing time and cost. However, components fabricated via 3D printing typically do not possess the smooth surface roughness achieved through CNC machining. Since the performance of radiative cooling is highly dependent on surface emissivity, such surface characteristics may impact thermal radiation performance. This issue becomes more critical in small-scale systems, such as bipropellant thrusters, where the nozzle is exposed to higher heat fluxes, even at similar combustion chamber temperatures. Therefore, when metal 3D printing is employed for the fabrication of upper-stage engines or bipropellant thrusters where radiative cooling is used, it becomes essential to quantitatively evaluate the cooling performance. To the best of the authors’ knowledge, no study has yet quantified two-dimensional maps of emissivity and wall temperature in rocket nozzles operating under spatially non-uniform thermal loads. Furthermore, because additively manufactured (3D-printed) surfaces typically exhibit higher roughness than their machined counterparts, their wavelength-specific emissivity behavior remains to be systematically examined.
The present study seeks to quantify two-dimensional distributions of emissive power and surface temperature in supersonic nozzles subjected to the spatially non-uniform thermal loads characteristic of propulsion environments. In previous studies, a material’s total hemispherical emissivity is reported as a single value tied to a specific surface condition and temperature. Consequently, on surfaces experiencing non-uniform heat flux—such as in propulsion environments—measuring only the total hemispherical emissivity provides information for a single state. One could divide the nozzle surface into multiple locations and repeatedly measure the total hemispherical emissivity for each location’s condition to evaluate radiative cooling performance; however, this approach is time- and cost-intensive. Accordingly, this study measures emissive power and surface temperature under non-uniform heat-flux conditions using a simpler method and simultaneously acquires data at multiple points on the nozzle surface. Here, we refer to the physical quantities distributed over the supersonic nozzle surface as “two-dimensional maps”. In addition, we compare the emissivity of additively manufactured nozzles with values reported for conventionally machined hardware and evaluate the radiative emissive power in the 8–14 µm band. To construct the two-dimensional maps, it was necessary during the combustion test to obtain data from the nozzle surface over an area rather than at points or along a line, and, because the combustion time was short, a rapid response to temperature changes was required. This was not feasible with thermocouples, so an IR camera was used. Because an IR camera was employed, the measurable wavelength band was limited to 8–14 µm. This band is the wavelength range most readily available for machine-vision IR cameras; therefore, a camera operating in this band was selected. As stated in the Conclusion, widening the measurement wavelength band would allow a more accurate determination of radiative-cooling performance. To this end, a nozzle was fabricated from Inconel 718 via powder-bed-fusion additive manufacturing and subsequently hot-fire tested. In situ measurements of surface emissivity were acquired during combustion, and a two-dimensional radiative emissive power map was reconstructed, providing a quantitative and intuitive assessment of the nozzle’s radiative-cooling performance. The emissivity of Inconel 718 has been investigated under various conditions in previous studies. These studies focused on variables such as material composition, phase transitions, surface treatment, and measurement angle across a wide temperature range. Alaruri et al. measured the emissivity of Inconel 718 alloys at a wavelength of 1.6 µm between 923.15 K and 1323.15 K and reported an average emissivity of 0.853, with a minimum value ranging between 0.8 and 0.95 [15]. Several studies have also investigated the effects of surface treatment. Greene et al. [16] examined emissivity changes due to surface oxidation and observed an increase from 0.24–0.33 (as-received) to a maximum of 0.84–0.91 (sandblasted and oxidation) within the temperature range of 473.15 K to 1273.15 K. Tanda et al. [17] and Campo et al. [18] compared emissivity for different surface conditions, such as polished, EDM-machined, brushed, and sandblasted surfaces, and found a general trend of increasing emissivity with surface roughness. Keller et al. also studied the effects of different surface treatments, including oxidation, sandblasting, and graphite coating, and found that the emissivity of sandblasted surfaces increased from 60 grit to 120 grit, after which the increase gradually plateaued [19]. Leshock et al. [20] reported emissivity ranging from approximately 0.5 to 1 for Inconel 718 processed with Plasma-Enhanced Machining (PEM) at 723.15 K to 973.15 K. Near the melting point (~1500 K), Pottlacher et al. [21] and Cagran et al. [22] measured emissivity values between 0.37 and 0.55 and between 0.37 and 0.44, respectively. In terms of angular dependency of emissivity measurement, Schmidt and Eckert et al. [23] found that Ni exhibits relatively small emissivity variations with measurement angle. Campo et al. [18] observed that emissivity remained constant between 0° and 75°, with a sharp drop beyond 75°. Li et al. [24] also investigated the effect of angular dependency on the spectral emissivity measurement of Inconel 718 within a temperature range of 673–873 K and a wavelength range of 3–20 µm. The results indicate that the spectral emissivity measurements remain nearly consistent up to at least 70°, which is in good agreement with the findings of Campo et al. [18] While these studies have greatly advanced our understanding of Inconel 718 emissivity under various conditions, they are primarily limited to material-level investigations. There is a lack of studies that evaluate radiative cooling performance in actual propulsion applications. Therefore, this study aims to quantify the surface emissivity of metal 3D-printed nozzles, evaluate the influence of surface treatment techniques, and assess the actual radiative cooling performance in comparison with the ideal case. Moreover, we aim to visualize the overall emissivity distribution of a real supersonic nozzle. To this end, a supersonic nozzle was designed and fabricated using the DED technique and subjected to combustion testing. During the test, the inner surface of the nozzle was heated, and the temperature-dependent spectral emissivity was measured over a temperature range of approximately 320 K to 650 K. The results revealed a distinct temperature-dependent variation in emissivity.

2. Methodology

2.1. Supersonic Nozzle Design and Fabrication

2.1.1. Supersonic Nozzle Design

While the maximum performance of a nozzle can be achieved using the Method of Characteristics (MOC), this approach has the drawback of increasing nozzle length and, consequently, system weight. The Ideal Contour is based on the MOC, which provides a precise solution for the flow field inside a nozzle, ensuring that all characteristic lines are properly aligned to avoid internal shock waves and maximize nozzle performance. In practice, however, Ideal Contour nozzles tend to be excessively long, making them unsuitable for space-constrained propulsion systems such as bipropellant thrusters or compact upper-stage engines. Therefore, modifications to MOC-based nozzle designs are necessary to optimize thrust while minimizing length. Well-known thrust optimization techniques include Thrust-Optimized Contour (TOC) methods.
The TOC method, originally proposed by Rao in 1958, aims to achieve maximum thrust at minimum length by accounting for boundary layer growth [25]. The TOC method is based on the principle of minimizing length while providing smooth, shock-free expansion of exhaust gases to ambient pressure. The design process typically starts with defining key parameters such as throat radius, exit radius, and nozzle expansion ratio, which are determined based on mission requirements and propellant characteristics. The contour itself consists of three regions: a converging section, a short throat region, and a diverging bell section. In the diverging section, the nozzle wall profile is generated by smoothly connecting a circular arc near the throat to a conical section at the exit. The circular arc allows for a gradual acceleration of the exhaust gases, while the conical section ensures efficient expansion to supersonic velocities. Rao’s method optimizes the length of the nozzle by reducing unnecessary diverging length while preventing flow separation within the nozzle. The primary advantage of the Rao nozzle contour is its compact and efficient geometry, which provides higher performance than conical nozzles of equivalent expansion ratio. For chemical space propulsion systems, including bipropellant thrusters and upper-stage engines, this method is especially valuable in minimizing weight and integrating cooling channels, making it well-suited for metal 3D printing applications.
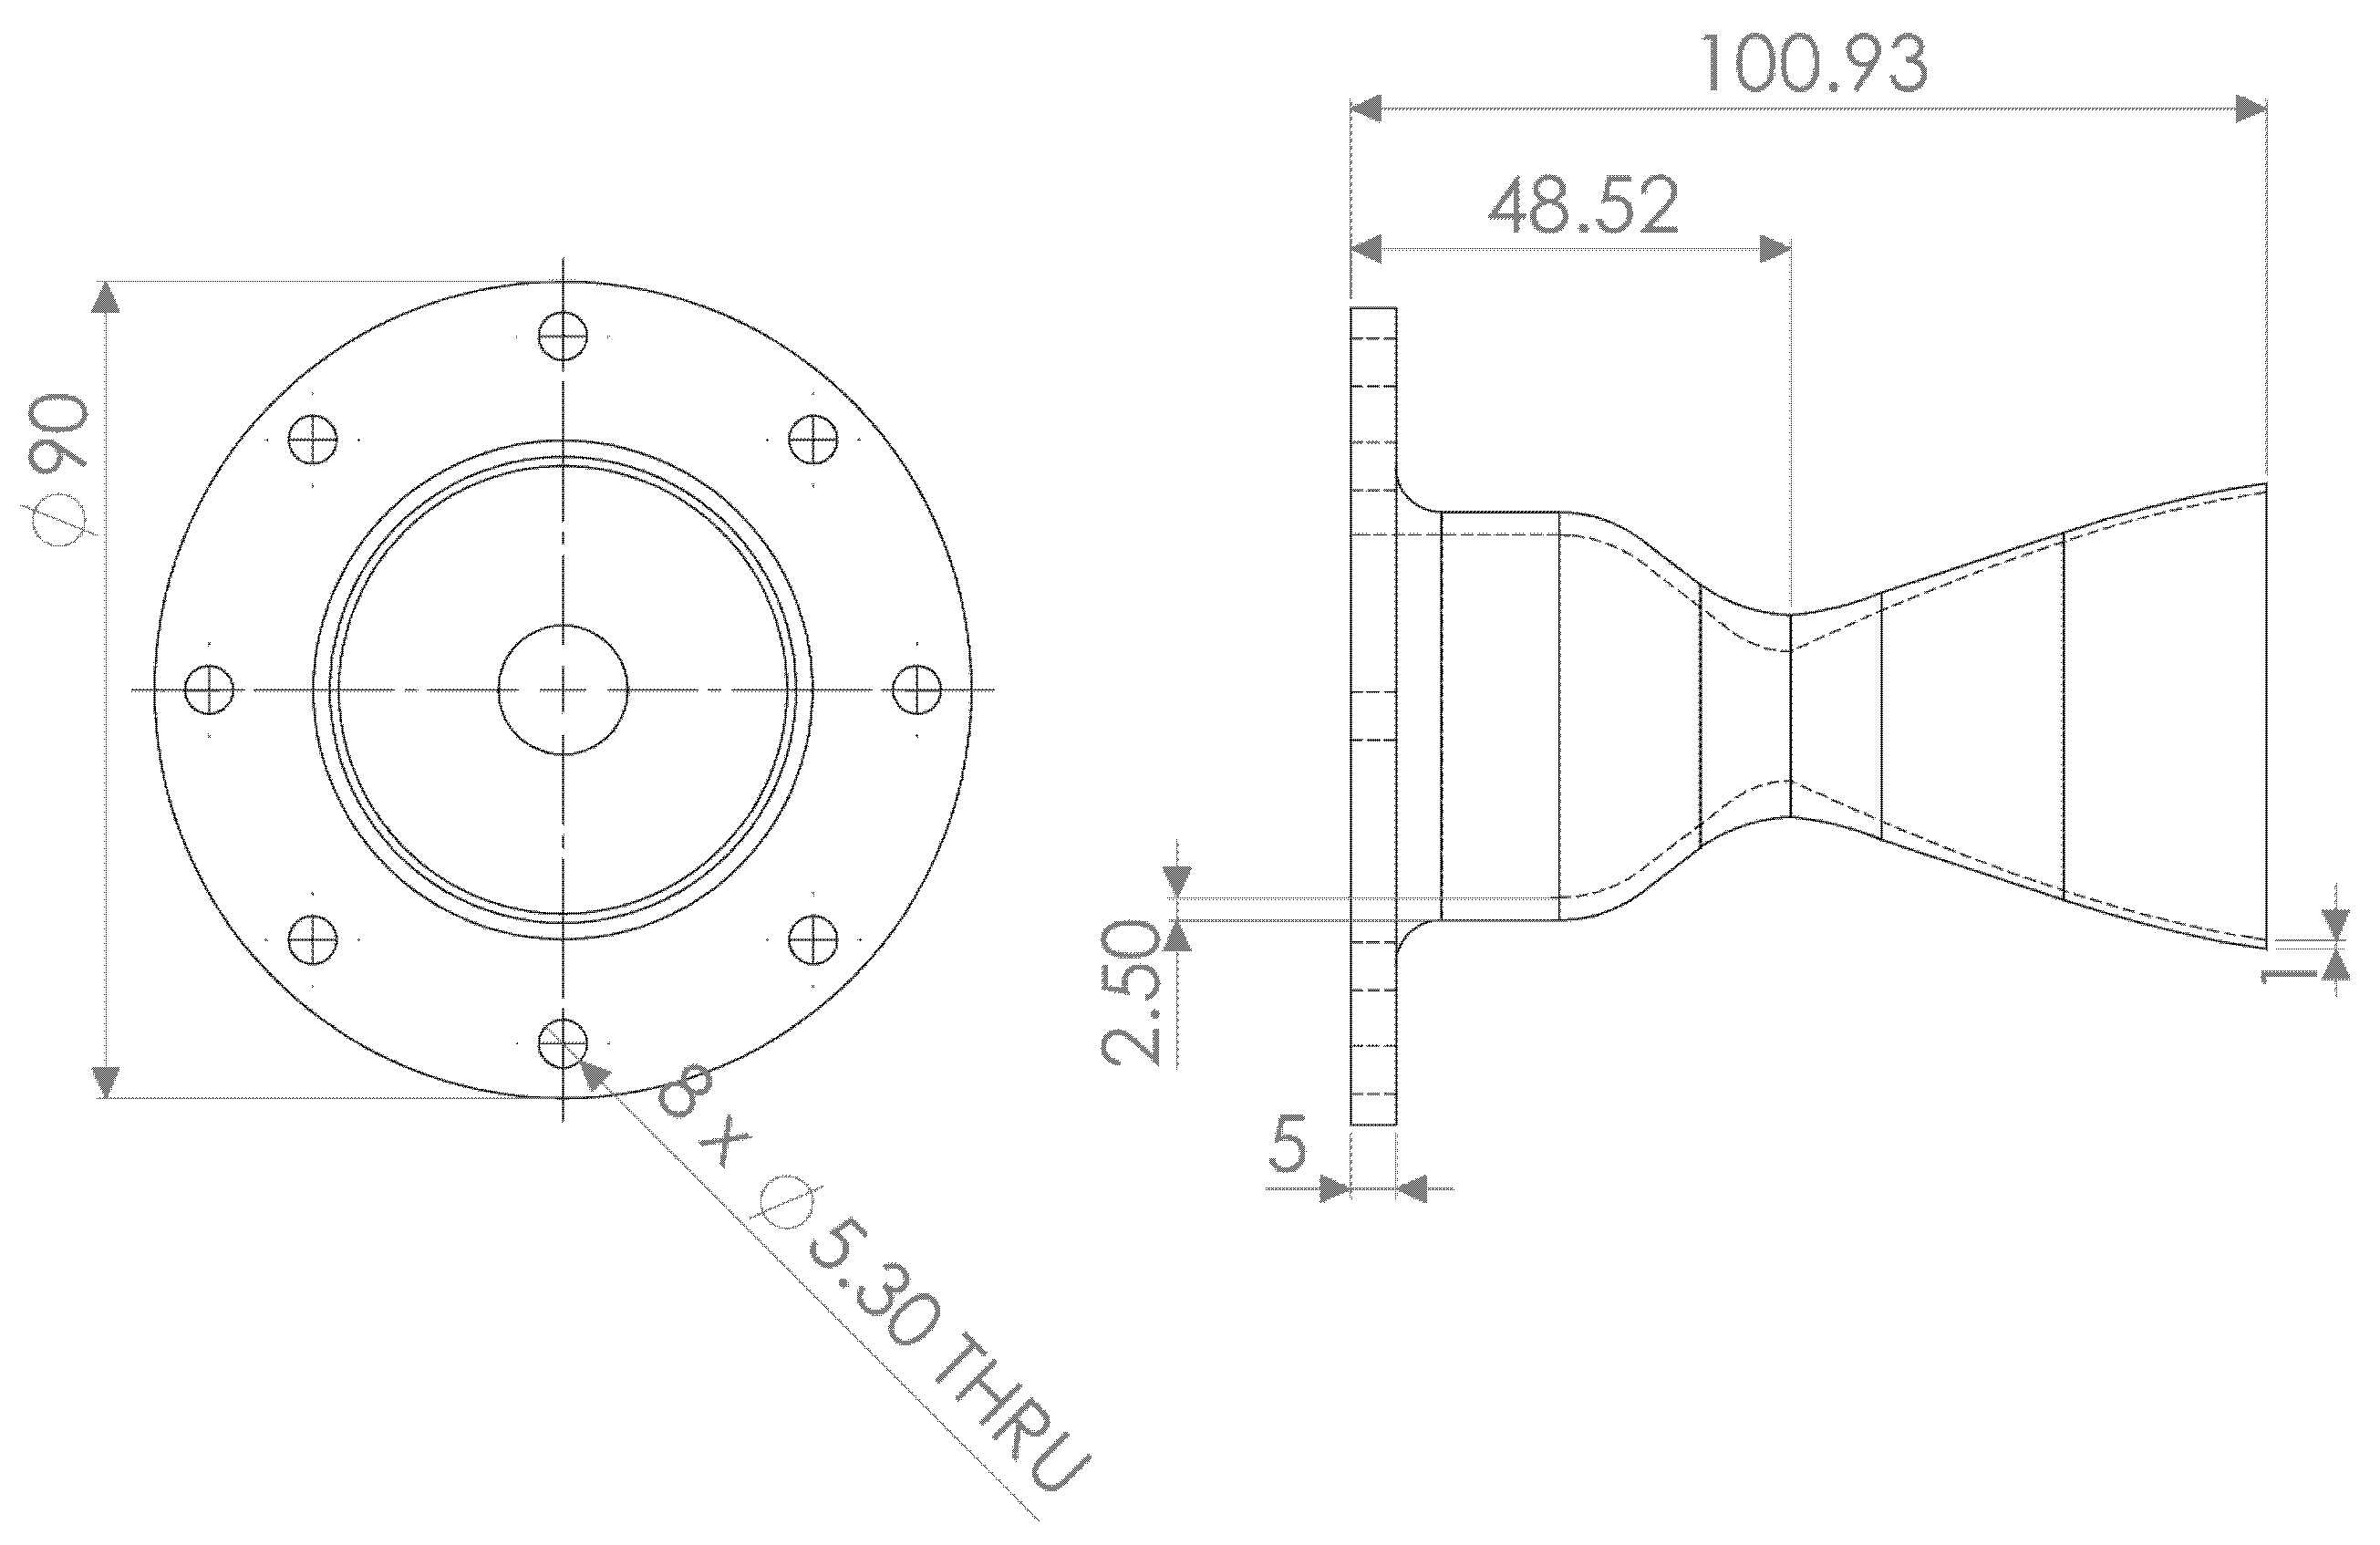
The TOC technique has been validated both theoretically and experimentally and has been reliably applied in engines such as the European Vulcain engine. Therefore, in this study, the TOC technique was selected for nozzle design (Figure 1). Actual supersonic nozzles used in space propulsion are typically designed with large area ratios—often in the hundreds—due to the near-vacuum backpressure conditions in space. However, to prevent flow separation during ground testing, the nozzle in this study was designed with an area ratio of 11.91. The detailed design parameters are presented in Figure 2.
The wall thickness of each section of the nozzle was carefully designed to minimize the amount of material used, particularly in the nozzle extension, with reference to previous studies on combustion chamber structural design [26]. To withstand the mechanical loads during the combustion test, the nozzle flange was designed with a diameter of 90 mm and a thickness of 5 mm. To reduce the required metal powder, a separate hub flange was implemented. The hub flange was also designed to avoid interference with the Vitiated Air Heater (VAH) joints of Pusan National University. As the highest heat flux is expected at the throat—the narrowest region of the nozzle—the wall thickness in this section was designed to start at approximately 1.98 mm and gradually increase to a maximum of 4.01 mm along the nozzle throat. From there, the thickness gradually decreased toward the nozzle exit to balance thermal performance and structural stability.

2.1.2. Supersonic Nozzle Fabrication

Two metal 3D printing techniques commonly used for fabricating space supersonic nozzles are Powder Bed Fusion (PBF) and DED. In the PBF process, a high-energy source selectively fuses a uniform layer of metal powder, followed by the deposition of additional layers. In contrast, the DED process involves the simultaneous application of a high-energy source and the direct deposition of metal powder, enabling near-instantaneous melting and bonding. As a result, DED offers faster build rates than PBF and greater flexibility in part size, as it is not limited by the layer-by-layer approach. However, DED typically results in a lower surface finish quality compared to PBF.
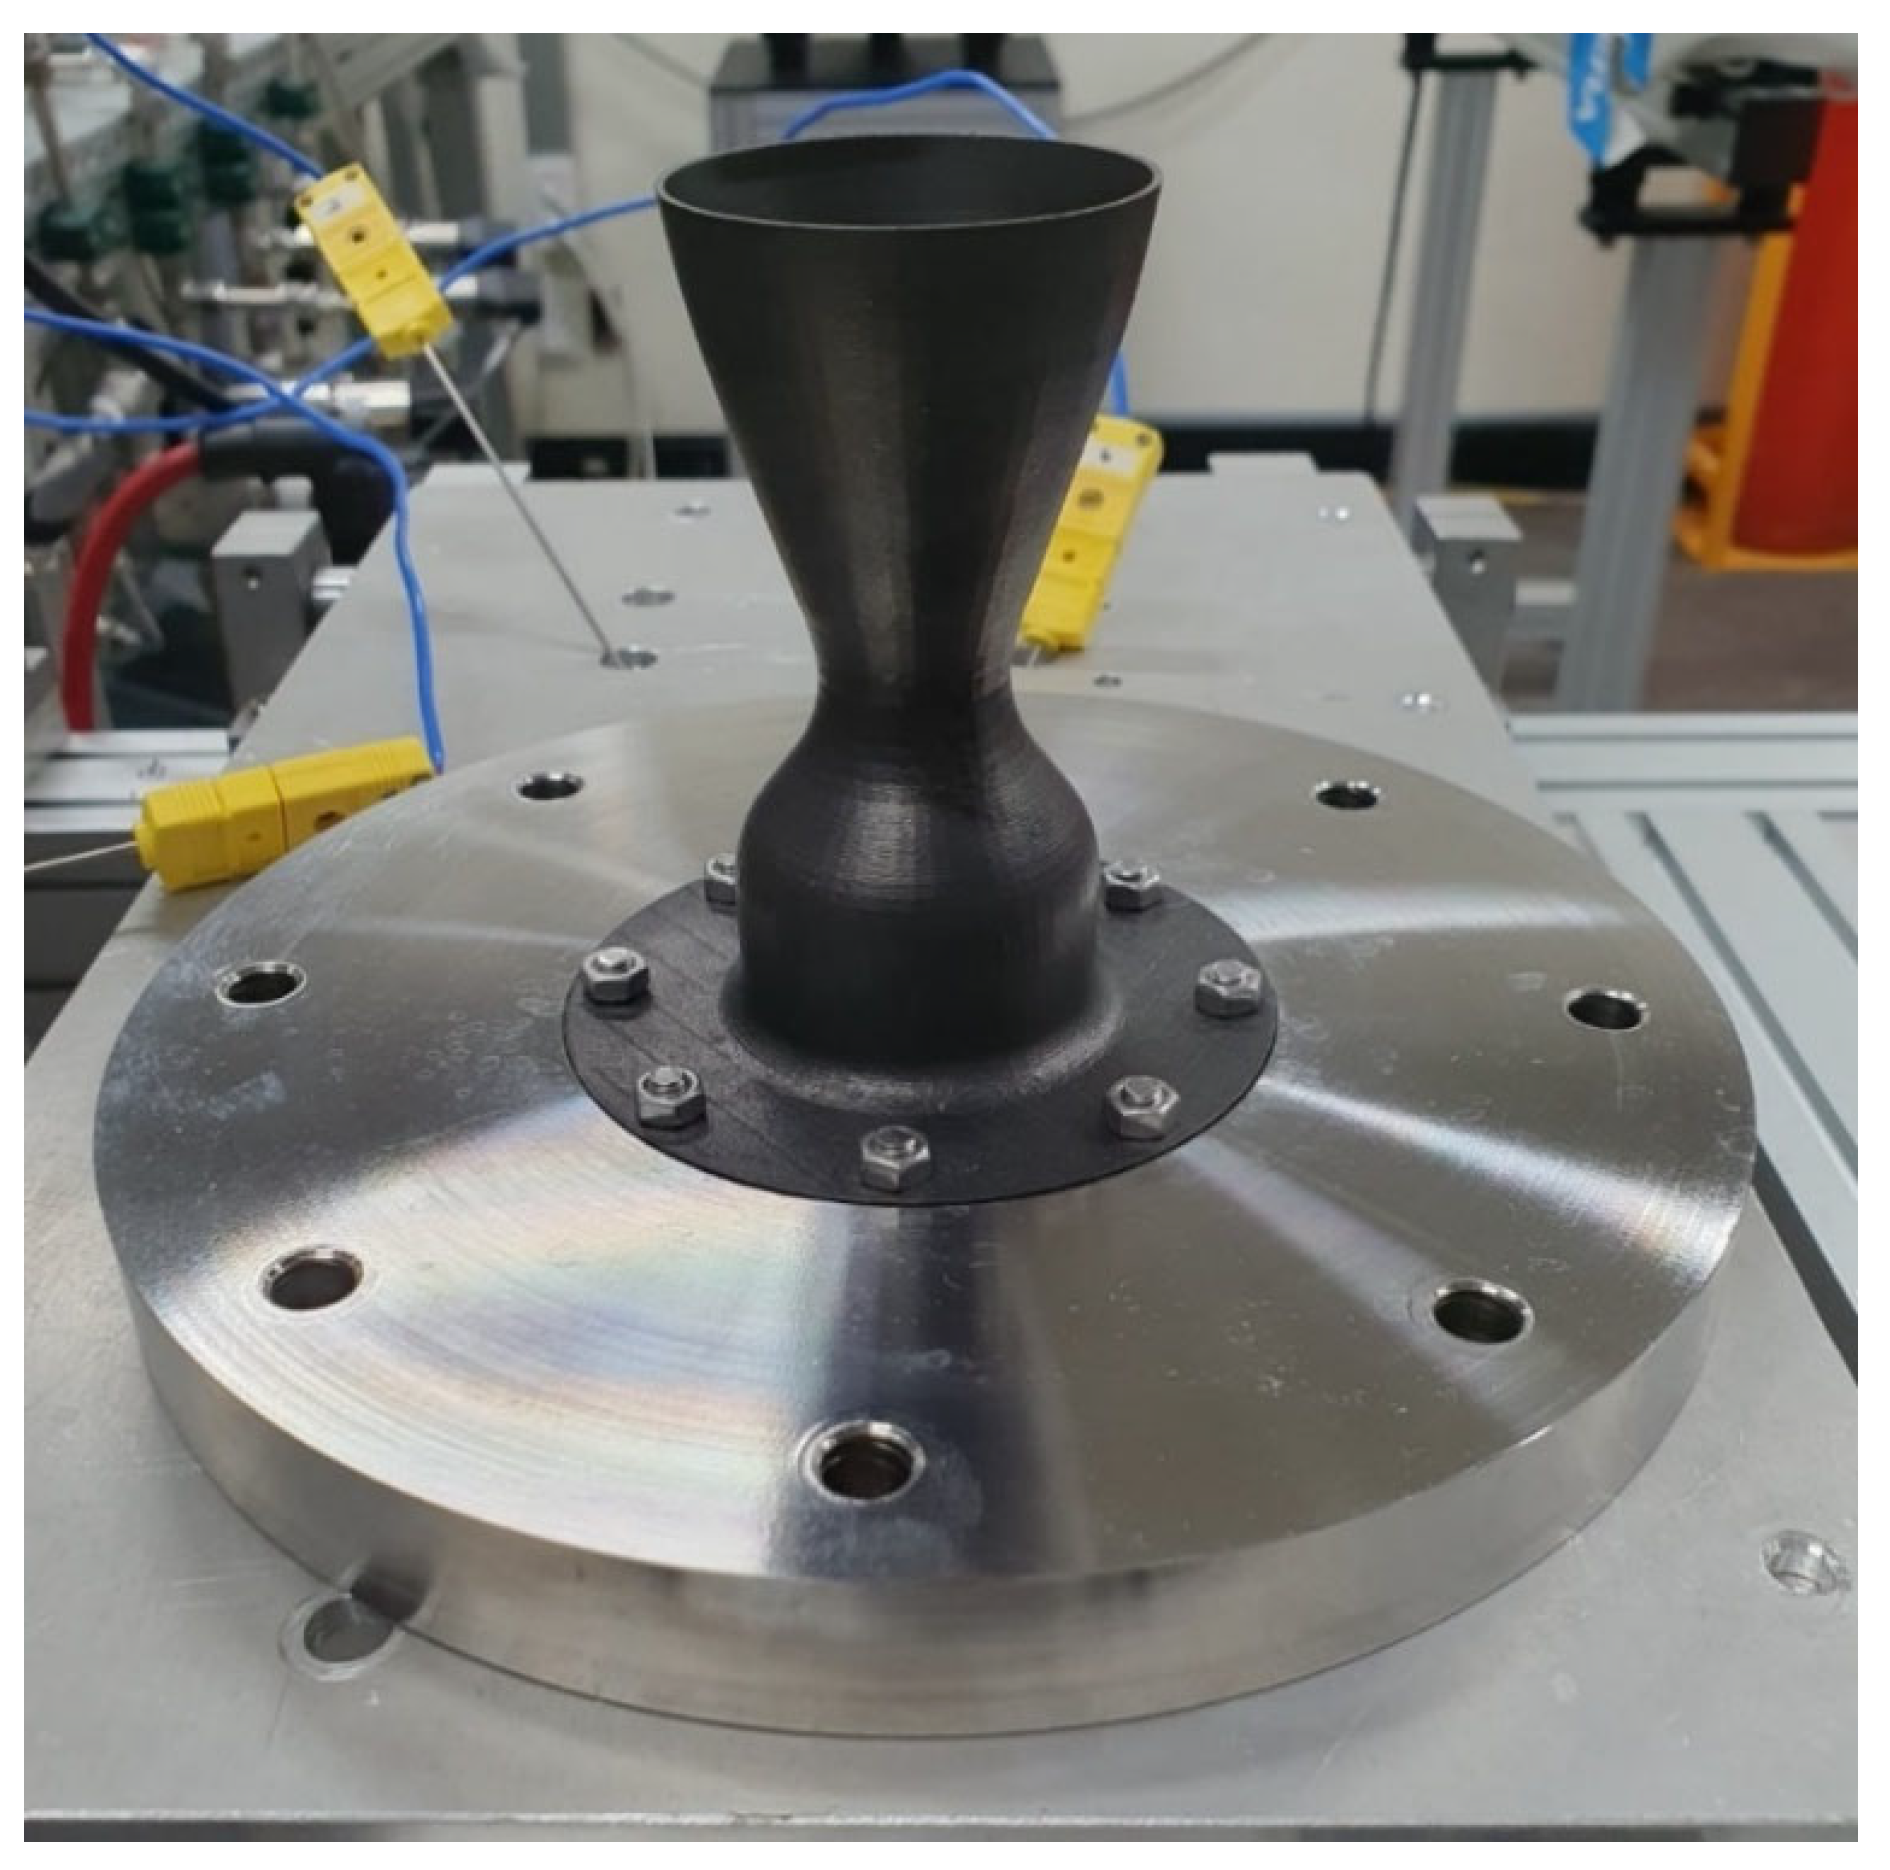
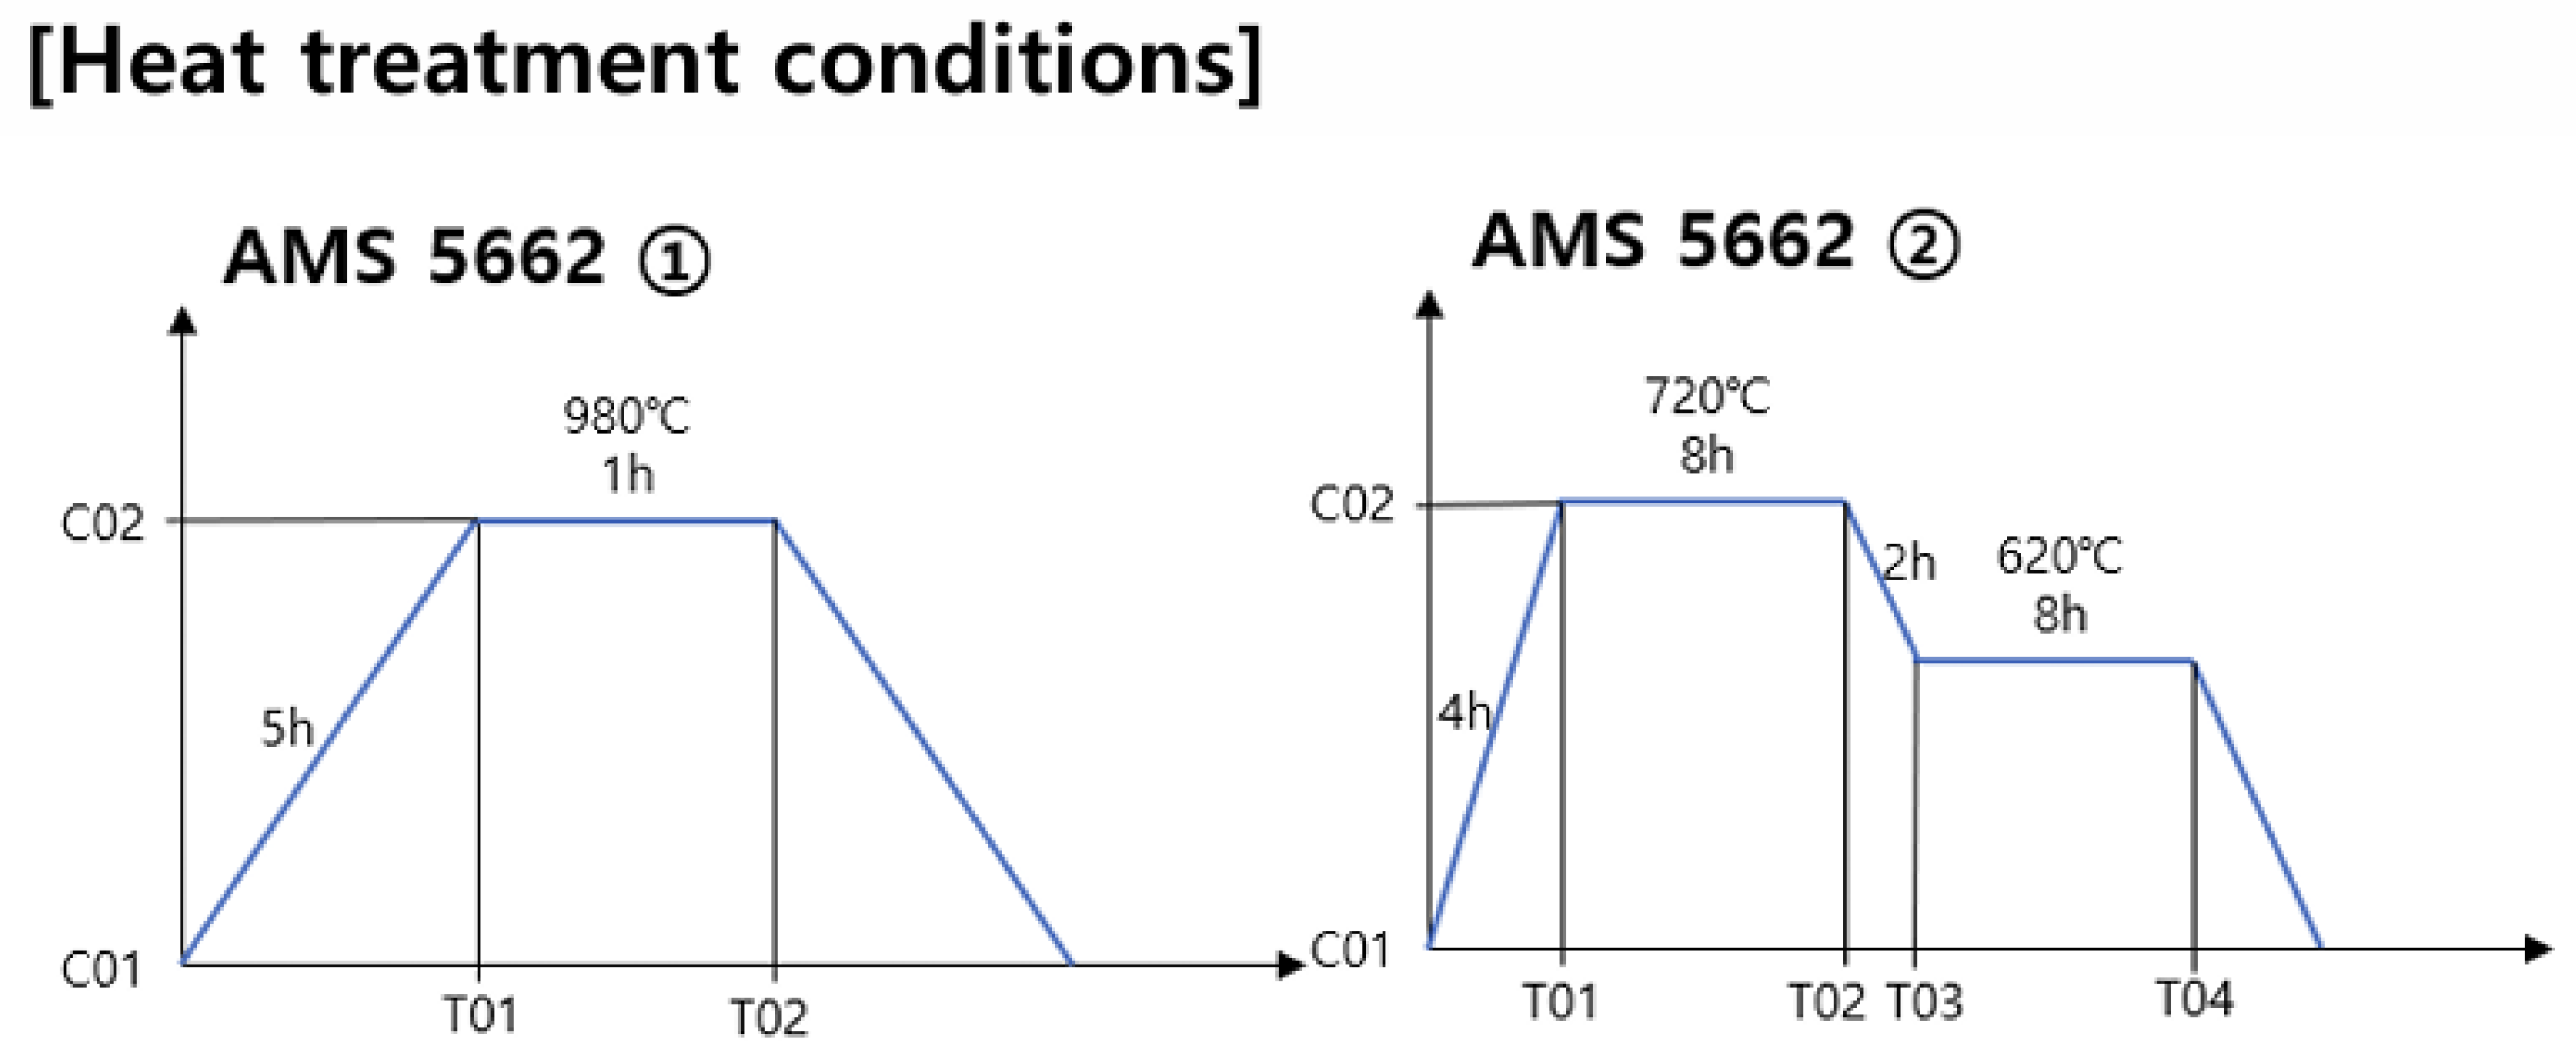
In this study, based on prior research applying metal 3D printing to rocket engine manufacturing [9,10], the PBF process was selected as the fabrication method for the upper-stage engine nozzle. Inconel 718, a nickel-based superalloy commonly used in 3D-printed rocket engine components [27], was chosen as the nozzle material due to its excellent mechanical properties and high-temperature resistance. The nozzle was fabricated using the PBF technique at the Korea Institute of Industrial Technology, and the completed nozzle is shown in Figure 3. The fabricated nozzles were subjected to AMS 5662 [28] heat treatment, a procedure widely used to enhance the mechanical strength of nickel-base super-alloys (Figure 4). Surface roughness and alloy composition after heat treatment are summarized in Table 1.

2.2. Experimental Methodology

2.2.1. Combustion Test Setup

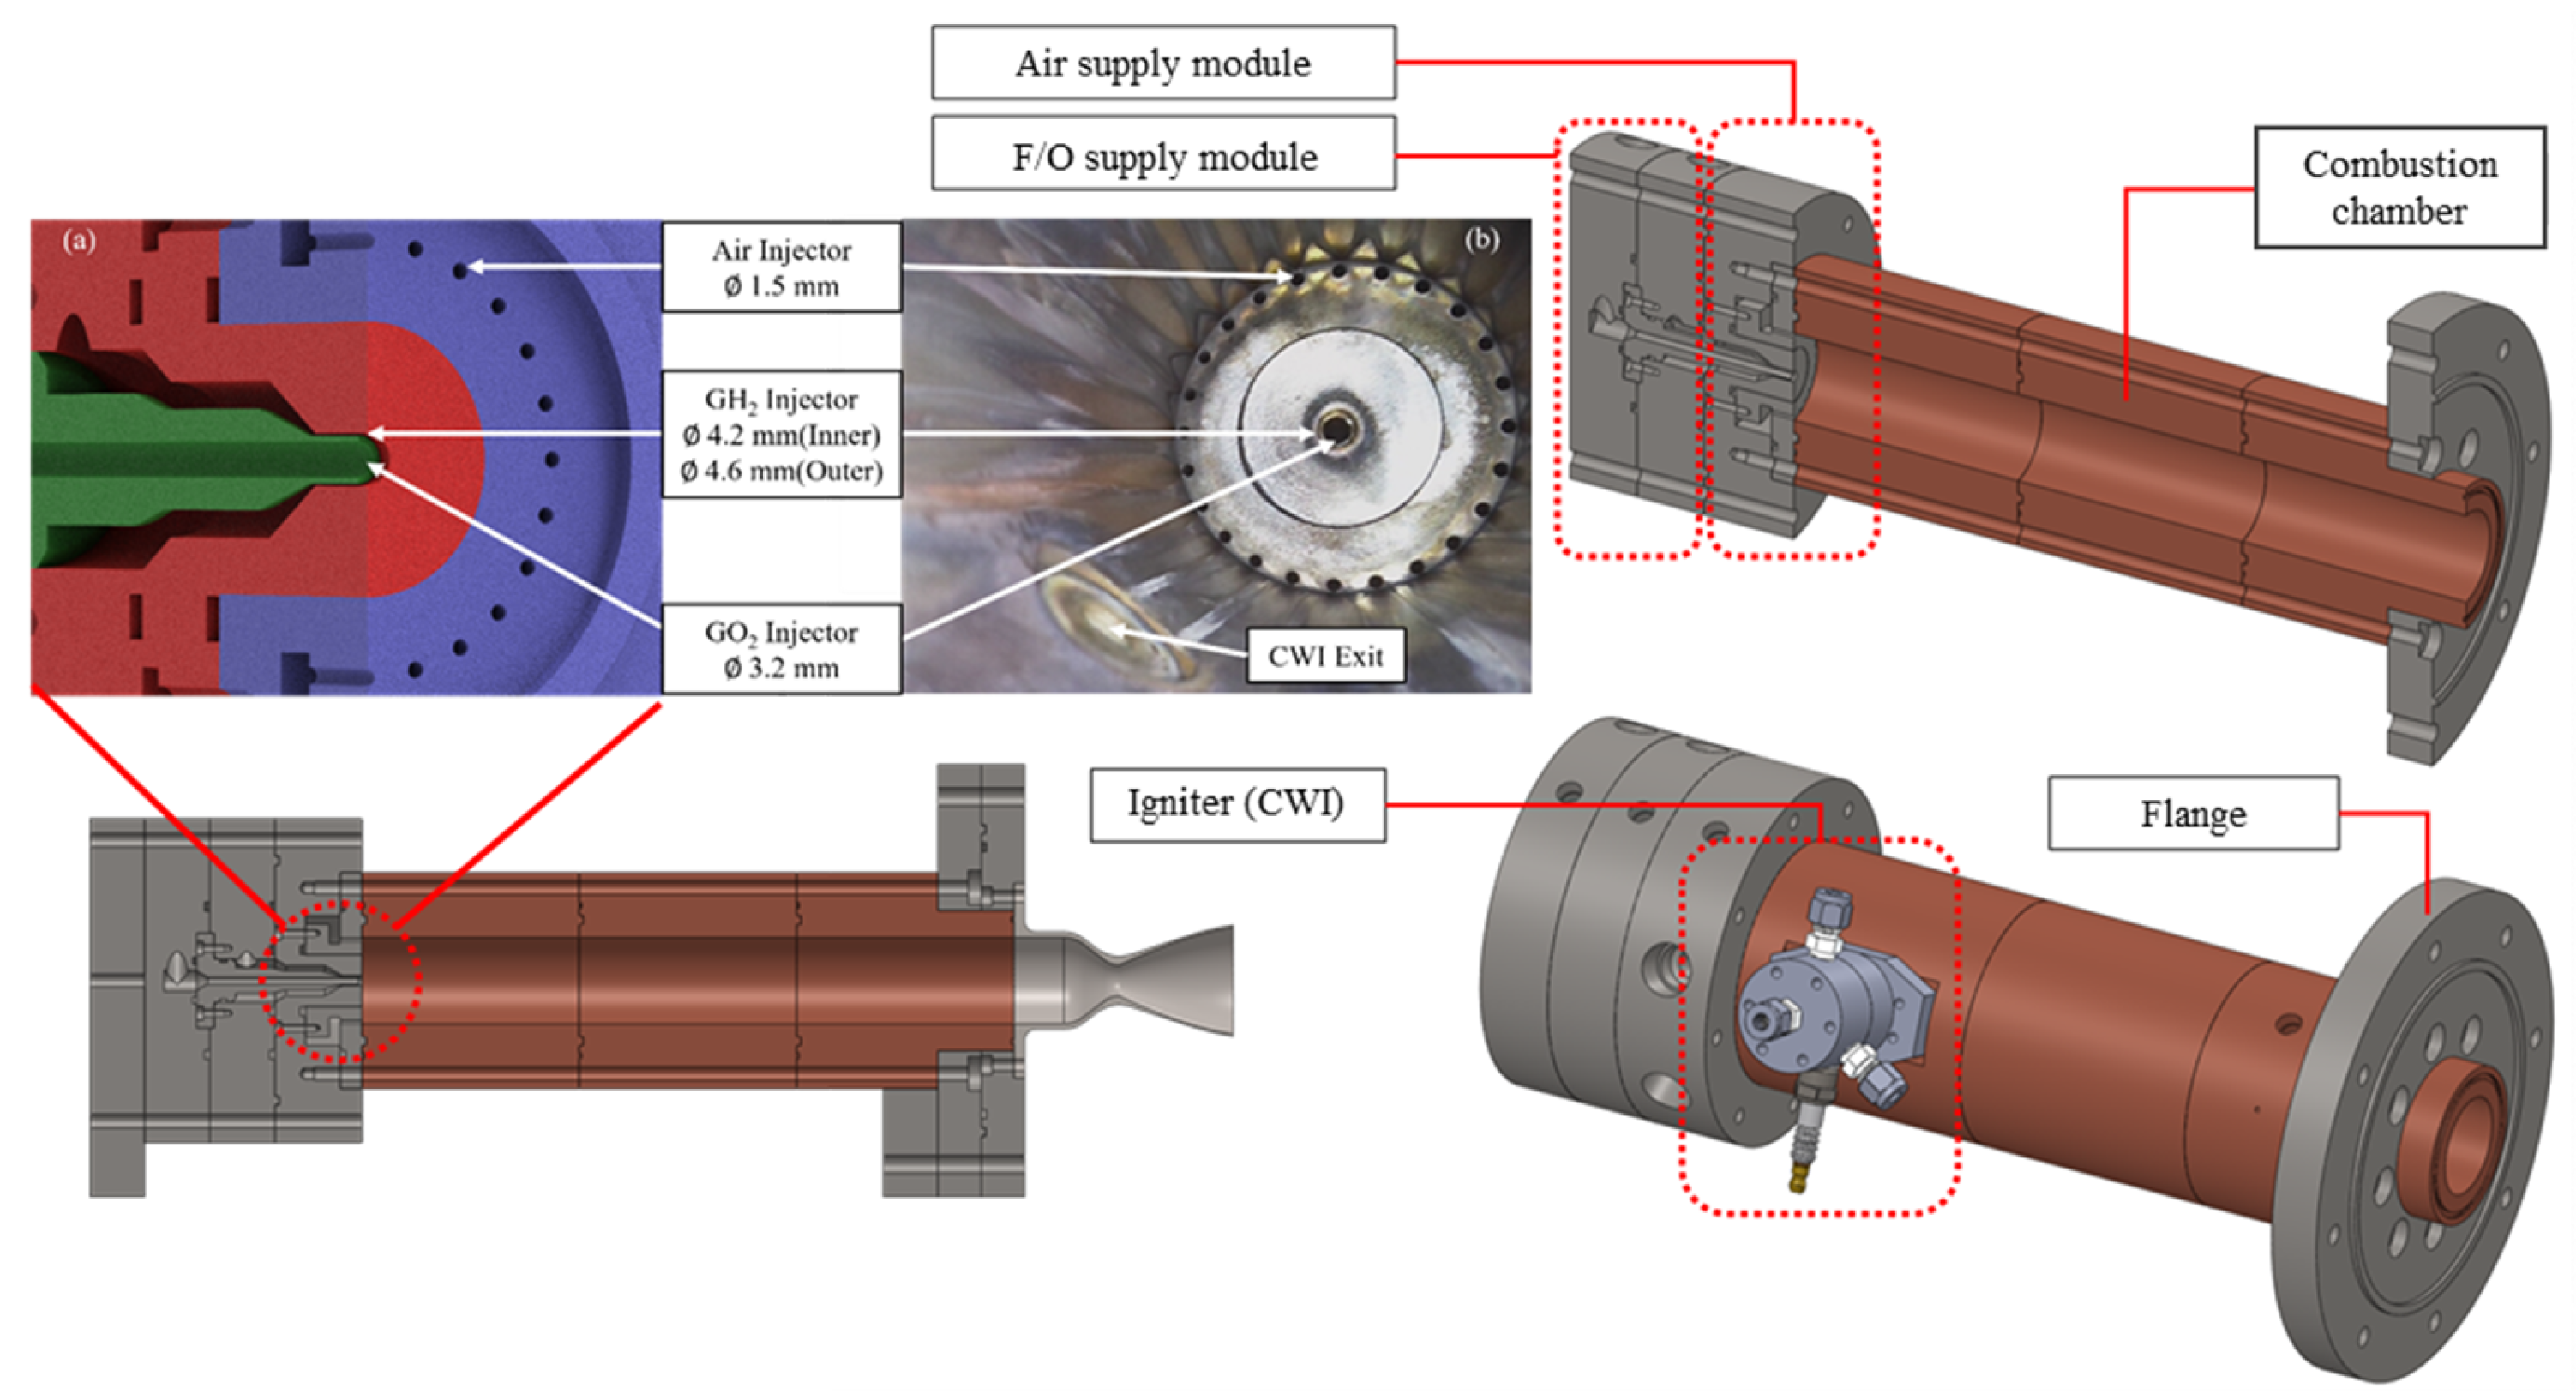
The manufactured nozzle was connected to the VAH facility at Pusan National University for combustion testing. A schematic diagram of the VAH is presented in Figure 5. The VAH is a ground-based test facility originally developed to emulate the inlet conditions of scramjet engines. Due to its operational similarity to rocket combustors, it is well-suited for emulating combustion chamber environments during static tests. In the VAH, propellants are injected into the combustion chamber through coaxial injectors, while air is simultaneously introduced near the chamber walls to protect the inner surfaces from thermal damage during combustion. According to previous studies, combustion of the injected fuel and oxidizer is nearly complete near the VAH exit, ensuring a well-established thermal environment for nozzle performance evaluation [29,30].
For safety reasons, the combustion test of the nozzle was conducted using GH2/GO2 as the fuel/oxidizer. The test was performed under conditions designed through preliminary numerical simulation to ensure fully developed nozzle flow. The operating conditions derived were a total pressure of 22 bar and a total temperature of approximately 1800 K. The combustion was conducted under fuel-lean conditions, with a target equivalence ratio of about 0.35. The designed flow rates were 5.12 g/s for GH2, 62.21 g/s for GO2, and 264.45 g/s for air, resulting in a total flow rate of 331.78 g/s. Based on these parameters and the nozzle area ratio, the outlet Mach number was calculated to be 3.771 using NASA CEA. Combustion visualization was carried out using a digital camera, a high-speed Schlieren imaging system, and a thermal imaging camera. The digital camera (Cyber-Shot DSC-RX100V, Sony, Minato, Tokyo, Japan) and high-speed camera (Phantom v2512, Phantom, Wayne, NY, USA) were used to capture the structure and location of the shock around the nozzle exit during combustion, which served as an indicator of fully developed flow. The thermal imaging camera (PI 640i, Optris, Berlin, Germany) was used to monitor the temperature distribution, as described in a later section. Fuel and oxidizer were supplied using the propellant supply and control system at Pusan National University. The system configuration is shown in the Pipe and Instrumentation Diagram (P&ID) in Figure 6. Pressure, flow rates, and valve actuation were monitored and controlled through a central control PC using LabVIEW and a DAQ system (NI cRIO 9045, Austin, TX, USA) during the test.
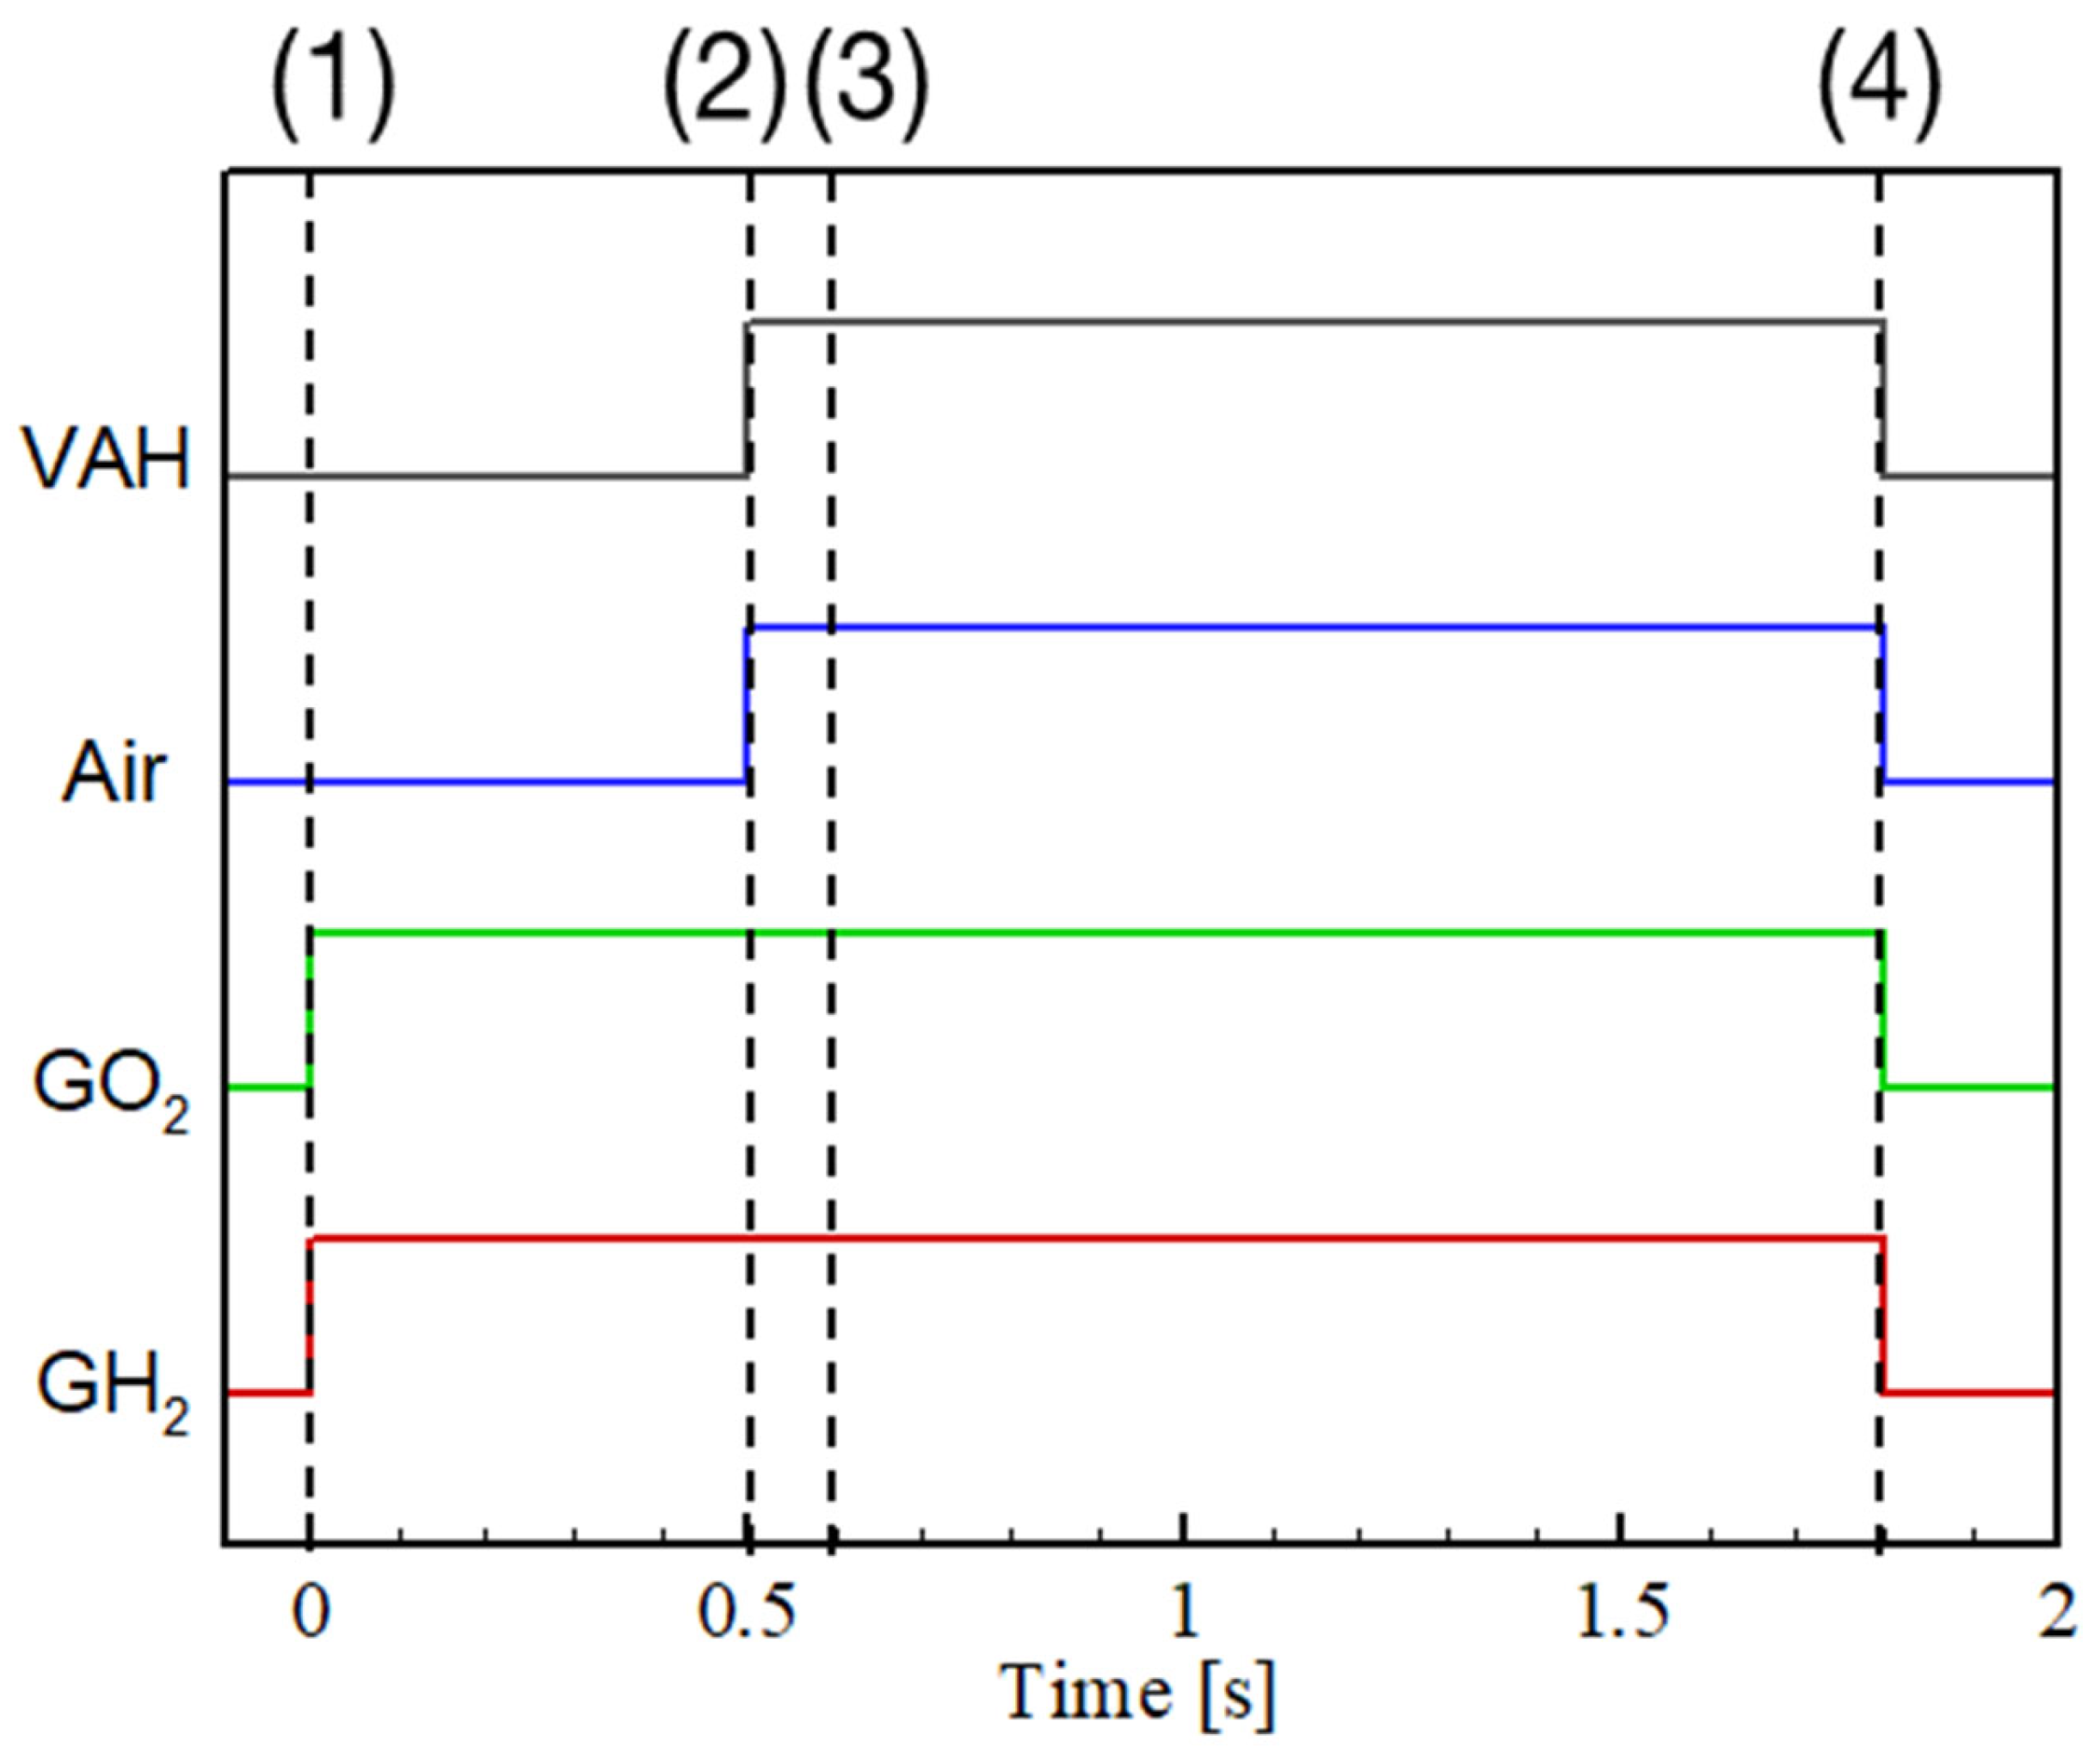
The propellant supply system consists of external cylinder facilities connected by pipelines and regulators. Each of the cylinders storing GH2, GO2, and air has a volume of 40 L, with six, five, and twenty-four cylinders allocated for each gas, respectively. In addition, five nitrogen gas cylinders are used to control the flow rate and pressure of the gaseous propellants. The propellant flow control system consists of pneumatic valves (TS065 series, TAVT Co., Yongin, Republic of Korea), dome regulators (RDHN series, Swagelok Inc., Solon, OH, USA), electronic pressure regulators (GX series, Proportion-Air Inc., McCordsville, IN, USA), and solenoid valves (121KBG2 series, Parker Corp., Cleveland, OH, USA). The flow control process begins with the pneumatic valves opening the upstream pipelines. Subsequently, the electronic pressure regulators receive control signals from a central control PC and adjust the pressure of the dome regulators to the target values specified by the PC. Following this, the solenoid valves regulate the opening and closing of the pipelines connected to the plenums, thereby controlling the propellant flow into the system. To monitor the flow rates during operation, differential pressure-type mass flow meters (FM153 series, Enbac Co., Daejeon, Republic of Korea) are installed in the pipelines. Prior to the combustion test, a cold-flow test was performed to calibrate supply pressures and confirm that target flow and pressure conditions were met. The combustion test sequence was executed automatically, as illustrated in Figure 7. At the start of the test, the hydrogen and oxygen valves were opened (Figure 7(1)), followed 0.5 s later by air injection (Figure 7(2)). Ignition was triggered 0.1 s afterward (Figure 7(3)), and combustion was maintained for approximately 1.2 s before all valves were closed (Figure 7(4)). In total, the combustion test concluded 1.8 s after the initial valve opening.

2.2.2. Emissivity Measurement

Surface emissivity is a key parameter that determines radiative cooling performance. By measuring emissivity, actual cooling performance can be quantitatively evaluated against the ideal radiative cooling case. Theoretically, emissivity ranges between 0 and 1, with a value of 1 representing ideal radiative cooling performance. It is obtained from the measured radiative power and wall temperature. Since it can be determined from the radiative emissive power and the surface temperature of an object, it is essential to select appropriate measurement equipment, such as a thermal imaging camera capable of accurately capturing the radiative emissive power. Additionally, a precise method for measuring surface temperature is required to ensure the reliability of the derived emissivity values. However, thermal imaging cameras operate within a finite wavelength range, which makes it necessary to consider total hemispheric emissive power for a rigorous evaluation of radiative cooling performance. Furthermore, in a combustion environment, the nozzle surface temperature is distributed non-uniformly in two dimensions, causing the radiative cooling performance to vary locally.
To address these challenges, a measurement method capable of capturing the two-dimensional temperature distribution under combustion conditions is required, making the use of a thermal imaging camera indispensable for this study. In this study, a wavelength band of 8 µm to 14 µm was selected, which is widely used in industrial machine vision applications. A temperature-extended thermal imaging camera (Optris PI 640i, Berlin, Germany), capable of detecting this band, was employed for emissivity evaluation.
On the other hand, due to the curved geometry of the nozzle surface, emissivity correction is required in regions that form an angle with respect to the camera’s optical axis. Based on the findings of Campo et al. [18], who measured the emissivity of Inconel 718 at five different wavelengths and various observation angles and Li et al. [24] that the spectral emissivity measurements remain nearly consistent up to at least 70°, the variation in emissivity from 0° to 75° was found to be negligible. Therefore, in this study, the surface of the Inconel 718 nozzle was assumed to behave as a Lambertian surface, which is an idealized emitter characterized by constant emissivity regardless of the viewing angle. Because the nozzles in the present study were fabricated by a manufacturing route distinct from those reported previously, their emissivity was measured and benchmarked against literature values over emission angles from 0° to 75°, as detailed in the following Section 3.2. The reference temperature of the object was obtained through direct contact measurement using a K-type thermocouple (Omega, grounded junction, sheathed model). The methodology for emissivity measurement is as follows. First, emissivity is defined as:
ε = E T E b T
Here, ε , E ( T ) , and E b T refer to the emissivity, the radiative emissive power of a material, and the radiative emissive power of a black body at temperature T , respectively. Emissivity is defined as the ratio E T / E b ( T ) and quantifies how closely a material’s radiative behavior resembles that of a black body. In this study, spectral emissivity was determined based on the surface temperature measured by a reference thermocouple. To calculate ε , both the E ( T ) emitted by the test surface and the E b ( T ) corresponding blackbody radiation at the same temperature must be known. A thermal imaging camera was employed to estimate the E ( T ) . The camera detects infrared radiation and calculates the apparent temperature using a user-defined emissivity along with internal calibration data obtained through factory blackbody calibration. When the emissivity setting of the camera is set to 1, it assumes the target behaves as a perfect black body. Under this setting, the reported temperature corresponds to that of a black body emitting the same radiative emissive power. Therefore, Equation (1) can be rewritten as
E T r e a l = E b T I R
Here, T r e a l and T I R refer to the actual temperature of surface and the apparent temperature captured by thermal imaging camera at emissivity value 1 setting. Since black body is ideal emitter, T I R is typically lower than T r e a l . Finally, the camera provides temperature T I R . Consequently, the E ( T r e a l ) received by the camera can be calculated using the blackbody radiation formula, which is given as follows:
E b = 8 14 C 1 λ 5 exp C 2 λ T 1 d λ  
The constants used in the blackbody radiation formula are C 1 = 3.742 × 10 8   W · ( μ m 4 ) / m 2 , C 2 = 1.439 × 10 4   µ m · K , where λ is the wavelength and the integration is performed over the measured wavelength band [31]. Since E b T in Equation (1) represents the radiative emissive power of a black body, its value can be obtained by substituting the reference temperature measured by the thermocouple into Equation (3). If this reference temperature is denoted as T T C , the emissivity ε can be redefined as:
ε = E b T I R E b T T C
The resulting E b T T C and E b T I R values were substituted into Equation (3) to obtain the emissivity at each temperature. This process was repeated over multiple temperature points, and a curve-fitting method was employed to derive emissivity as a function of temperature. In this case, both T I R and T T C are available as parameters in the fitting, with T I R selected as the independent variable. This choice was made because the combustion test occurs over a short duration, and the overall temperature distribution of the nozzle must be acquired using thermal imaging. Using the resulting fitting function, a two-dimensional emissivity distribution was derived by correcting the thermal images of the nozzle surface on a pixel-by-pixel basis between combustion tests.
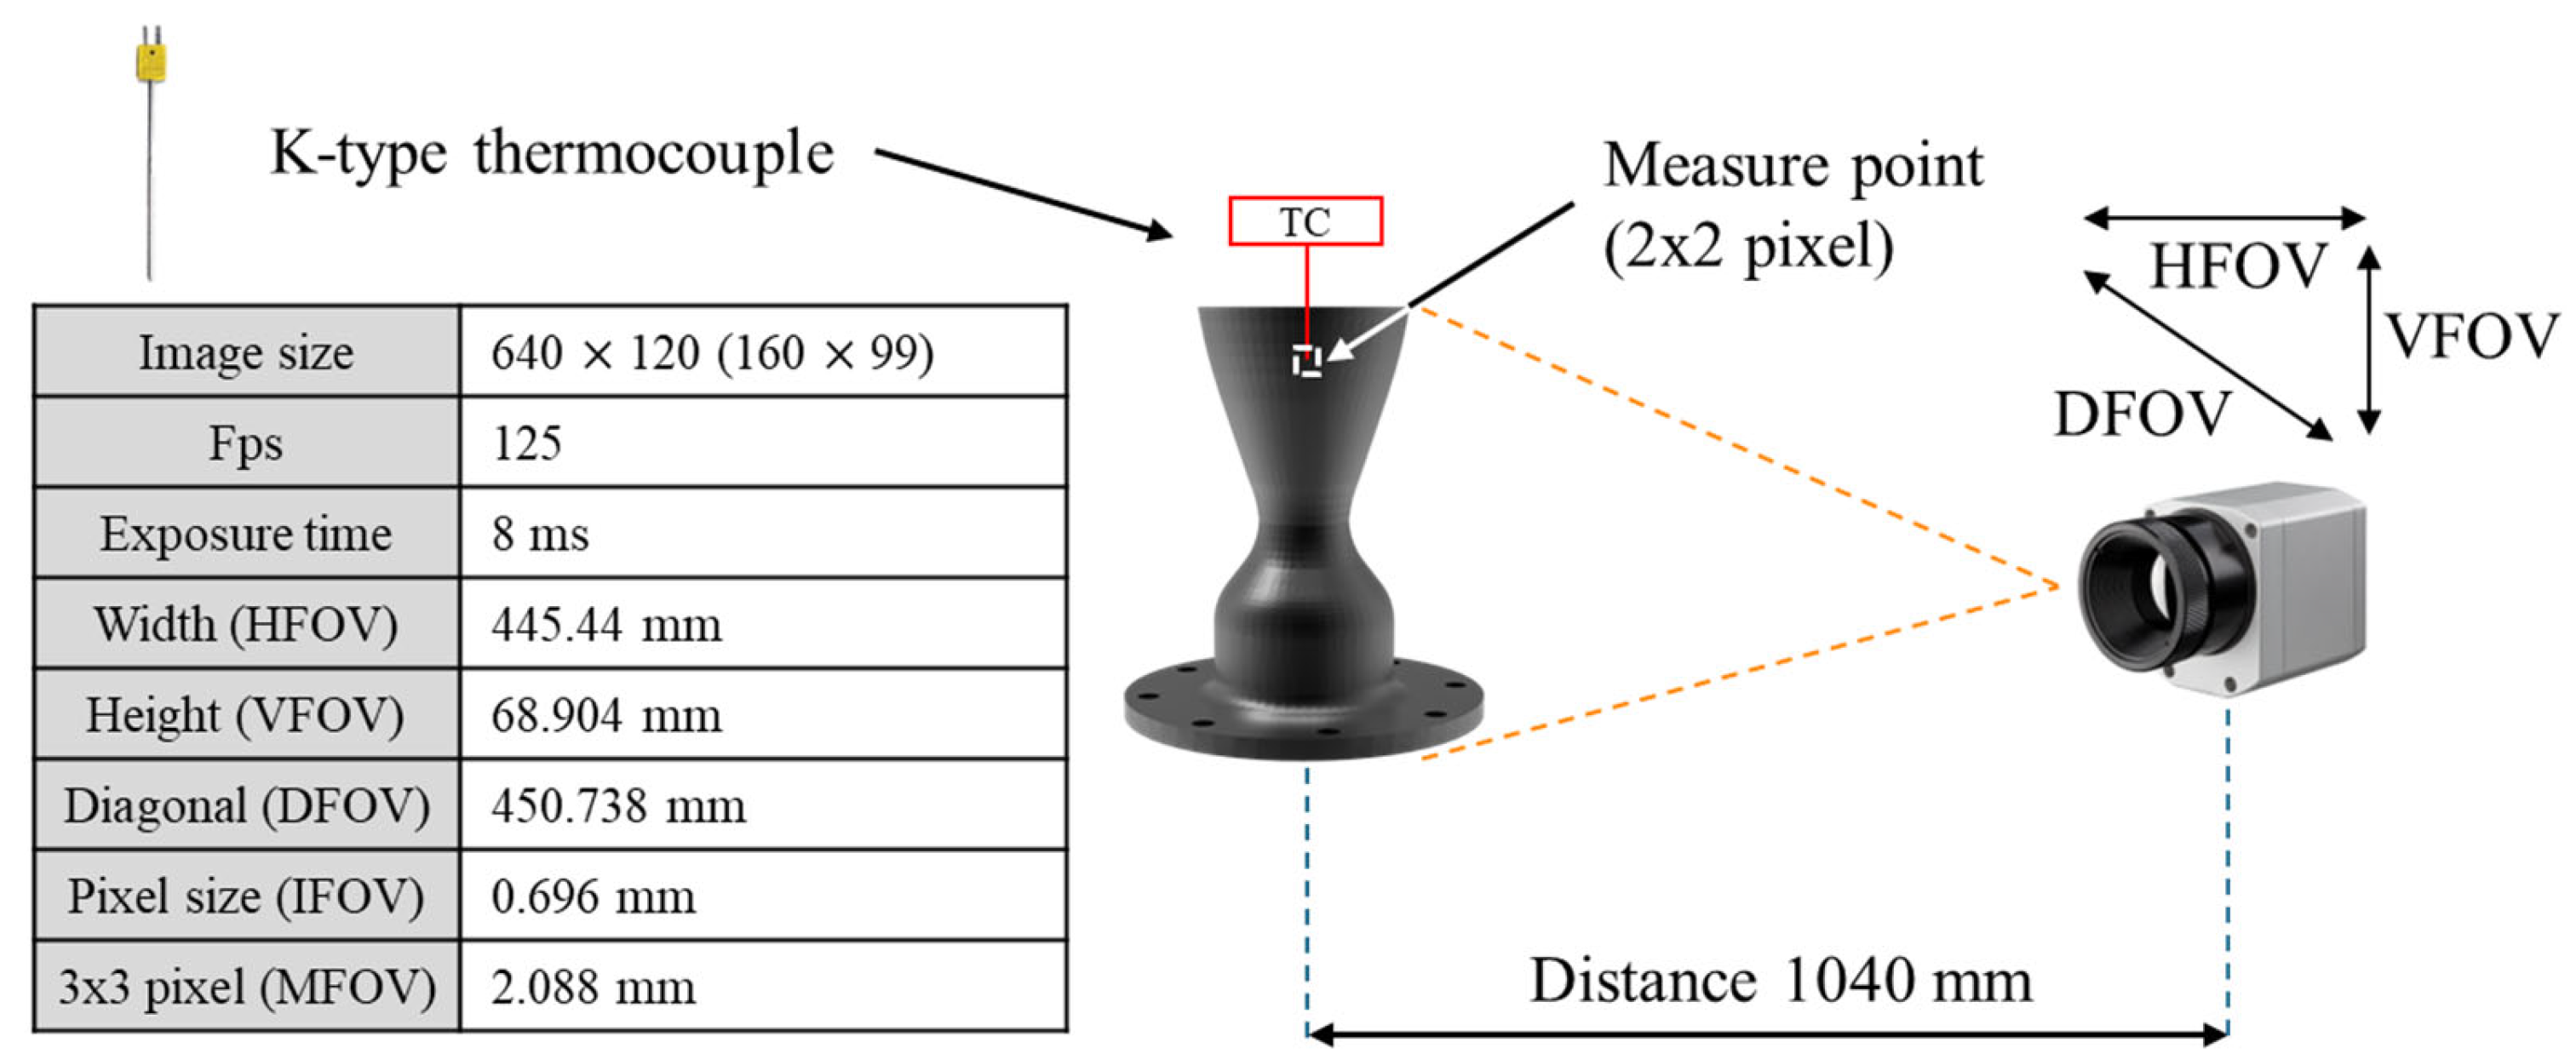
Temperature measurements for this calibration were conducted using both the thermal imaging camera and thermocouples, while the inner wall of the nozzle was heated with a hot air blower. A schematic of the temperature measurement setup is shown in Figure 8. The thermal imaging camera focused on a 2 × 2-pixel region adjacent to the thermocouple location (highlighted as a white box in Figure 8) and recorded the temperature at the hottest spot within that area. The temperature of the flow heating the nozzle surface was increased from 323.15 K to 873.15 K in 50 K increments, up to a final temperature of 903.15 K. Each heating step lasted approximately 3 min to ensure stabilization of both the thermocouple and thermal imaging camera readings. Due to the different data sampling rates of the thermocouple and the thermal camera, the average value of each measured temperature profile was used. To replicate the conditions of the combustion test, the temperature measurement was performed at the same physical location and with the same camera-to-nozzle distance. The distance from the nozzle surface to the IR camera lens was 1040 mm, corresponding to an instantaneous field of view (IFOV) of 0.696 mm. Additional field-of-view parameters are summarized in the table in Figure 8. The values in parentheses in Figure 8 indicate the actual number of pixels used for image acquisition during the combustion tests.

3. Results and Discussion

3.1. Hot-Fire Testing of a Supersonic Nozzle Under Flight-like Conditions

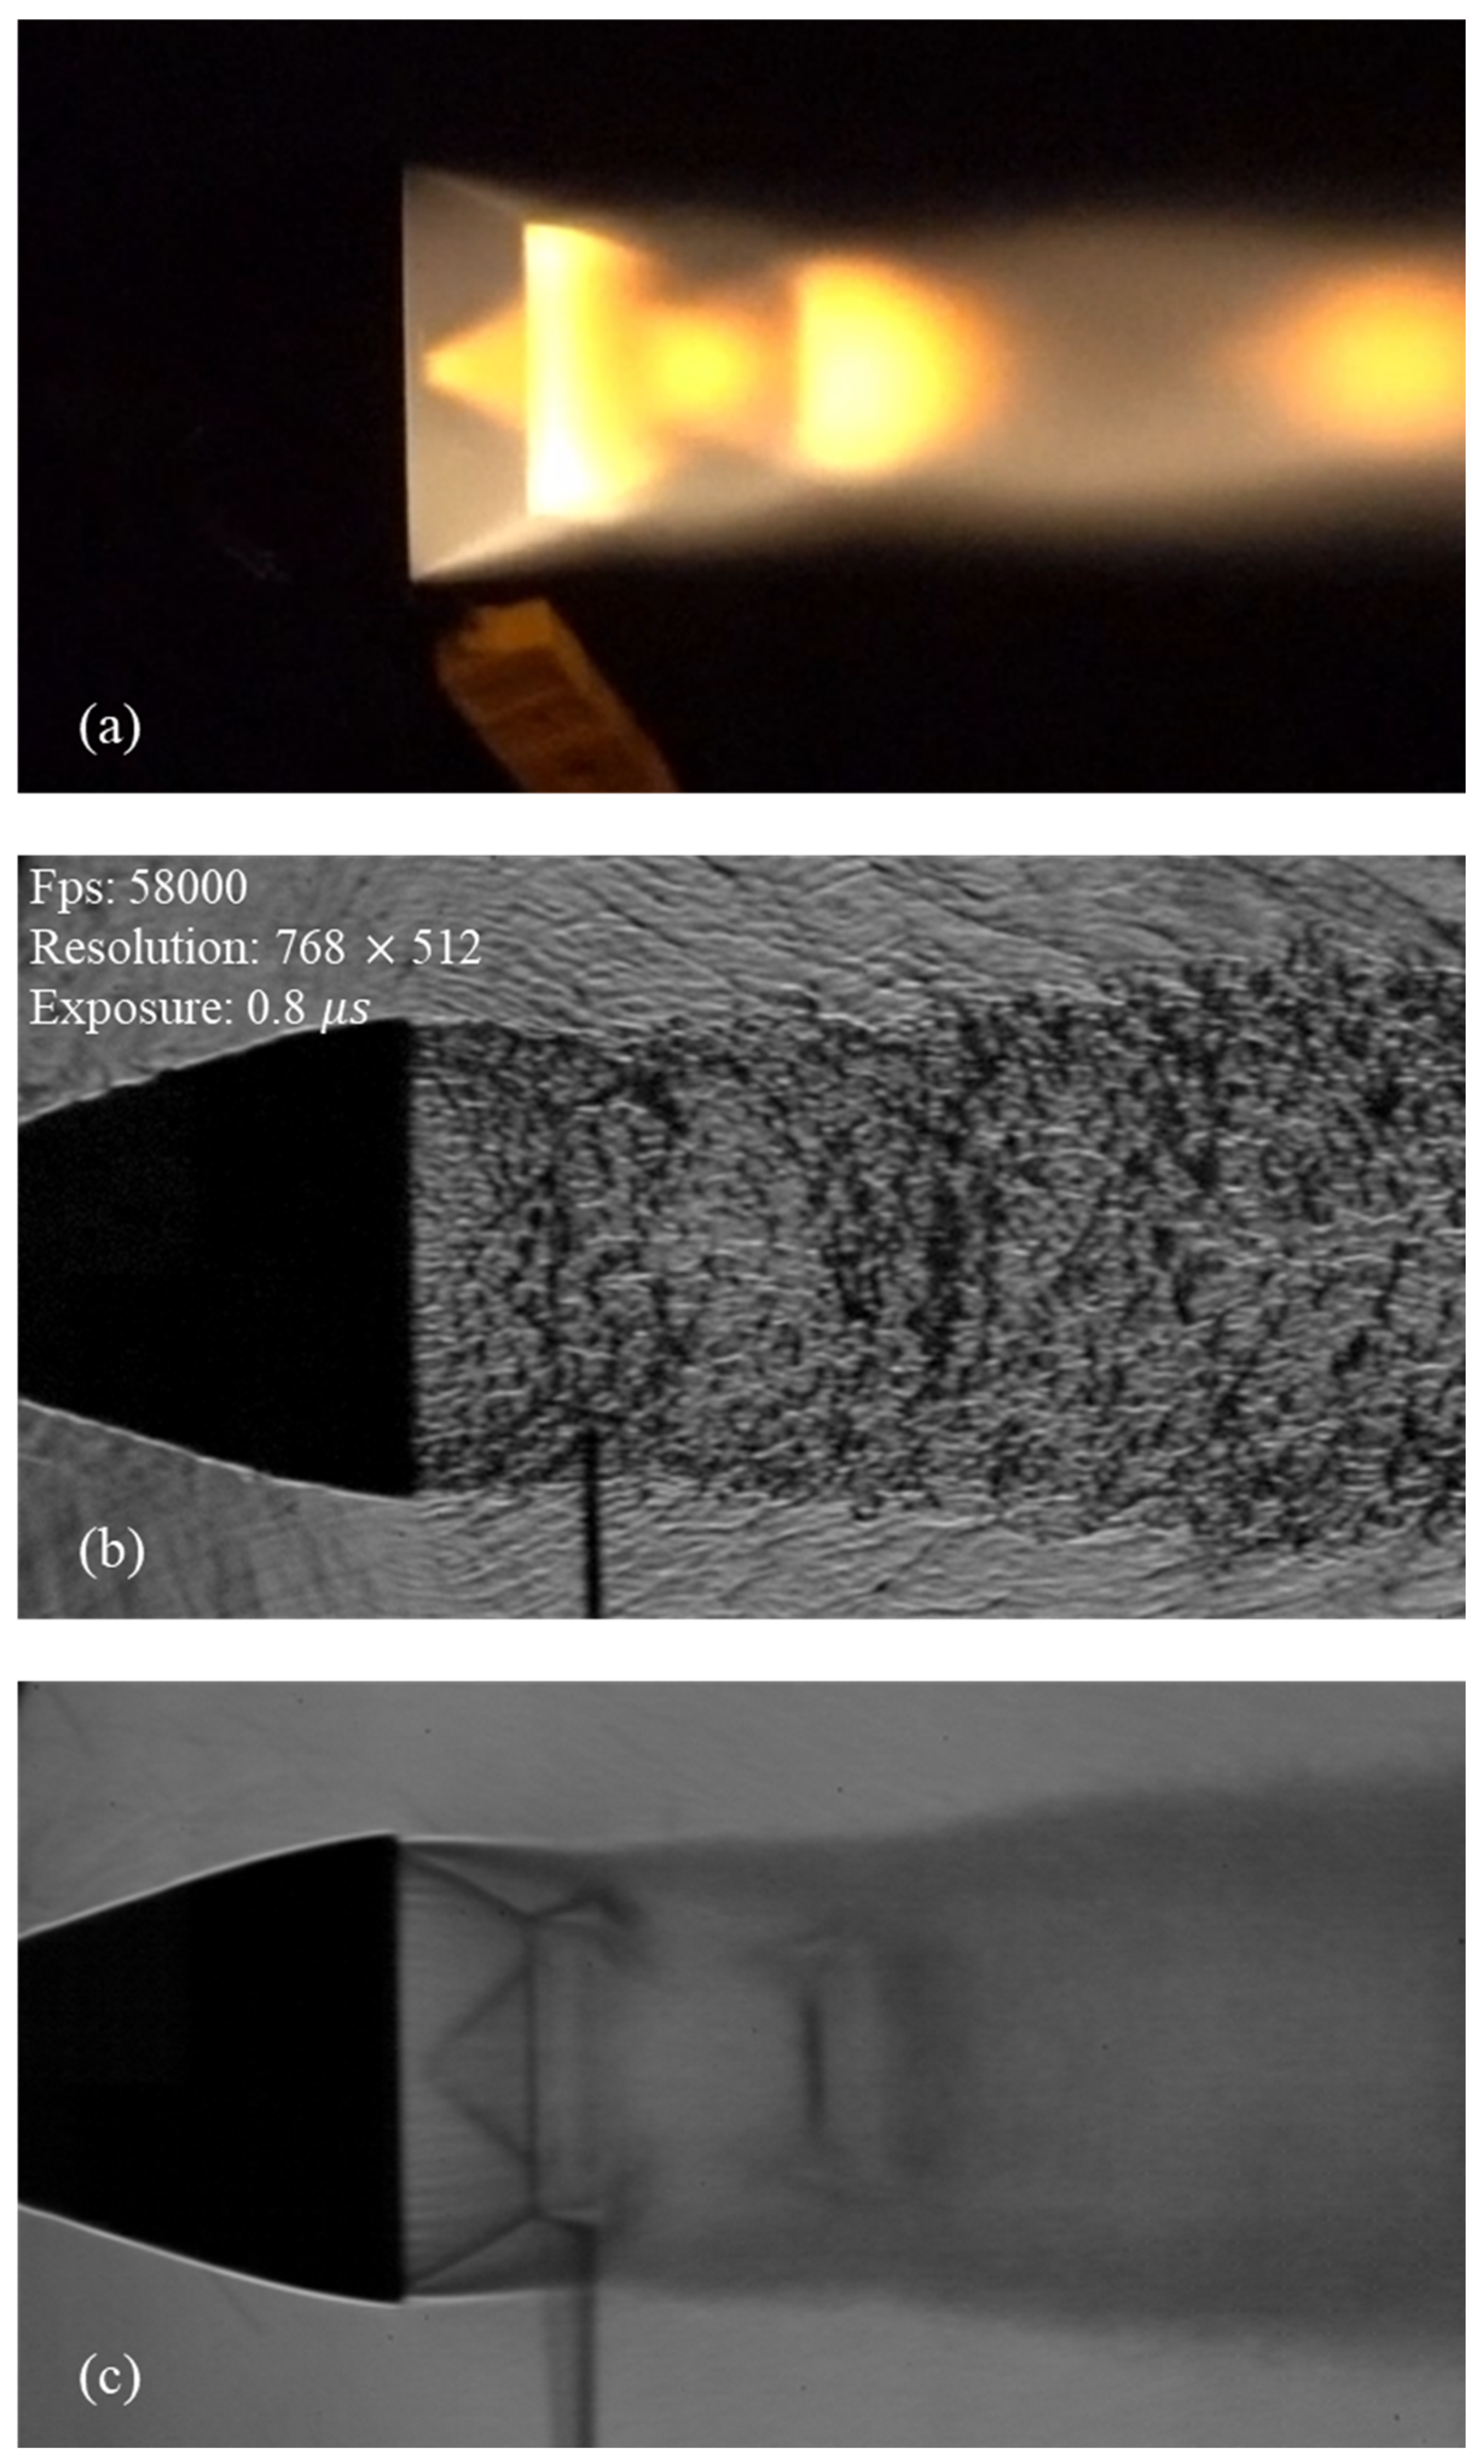
To verify the flow development near the nozzle exit, the shock wave structure and its formation location were visualized using Schlieren images obtained during the combustion test. The captured shock structure displays a cap-shock pattern, as shown in Figure 9a–c, indicating an over-expanded flow regime. This pattern is presumed to result from weakened internal shock interactions near the nozzle exit, forming the characteristic cap-shock structure. The observed shock pattern is likely due to a discrepancy between the working fluid assumed in the test design and the one used in the actual experiment. While the design calculations assumed air as working fluid, the experiment utilized a mixture of hydrogen, oxygen, and air. The combustion products of this mixture have a lower specific heat ratio than air, which weakens the internal shock strength under the same pressure ratio, resulting in the formation of a cap-shock pattern at the nozzle exit. Although a thermocouple was placed at the nozzle exit to monitor downstream temperature, it failed to capture valid data due to the short combustion duration. The thermocouple was located slightly downstream of the cap-shock formation region and had minimal impact on the shock structure. This is supported by Figure 9c, which shows that any thermocouple-induced vibration appears only behind the shock, confirming that the shock itself remained largely unaffected. Figure 9c is an average Schlieren image compiled from 500 frames captured beginning 0.7 s after ignition (e.g., 1.3 s of Figure 9), clearly visualizing the downstream shock structure.
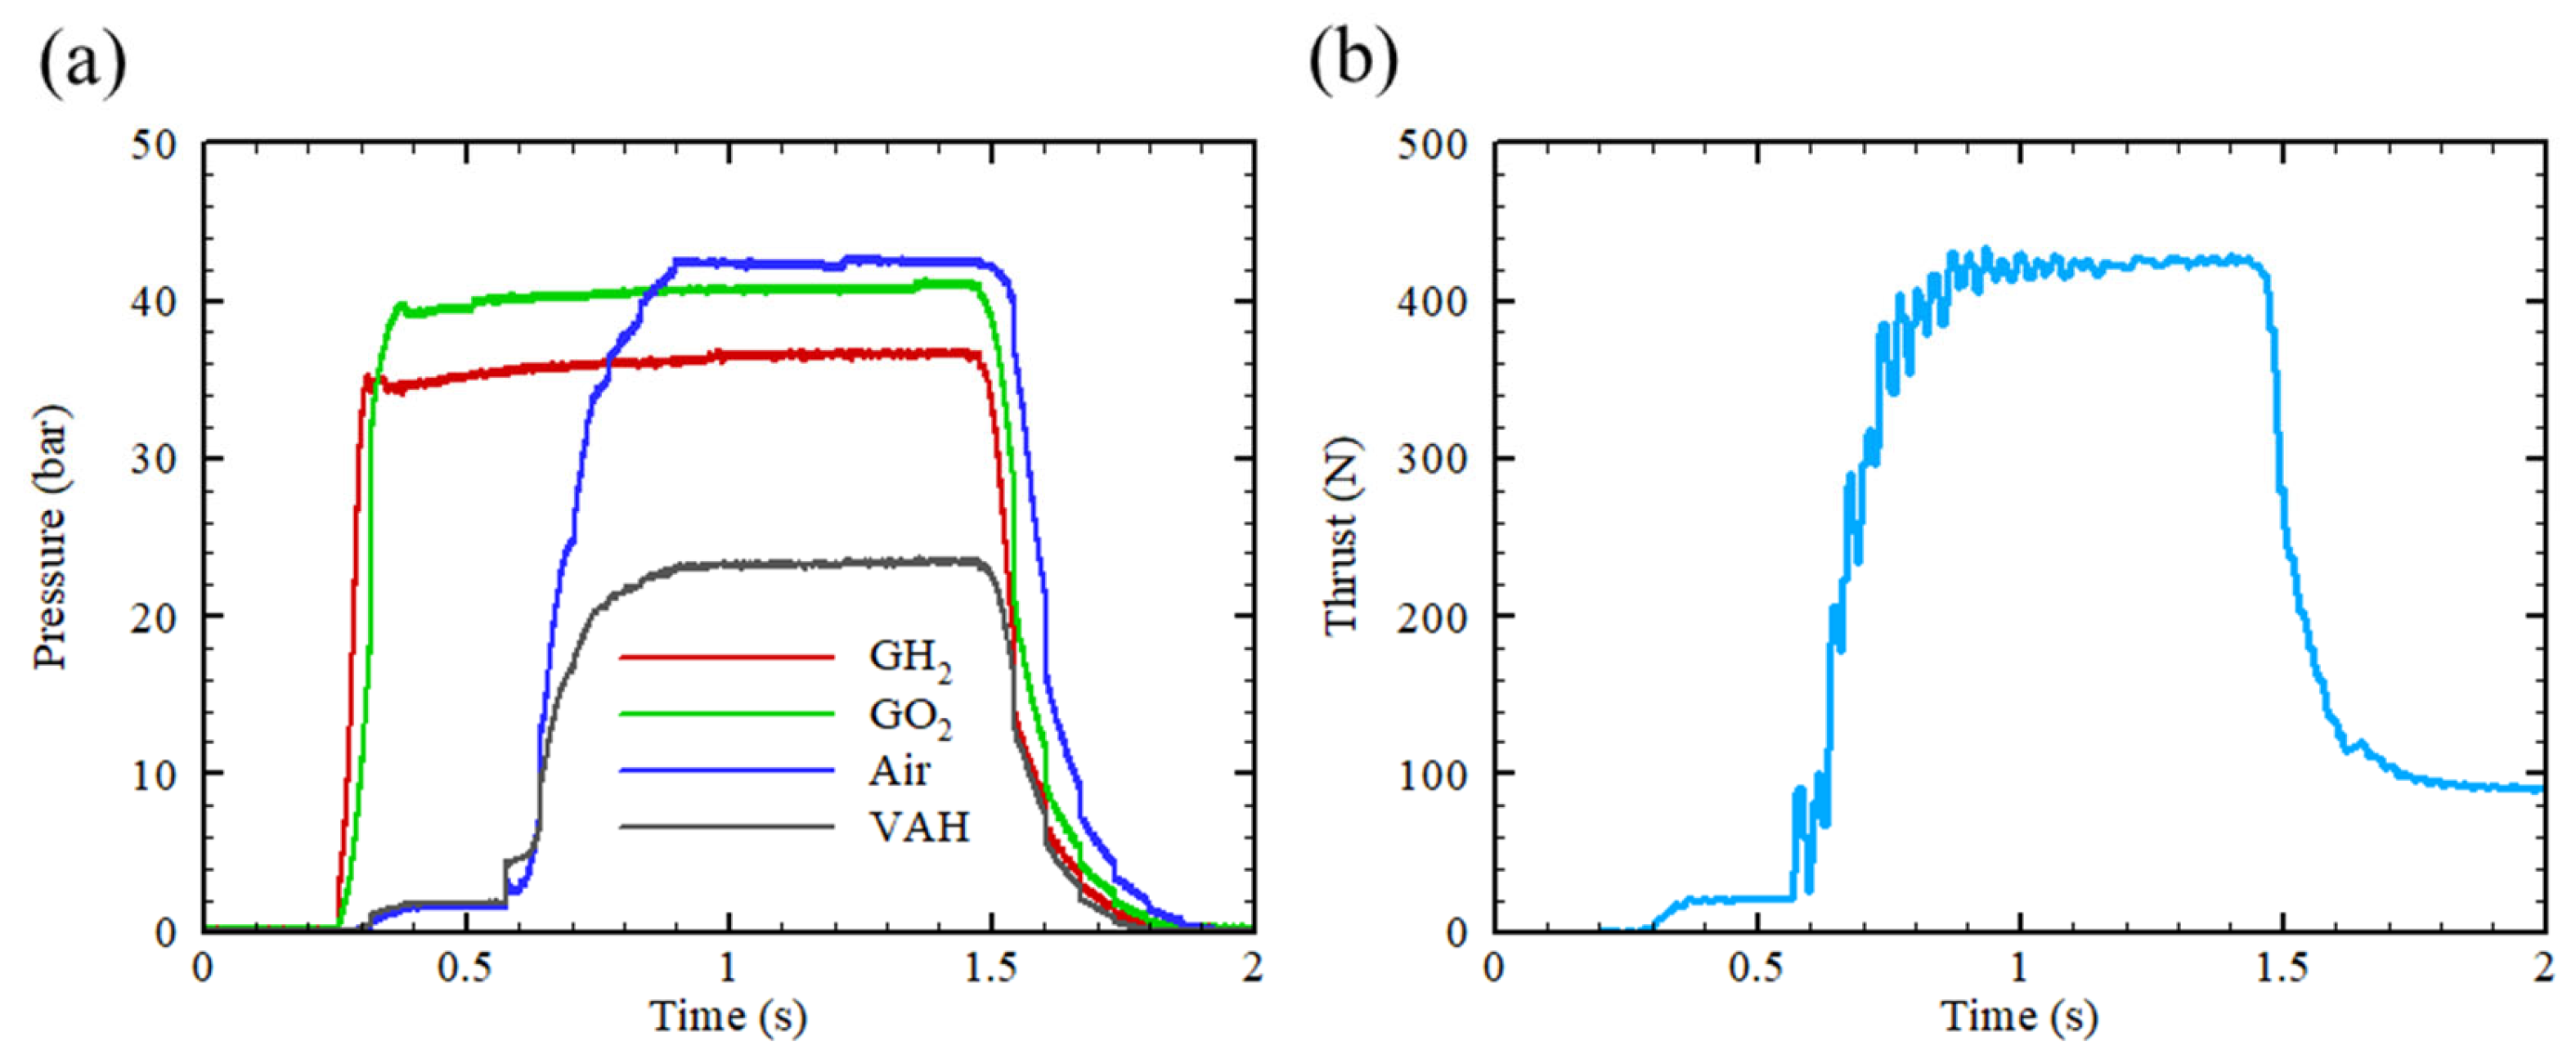
The pressure and thrust profiles during the combustion process are presented in Figure 10. An ignition occurred 0.6 s after the start of the experiment, and combustion continued for 1 s. However, the measured combustion pressure was approximately 23–24 bar, which deviated from the design condition. The corresponding mass flow rates were 5.54 g/s for GH2, 55 g/s for GO2, and 276.05 g/s for air. The resulting equivalence ratio was 0.39, which is about 11% higher than the intended design value. This discrepancy is attributed to the slow response time of the valves and the lower-than-expected hydrogen flow rate. Among these factors, the deviation in the hydrogen flow rate appears to have had the most significant influence on the equivalence ratio. Despite these deviations, the estimated total temperature was 1857 K, corresponding to only a 3.33% error compared to the design value. The primary purpose of the combustion test was to emulate the combustion environment, such as propulsion conditions, and to develop the nozzle flow characteristics. These results suggest that the target operating conditions were reasonably achieved. Thrust oscillations were observed during the first 0.5 s after ignition and then diminished. This behavior is believed to result from flow development inside the nozzle: as internal pressure increased post-ignition, the internal shock moved toward the nozzle exit. During this transient phase, repeated flow separation and reattachment near the shock wall likely increased side loads and nozzle vibration, as detected by the load cell. After 1 s, the flow was fully developed and the internal shock exited the nozzle, stabilizing the thrust at 420 N.

3.2. Influence of Emission Angle on 3D-Printed Inconel 718 Emissivity

Previous investigations have demonstrated that the directional emissivity of Inconel 718 is effectively invariant for emission angles between 0° and 75°. Because the present nozzles were additively manufactured—a production route not examined in those studies—we re-evaluated this behavior to verify the applicability of the Lambertian assumption. Emissivity was measured at 15° increments over the 0–75° range; the results are presented in Figure 11. Consistent with the data reported by Campo et al. [18] and Li et al. [24], the additively manufactured surface exhibited no systematic dependence on emission angle. We therefore conclude that the Lambertian assumption remains valid for the 3D-printed Inconel 718 nozzle used in this study.

3.3. Spectral Emissivity Calculation and Emissive Power Distribution of Nozzle Surface

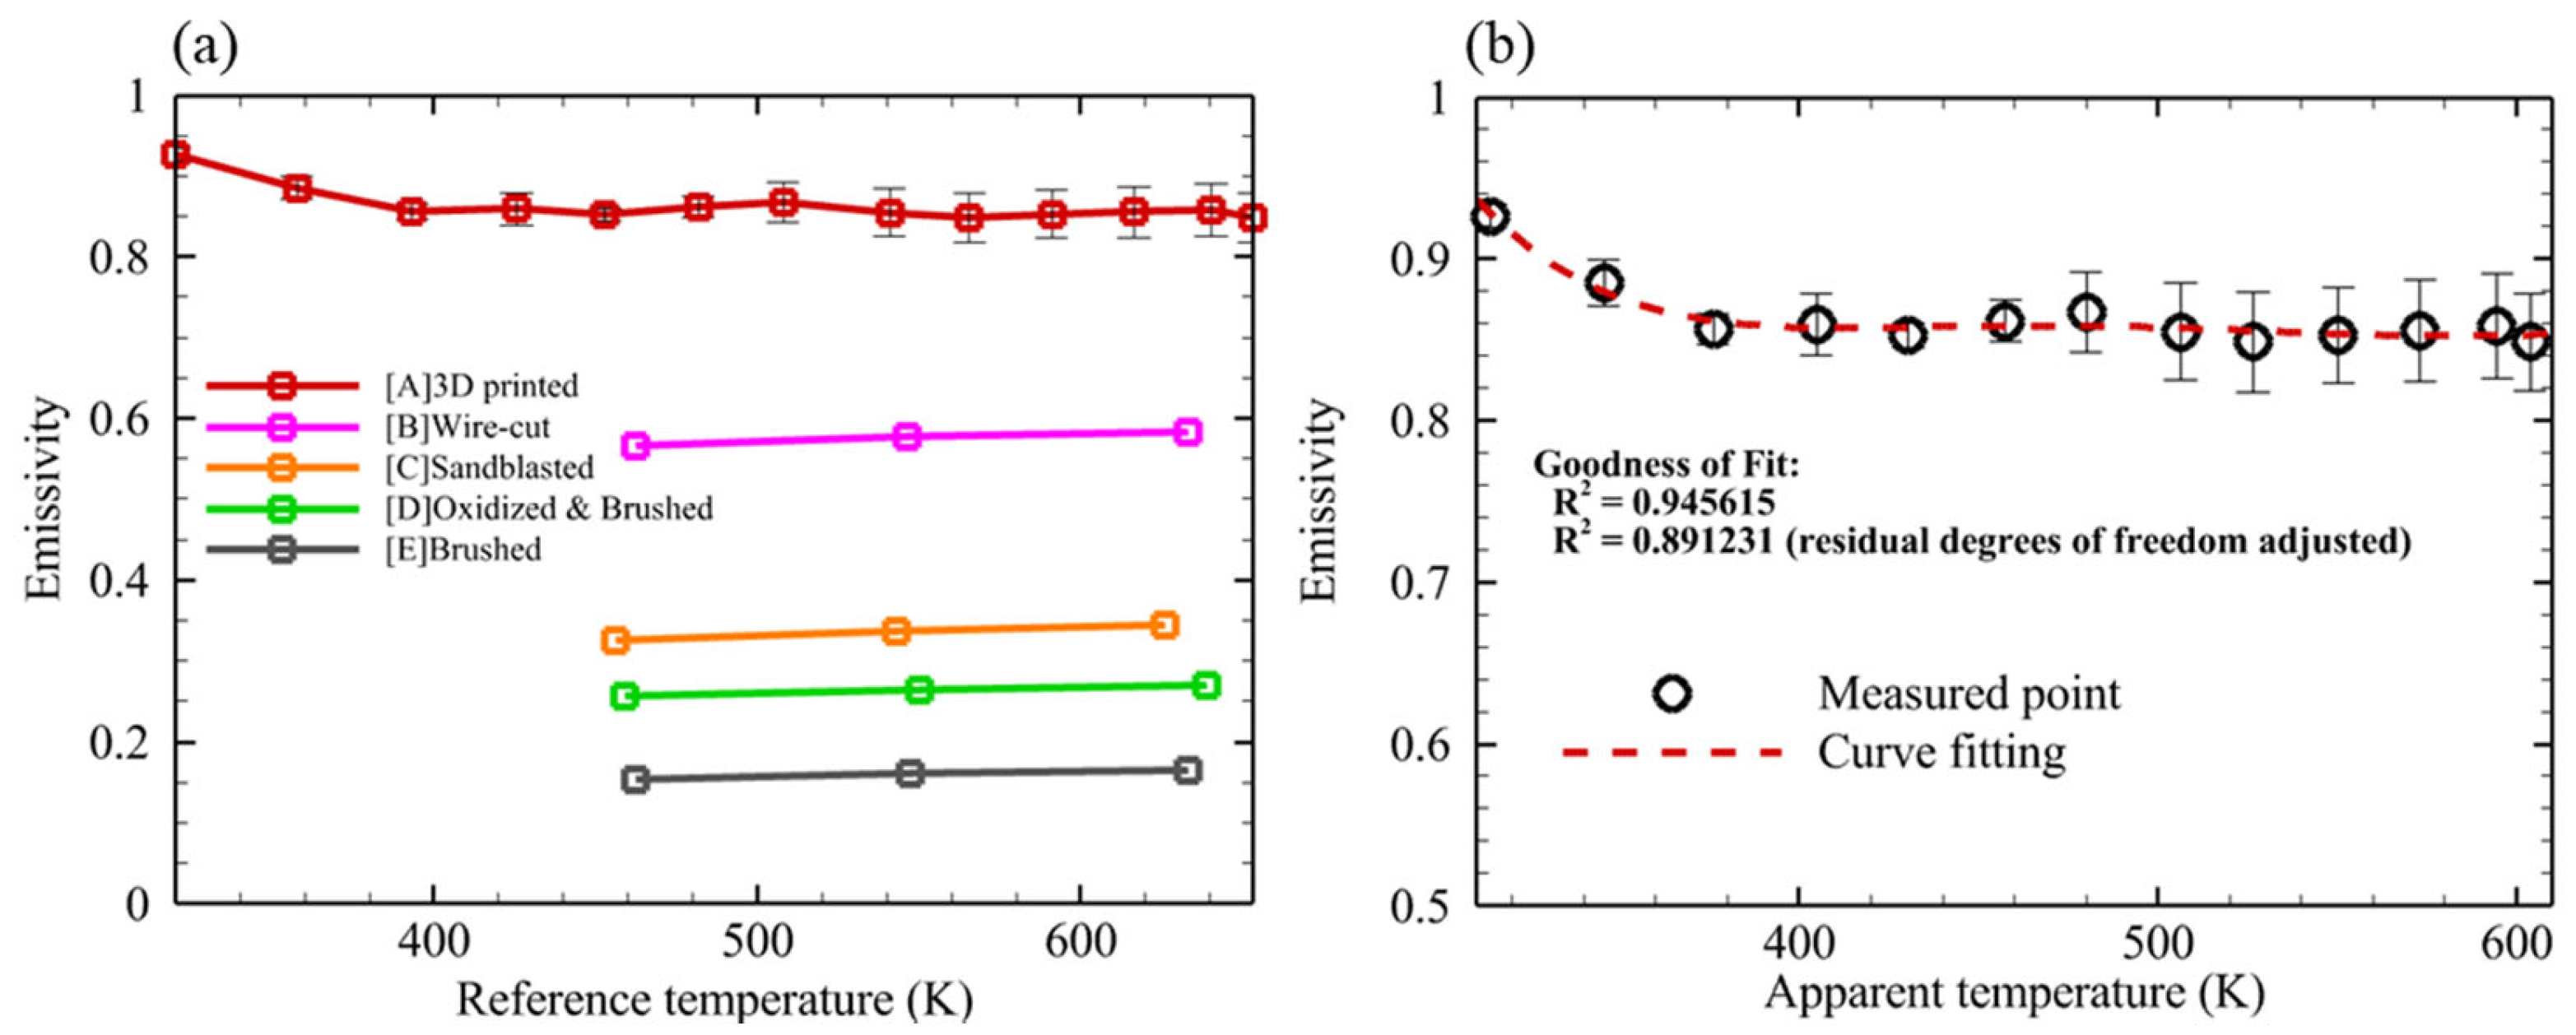
The emissivity measurements were conducted in the temperature range of 320 K to 655 K. Due to limitations in the heating apparatus, emissivity could not be measured beyond 655 K. Profile [A] of Figure 12 presents the measured emissivity values at various temperatures, along with the corresponding curve fitting results. To benchmark the present results, emissivity values in the 8–14 µm band were extracted from the surface-finish data reported by Campo et al. [18] and averaged for comparison. Figure 12a reproduces those reference profiles: [B] wire-cut EDM, [C] sandblasted, [D] oxidized + brushed, and [E] brushed finishes on Inconel 718. Campo et al. [18] reported surface roughness (Ra) of 2.4 µm, 1.6 µm, and 1.3 µm for profiles [B], [C], and [E], respectively. Although the exact roughness of the oxidized-and-brushed specimen [D] was not given, it is expected to be comparable to profile [E]. Among the untreated surfaces ([B], [C], [E]), emissivity increases monotonically with roughness; the additively manufactured surface in this study—exhibiting the largest roughness—shows the highest emissivity, ≈0.85. Because the AMS 5662 heat treatment employed here involves temperatures similar to those used for deliberate oxidation, some of this increase may originate from an oxide scale. Li et al. [24] reported that oxide-layer growth on Inconel 718 peaks within the first hour of exposure and then slows considerably. Assuming stable oxide formed during AMS 5662, direct comparison should be made with the fully oxidized profile [D]. Compared with profile [D], the additively manufactured surface shows a higher emissivity—approximately 0.6 in the 8–14 µm band—which can be attributed to its greater surface roughness. Increased roughness enhances absorption and thus emissivity; this behavior is expected to extend to wavelength bands outside 8–14 µm. These findings indicate that additively manufactured Inconel 718 subjected to AMS 5662 heat treatment possesses radiative properties highly favorable for radiative-cooling applications.
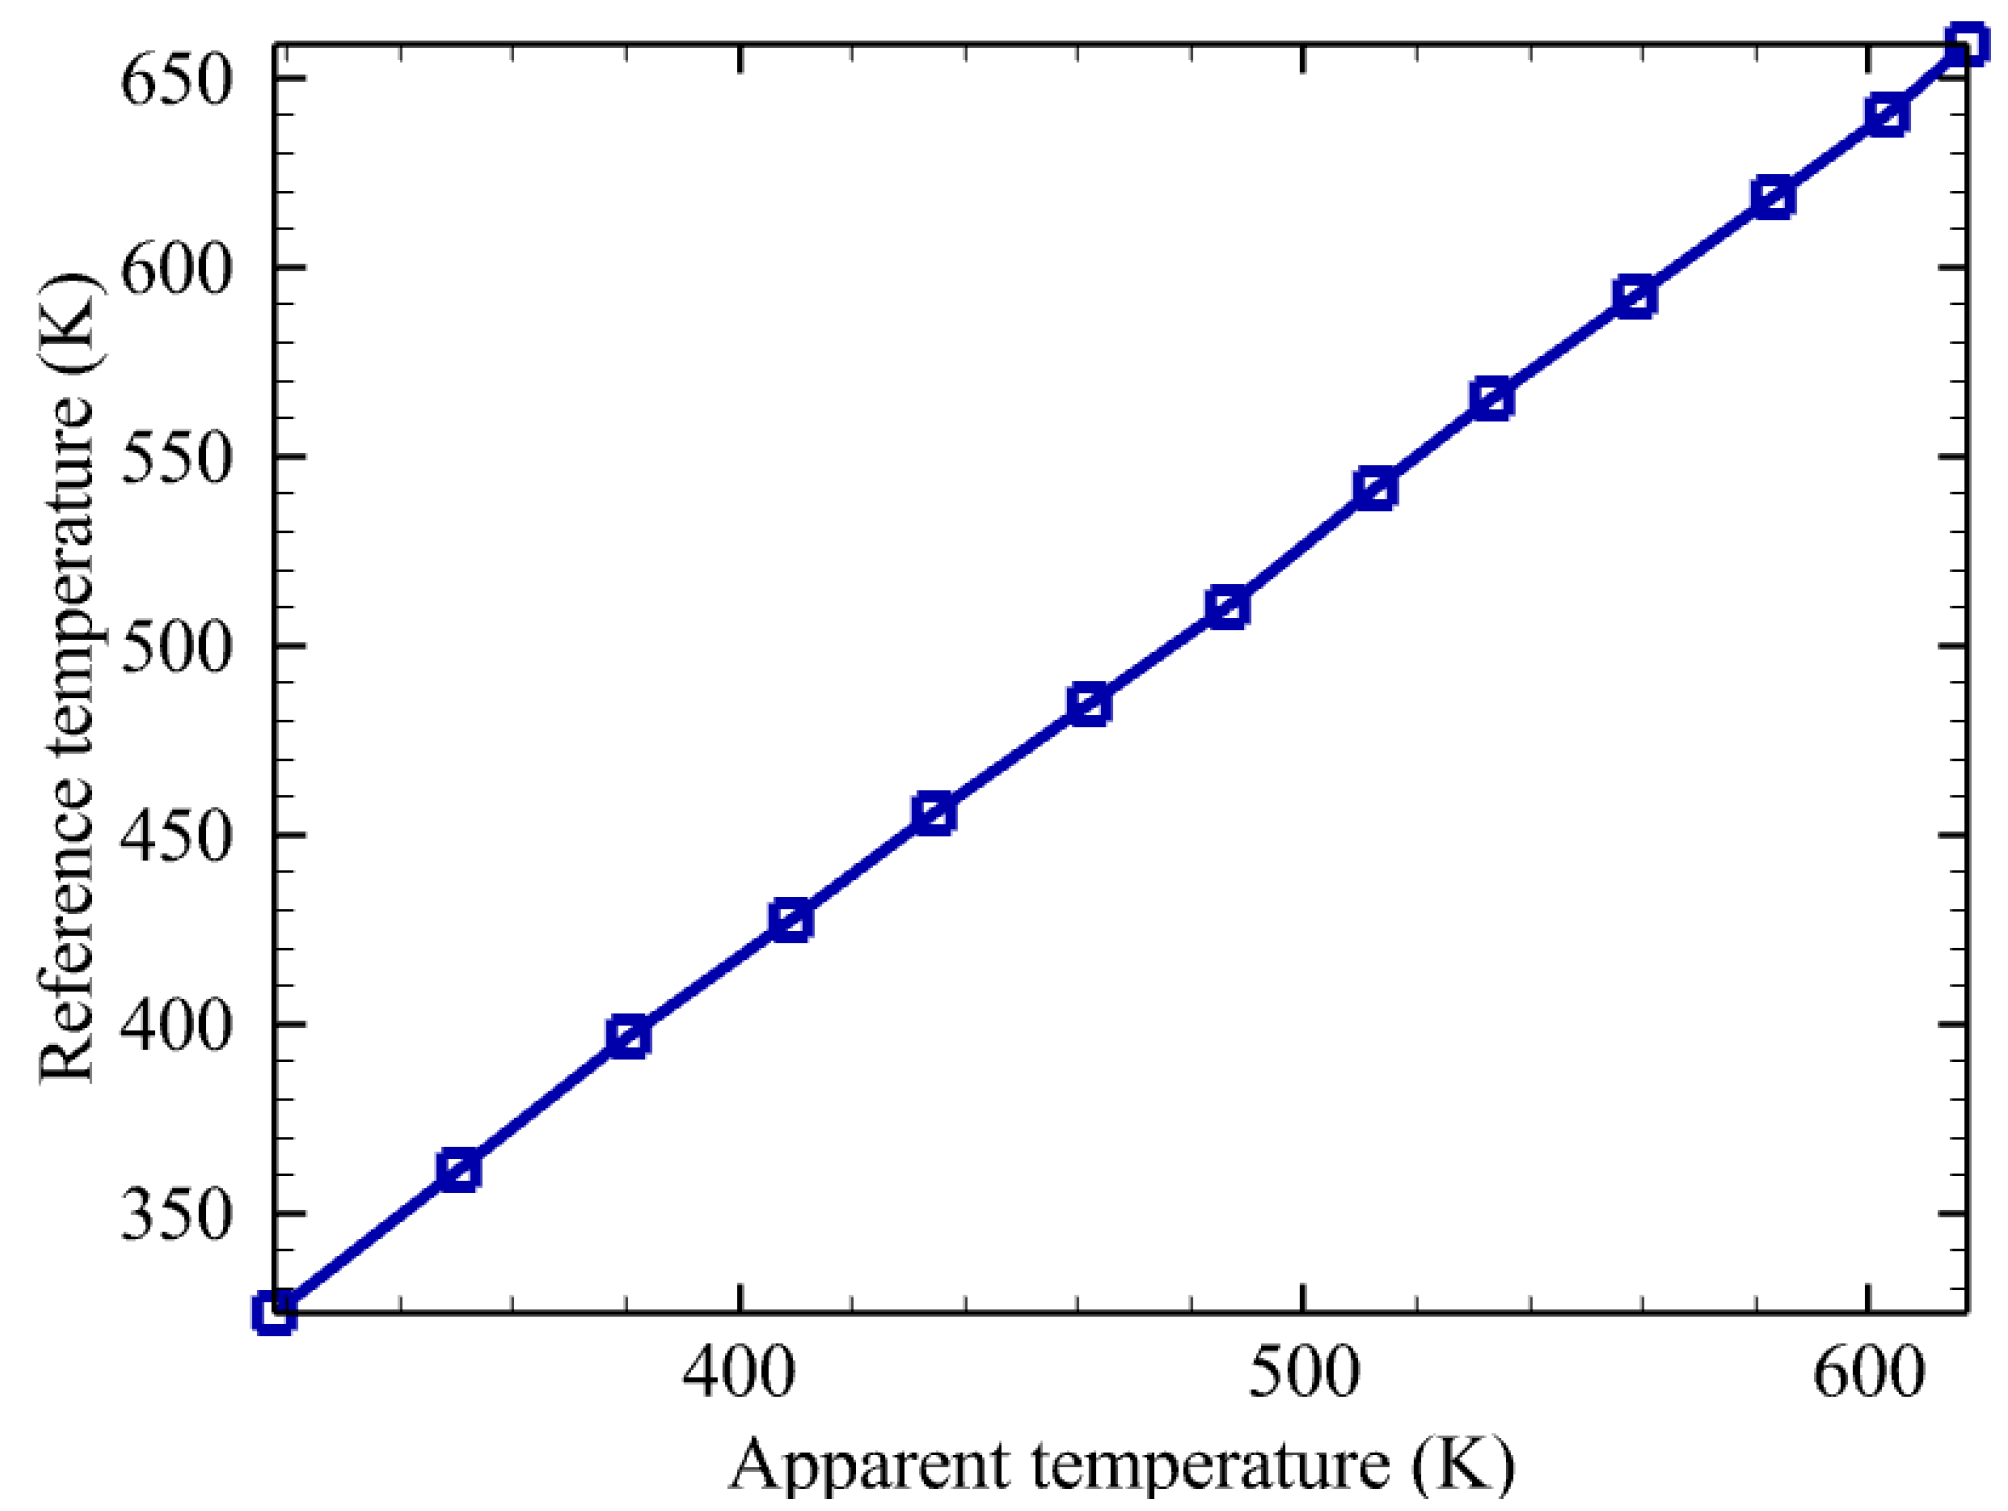
To visualize the spatial emissive power distribution, a fifth-order polynomial curve fitting function was developed using the apparent temperature ( T I R ) as the independent variable (Figure 12b). The thermal images obtained between combustion tests were subsequently post-processed on a pixel-by-pixel basis to derive the corresponding radiation field on the nozzle surface. The coefficient of determination (R2) for the curve fitting exceeded 0.8912, and the fitting coefficients B0 through B5 are listed in Table 2. The nozzle-surface temperature field was reconstructed by correlating the infrared (IR) thermography data with simultaneous thermocouple (TC) measurements obtained during the emissivity test. The IR-to-TC calibration curve is presented in Figure 13.
A real temperature distribution snapshot of nozzle from the thermal imaging camera taken between combustion tests is shown in Figure 14a. The nozzle throat experiences the highest heat load, and thus, its temperature is expected to rise most rapidly. However, because the nozzle throat is also the thickest section, the most rapid temperature increase is observed in the adjacent region rather than at the throat itself. Additionally, the upstream region of the nozzle throat, where the flow remains subsonic, exhibits a faster temperature rise compared to the downstream region. Furthermore, the distributions of surface temperature and emissive power shown in Figure 14 are non-axisymmetric. Although the exact cause is unclear, it is presumed that the condensed combustion product H2O is accumulated upstream of the nozzle throat under gravity. That is, the presence of this liquid can promote local heat transfer, leading to a higher heat flux in the height 20–30 mm region along the nozzle neck. The spatial distribution of emissive power in the 8–14 µm band, computed from the emissivity-temperature fit (Figure 12b) and the surface-temperature map (Figure 14a), is presented in Figure 14b. In the visualized emissive power distribution (Figure 14b), densely clustered contour lines appear near the nozzle edges and around the fastening nut. Two primary factors may explain this observation. First, since the angle between the thermal imaging camera lens and the surface is nearly perpendicular, the radiative emissive power may be underestimated due to angular effects. Second, the significant temperature difference between the nozzle surface and the surrounding environment may lead to the appearance of steep thermal gradients at the edges.
The emissive-power map peaks at 2214 W m−2 in the throat region and decays downstream, paralleling the surface-temperature field—an expected outcome, given that the throat attains the highest surface temperatures. However, the upstream margin lies slightly outside the calibrated temperature range of the emissivity fit; consequently, emissivity and temperature estimates in that zone should be viewed with caution. Even so, the data reveal a distinctly non-uniform radiative heat flux distribution over the nozzle surface. In addition, integration over the 8–14 µm band yields a radiative heat flux of at least 16.61% of the total black-body emission at 700 K. Because real engineering surfaces have emissivity less than unity, this fraction represents a lower bound for the present nozzle. For a 3000 K black body, more than 98% of its total radiant energy falls within the 0.5–14 µm interval; therefore, supplementing the current measurement with a multiband acquisition covering 0.5–8 µm would enable a nearly complete reconstruction of the nozzle’s radiative output under hot-fire conditions.
In radiative-cooling systems, emissivity serves as a key indicator of performance relative to the theoretical maximum; an emissivity of 1 denotes ideal radiative cooling, whereas lower values indicate diminished effectiveness. Within the 8–14 µm band, the nozzle examined here exhibits an emissivity of 0.85, a value regarded as radiatively efficient. Nevertheless, the corresponding emissive power derived from Figure 14b is small compared with the convective heat load—on the order of several MW m−2—imposed on the chamber wall, even though it represents 16.61% of the black-body emission at 700 K in the same band. Consequently, for space-qualified bipropellant thrusters in which regenerative cooling is impracticable, supplementary thermal-management measures—such as increasing wall thickness or film cooling—are likely to remain necessary. The quantitative radiative-energy data reported herein thus provide a useful basis for optimizing the thermal design of such nozzles.

4. Conclusions

This study employed emissivity as a quantitative metric for assessing radiative-cooling performance in a supersonic nozzle under flight-like conditions. Radiative emissive power in the 8–14 µm band was quantified and visualized during hot-fire testing. A nozzle contour with an area ratio of 11.9912 was designed via the TOC method for ground operation and fabricated from Inconel 718 by PBF, followed by AMS 5662 heat treatment. The resulting supersonic nozzle was subjected to both combustion (hot-fire) and emissivity-measurement experiments. The combustion test was conducted by directly connecting the nozzle to a VAH facility at Pusan National University. The test results revealed a cap-shock pattern caused by interactions of internal shock waves near the nozzle exit. Nevertheless, the flow was sufficiently developed, and a stable thrust of approximately 420 N was achieved about 0.4 s after ignition. For emissivity analysis, the inner wall of the nozzle was heated using a hot air blower, and surface temperatures were measured using both a thermocouple and a thermal imaging camera.
Emissivity measurement tests showed that the additively manufactured, AMS 5662-treated Inconel 718 surface exhibited negligible angular dependence between 0° and 75°, consistent with previous reports. The nozzle also displayed a high emissivity of ≈0.85 in the 8–14 µm band, which we attribute to its greater surface roughness; a similar enhancement is expected at other infrared wavelengths, thereby increasing the total band-integrated emissivity. By coupling the emissivity calibration with hot-fire infrared thermography, we reconstructed the surface-temperature field and quantified the radiative emissive power emitted during combustion. The peak emissive power reached 2214 W·m−2, corresponding to at least 16.61% of the black-body output at 700 K in the same band. Extending the measurement to 0.5–14 µm with a multiband configuration would capture > 98% of the total radiative energy.
These results provide quantitative radiative flux data for additively manufactured nozzles and can inform the thermal design optimization of space propulsion thrusters in which regenerative cooling is impractical.

Author Contributions

Conceptualization, J.-Y.C.; methodology, S.-W.C. and S.J.; software, S.-W.C., S.J. and B.-K.S.; validation, S.-W.C.; formal analysis, S.-W.C., S.J. and B.-K.S.; investigation, S.-W.C.; resources, S.-W.C., B.-K.S., K.-H.L. and G.-U.M.; data curation, S.-W.C., S.J. and B.-K.S.; writing—original draft preparation, S.-W.C. and J.-E.K.; writing—review and editing, S.-W.C. and J.-E.K.; visualization, S.-W.C. and K.-H.L.; supervision, J.-Y.C.; project administration, J.-Y.C.; funding acquisition, J.-Y.C. All authors have read and agreed to the published version of the manuscript.

Funding

This paper was supported by MOTIE (Ministry of Trade, Industry and Energy) and KEIT (Korea Evaluation Institute of Industrial Technology) in 2021 for the project of Development of oxide dispersion strengthened superalloy materials and manufacturing technology for hypersonic engines (20017647) and Korea Research Institute for defense Technology planning and advancement (KRIT) funded by the Korea government (DAPA, Defense Acquisition Program Administration) with grant (No. KRIT-CT-22-030, Reusable Unmanned Space Vehicle Research Center).

Conflicts of Interest

The authors declare no conflicts of interest.

References

  1. Hou, L.; Fu, P.; Ba, Y. Chemical Mechanism of MMH/NTO and Simulation in a Small Liquid Rocket Engine. Combust. Sci. Technol. 2019, 191, 2208–2225. [Google Scholar] [CrossRef]
  2. Stechman, R.; Smith, J. Monomethylhydrazine versus hydrazine fuels-Test results using flight qualified 100 LBF and 5 LBF bipropellant engine configurations. In Proceedings of the 19th Joint Propulsion Conference, Seattle, WA, USA, 27–29 June 1983; p. 1257. [Google Scholar]
  3. Liu, C.; Chen, J.; Han, H.; Wang, Y.; Zhang, Z. A long duration and high reliability liquid apogee engine for satellites. Acta Astronaut. 2004, 55, 401–408. [Google Scholar] [CrossRef]
  4. Lianbo, Z.; Xu, X. Performance prediction of apogee attitude and orbit control thruster for MMH/NTO hypergolic bipropellant. In Proceedings of the 50th AIAA/ASME/SAE/ASEE Joint Propulsion Conference, Cleveland, OH, USA, 28–30 July 2014; p. 3572. [Google Scholar]
  5. Krejci, D.; Lozano, P. Space propulsion technology for small spacecraft. Proc. IEEE 2018, 106, 362–378. [Google Scholar] [CrossRef]
  6. Qin, J.; Zhang, H.; Wang, B. Numerical Investigation on Combustion Instability in a small MMH/NTO Liquid Rocket Engine. In Proceedings of the 52nd AIAA/SAE/ASEE Joint Propulsion Conference, Salt Lake City, UT, USA, 25–27 July 2016; p. 5087. [Google Scholar]
  7. Zhang, G.; Li, G.; Li, L.; Tang, G. Thermal performance of MMH/NTO rocket thrust chamber based on pintle injector by using liquid film cooling. Appl. Therm. Eng. 2023, 223, 120035. [Google Scholar] [CrossRef]
  8. Gradl, P.; Tinker, D.C.; Park, A.; Mireles, O.R.; Garcia, M.; Wilkerson, R.; Mckinney, C. Robust metal additive manufacturing process selection and development for aerospace components. J. Mater. Eng. Perform. 2022, 31, 6013–6044. [Google Scholar] [CrossRef]
  9. Gradl, P.R.; Protz, C.S.; Wammen, T. Additive manufacturing and hot-fire testing of liquid rocket channel wall nozzles using blown powder directed energy deposition inconel 625 and JBK-75 Alloys. In Proceedings of the AIAA Propulsion and Energy 2019 Forum, Indianapolis, IN, USA, 19–22 August 2019; p. 4362. [Google Scholar]
  10. Tommila, C.D.; Hartsfield, C.R.; Redmond, J.J.; Komives, J.R.; Shelton, T.E. Performance impacts of metal additive manufacturing of very small nozzles. J. Aerosp. Eng. 2021, 34, 04020115. [Google Scholar] [CrossRef]
  11. Blakey-Milner, B.; Gradl, P.; Snedden, G.; Brooks, M.; Pitot, J.; Lopez, E.; Leary, M.; Berto, F.; du Plessis, A. Metal additive manufacturing in aerospace: A review. Mater. Des. 2021, 209, 110008. [Google Scholar] [CrossRef]
  12. Blachowicz, T.; Ehrmann, G.; Ehrmann, A. Metal additive manufacturing for satellites and rockets. Appl. Sci. 2021, 11, 12036. [Google Scholar] [CrossRef]
  13. Moriya, S.; Inoue, T.; Sasaki, M.; Nakamoto, T.; Kimura, T.; Nomura, N.; Kikuchi, K.; Kawasaki, A.; Kato, T.; Masuda, I. Feasibility study on additive manufacturing of liquid rocket combustion chamber. Trans. Jpn. Soc. Aeronaut. Space Sci. Aerosp. Technol. Jpn. 2018, 16, 261–266. [Google Scholar] [CrossRef]
  14. Coulbert, C.D. Selecting cooling techniques for liquid rockets for spacecraft. J. Spacecr. Rocket. 1964, 1, 129–139. [Google Scholar] [CrossRef]
  15. Alaruri, S.; Bianchini, L.; Brewington, A. Effective spectral emissivity measurements of superalloys and YSZ thermal barrier coating at high temperatures using a 1.6 μm single wavelength pyrometer. Opt. Lasers Eng. 1998, 30, 77–91. [Google Scholar] [CrossRef]
  16. Greene, G.; Finfrock, C.; Irvine, T., Jr. Total hemispherical emissivity of oxidized Inconel 718 in the temperature range 300–1000 C. Exp. Therm. Fluid Sci. 2000, 22, 145–153. [Google Scholar] [CrossRef]
  17. Tanda, G.; Misale, M. Measurement of Total Hemispherical Emittance and Specific Heat of Aluminum and Inconel 718 by a Calorimetric Technique. J. Heat Transf. 2005, 128, 302–306. [Google Scholar] [CrossRef]
  18. del Campo, L.; Pérez-Sáez, R.B.; González-Fernández, L.; Esquisabel, X.; Fernández, I.; González-Martín, P.; Tello, M.J. Emissivity measurements on aeronautical alloys. J. Alloys Compd. 2010, 489, 482–487. [Google Scholar] [CrossRef]
  19. Keller, B.P.; Nelson, S.E.; Walton, K.L.; Ghosh, T.K.; Tompson, R.V.; Loyalka, S.K. Total hemispherical emissivity of Inconel 718. Nucl. Eng. Des. 2015, 287, 11–18. [Google Scholar] [CrossRef]
  20. Leshock, C.E.; Kim, J.-N.; Shin, Y.C. Plasma enhanced machining of Inconel 718: Modeling of workpiece temperature with plasma heating and experimental results. Int. J. Mach. Tools Manuf. 2001, 41, 877–897. [Google Scholar] [CrossRef]
  21. Pottlacher, G.; Hosaeus, H.; Kaschnitz, E.; Seifter, A. Thermophysical properties of solid and liquidInconel 718 Alloy. Scand. J. Metall. 2002, 31, 161–168. [Google Scholar] [CrossRef]
  22. Cagran, C.; Reschab, H.; Tanzer, R.; Schützenhöfer, W.; Graf, A.; Pottlacher, G. Normal Spectral Emissivity of the Industrially Used Alloys NiCr20TiAl, Inconel 718, X2CrNiMo18-14-3, and Another Austenitic Steel at 684.5 nm. Int. J. Thermophys. 2009, 30, 1300–1309. [Google Scholar] [CrossRef]
  23. Schmidt, E.; Eckert, E. Über die Richtungsverteilung der Wärmestrahlung von Oberflächen. Forsch. Auf Dem Geb. Des Ingenieurwesens A 1935, 6, 175–183. [Google Scholar] [CrossRef]
  24. Li, L.; Wang, F.; Gao, J.; Yu, K.; Wang, L.; Liu, Y. Accurately Measuring the Infrared Spectral Emissivity of Inconel 601, Inconel 625, and Inconel 718 Alloys during the Oxidation Process. Sensors 2024, 24, 5906. [Google Scholar] [CrossRef] [PubMed]
  25. Rao, G. Exhaust nozzle contour for optimum thrust. J. Jet Propuls. 1958, 28, 377–382. [Google Scholar] [CrossRef]
  26. Ryu, C.-S.; Lee, K.-O.; Choi, H.-S. Thermo-structural Analysis for Radiation-Cooled Nozzle Extension of Thrust Chamber. In Proceedings of the Korean Society of Propulsion Engineers Conference; 2011; pp. 291–295. Available online: https://koreascience.kr/article/CFKO201132164219425.do (accessed on 26 July 2025).
  27. Lee, K.-O.; Lim, B.; Kim, D.-J.; Hong, M.; Lee, K. Technology trends in additively manufactured small rocket engines for launcher applications. J. Korean Soc. Propuls. Eng. 2020, 24, 73–82. [Google Scholar] [CrossRef]
  28. SAE International. AMS 5662: Nickel Alloy, Corrosion and Heat-Resistant, Bars, Forgings, and Rings… Solution Heat Treated; SAE International: Warrendale, PA, USA, 2018. [Google Scholar]
  29. Sung, B.-K.; Jeong, S.-M.; Choi, J.-Y. Direct-connect supersonic nozzle design considering the effect of combustion. Aerosp. Sci. Technol. 2023, 133, 108094. [Google Scholar] [CrossRef]
  30. Lee, J.-H.; Lee, E.-S.; Han, H.-S.; Kim, M.-S.; Choi, J.-Y. A study on a vitiated air heater for a direct-connect scramjet combustor and preliminary test on the scramjet combustor ignition. Aerospace 2023, 10, 415. [Google Scholar] [CrossRef]
  31. Bergman, T.L. Fundamentals of Heat and Mass Transfer; John Wiley & Sons: Hoboken, NJ, USA, 2011. [Google Scholar]
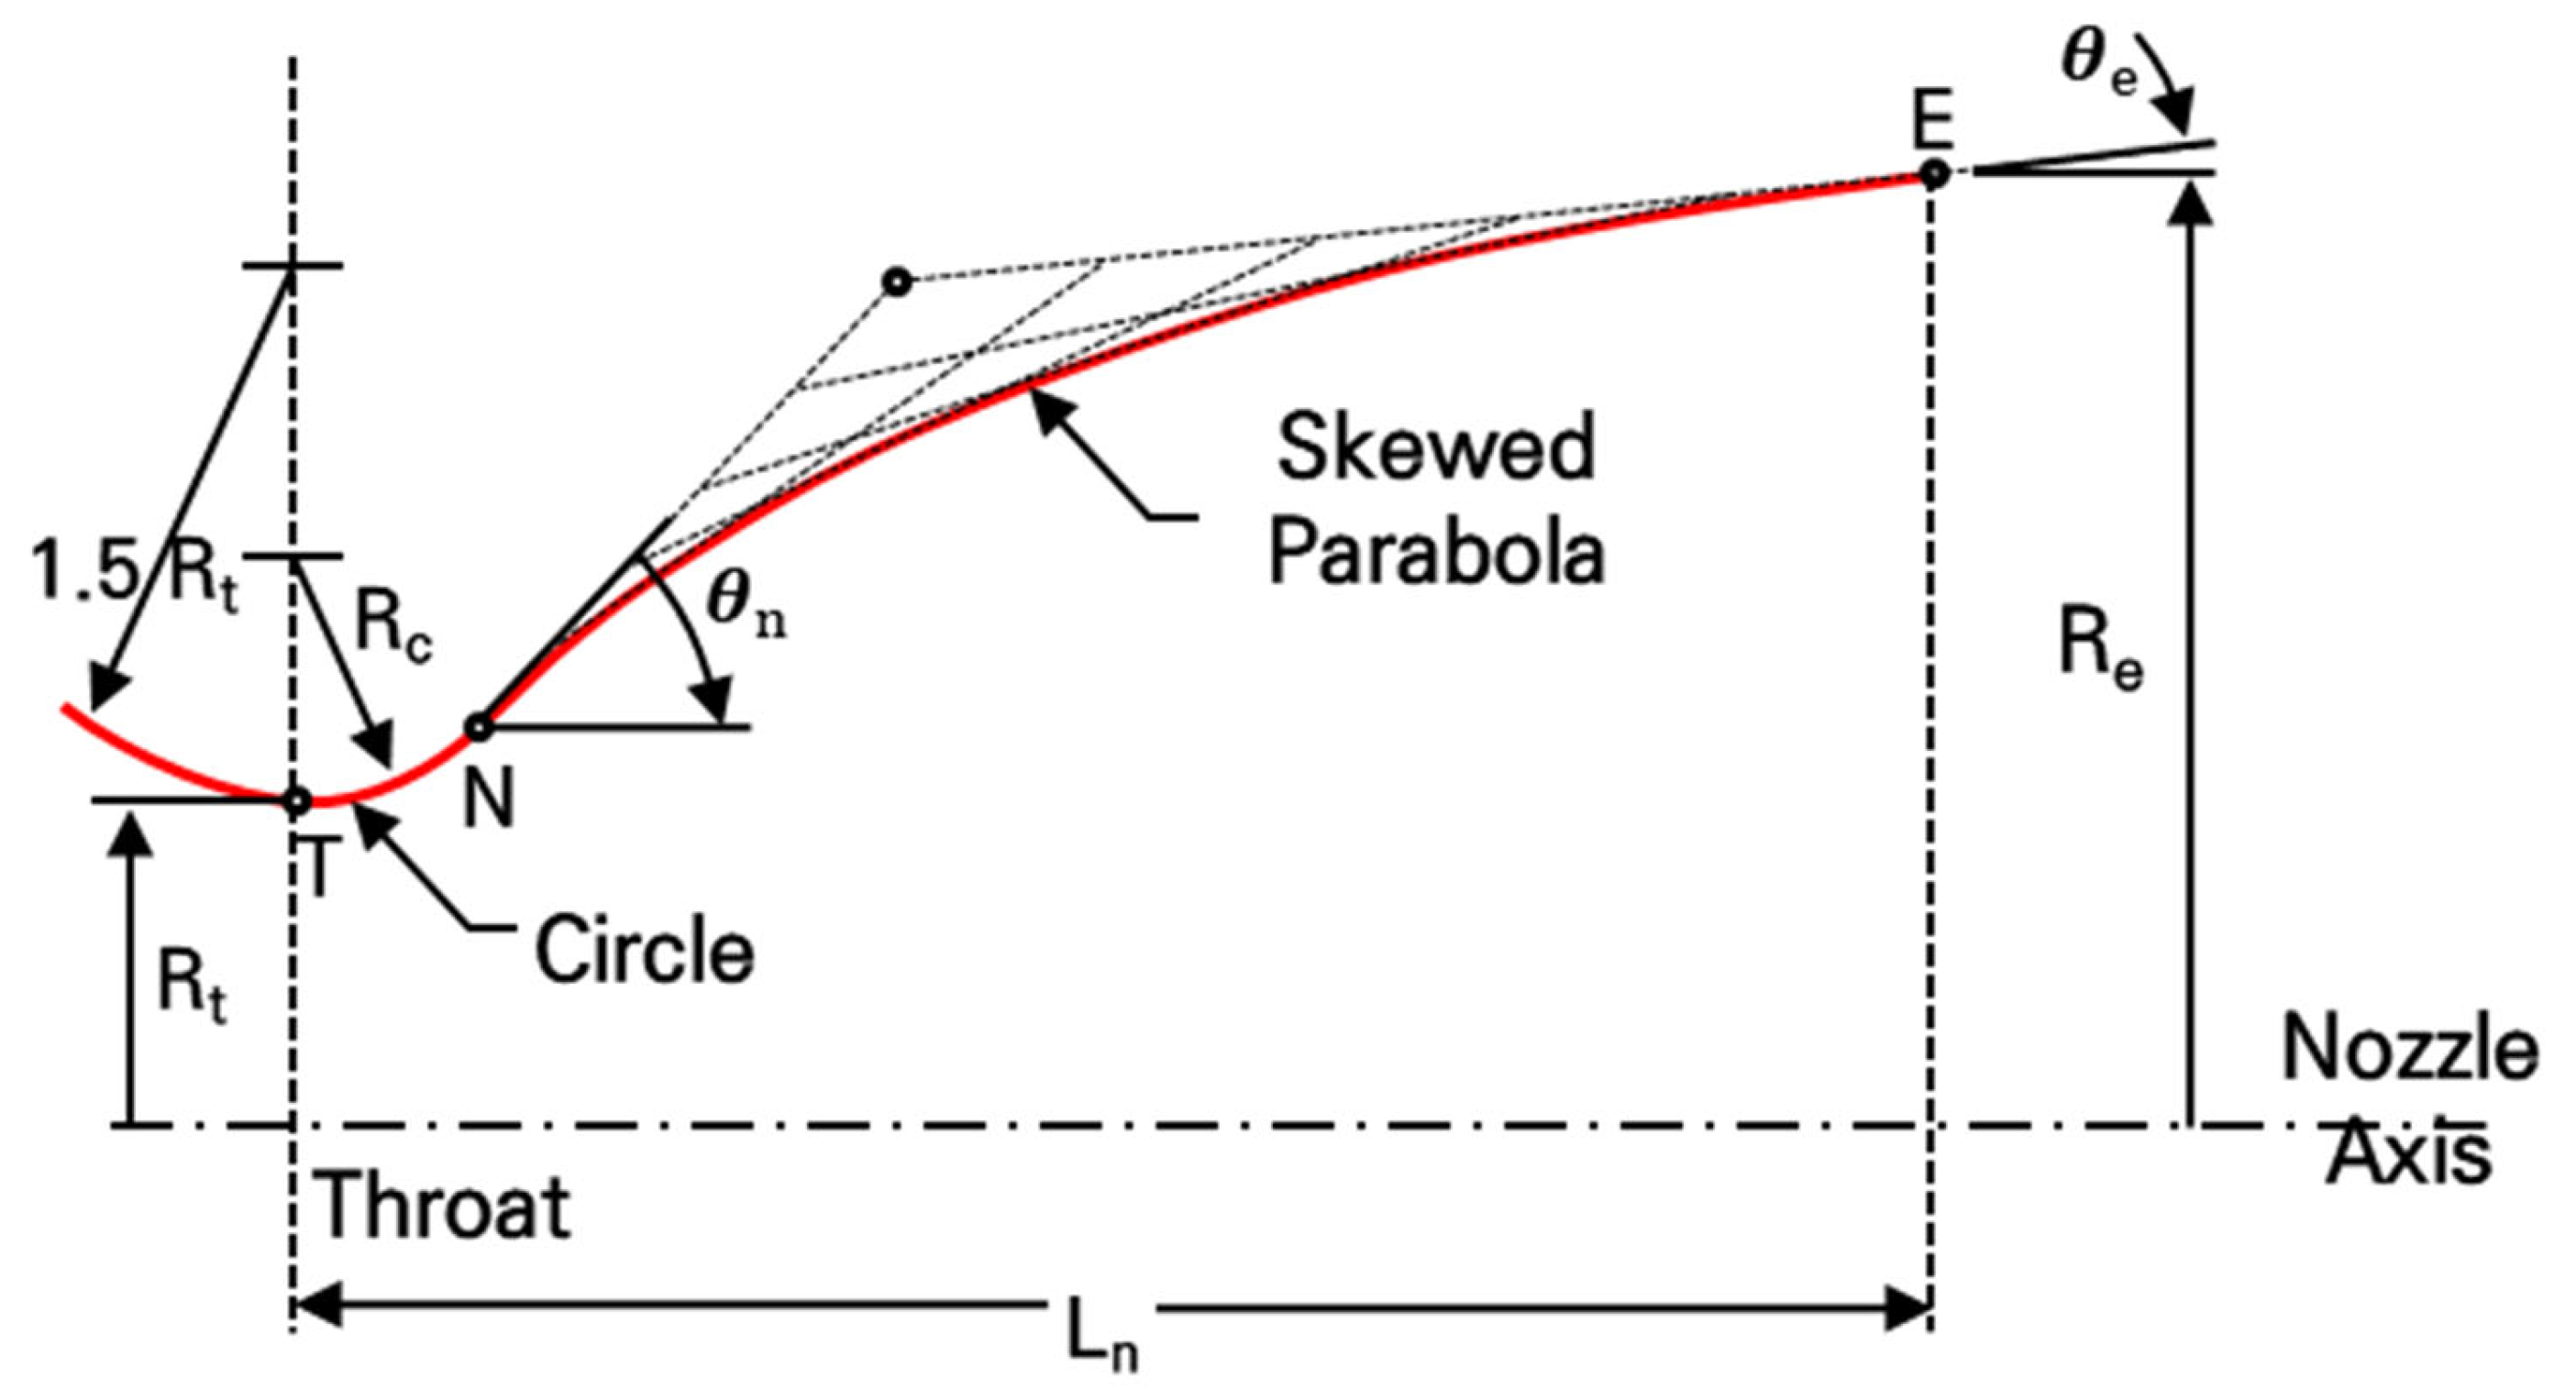
Figure 1. Rao’s TOC (Thrust Optimized Contour) design method.
Aerospace 12 00771 g001
Figure 2. Schematic diagram of 3D-printed Inconel 718 supersonic nozzle.
Aerospace 12 00771 g002
Figure 3. A 3D-printed Inconel 718 nozzle using Powder Bed Fusion (PBF).
Aerospace 12 00771 g003
Figure 4. Conditions of AMS 5662 heat treatment process. The first and second panels correspond to Step 1 and Step 2, respectively, and are executed sequentially. Both steps were performed as part of the process used to enhance the material’s mechanical strength. The finished (fabricated and heat-treated) nozzle is shown in Figure 3.
Aerospace 12 00771 g004
Figure 5. Schematic of combustion test setup (combined VAH with 3D-printed nozzle). (a) 3D model of the VAH injector design; (b) fabricated VAH injector.
Aerospace 12 00771 g005
Figure 6. Overall Pipe and Instrumentation Diagram (P&ID) of F/O supply and combustion test control system of Pusan National University.
Aerospace 12 00771 g006
Figure 7. Schematic diagram of combustion test control sequence. Sequence of combustion test: (1) start of test and opening of GO2 and GH2 valves with rise in pressure transducers; (2) 0.5 s later, opening of Air valve and rise of VAH chamber pressure; (3) 0.6 s later, ignition; (4) 1.8 s later, closing of all GO2, GH2, and Air valves.
Aerospace 12 00771 g007
Figure 8. Schematic of radiative emissive power measurement.
Aerospace 12 00771 g008
Figure 9. Shock structure during combustion test at 1.3 s. (a) Captured image by digital camera. (b) Shock structure during combustion test through schlieren photography. (c) Averaged image of 500 images captured by high-speed camera.
Aerospace 12 00771 g009
Figure 10. Pressure profile (a) and Thrust profile (b) during combustion test.
Aerospace 12 00771 g010
Figure 11. Spectral emissivity (8–14 µm) of Inconel 718 with an emission angle range of 0° to 75°.
Aerospace 12 00771 g011
Figure 12. Emissivity profile based on reference temperature and apparent temperature. (a) Emissivity profile comparison of the Inconel 718 surface at reference temperatures. (320~653 K) [A] represents the spectral emissivity in the 8–14 µm range, while [B–E] were exported 8–14 µm range from Campo et al. [18]. (b) Emissivity curve fitting based on apparent temperature measured using a thermal imaging camera. (303~605 K).
Aerospace 12 00771 g012
Figure 13. Emissivity profile based on reference temperature and apparent temperature.
Aerospace 12 00771 g013
Figure 14. Thermal images were captured during combustion test 1.3 s. (a) Calculated real temperature distribution of nozzle. (b) Emissive power distribution derived from post-processed curve fitting and temperature distribution.
Aerospace 12 00771 g014
Table 1. Composition and surface roughness information of INCONEL718.
Nickel + CobaltChromiumMolybdenumNiobium + TantalumCobaltAluminum
50–55%17–21%2.8–3.3%4.75–5.5%Max. 1%0.2–0.8%
TitaniumCarbonIronManganeseSiliconPhosphorous
0.65–1.15%Max. 0.8%BalanceMax. 0.35%Max. 0.35%Max. 0.015%
SulfurCopper R a
Max. 0.015%Max. 0.3%30 µm
Table 2. The fifth-order polynomial curve fit coefficients.
B0B1B2B3B4B5
12.52−0.11460.0004452−8.549 × 10−78.109 × 10−10−3.041 × 10⁻¹³
Disclaimer/Publisher’s Note: The statements, opinions and data contained in all publications are solely those of the individual author(s) and contributor(s) and not of MDPI and/or the editor(s). MDPI and/or the editor(s) disclaim responsibility for any injury to people or property resulting from any ideas, methods, instructions or products referred to in the content.