1. Introduction
In modern aviation, the rise of unmanned aircraft has necessitated the introduction of increasingly complex sensor systems to allow operators to retain adequate control and awareness from control locations. To facilitate this, many large-scale, commercial and military unmanned aerial vehicles (UAVs) utilise externally mounted sensor arrays. A common purpose of the sensor array is often to facilitate optical analysis of a given region of interest (ROI); however, they can be used for many other purposes. Often, the simplest and most effective way to mount these sensors is external to the structure of the aircraft due to internal space limitations. Thus, the sensor often sits in the flow field around the fuselage itself. Due to the positioning of the device on the fuselage, it is within or partially within the boundary layer of the aircraft fuselage. These arrays are often configured in various shapes; the simplest shape resembles a hemisphere and is the ideal candidate to approximate the performance characteristics of the structural protuberances as a whole.
Based on a protuberance flow, the flow around a bluff body is characterised into two distinct regions these being the upstream flow features and the downstream flow features. Some key early work, looking into the flow surrounding such protuberances, was conducted by Savory et al. [
1], Baker [
2], and Achenbach [
3]. As a hemisphere is a simple bluff body, key flow features around a hemisphere include the turbulent wake, flow separation around the structure and generation of vortices in the near field region. A fundamental piece of work regarding flow around a hemisphere arises from Tamai et al. [
4] in which analysis of the vortex structures around a hemispheric hump is conducted at varying Reynolds numbers. The key points observed from this testing are the presence of a recirculation zone behind the hemisphere in which arched vortex tubes form and collapse. Furthermore, when modulating the Reynolds number, until the critical Reynolds number is reached, the vortex tubes appear to shed individually from the recirculation zone. Once the critical Reynolds number is exceeded, the vortex tubes begin to coalesce in the recirculation zone, which then proceeds to shed. Savory et al. [
1] also clearly note that within the wake, the dominant flow structure is the shedding, specifically von Kármán (vK) vortices, from the body. In particular, Savory et al. [
1] also state high sensitivity to the boundary layer (BL) on the formation of the vortex structure; however, for this experiment, the boundary layer was maintained consistently to prevent any further variability. Manhart [
5] also corroborates the previous experimental data of Savory et al. [
1] by observing similar behaviour when performing a LES analysis of flow around a hemisphere at
. The behaviour of the region is from the separation and roll-up of the shear layer at the top of the hemisphere and the separation of the vK vortex structures from the side regions of the hemisphere.
Acalar et al. [
6] further describe the flow region aft of a hemispherical protuberance, with specific importance given to the nature of hairpin vortex formation and collapse to the behaviour within the region; however, due to the field of view (FOV) of the current experimentation, the formation of the hairpin vortex will not be directly visible, but interaction of this vortex structure is expected within the wake. McCarthey et al. [
7] state that in the near wake region (<2D) aft of the rigid hemisphere structure, the spanwise coherency of the vK vortices is aperiodic, whilst past 2D downstream the vortex structures exhibit incoherency in spanwise behaviour. For this paper, the ROI is the near wake (<1.5D). The Reynolds number in McCarthey et al. [
7] was
.
In addition to hemispheres, the flow regimes around spheres, cylinders, and hemisphere cylinders are of particular importance due to the similar flow features present in the system. The work of Achenbach [
8] analyses the relation of the periodicity of the trailing vortices and their relation to the Reynolds number. The vortex shedding frequency heavily depends on the incoming velocity of the flow, which in turn indicates that small changes in velocity drastically change the Strouhal number versus Reynolds number relationship. In this paper, periodicity is not within the scope of analysis.
Wood et al. [
9,
10] have previously shown a comparison between the aero-elastic interactions between both a thin-walled membrane, a rigid structure, and the surrounding flow. Specifically, the structure used during the testing is an air-inflated hemisphere, held at a constant pressure during the testing procedure. Instead, for the experiment conducted within this paper, we observe the free deformation of a structure under oncoming wind loading. In Wood et al. [
9], the region of maximum displacement was along the LE of the hemisphere, with maximum displacement approaching the hemisphere apex. The experiment within this paper is conducted without the addition of internal pressurisation; thus, the structure is not expected to deform exactly as shown by Wood et al. [
9]. The material stiffness is also expected to cause variation, as stiffness greatly affects the nature of deformation of the structure. Furthermore, Wood et al. [
9] perform experimentation in
to
compared to current tests (
). Thus, the variation in Reynolds number may provide a greater variation in behaviour. To highlight, a key feature that was analysed in this test regime is the formation of an elongated ‘belly-shaped’ recirculation region due to the movement of the detachment line on the surface of the flexible model, as described by Wood et al. [
9], who also investigate the behaviour using a particle image velocimetry (PIV) set-up, allowing for a direct comparison between the existing literature dataset and the current dataset and further showing the effectiveness of the technique for this application.
In addition to the flow characterisation, which was conducted using SPIV techniques, the tracking of the structural deformation of the flexible hemispheres was conducted non-simultaneously, utilising a stereo arrangement of digital cameras utilising DIC to enable the surface movement tracking. Modern DIC implementation has been made relatively robust with numerous software packages and utilisation available; for this research, the primary methodology utilised is that presented by Solav et al. [
11]. The methodology utilises a combination of a stereo camera calibration, coupled with a 2D DIC implementation, to allow for 3D reconstruction of structural deformation. The underlying algorithm utilised for the 2D DIC originates from the open-source Ncorr software as described by Blaber et al. [
12]. For this experiment, the stereo calibration, speckle pattern, and image capture process were aimed to enable minimal error in the reconstruction with the limitations of the test environment and setup. The coupling of both the DIC and aforementioned SPIV allows for the structural characteristics to be directly correlated with the flow effects as described by previous literature.
With the understanding of the previous work in this field, a study has been conducted to investigate the fluid–structure interaction (FSI) of a flexible hemisphere shell immersed within a turbulent boundary layer. For this study, a flexible shell in conjunction with a rigid hemisphere are tested, with the rigid model used as a baseline comparison. All models are experimentally tested at . The primary facet of interest is the change in wake behaviour as a result of LE deformation. With the addition of a flexible structure, the analysis is centred on the change in the recirculation due to upstream deformation, and the utilisation of SPIV and DIC for the investigation.
Thus, the two key components to analyse are the structural deformation caused by the incoming flow and the downstream change in wake structure and behaviour. This work builds heavily on previous work that aimed to characterise the flow surrounding hemispherical structures conducted by Menakath et al. [
13,
14,
15].
2. Materials and Methods
Experimental testing was carried out using the University of Sydney 3 ft × 4 ft wind tunnel facility. The testing procedures were not conducted simultaneously; therefore, two distinct experimental setups were used for the acquisition of relevant data. The initial experiment conducted was an SPIV setup, used to gather fluid flow information, whilst the secondary experiment was digital image correlation (DIC), aimed at gathering structural deformation data. All tests were carried out at
with the experimental models having a primary dimension
mm. The experimental setup consisted of a centrally placed mid-plane to allow separation from the boundary layer formation on the tunnel floor. The mid-plane consists of a wooden structure with an acrylic insert, upon which the test models are mounted. The mid-plane utilises a controlled LE profile to enable consistent boundary layer development and formation between different test cases and specified setups. The LE of the mid-plane is a 2:1 elliptical leading edge (LE), with a minor axis (vertical) height of
D and a major axis (streamwise) length of
D. All the models are mounted
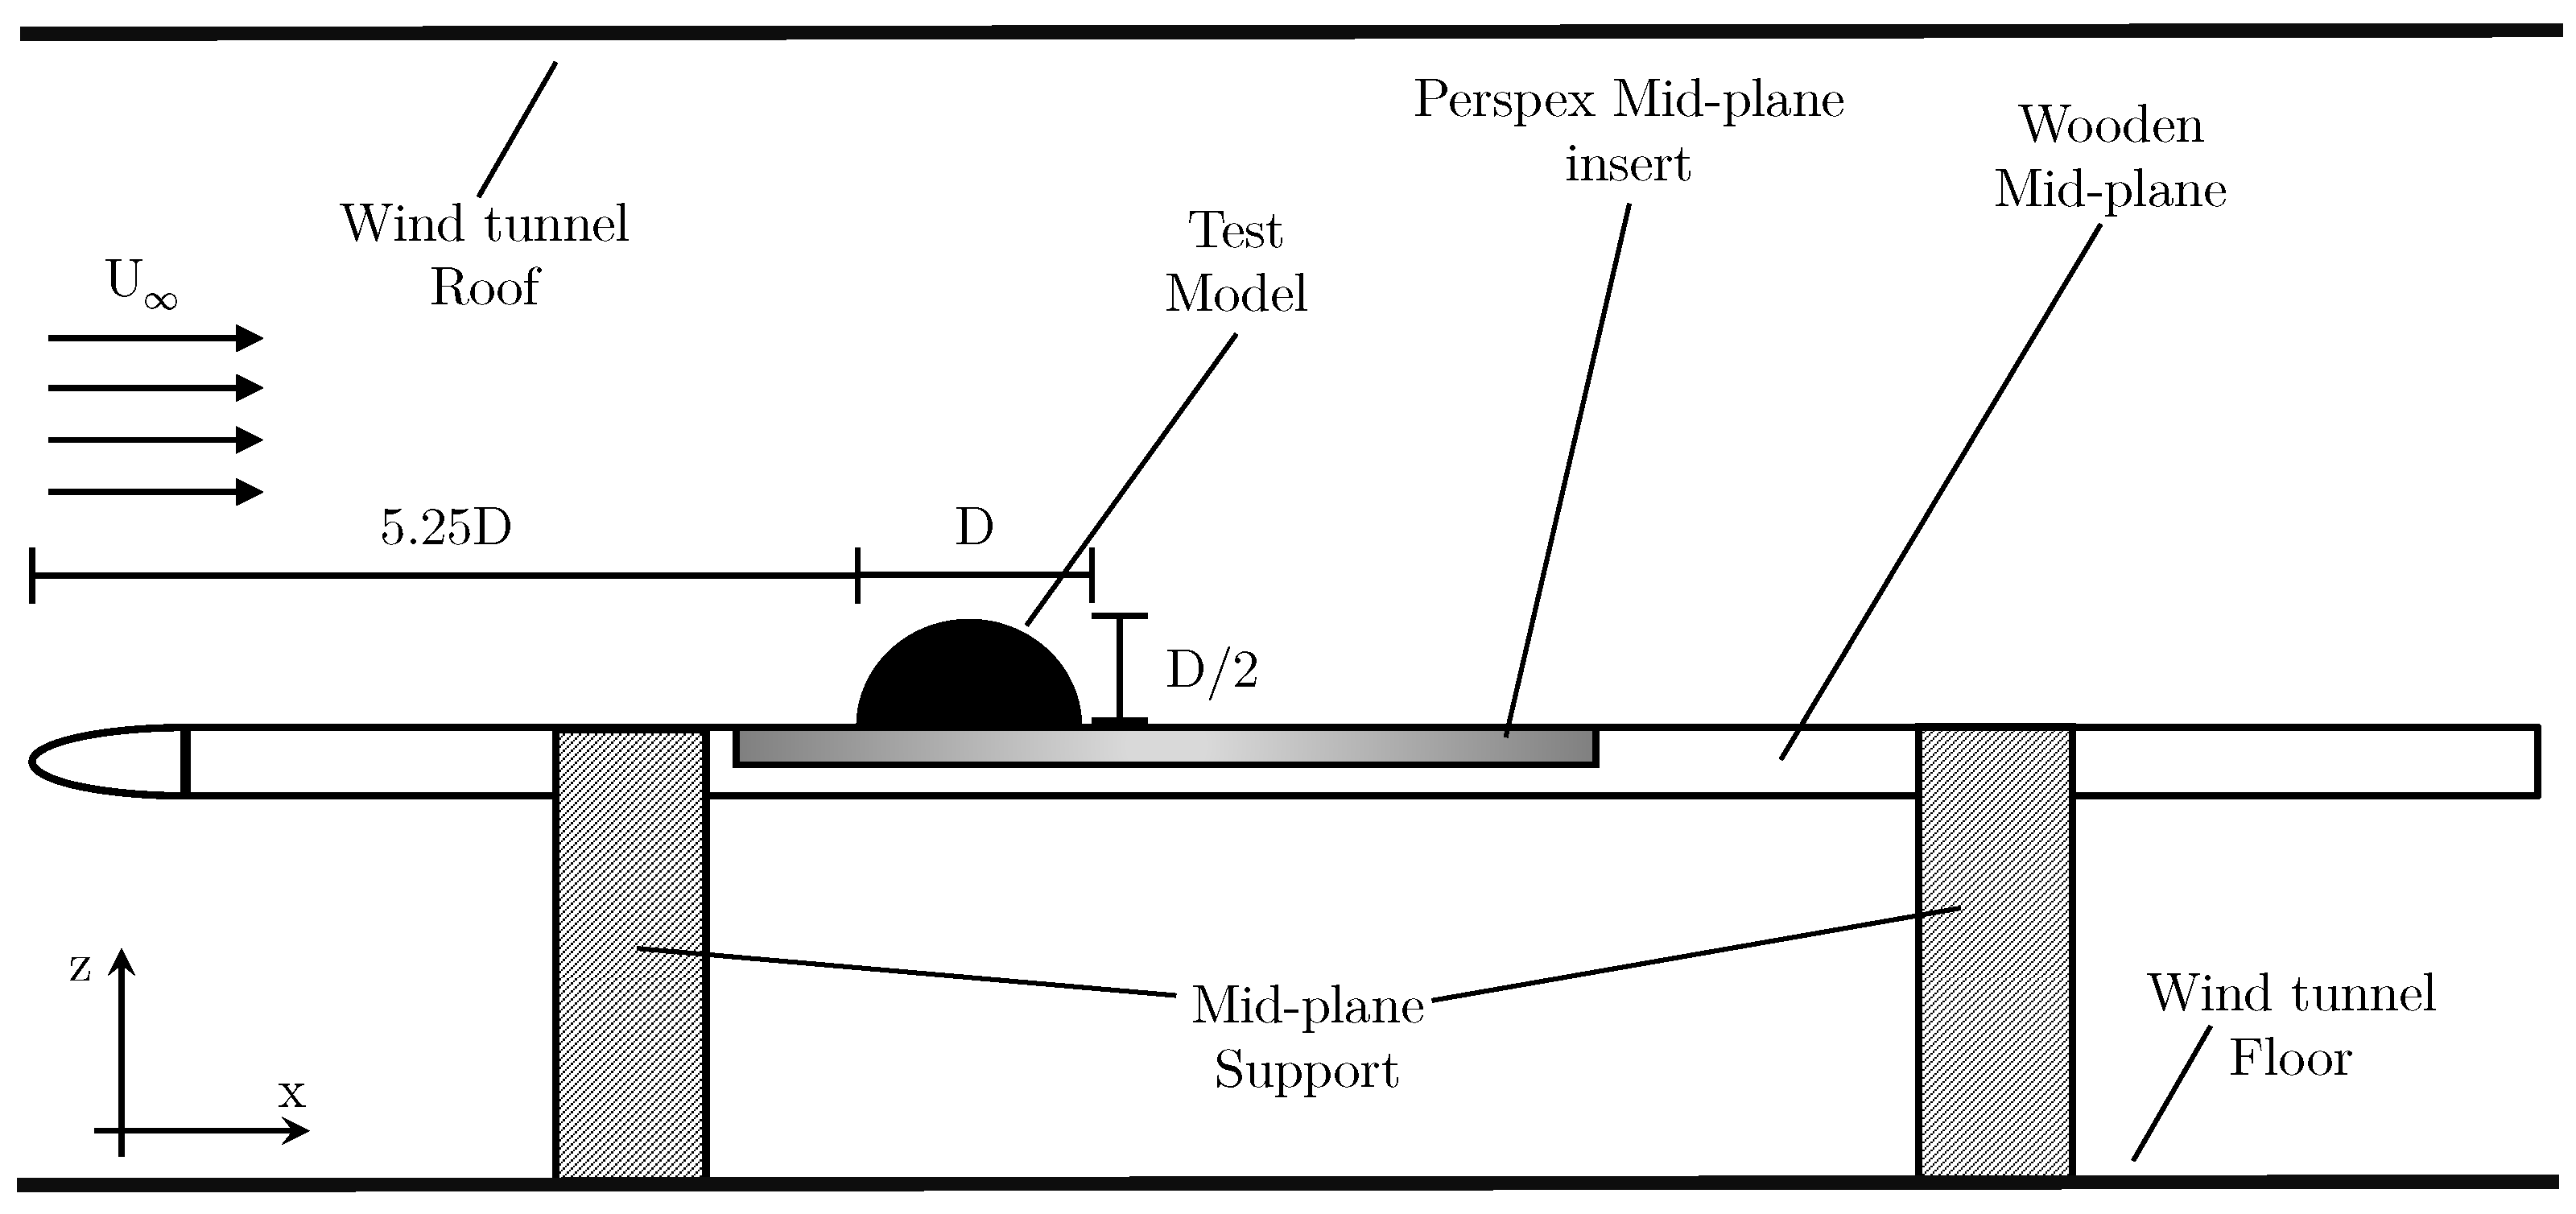
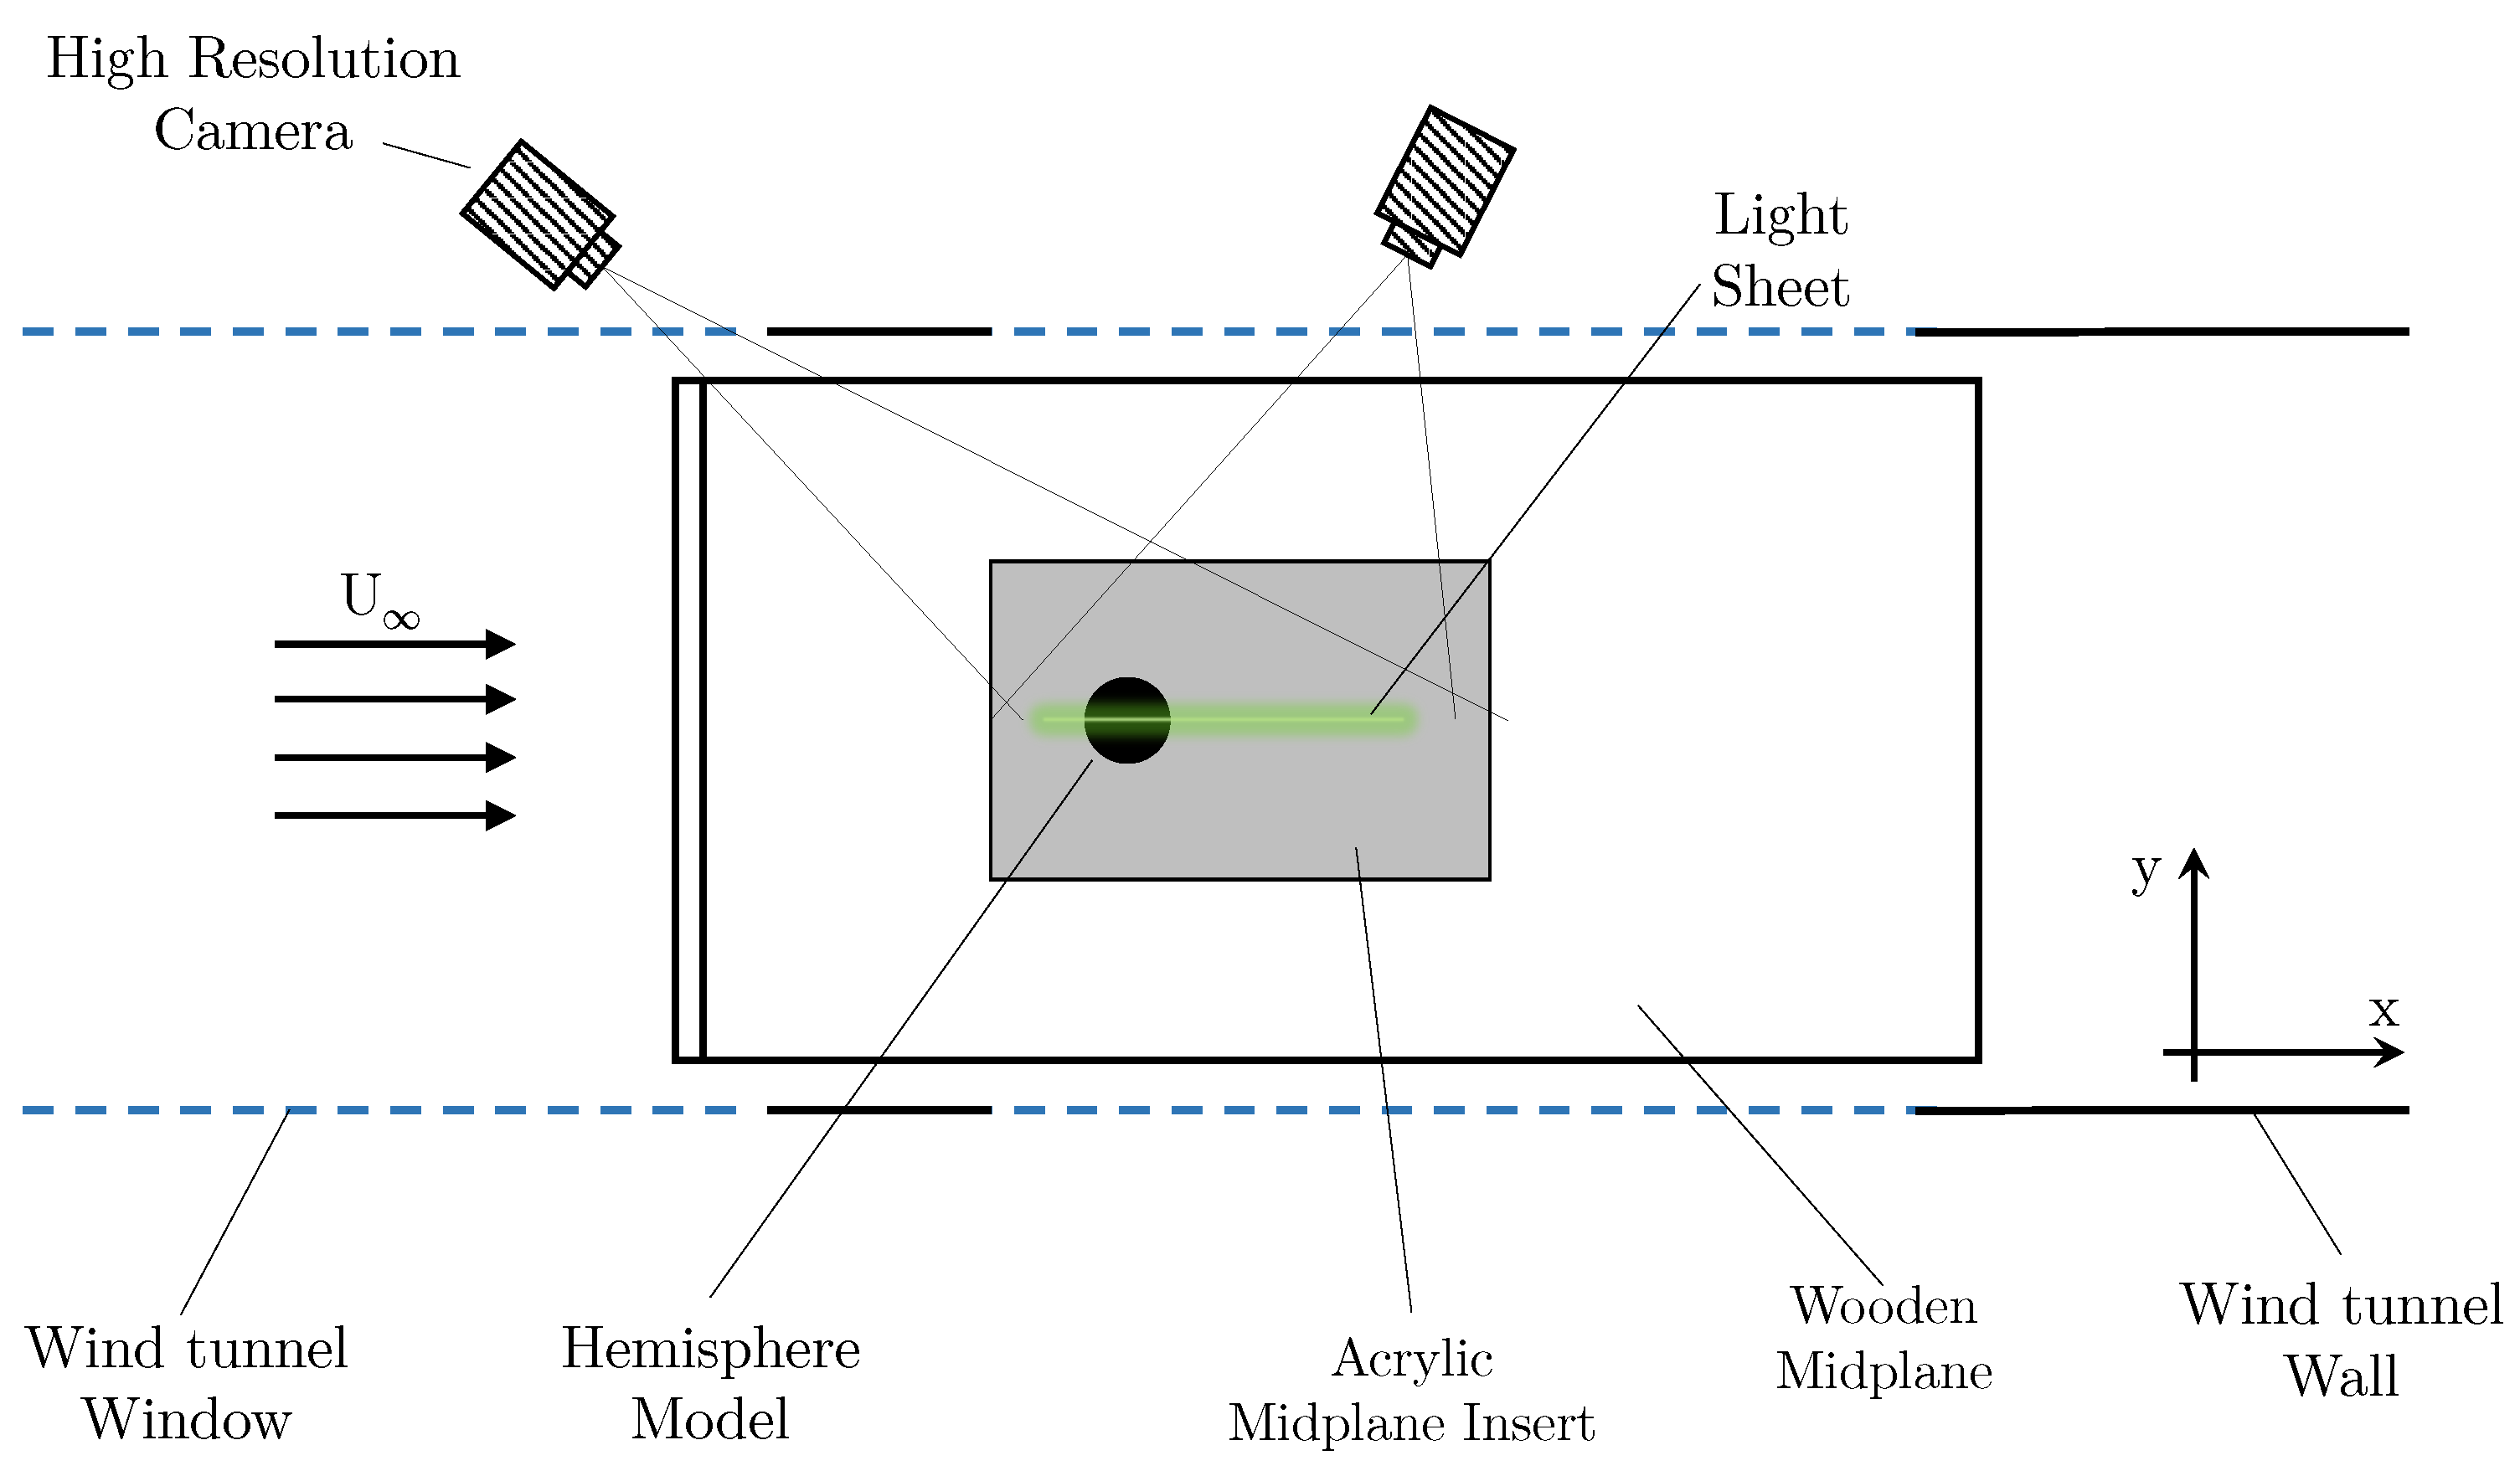
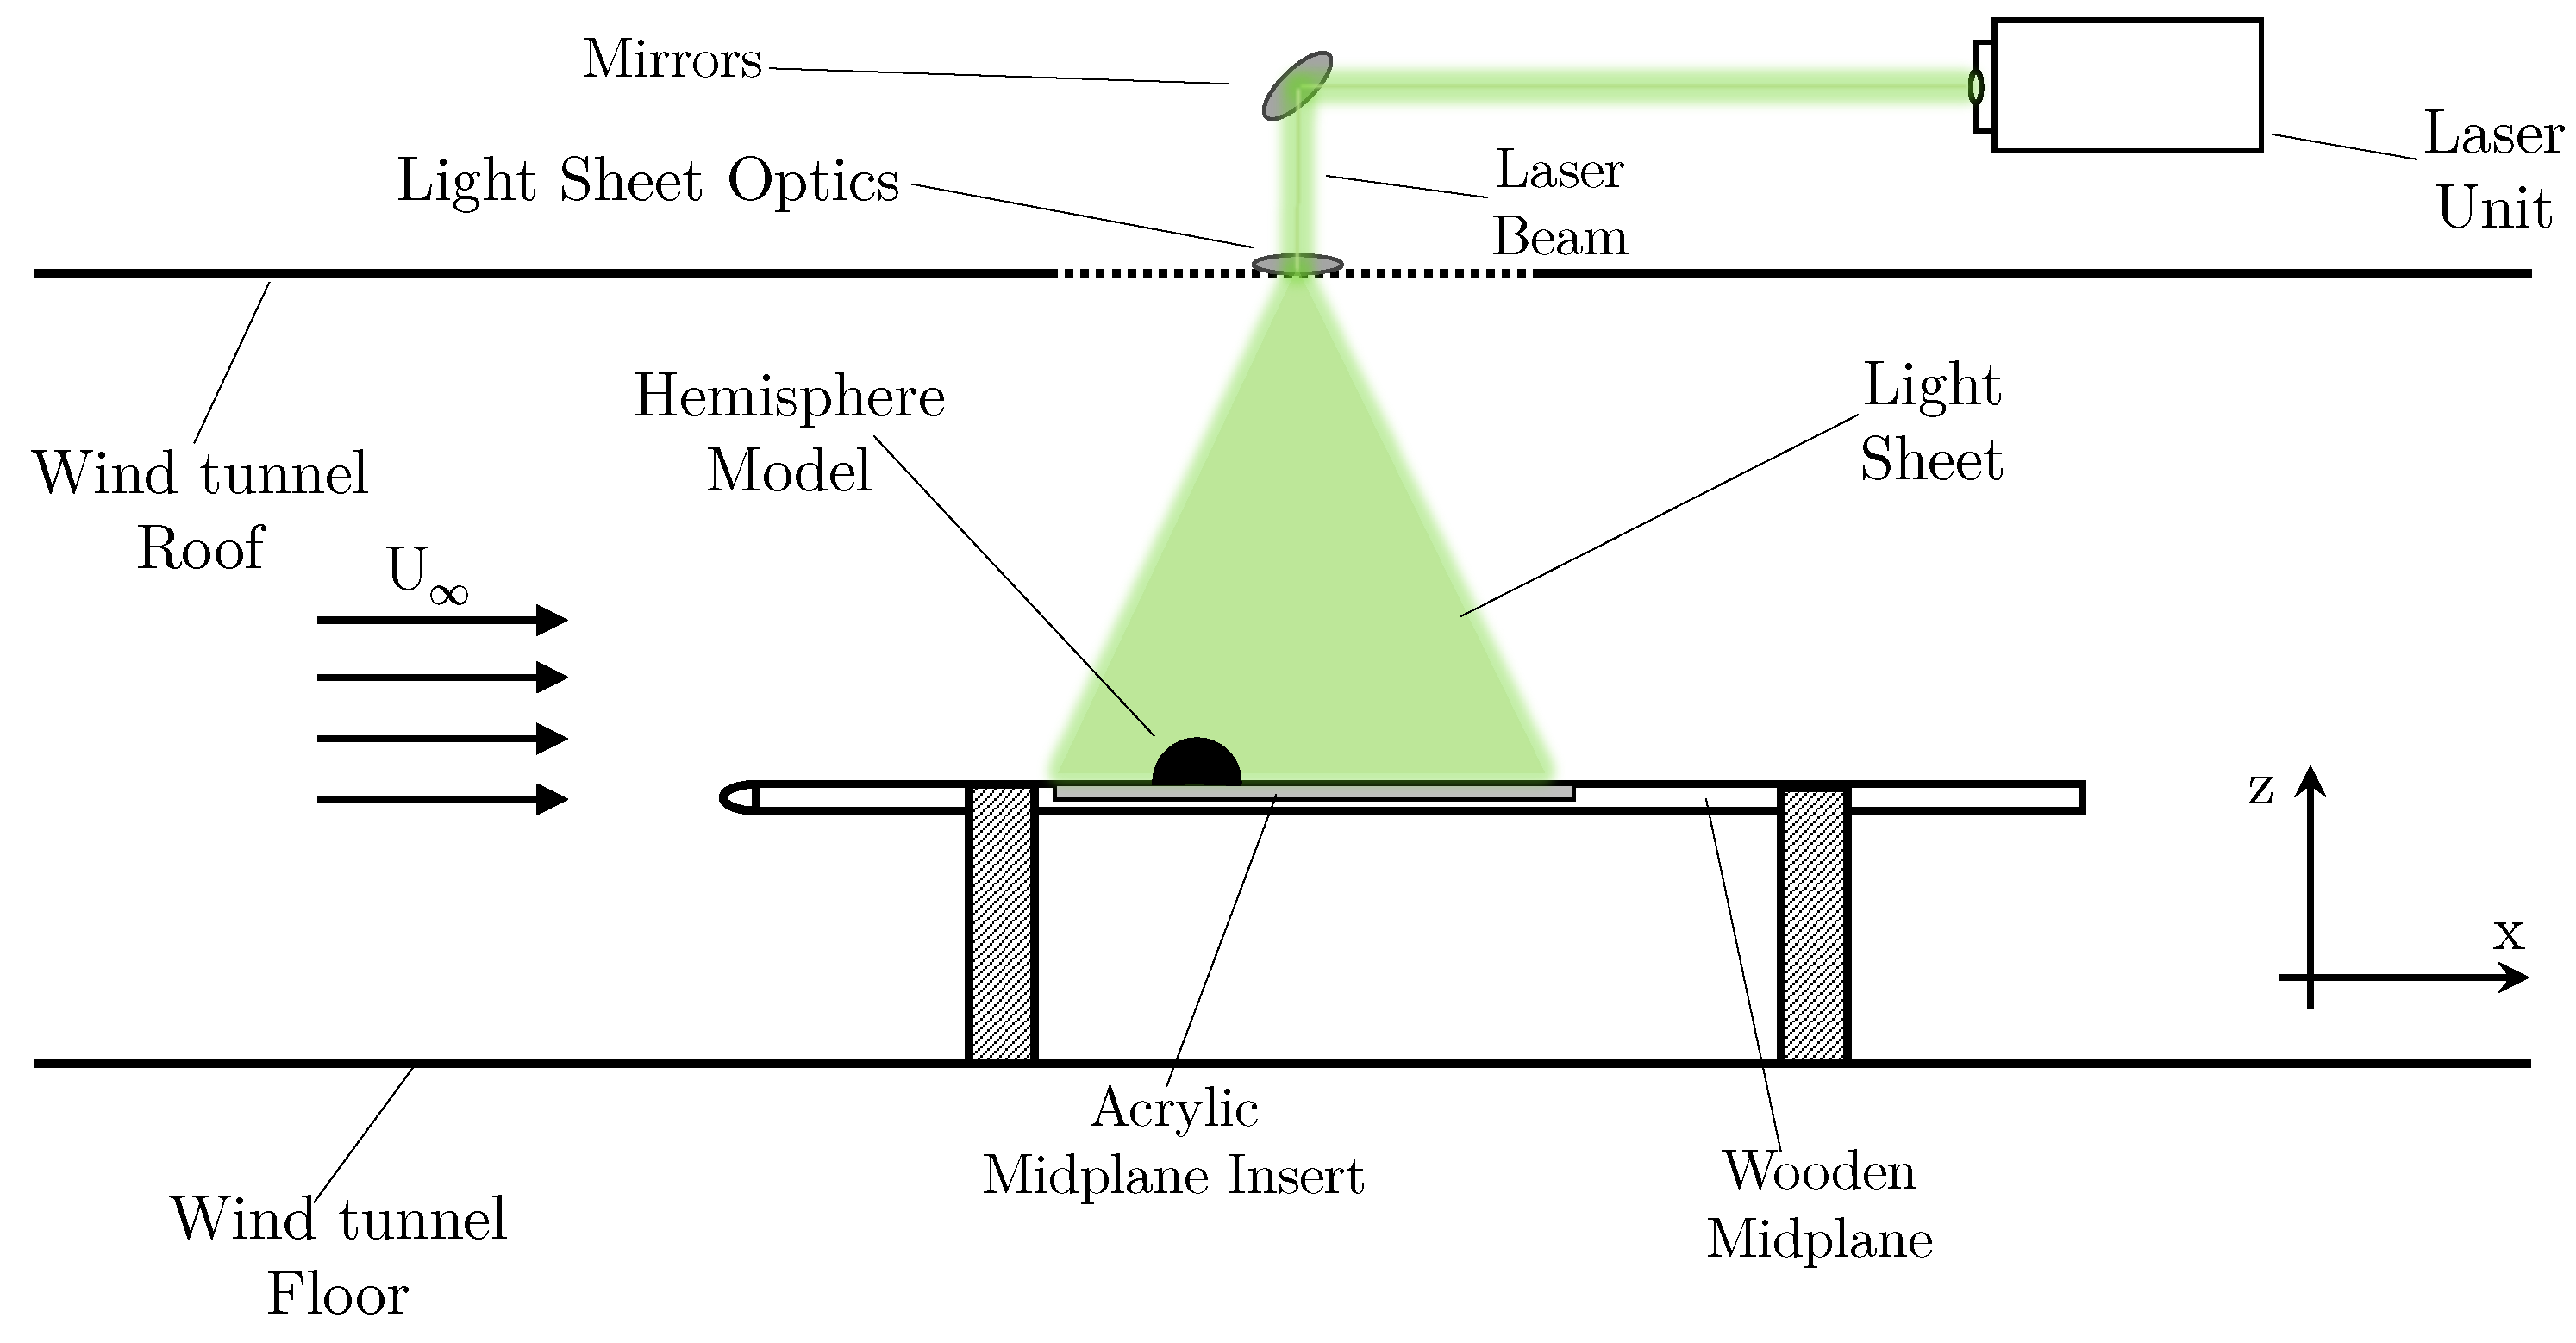
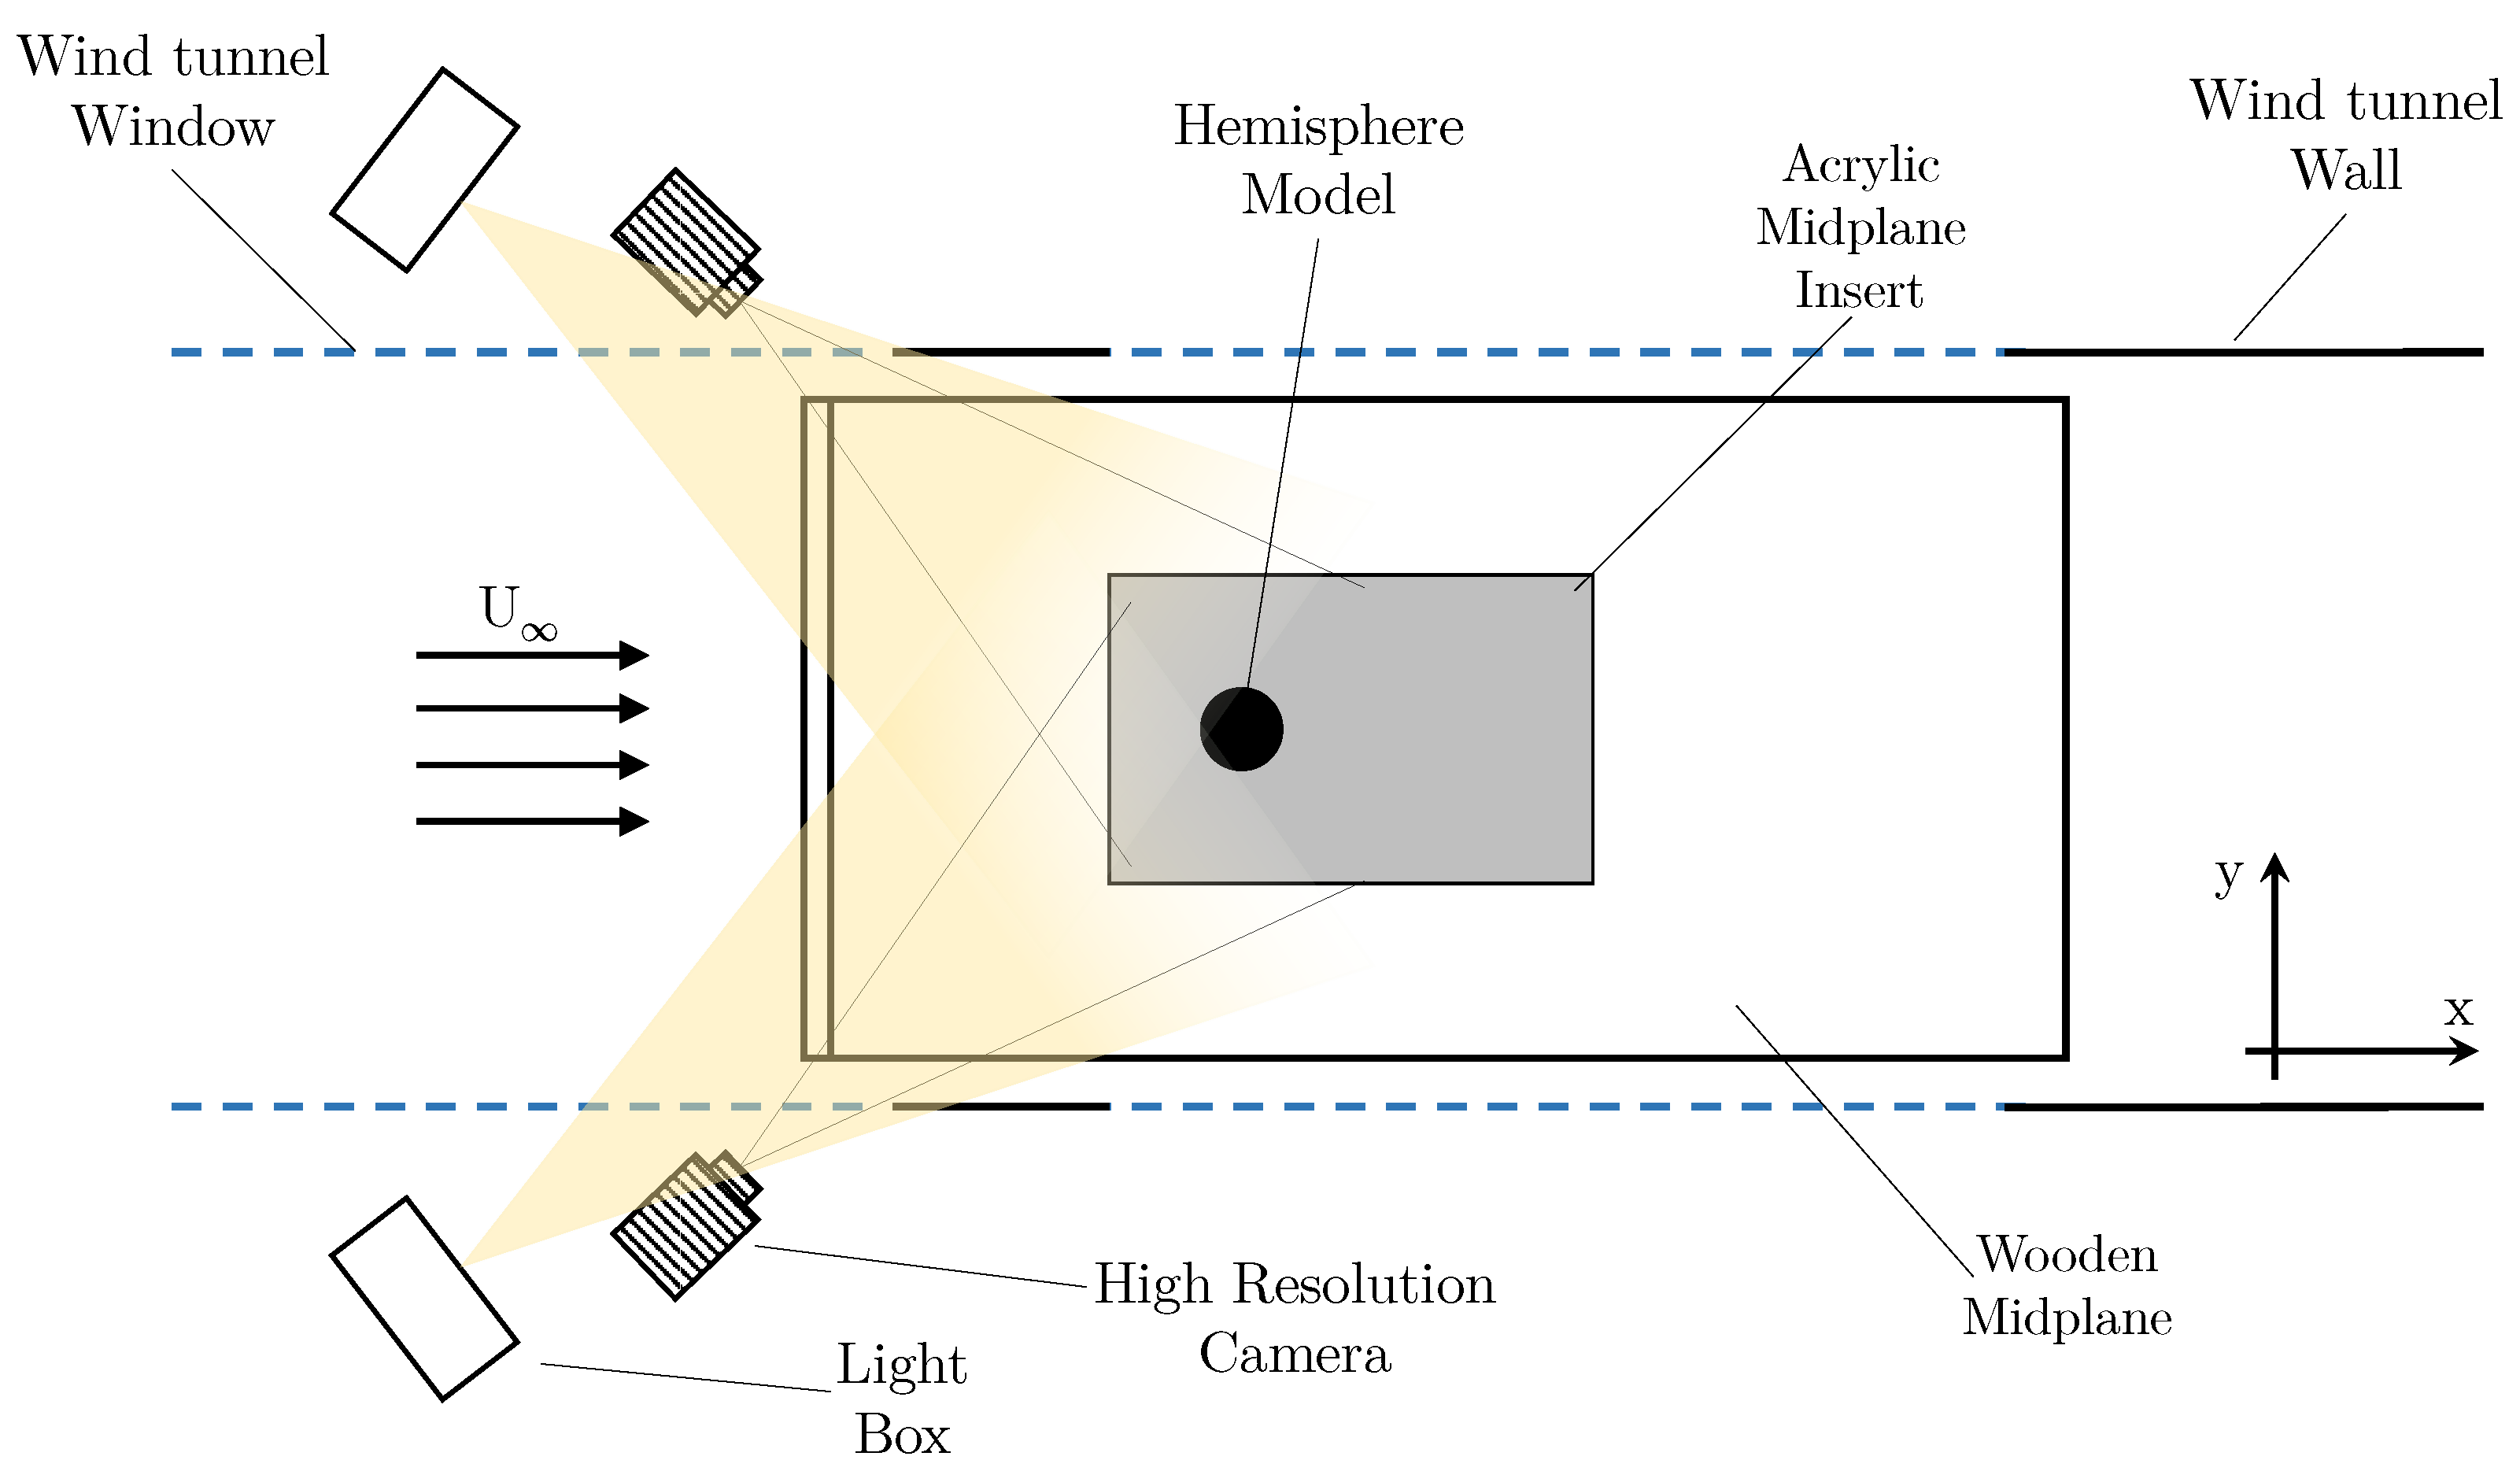
D downstream of the LE, when measured to the LE of the model. The models are mounted directly onto the acrylic insert with the use of M6 bolts, fastened from the underside of the mid-plane. The acrylic mid-plane insert is used for both sets of experiments. A diagram of the general experimental setup is provided within
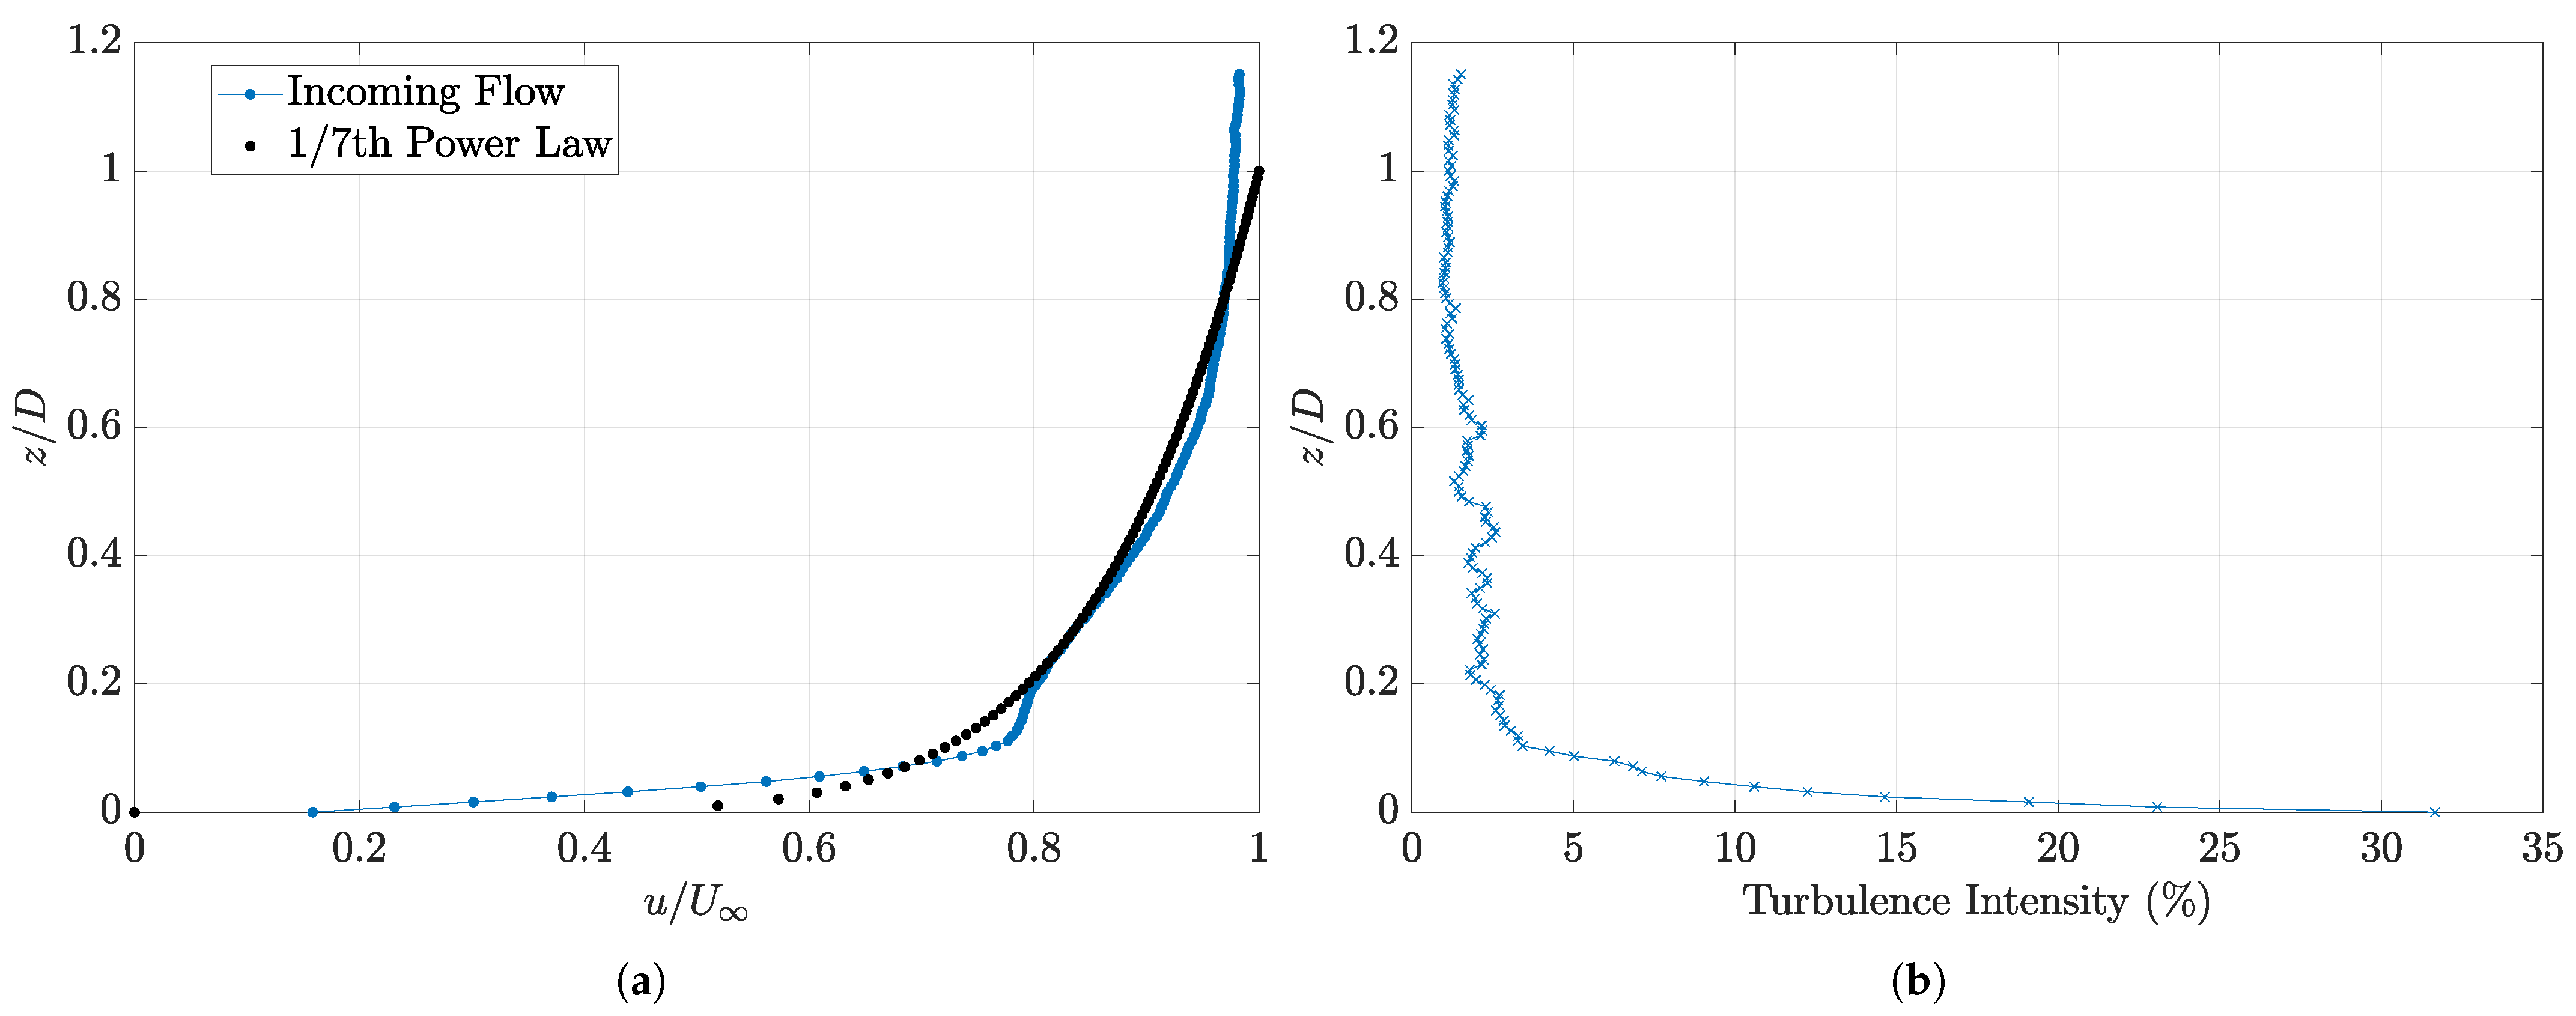
Figure 1. Due to the differing requirements between the two experiments, this has necessitated a variance in the instrumentation configuration and placement; however, the general testing environment and the internal wind tunnel setup have been maintained to minimise variability between experimental scenarios. The incoming flow conditions are presented in
Figure 2. Measured points in
Figure 2 are connected using linear interpolation. The 1/7th power law is provided by
[
16].
2.1. Experimental Models
Two distinct models have been created for the experiments conducted. With the primary purpose of testing being to observe the FSI between flexible structures and the surrounding near field flow, a flexible model and a rigid model have been manufactured. The rigid model is used as the base reference to allow for comparison to the flexible model. The flexible model is constructed from a PU resin mixture with a hardness of Shore A25; therefore, it will be named model A-25 in conjunction with the convention presented by [
15].
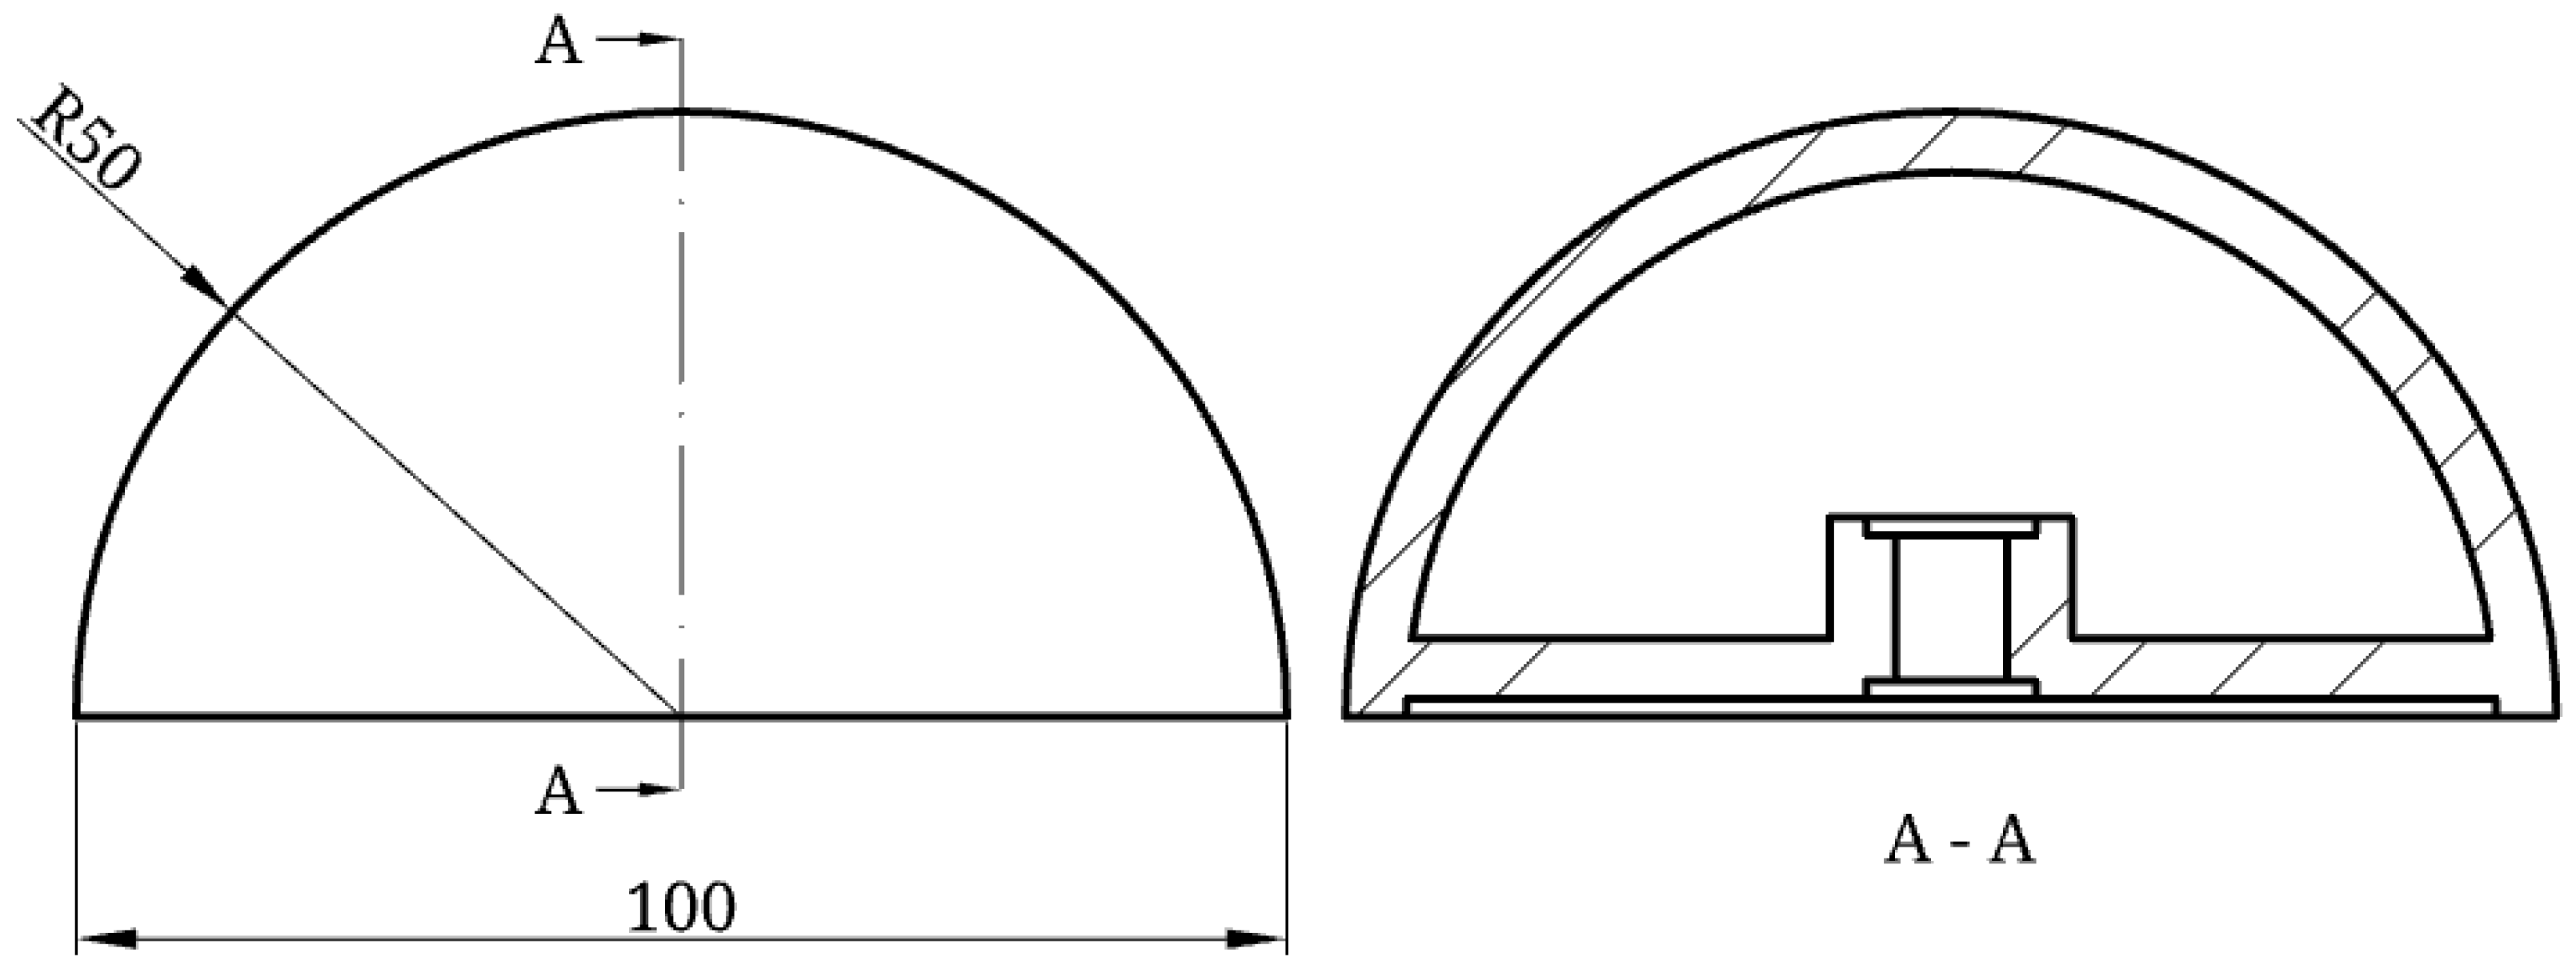
The rigid model is constructed to prevent any structural movement during testing. For this, 3D printing was used. For model generation, a hemispherical shell was designed and 3D printed using standard PLA. The shell thickness used was
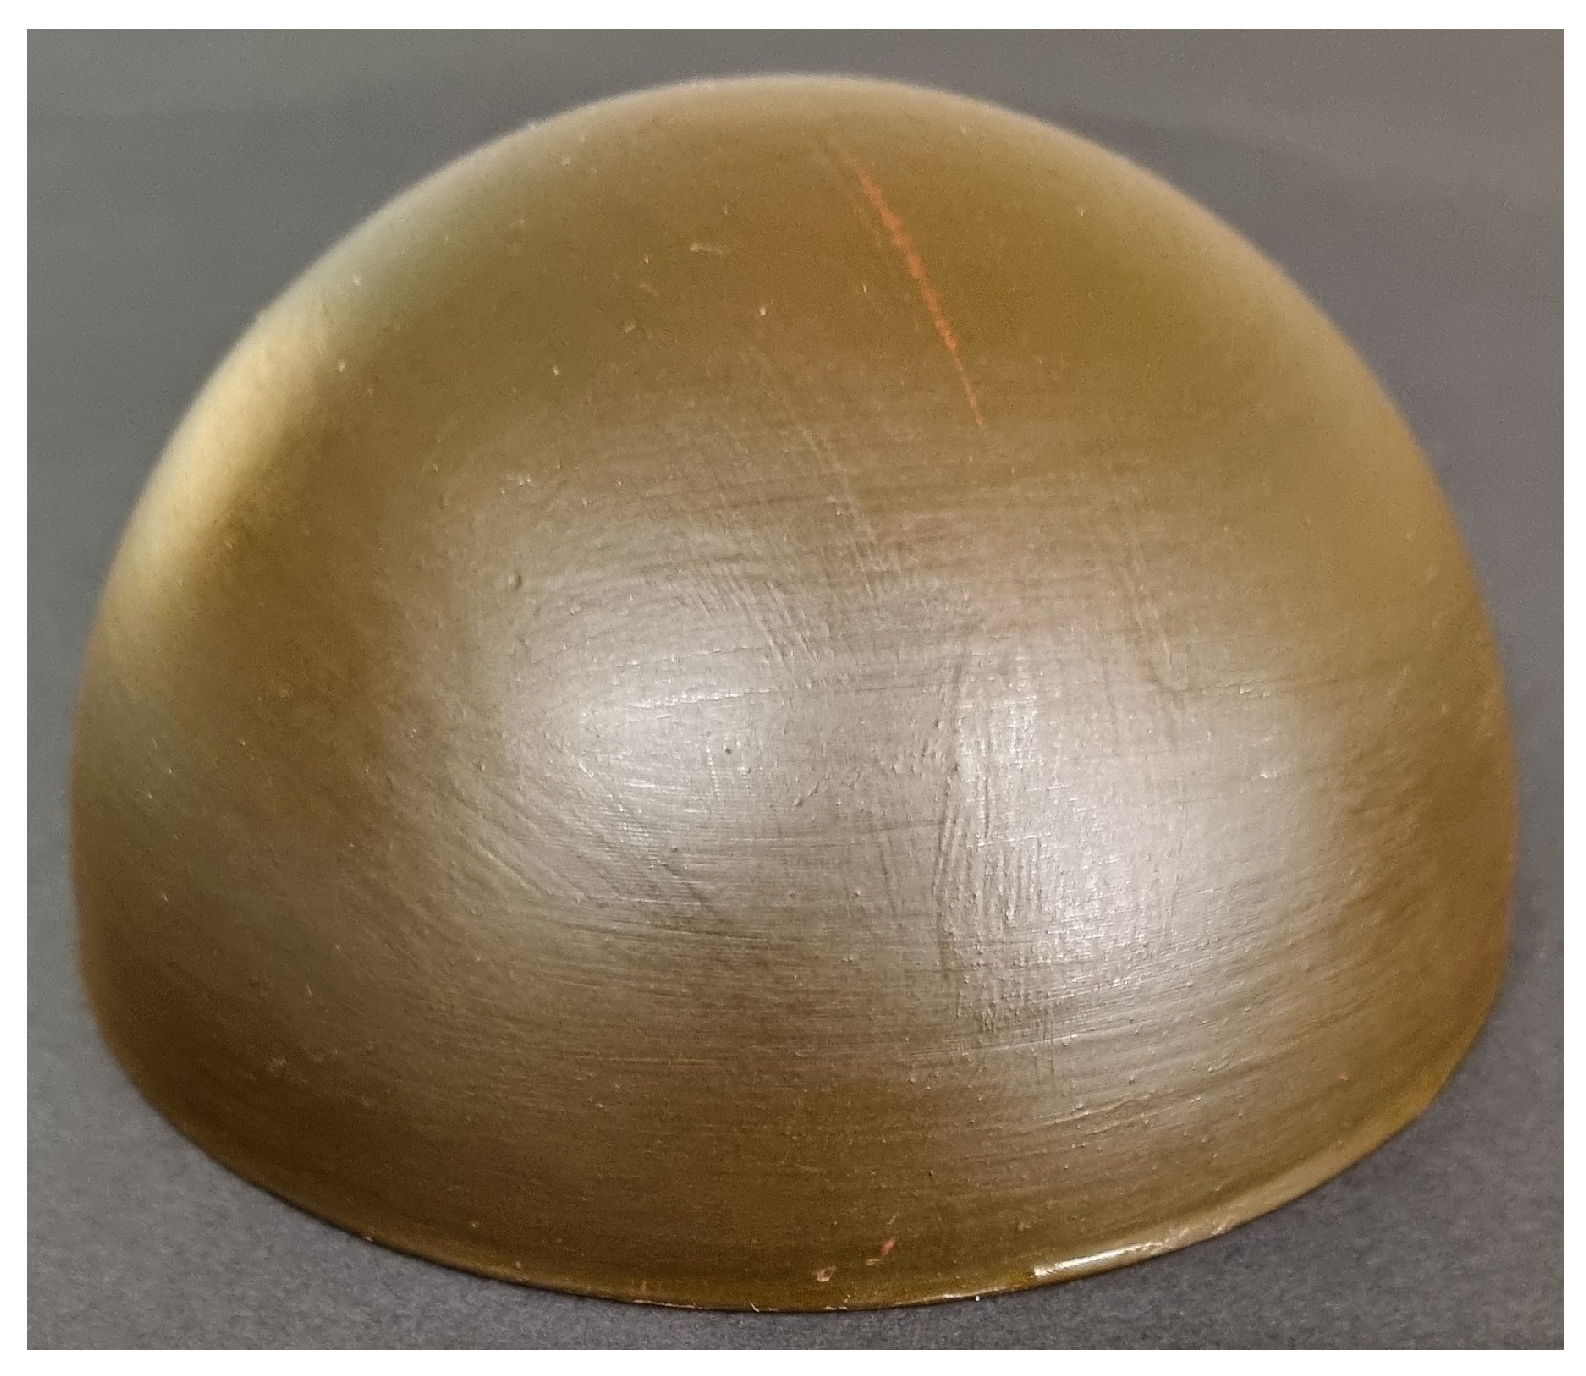
, selected to minimise material waste during manufacture but maintain structural rigidity at the desired Reynolds number and eliminate structural deformation under high wind loading conditions. An internal cross-shaped core is used to allow mounting to the wind tunnel mid-plane, with the mounting mechanism recessed above the edge of the hemisphere surface to allow flush mounting to the acrylic wind tunnel insert. The rigid hemisphere surface was surface finished with P400 sandpaper and gap filler to smooth the surface of the hemisphere and minimise the effect of the 3D print layers from altering the flow characteristics.
Figure 3 presents the rigid hemisphere diagram with a sectional view of the internal structure.
Figure 4 presents the rigid hemisphere model.
The flexible model is the counterpart to the rigid model, which can freely deform when subjected to an oncoming wind load. To achieve this deformation, a thin-walled hemisphere was created with flexible material. The material used was flexible polyurethane (PU) resin with a shore hardness of A-25. This was selected due to the ease of material acquisition, the simplicity of manufacture, and the replicability of the model creation process. For the testing, the material ideally is not desired to completely deform under the test conditions; however, some minor level of deformation is expected and required to observe the FSI. For this work, the model deformation was not controlled; a controlled variant will be presented in future publications. The two main factors that control the amount of structural deformation of the hemisphere are the shell thickness and the shell material hardness. For this experiment, both are fixed. A shell thickness of D was selected; this is fixed at half the thickness of the rigid shell, as matching the thickness causes little to no observable deformation. Through the process of developing the model, D was selected as a suitable middle ground between the immediate collapse of the structure under wind load and the aforementioned quasi-rigid behaviour of a thicker shell.
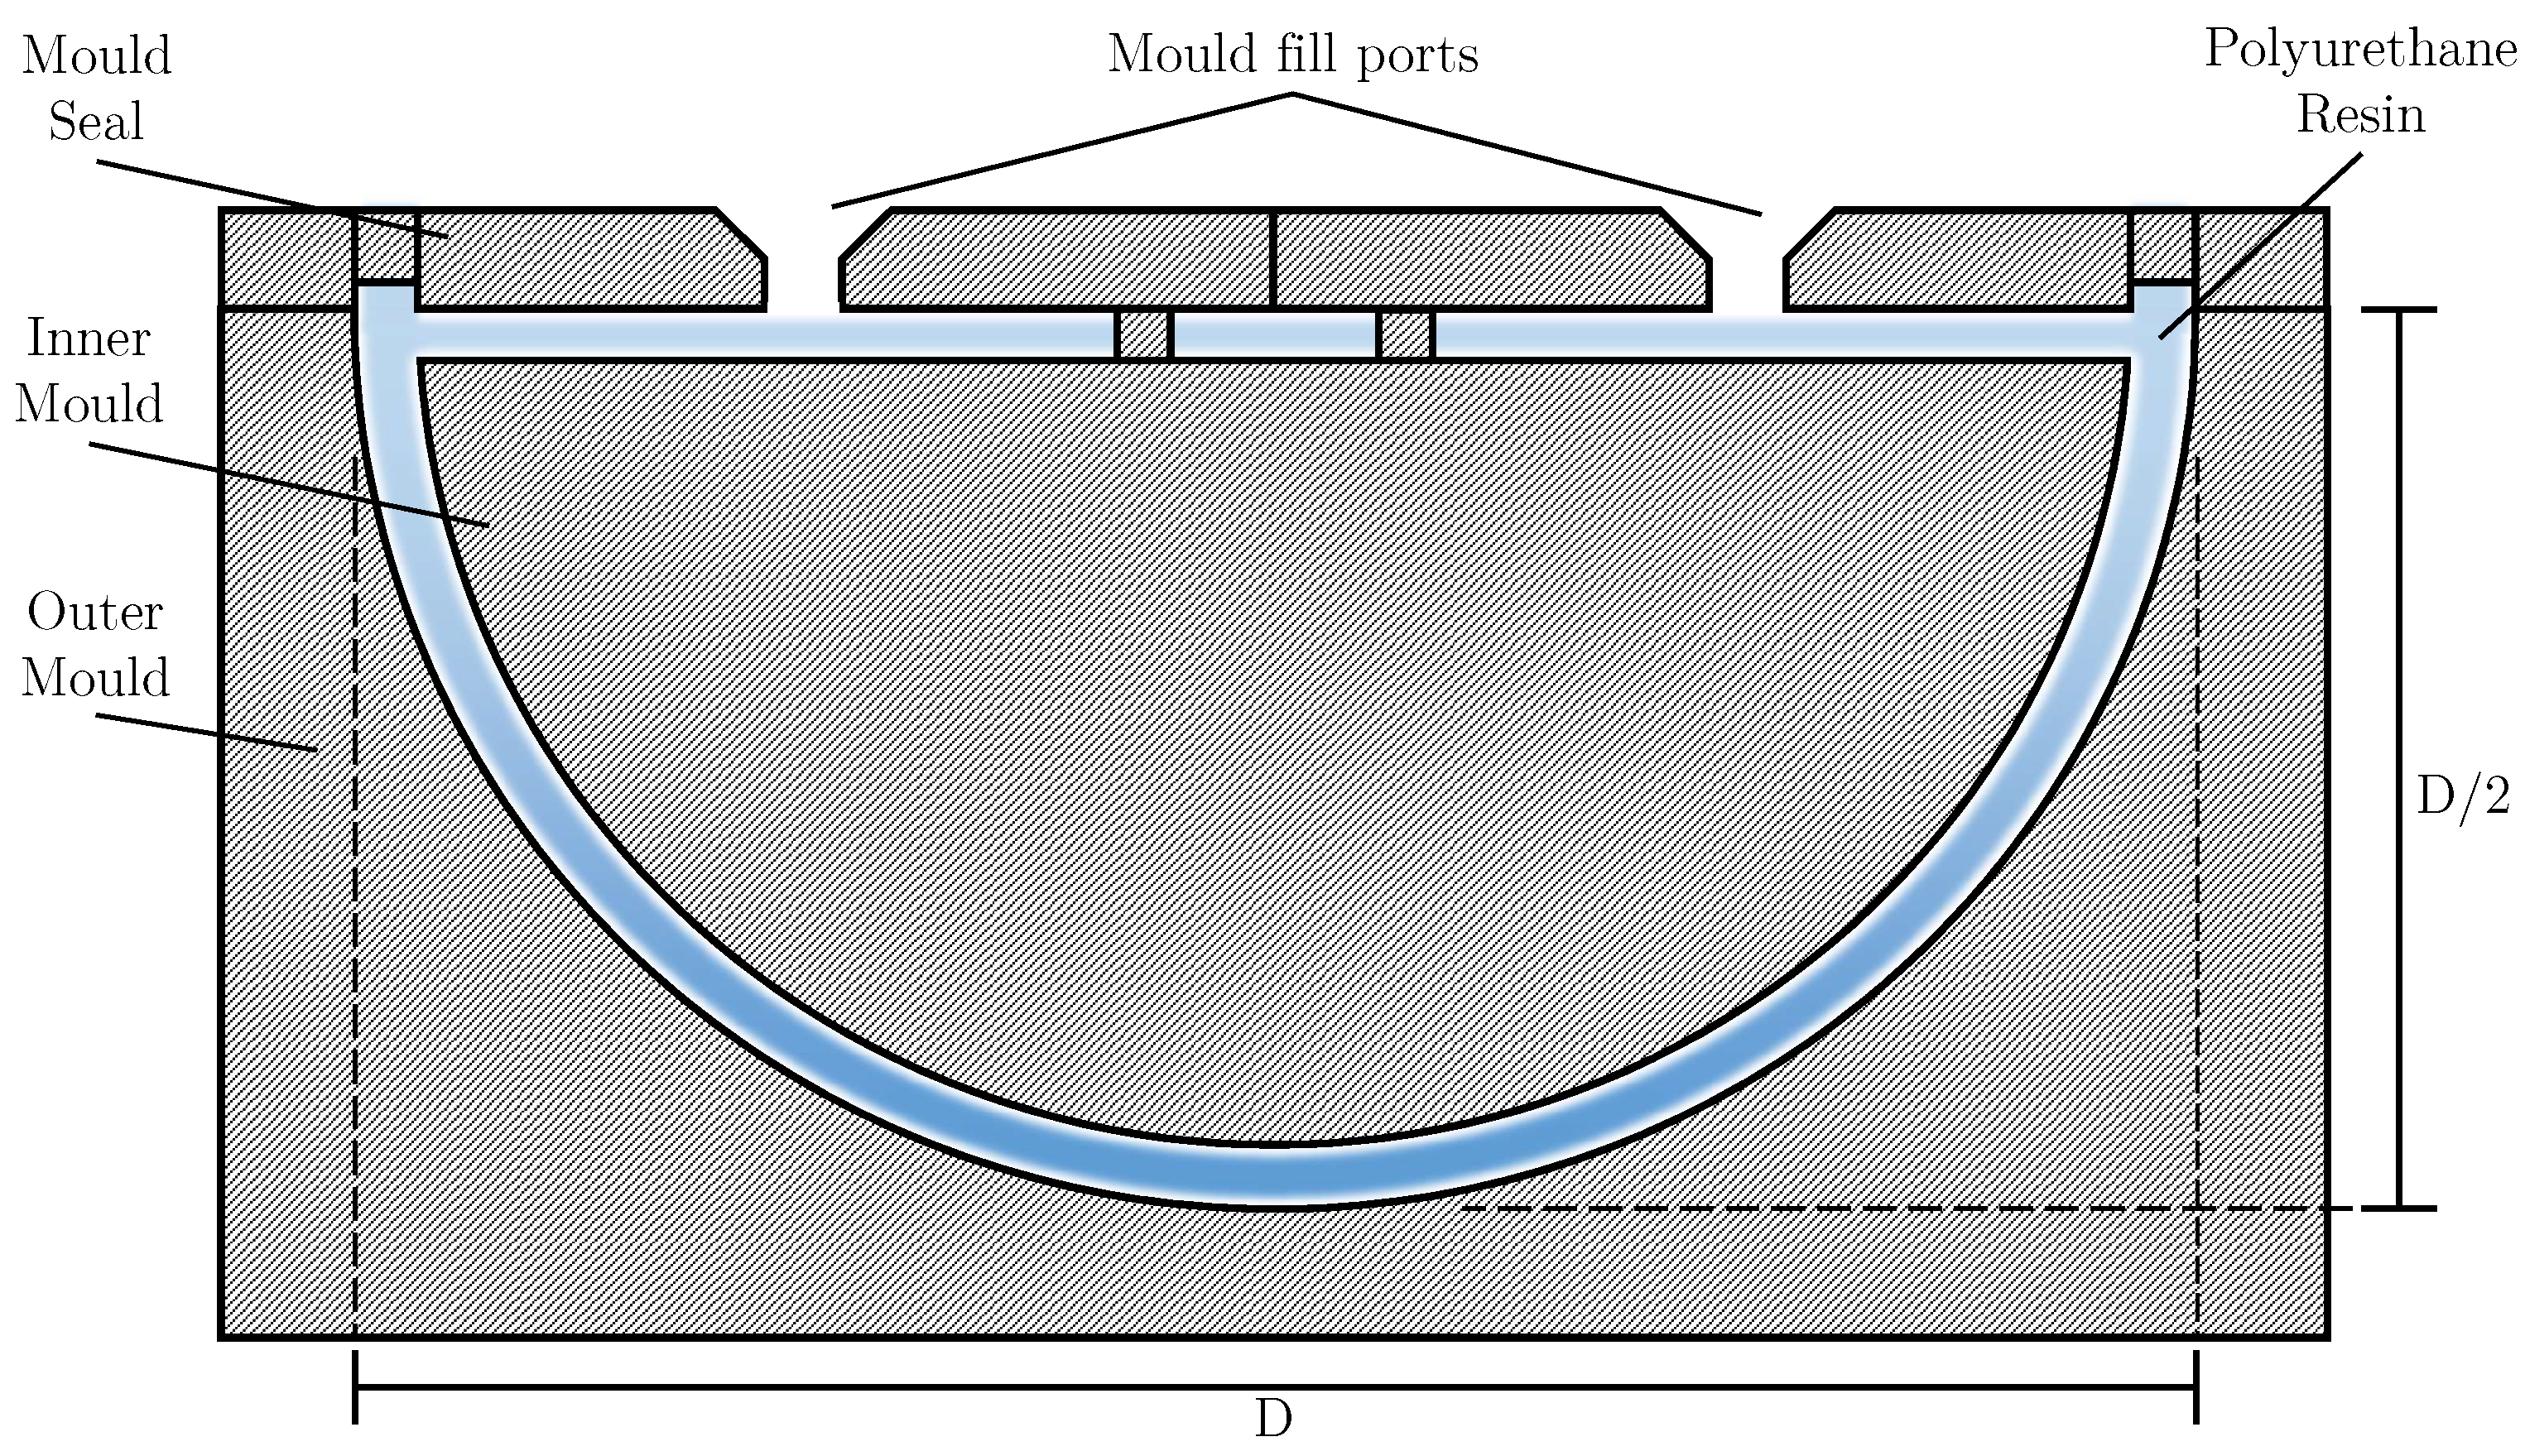
To create the flexible model, a negative mould was created with 3 distinct sections: the outer shell, the inner shell, and the mould seal. The outer shell is a fixed structure, 3D printed, utilising the same techniques as the rigid model. This component is 3D printed using PLA, and the interior is sanded using P400 sandpaper to remove minor surface imperfections from the printing process, as with the rigid model. The outer shell is a rectangular box with a hemisphere indent positioned at the top. The base diameter of the indent is 1D to maintain exterior dimensionality with the rigid model. The depth of the indent is
D. This structure provides the shape and size of the exterior surface of the resin mixture. The second segment is the inner mould structure. This structure is again 3D printed with poly-lactic acid (PLA) and sanded. The inner mould section dictates the thickness of the wall itself. For the creation of the A-25 model, the inner mould diameter was set as
D. The base of the interior section is also made
D shorter than the total height of the model to allow a small edge to be created on the base of the flexible model to allow for the mounting mechanism to be housed and attached without disturbing the exterior shell.
Figure 5 shows the general diagram of a negative mould. The shaded regions represent the void in which the PU resin is poured and cured to allow for solidification. The inner mould and the mould seal are attached using 4 bolts, with the joined parts being further bolted to the outer shell, ready for the PU resin to be poured into the cavity. The cavity interior was also coated with a layer of spray-on mould release to aid in removal and cleaned off the surface after manufacture. The resin was allowed to cure at room temperature for 24 h before release from the mould.
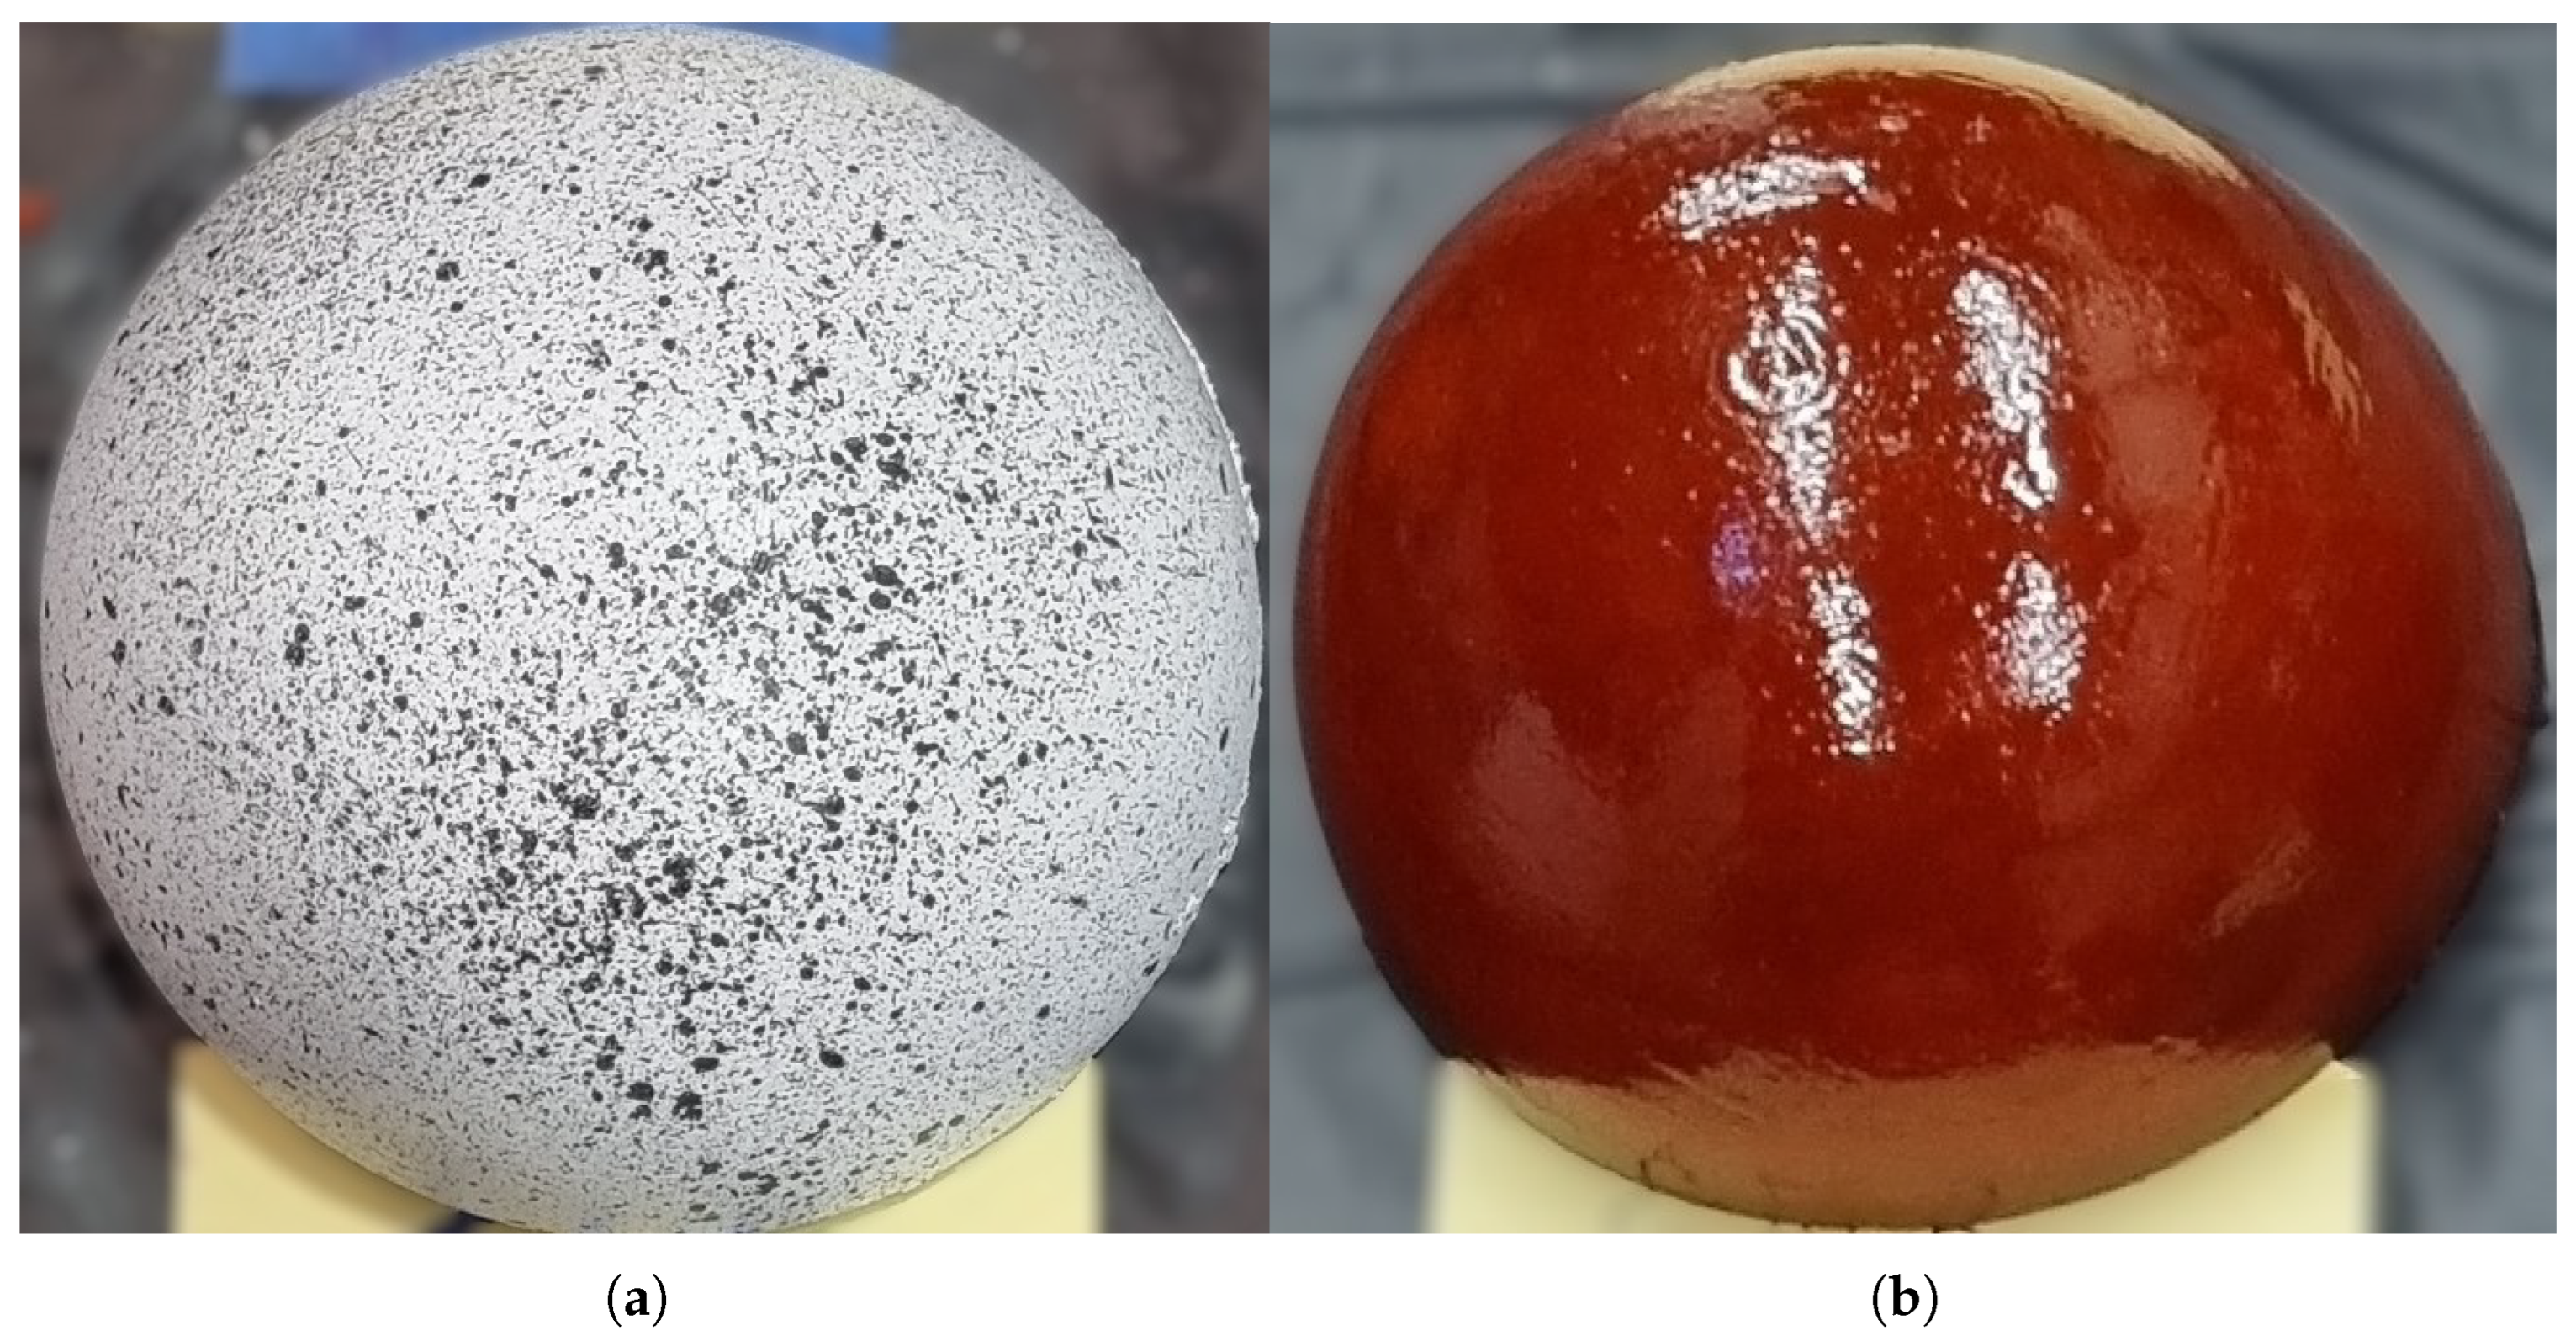
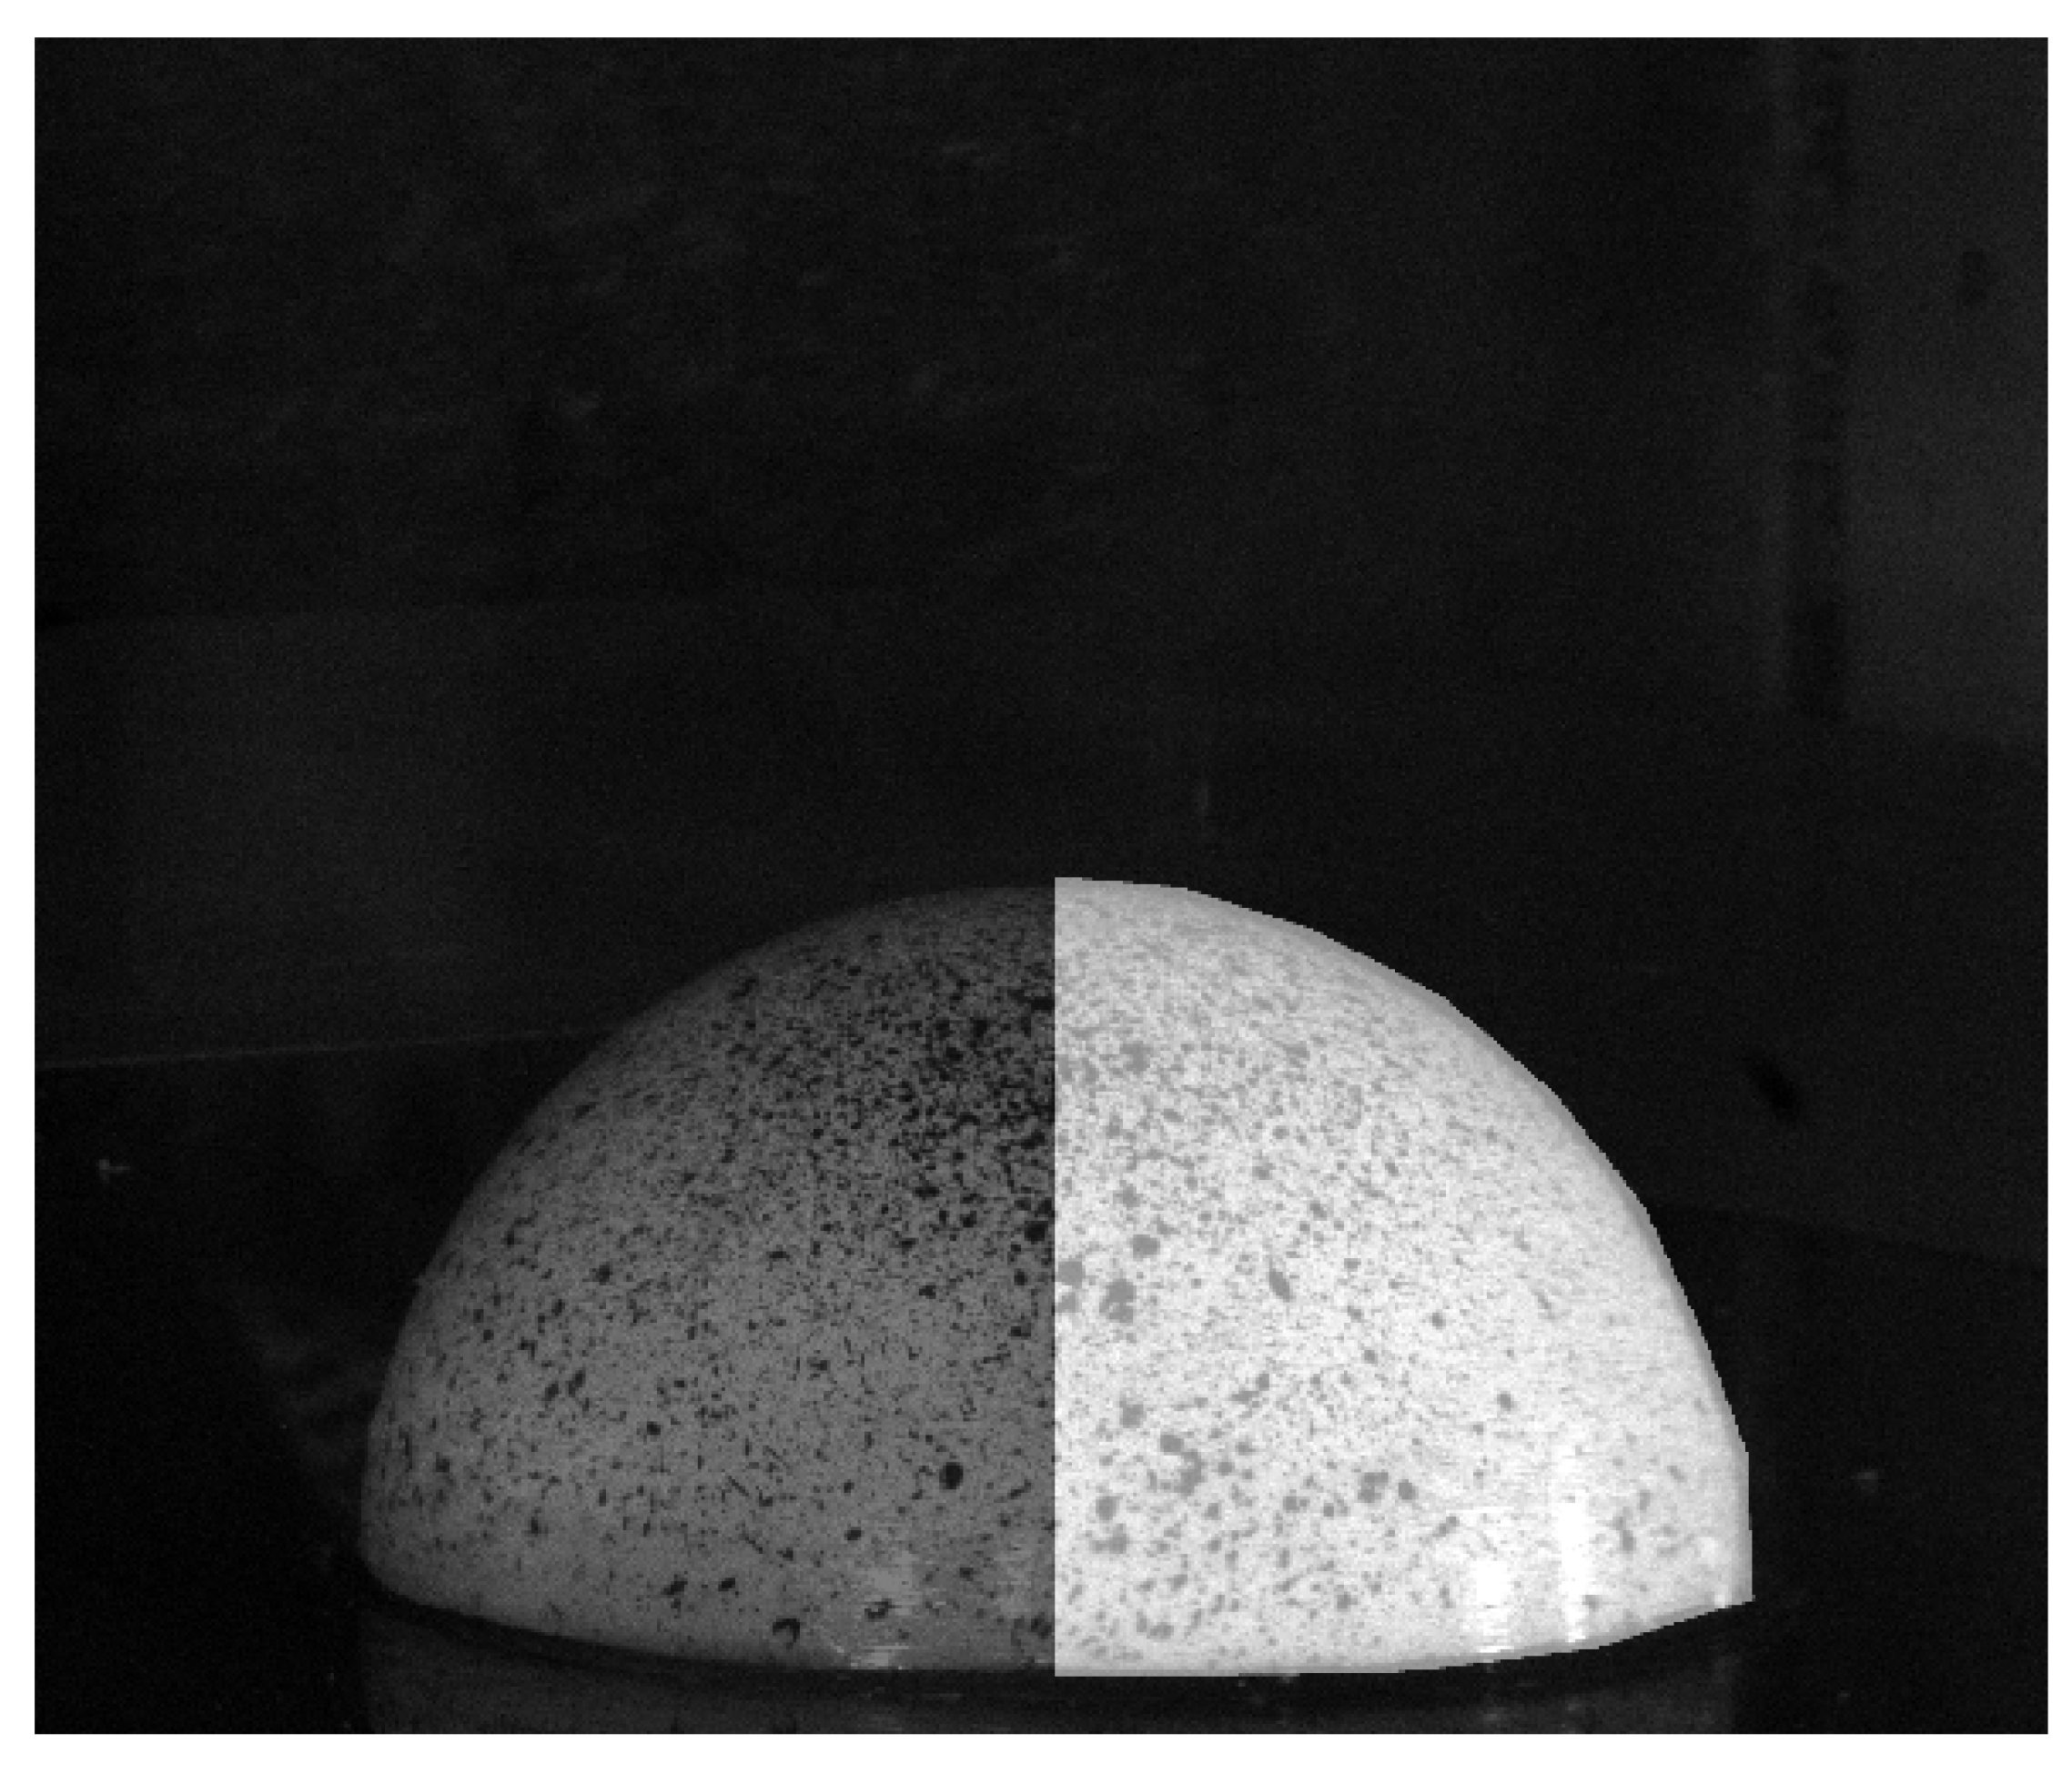
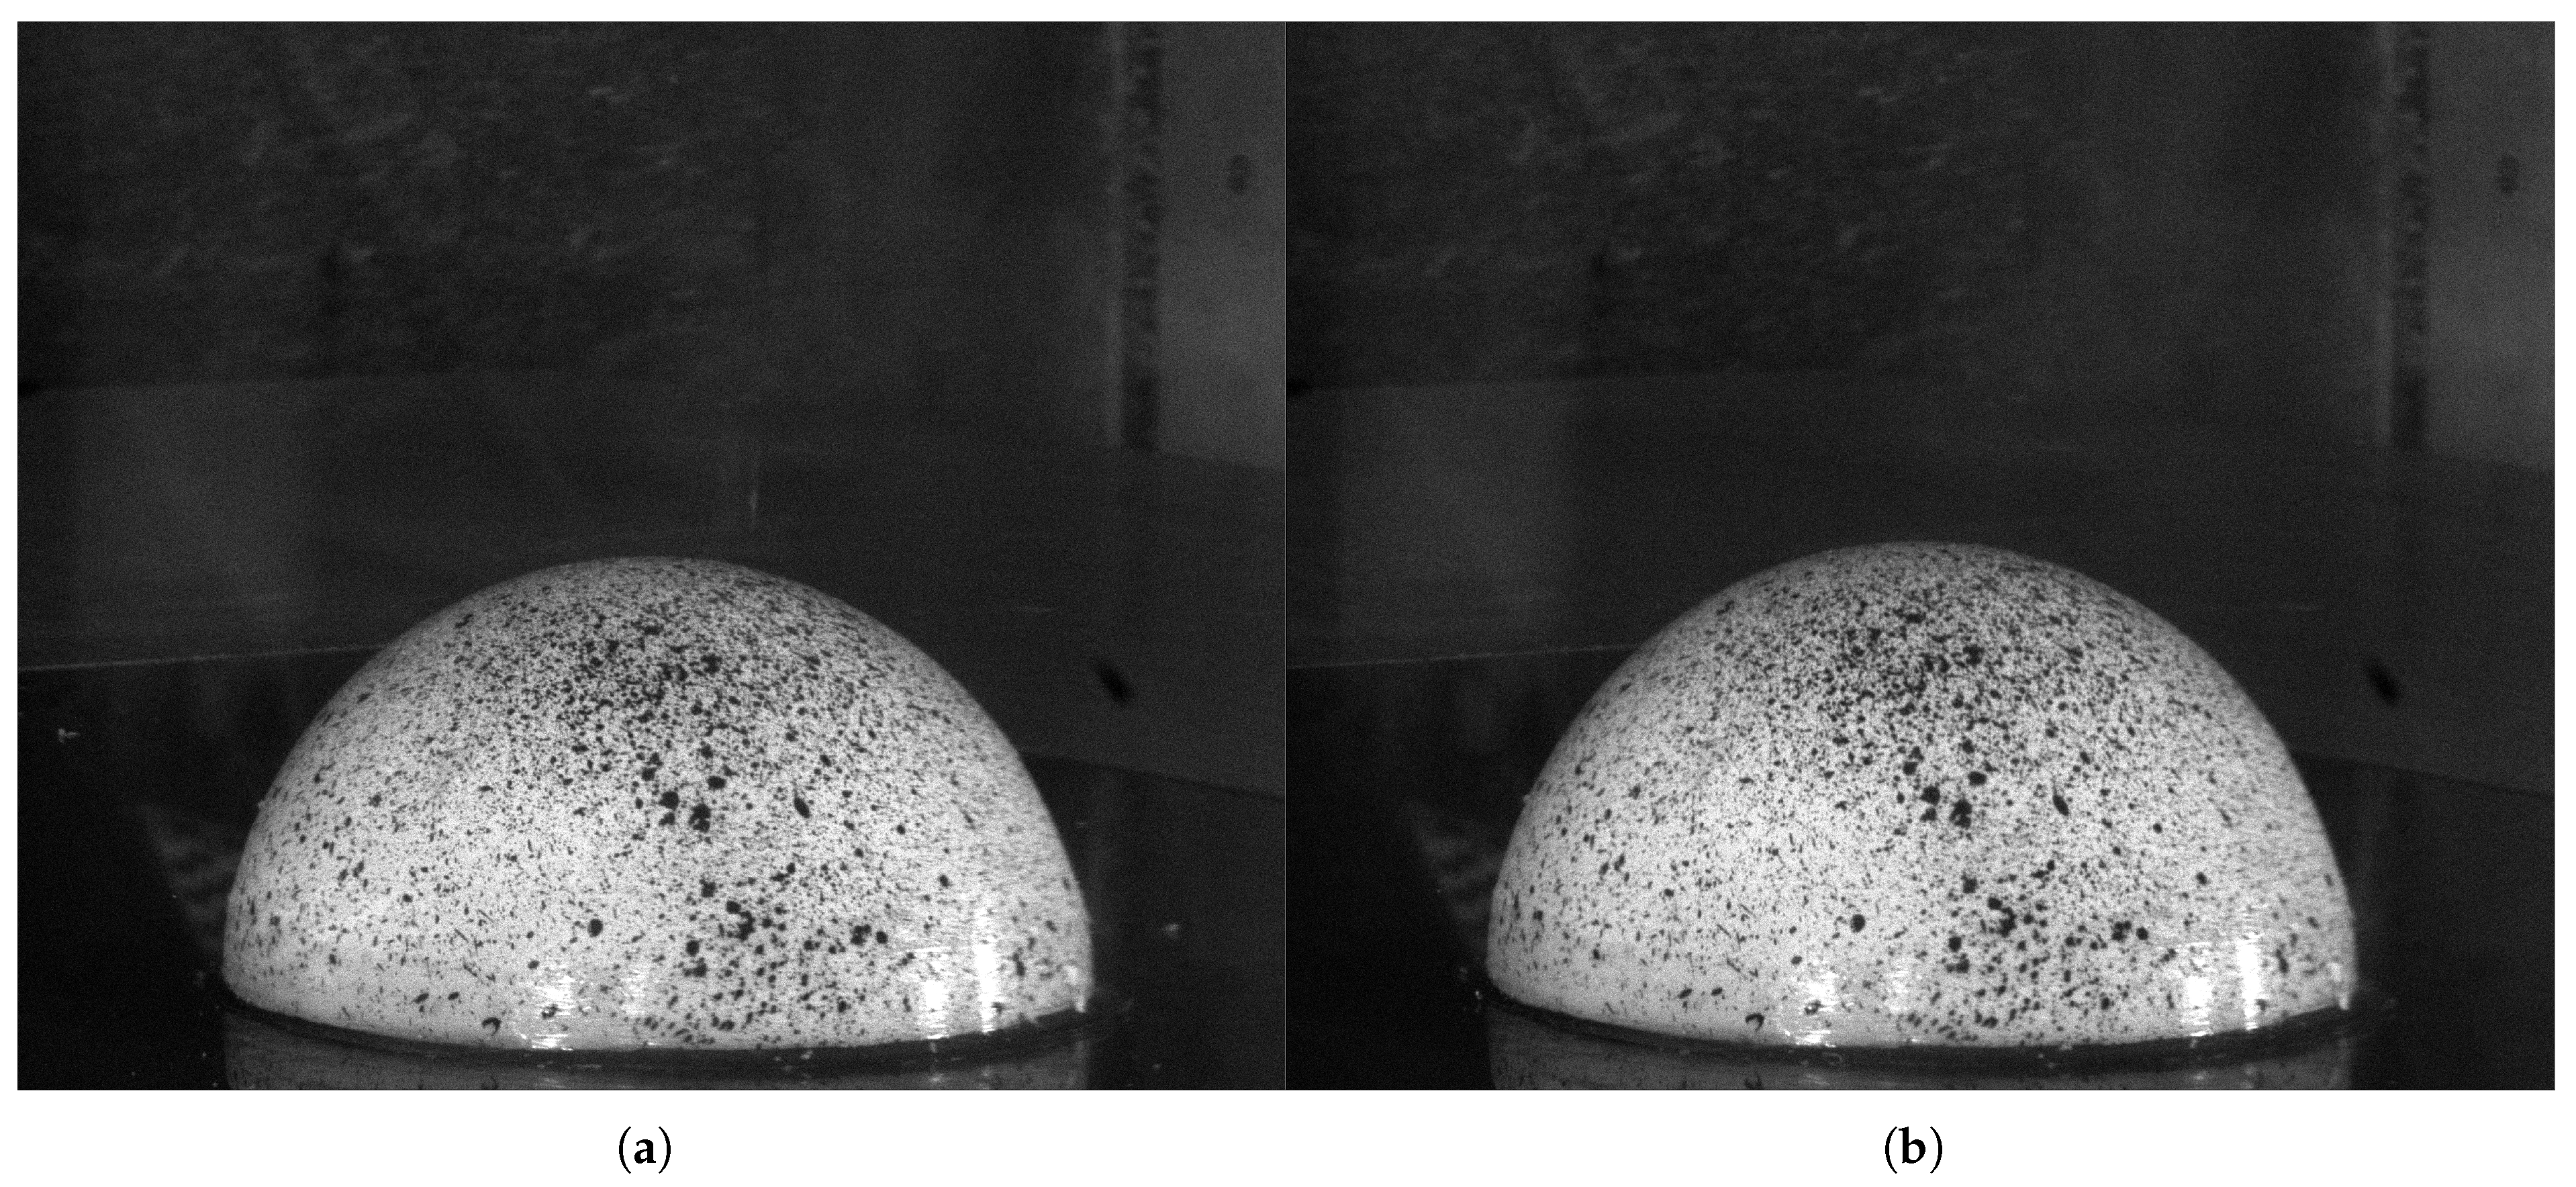
For each experiment conducted, the models require minor surface alterations to enable data acquisition. For the SPIV setup, due to the reflectivity of the surface materials, all models are coated in a rhodamine mixture to mitigate surface reflections, as previously demonstrated by [
17]. This mixture, coupled with a filter lens, allows for the minimisation of reflections into the camera field of view (FOV), enabling higher clarity in the final SPIV images. For the DIC implementation, however, the surface of the A-25 model must have high contrast. Note that the rigid model was not tested with DIC due to the absence of any surface deformation. Due to the spherical shape of the models, it was deemed infeasible to cover the structure with a surface film to provide contrast. Thus, the rhodamine mixture was removed post SPIV data acquisition, and the A-25 model was re-coated in a thin layer of white acrylic paint. To maintain an even surface, this was performed in multiple thin layers until the surface was covered in a consistent layer of white paint. Then, a random black speckle pattern was sprayed across the surface of the structure using acrylic black paint to generate the tracking points utilised for DIC tracking of the surface. For the creation of the speckle pattern, recommended good practices were utilised as described by both [
18,
19]. However, there are levels of variance in the speckle pattern due to inconsistencies in the spraying process in different regions of the model.
Figure 6 shows both the A-25 model coated with rhodamine and with the surface pattern for the DIC analysis.
2.2. SPIV Experimental Setup and Method
During the testing procedure, the SPIV experiment was conducted initially. A Litron Bernoulli B-PIV 200-15 laser was utilised, with a 15 Hz repetition rate and a wavelength of 523 nm. For data acquisition, the cameras utilised were two LaVision CX-5 cameras, with a resolution of 2440 × 2040 pixels. The cameras are coupled with 30 mm lenses and 523 ± 10 nm filters. The seeding particles used were vaporised Di-ethylhexyl sebacate particles. All image acquisition was conducted using a DaVis system. The major structural deformation, determined observationally from initial pretesting, was along the centreline of the hemisphere structure. Thus, for this testing, a centreline slice within the flow field of the wind tunnel was observed. The pixel resolution for the setup tested was 7.56 pixels/mm.
Figure 7 and
Figure 8 present diagrams of the test setup used for data acquisition. Image acquisition was completed using a phase-locked system, with an external trigger. This allows for the acquisition of 100 samples at a 5 Hz input pulse, offset with 20 subsamples of the overall 5 Hz pulse. In this paper, the results presented are mean and root mean square (RMS) flow parameters and the specific operational characteristics of the phase locked PIV and development will be presented in a subsequent paper.
2.3. DIC Experimental Setup and Method
As can be noted from
Figure 7, the camera positioning and the general test setup are specifically geared to the SPIV setup, allowing the capture of the surrounding flow region. For the DIC analysis, the primary facet of observation is the structure itself, thus necessitating a differing camera position and angle. For the DIC experiment, the same two LaVision CX-5 cameras are utilised; however, the position has been moved to provide an overlapping FOV across the leading edge (LE) of the hemisphere. To provide additional illumination to the FOV, two light box arrays with four 28W white halogen lamps with a colour temperature of 5000–5500 K were placed external to the wind tunnel. This was added in addition to the LED lights present within the wind tunnel.
Figure 9 illustrates a diagram showing the general test setup utilised for the DIC experiment. The FOV for each camera primarily cover the LE region, with the overlapping target area being the LE centreline.
2.4. Error Analysis
An error analysis was conducted for both the SPIV experiment and the DIC experiments. The calculation process is demonstrated for the SPIV calculation and has been used in the same manner for the DIC experiment error analysis.
Based on the work conducted by Westerweel [
20], a typical range of RMS error is observed as 0.05 to 0.1 pixels with a pixel displacement of 8 pixels. From the current SPIV analysis, the maximum expected pixel displacement per pulse, or image capture, is ≈8 pixels full-scale (FS), with the maximum pixel size for a particle in the range of 3–4 pixels. Therefore, the RMS error in
and
ranges between 0.05 and 0.1 pixels. The percentage error is then calculated for
, giving a percentage RMS error of
. This accounts for the in-plane error.
The out-of-plane error,
, is dependent on the stereo camera angle. Given the stereo arrangement, the half angle between the cameras is
. From Lawson and Wu [
21], the out-of-plane error can be calculated using an error ratio with the in-plane RMS error;
, where
. Therefore,
, indicating that the
is roughly double that of the in-plane error, giving
. This is for 1 sample. Hence, with
samples, given a 95% confidence interval, the overall percentage error can be calculated as
.
A similar approach was used for the DIC uncertainty quantification. For the DIC, the FS displacement observed was ≈10 pixels for the in-plane direction. Using a similar process to the SPIV and a new camera angle of , the 95% confidence interval for the worst case out-of-plane error percentage was calculated as .
4. Discussion
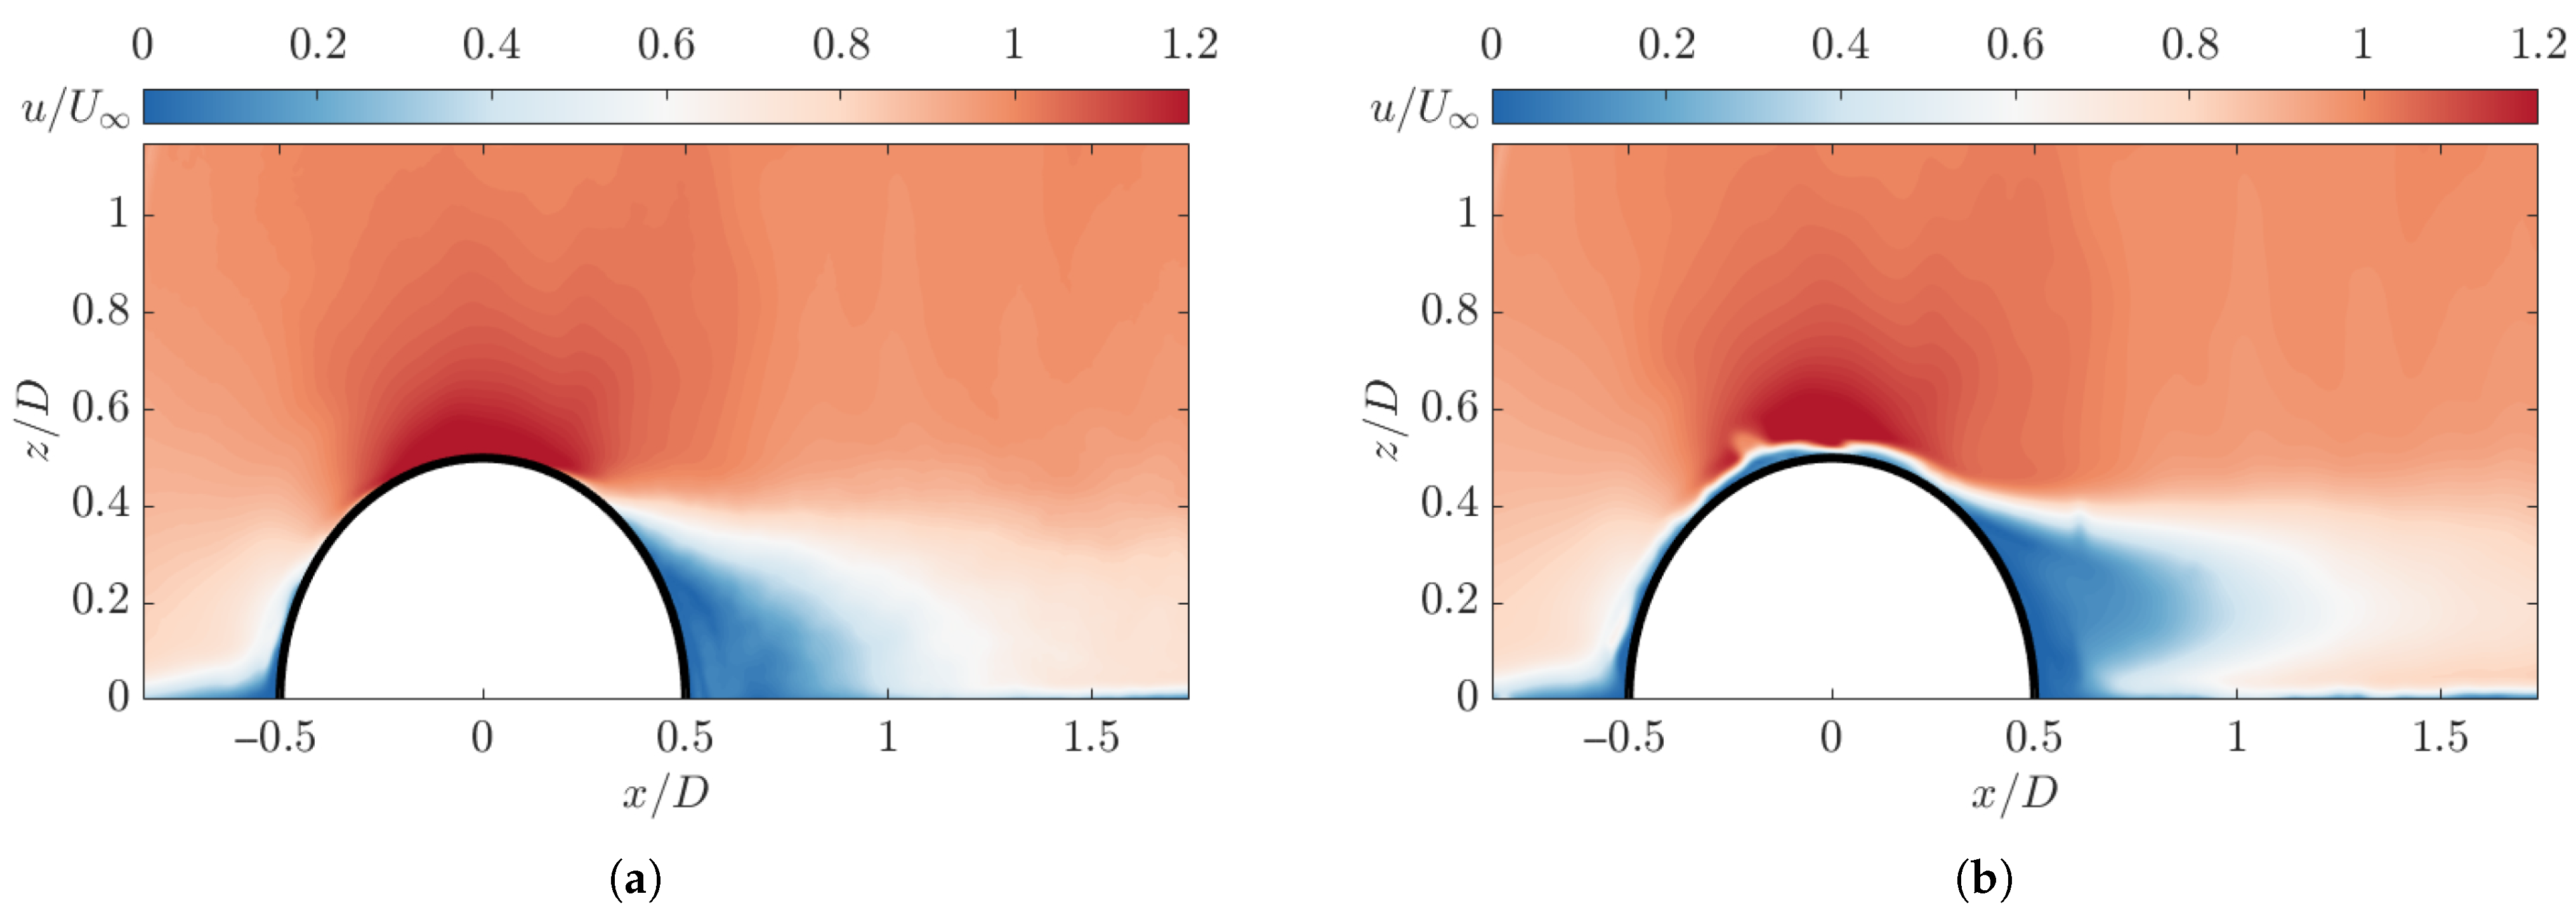
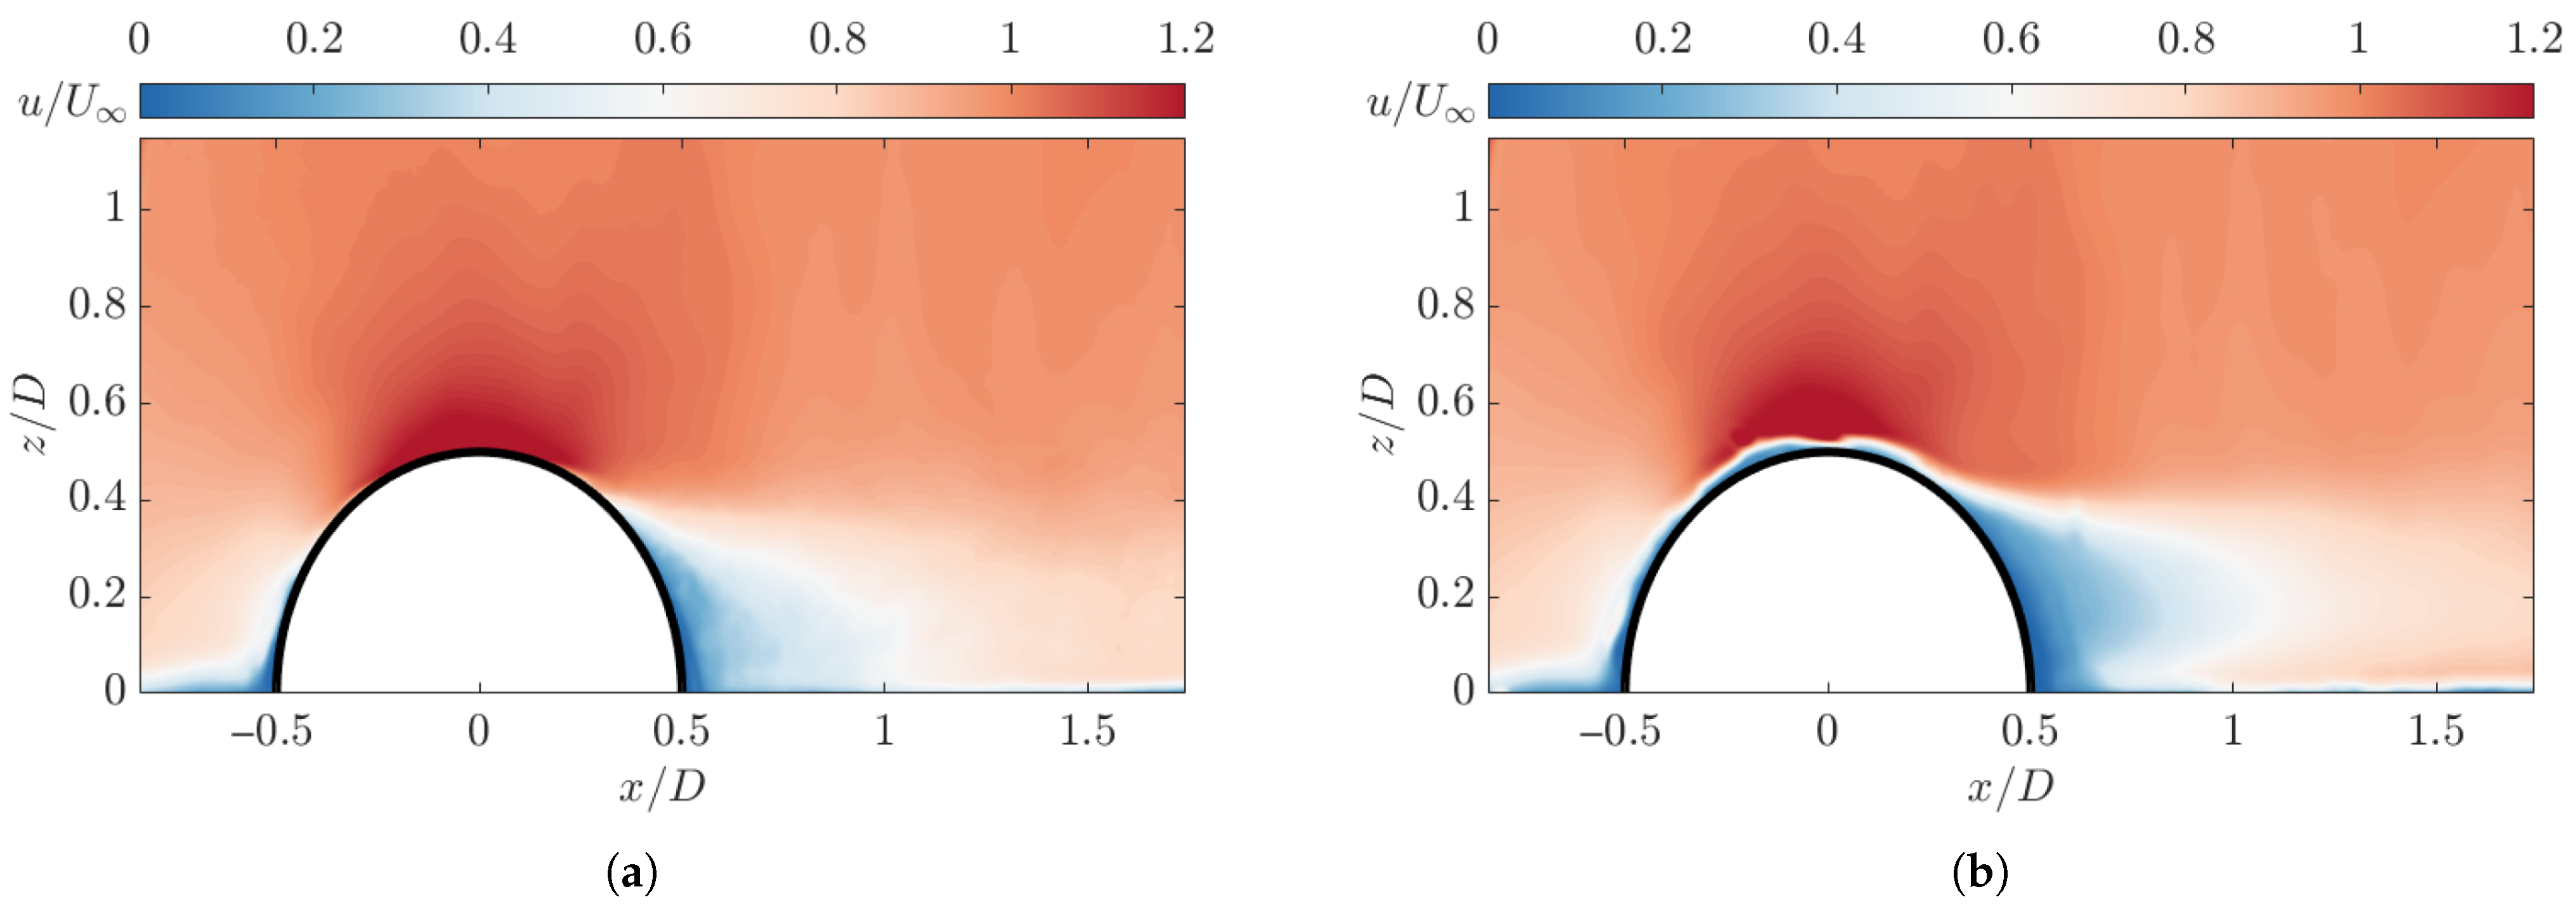
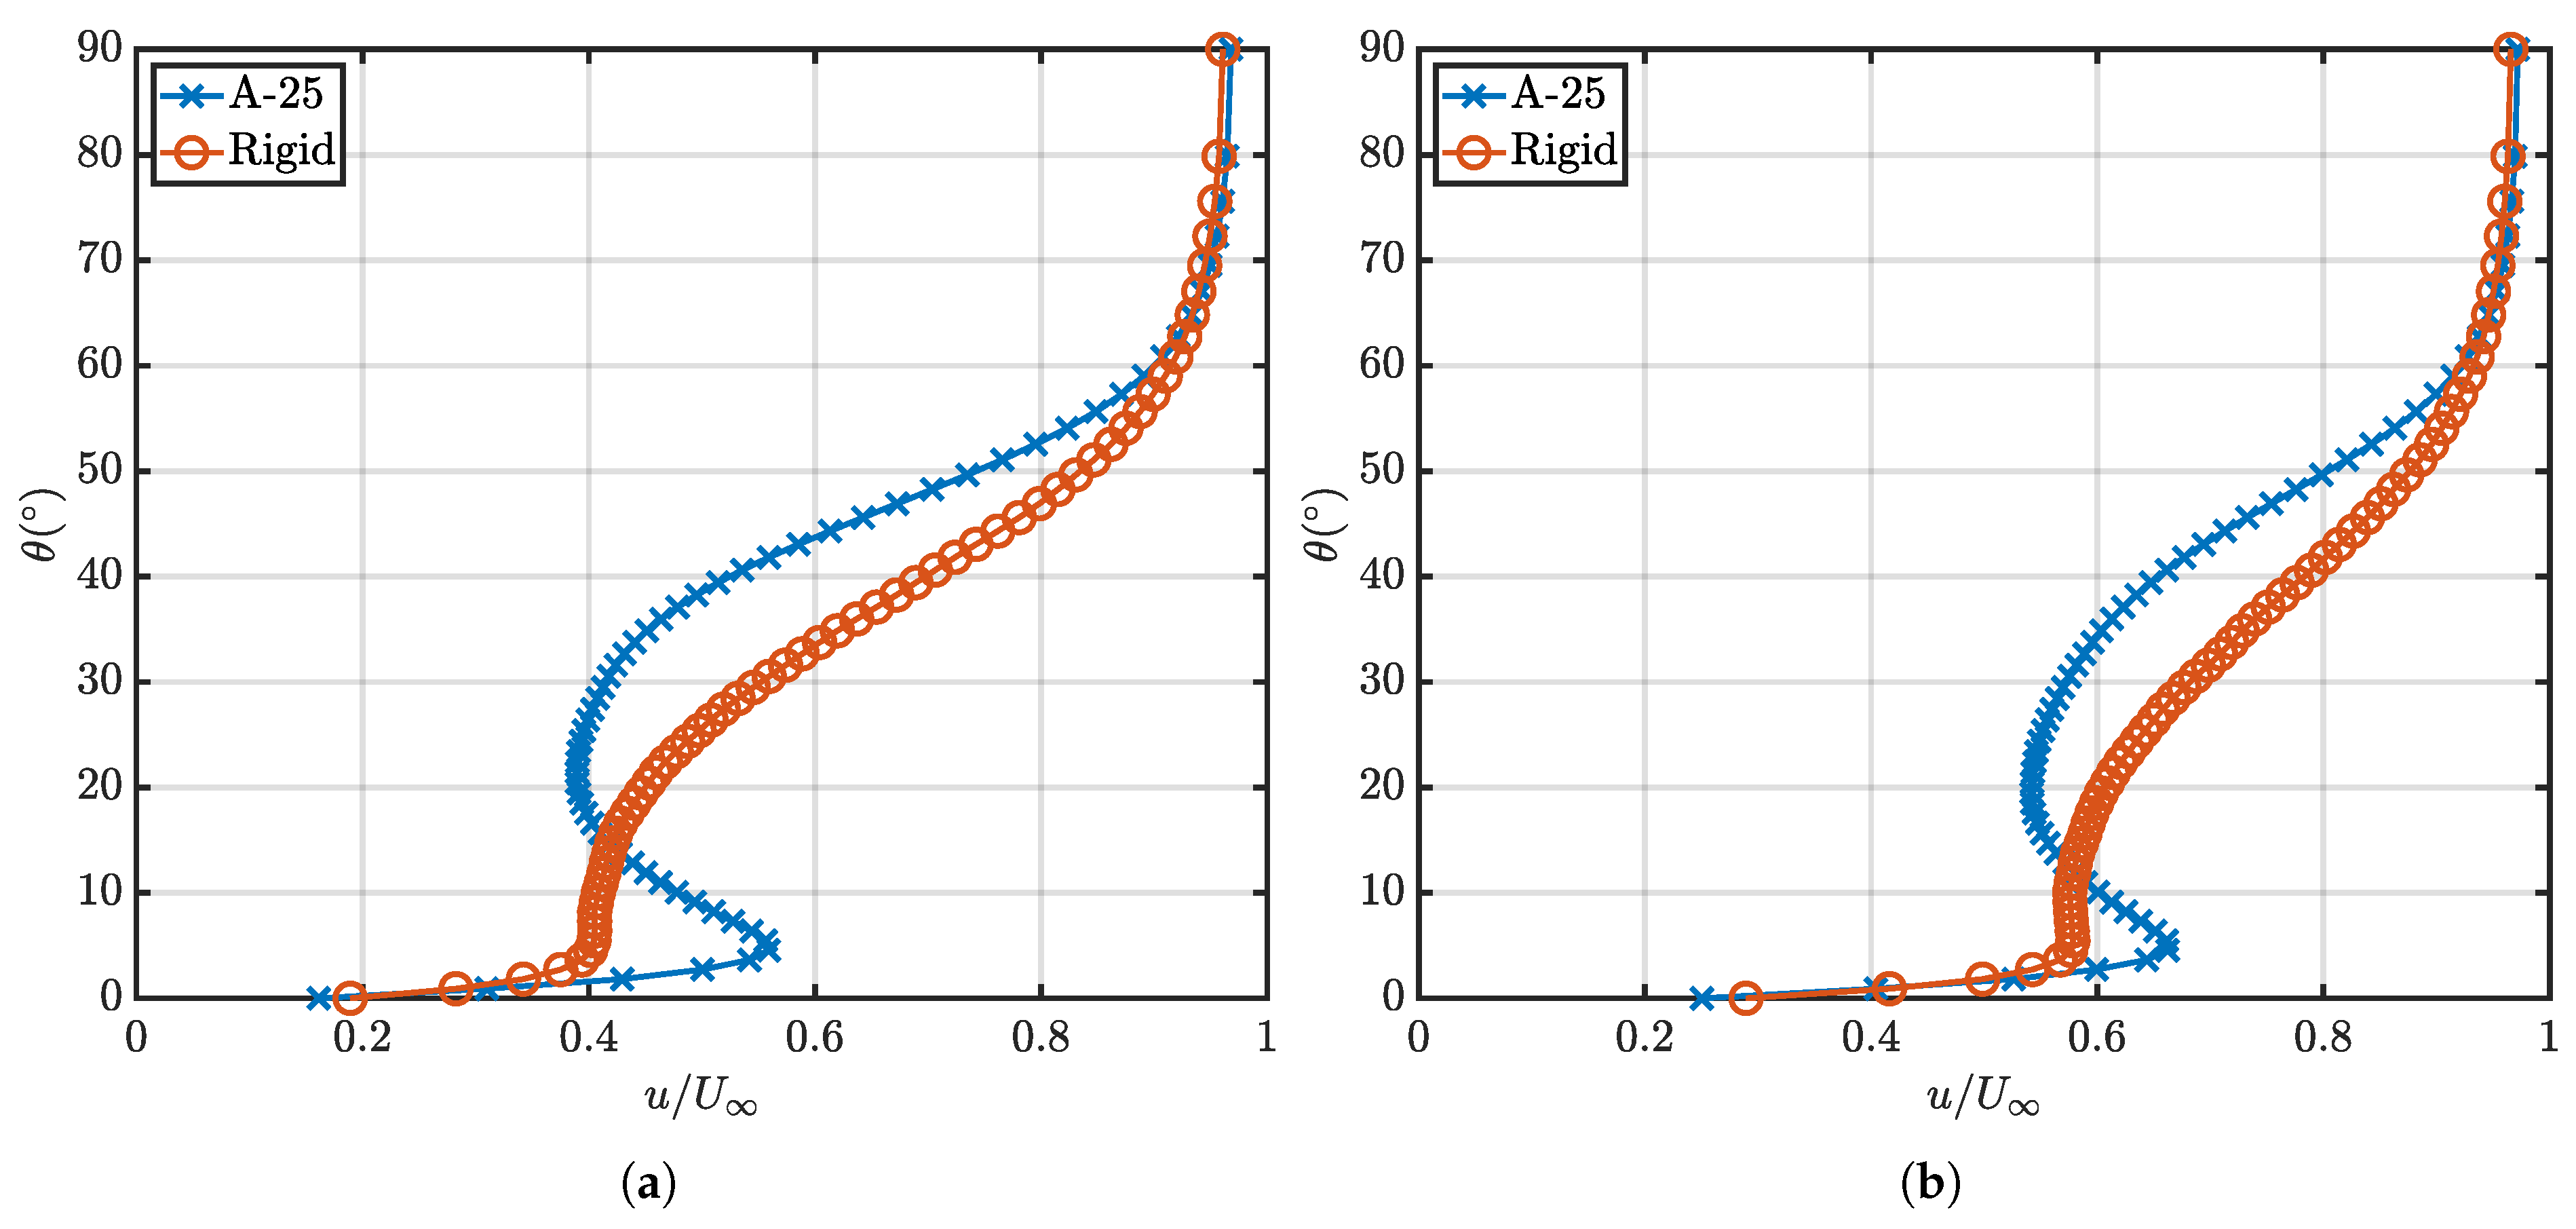
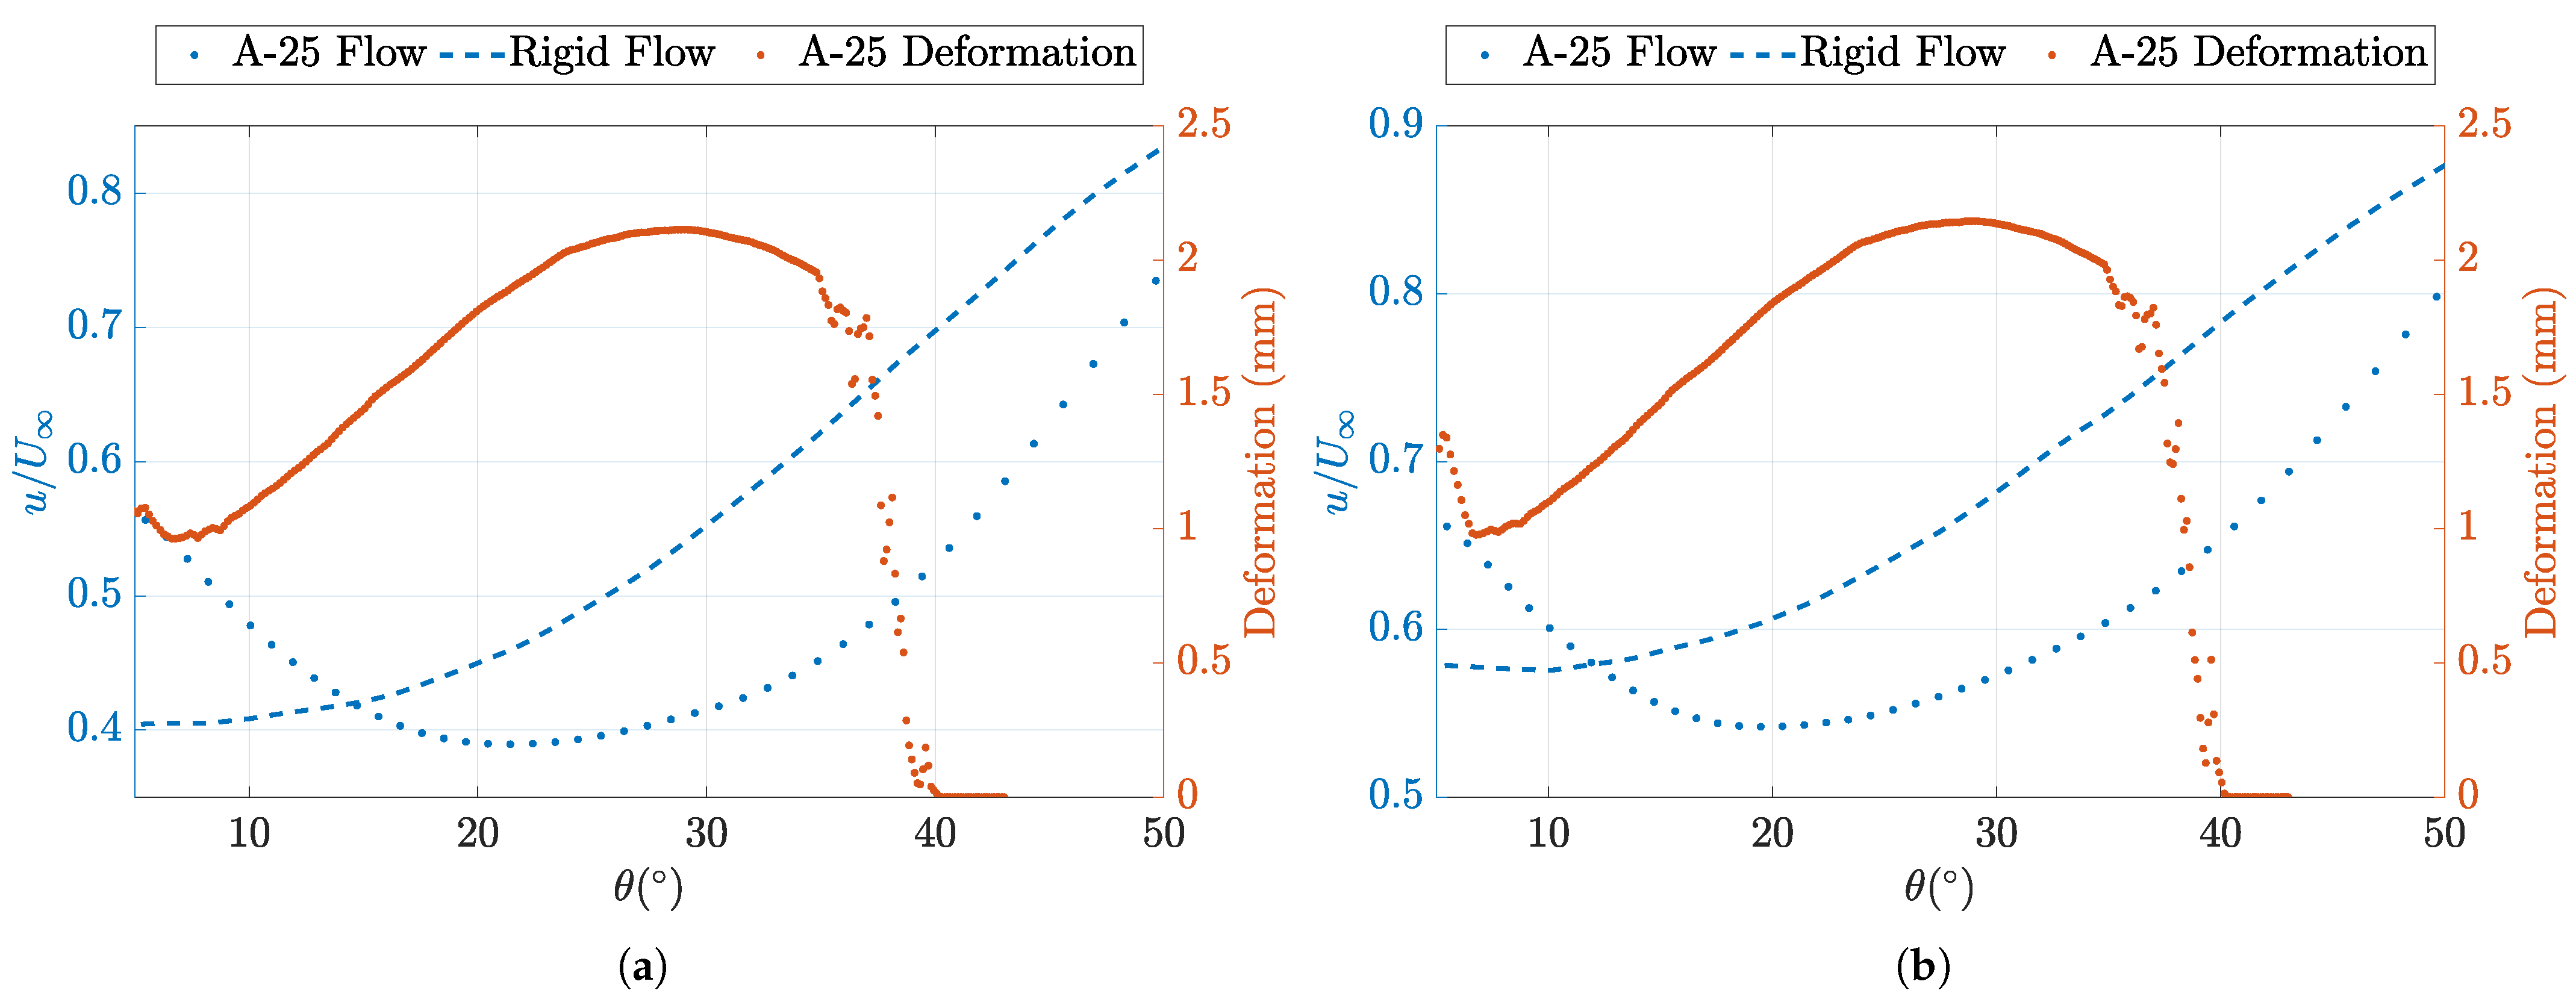
Figure 19 presents the collated data for the deformation and the flow behaviour in the wake region. As noted previously, the deformation of the LE region of the hemisphere shows correlation with the downstream wake velocities, indicating a direct link between the deformation and wake behaviour. As
increases past
,
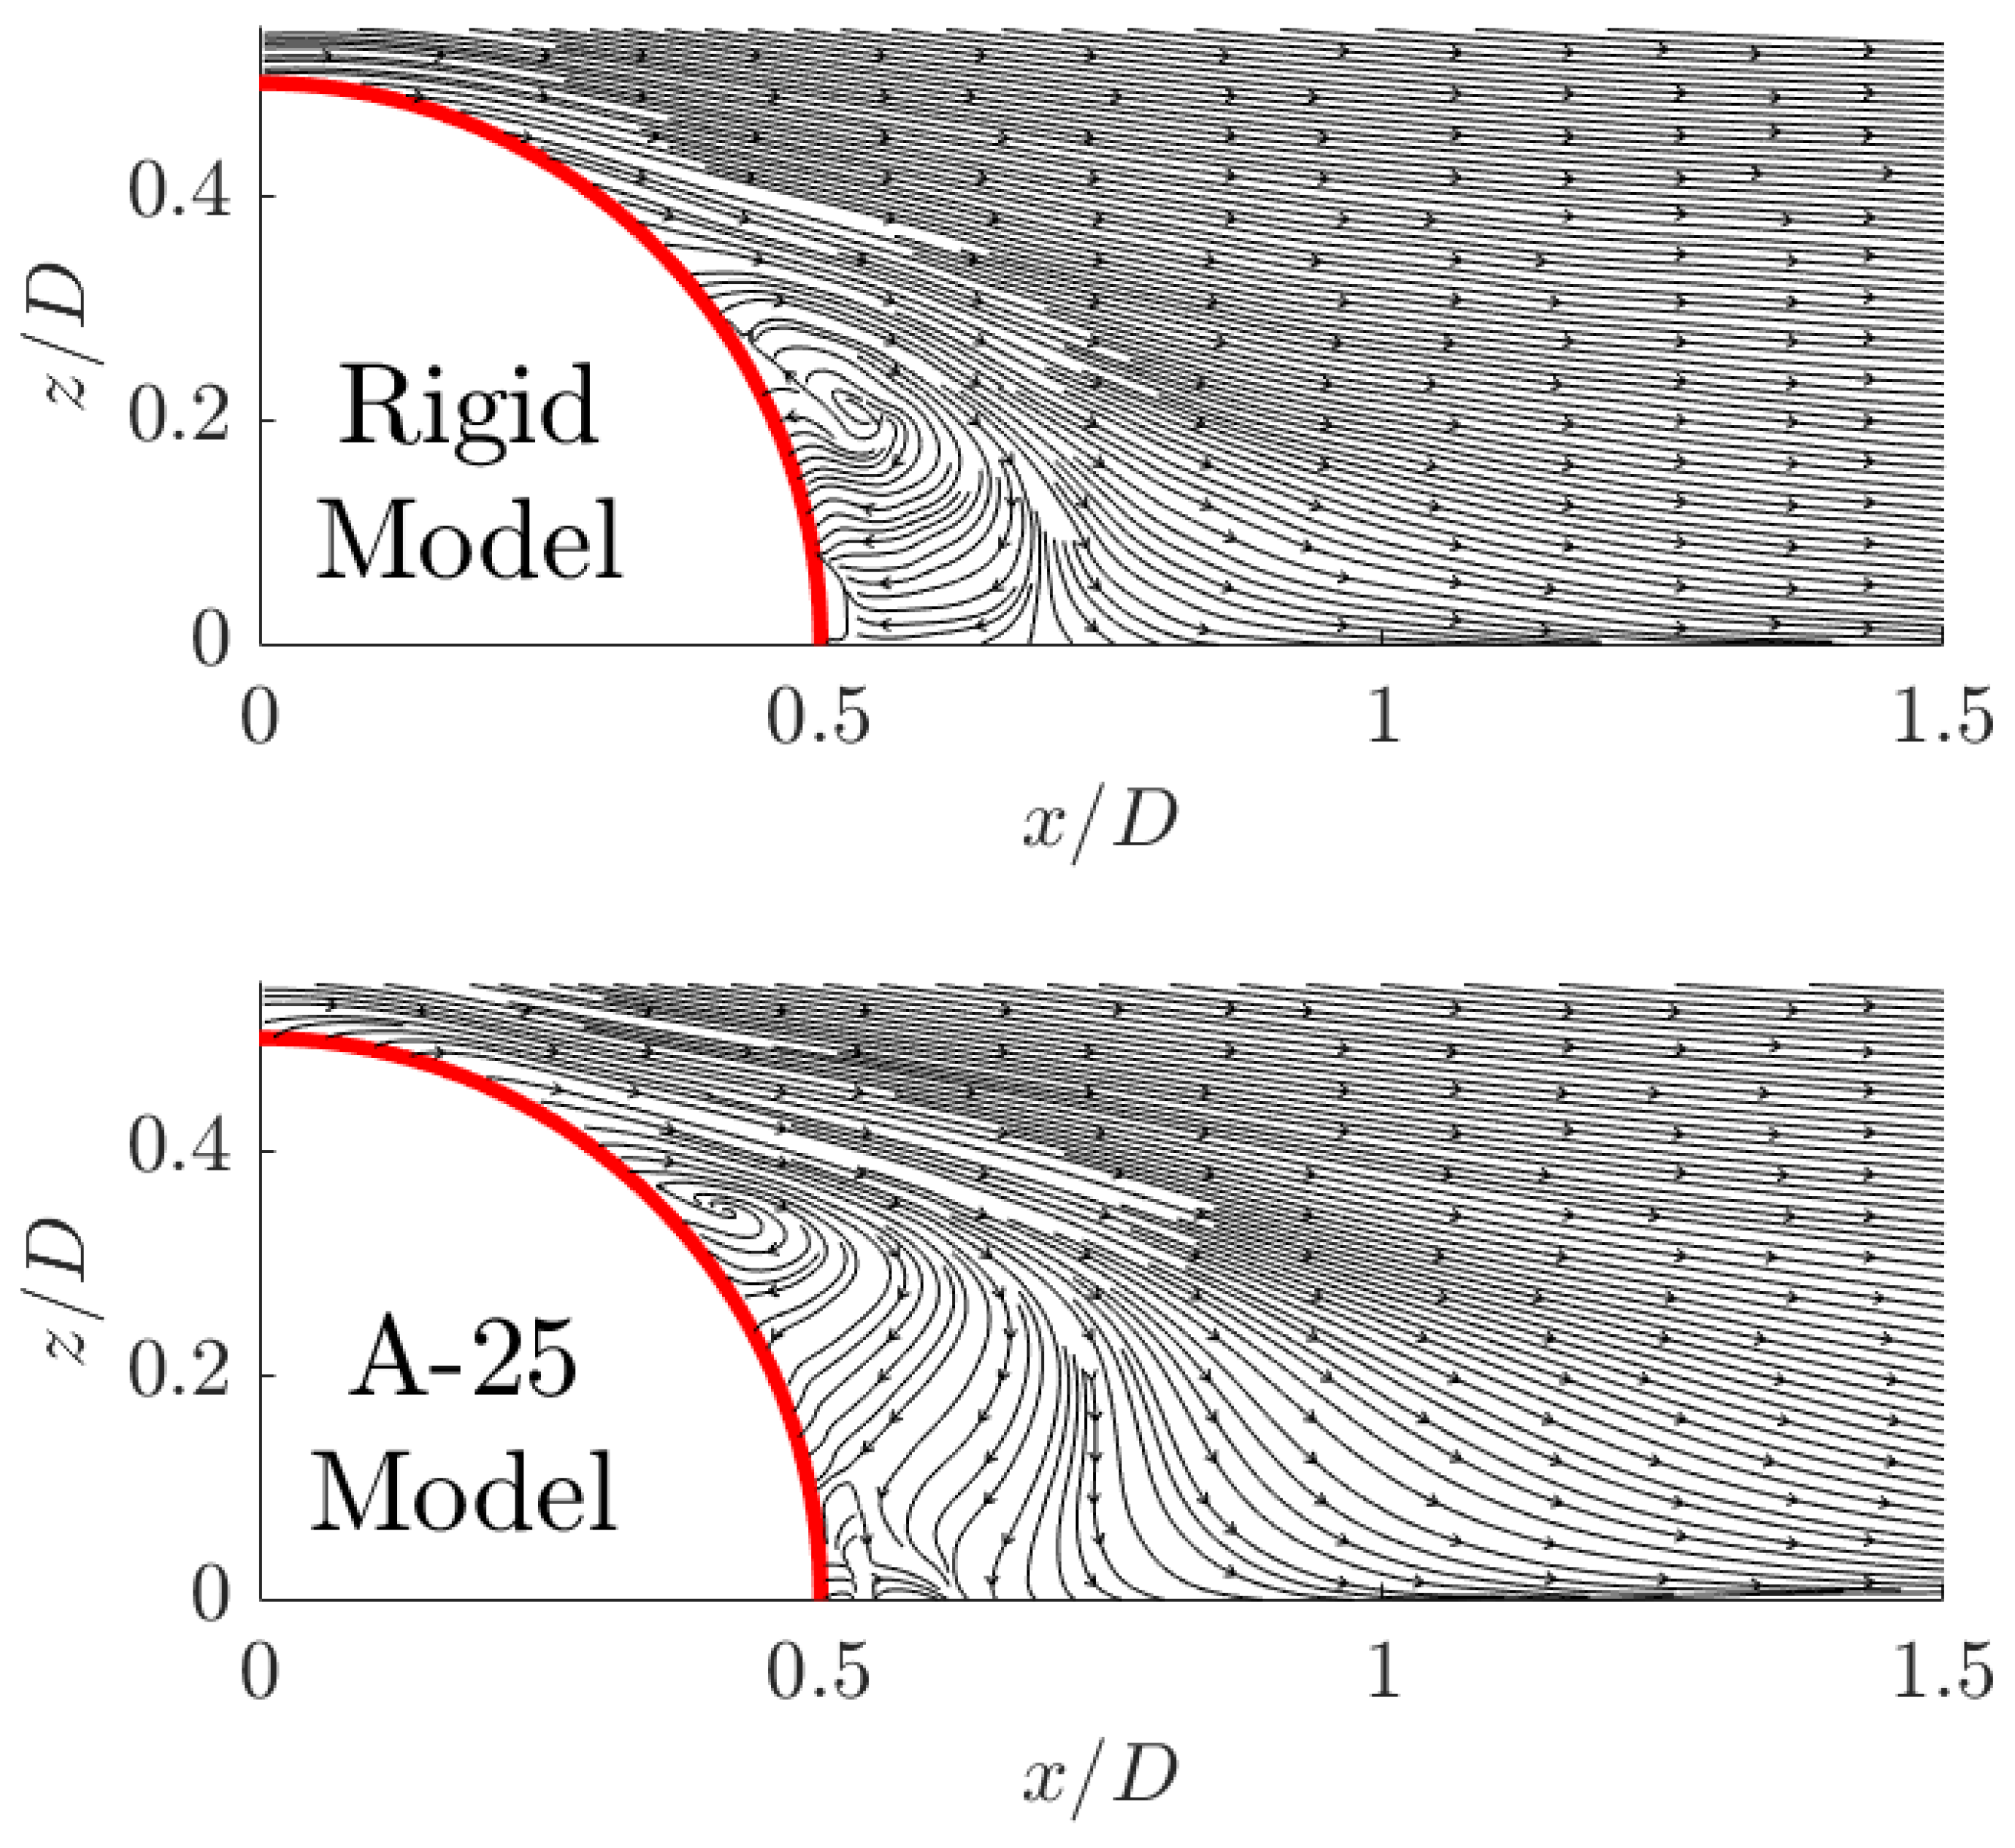
for the A-25 flexible model converges towards the rigid model behaviour. This occurs as it approaches the structure’s apex. Also of note is the shift of the recirculation core as highlighted in
Figure 12, which corresponds with
of
of the A-25 model.
A direct comparison cannot be made with the location of the vortex core and LE behaviour, as the correlation for DIC is not reliable past . Further sampling of DIC at larger values would require an enhanced DIC set-up and allow for the comparison of the flow structure formation directly due to deformation. It should also be noted that as the experimental datasets from this paper were not synchronised, temporal correlations are beyond the scope of this paper and will be the subject of a future paper.
Let us now consider the LE deflection and its relation to the downstream wake behaviour. Observing the recirculation region, and specifically the vortex core, [
9] provides a comparison point to visualise the trend with varying Reynolds numbers. Within the experiment by [
9], testing was completed at
to
with a silicon hemisphere model. Comparing the results presented in
Table 1, the rigid model follows the trend indicated by [
9]. Minor variation can be attributed to the sensitivity of the behaviour in the development of the BL, as described by [
1], where a rough BL causes the recirculation core to move upstream, compared to a thin or smooth BL.
Work by [
1] notes that the size of recirculating fluid and the volume of the recirculation region are directly associated with the BL thickness. The increase in BL turbulence thickens the shear layer, which in turn causes a greater shear layer curvature and reduces the size of the circulation region. In this experiment, the turbulence intensity, as shown in
Figure 2, is greater than that observed by [
9], which would indicate an upstream
shift of the vortex core observed within this paper as compared with [
9]. Also, due to the increase in the Reynolds number in this experiment, a delayed separation is observed due to the adverse pressure gradient as the flow accelerates over the apex of the hemisphere.
The trend shown by [
9] for the reattachment point continues with the behaviour presented within this paper. Slight variations within the results may originate from a difference in the turbulence of the incoming BL between [
9] and the tests within this paper, thus causing the continued reduction in the size of the recirculation region.
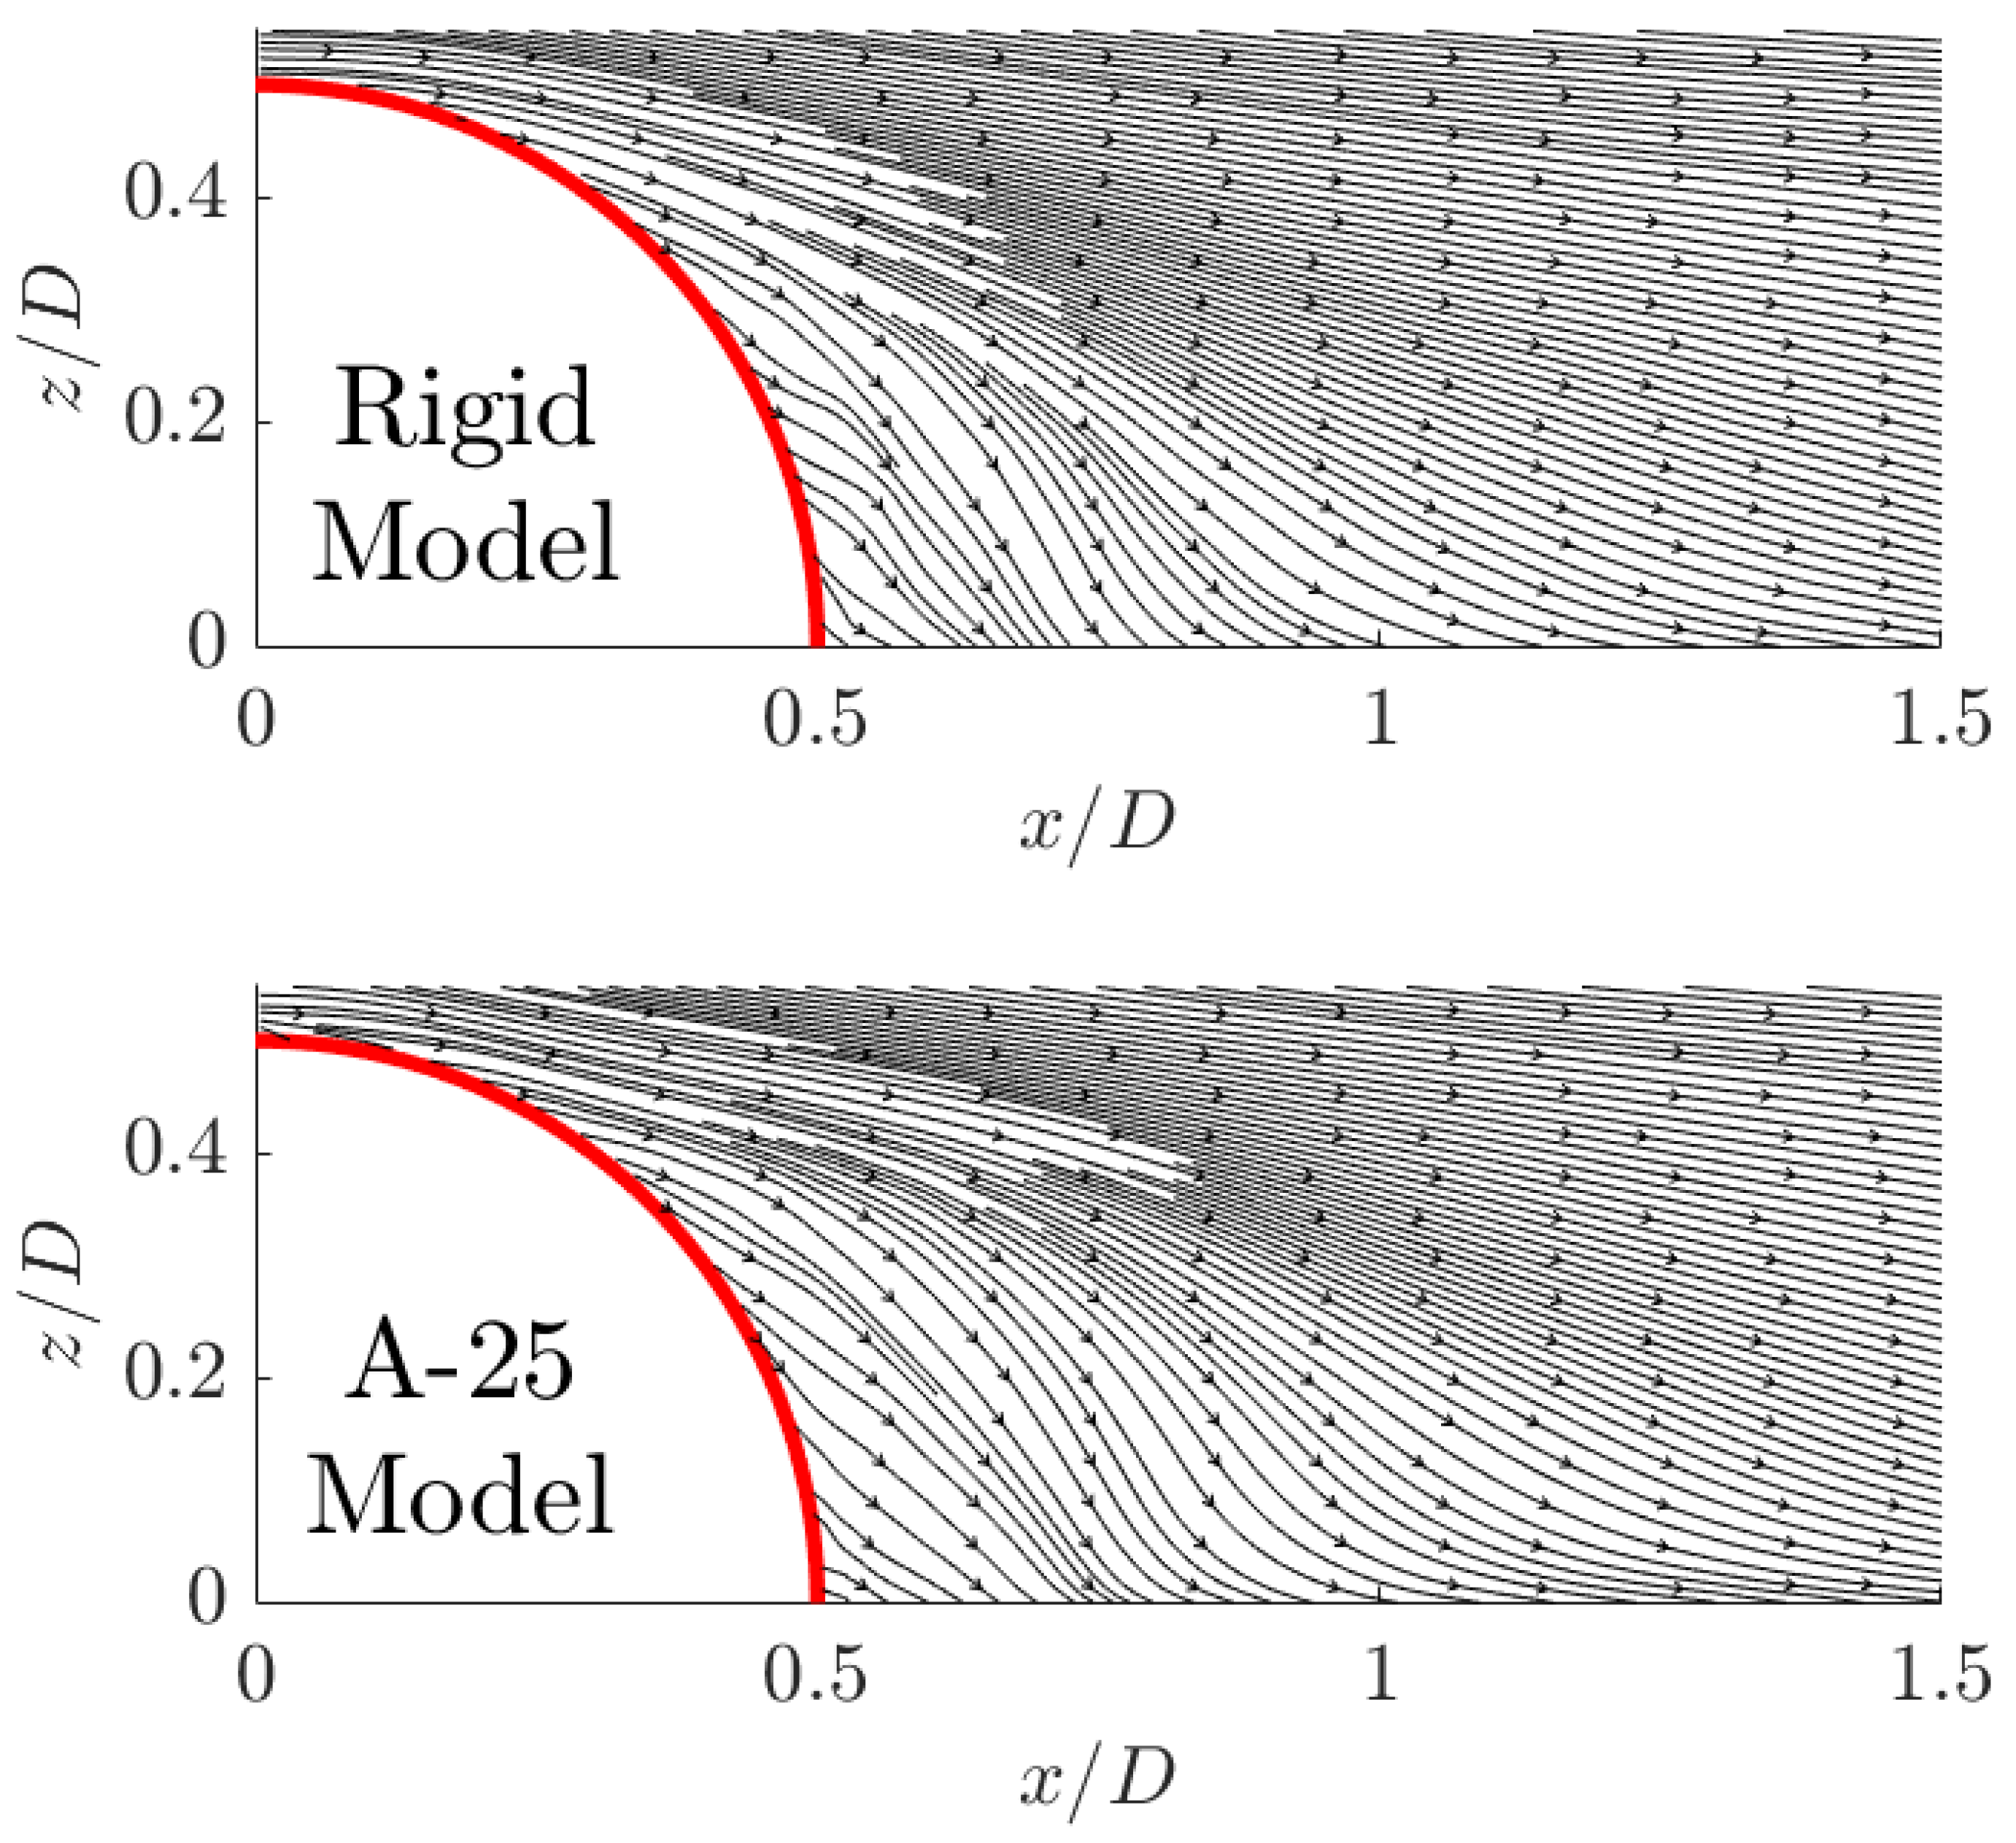
Figure 12 shows that the separation point is delayed from
0.28 to
0.33 for the A-25 model and the rigid model, respectively. This can be linked to the deformation of the structure, which has caused the separation point to move upstream. Wood et al. [
9] notes that for the flexible model, the dividing streamline travels further downstream before the reattachment point occurs compared with the rigid model. This behaviour can also be observed in the results obtained within this paper. The previously highlighted, parabolic-shaped, low-speed region in the wake is only present for the flexible model and is also visible in [
9]. This is indicative of some interaction of a vortex structure linked directly with the introduction of the flexible model. This indicates an interaction between the horseshoe vortex structure as described by [
22] and the hairpin vortices as shown by [
6] across the upper surface of the model. This will, in turn influence the structural deformation characteristics. Due to the periodic and aperiodic behaviour between the vortex shedding and interactions, a time-resolved analysis is needed to confirm this interaction.
Within
Table 1, comparing the flexible recirculation region directly with results from [
9], the A-25 model shows a vortex core closer to the structure. Since the flexibility and nature of the deformation vary between the two experiments, this is expected variance. When observing both experiments, due to the internal gauge pressure of the hemisphere used for [
9], the deformation pattern is shown to vary from the results presented here. Wood et al. [
9] presents results indicating similar magnitudes of displacement (≈2 mm); however, this is concentrated at the apex of the hemisphere. In this experiment, the absence of any internal pressure resisting the oncoming wind loading allows for the deformation to occur close to the stagnation point at the LE of the hemisphere. However, both models do indicate primary displacement across the LE centreline. In this experiment, the peak LE deformation appears to centre about the stagnation region, whilst [
9] shows a large area of maximum displacement, extending to the apex of the structure. From
Table 1 with an increase in Reynolds number, both flexible and rigid models show an upstream shift of reattachment location and an upstream movement of the centre of recirculation. In results from [
9], the centre of recirculation is further downstream for the flexible model as compared with the rigid model for all Reynolds numbers. The work conducted in this paper shows the centre of recirculation is upstream of the rigid model. This can be attributed to the aforementioned model variations between experiments. Looking at the rigid model, with an increasing Reynolds number, there is a clear movement upstream for the centre of recirculation, shifting from
to
.
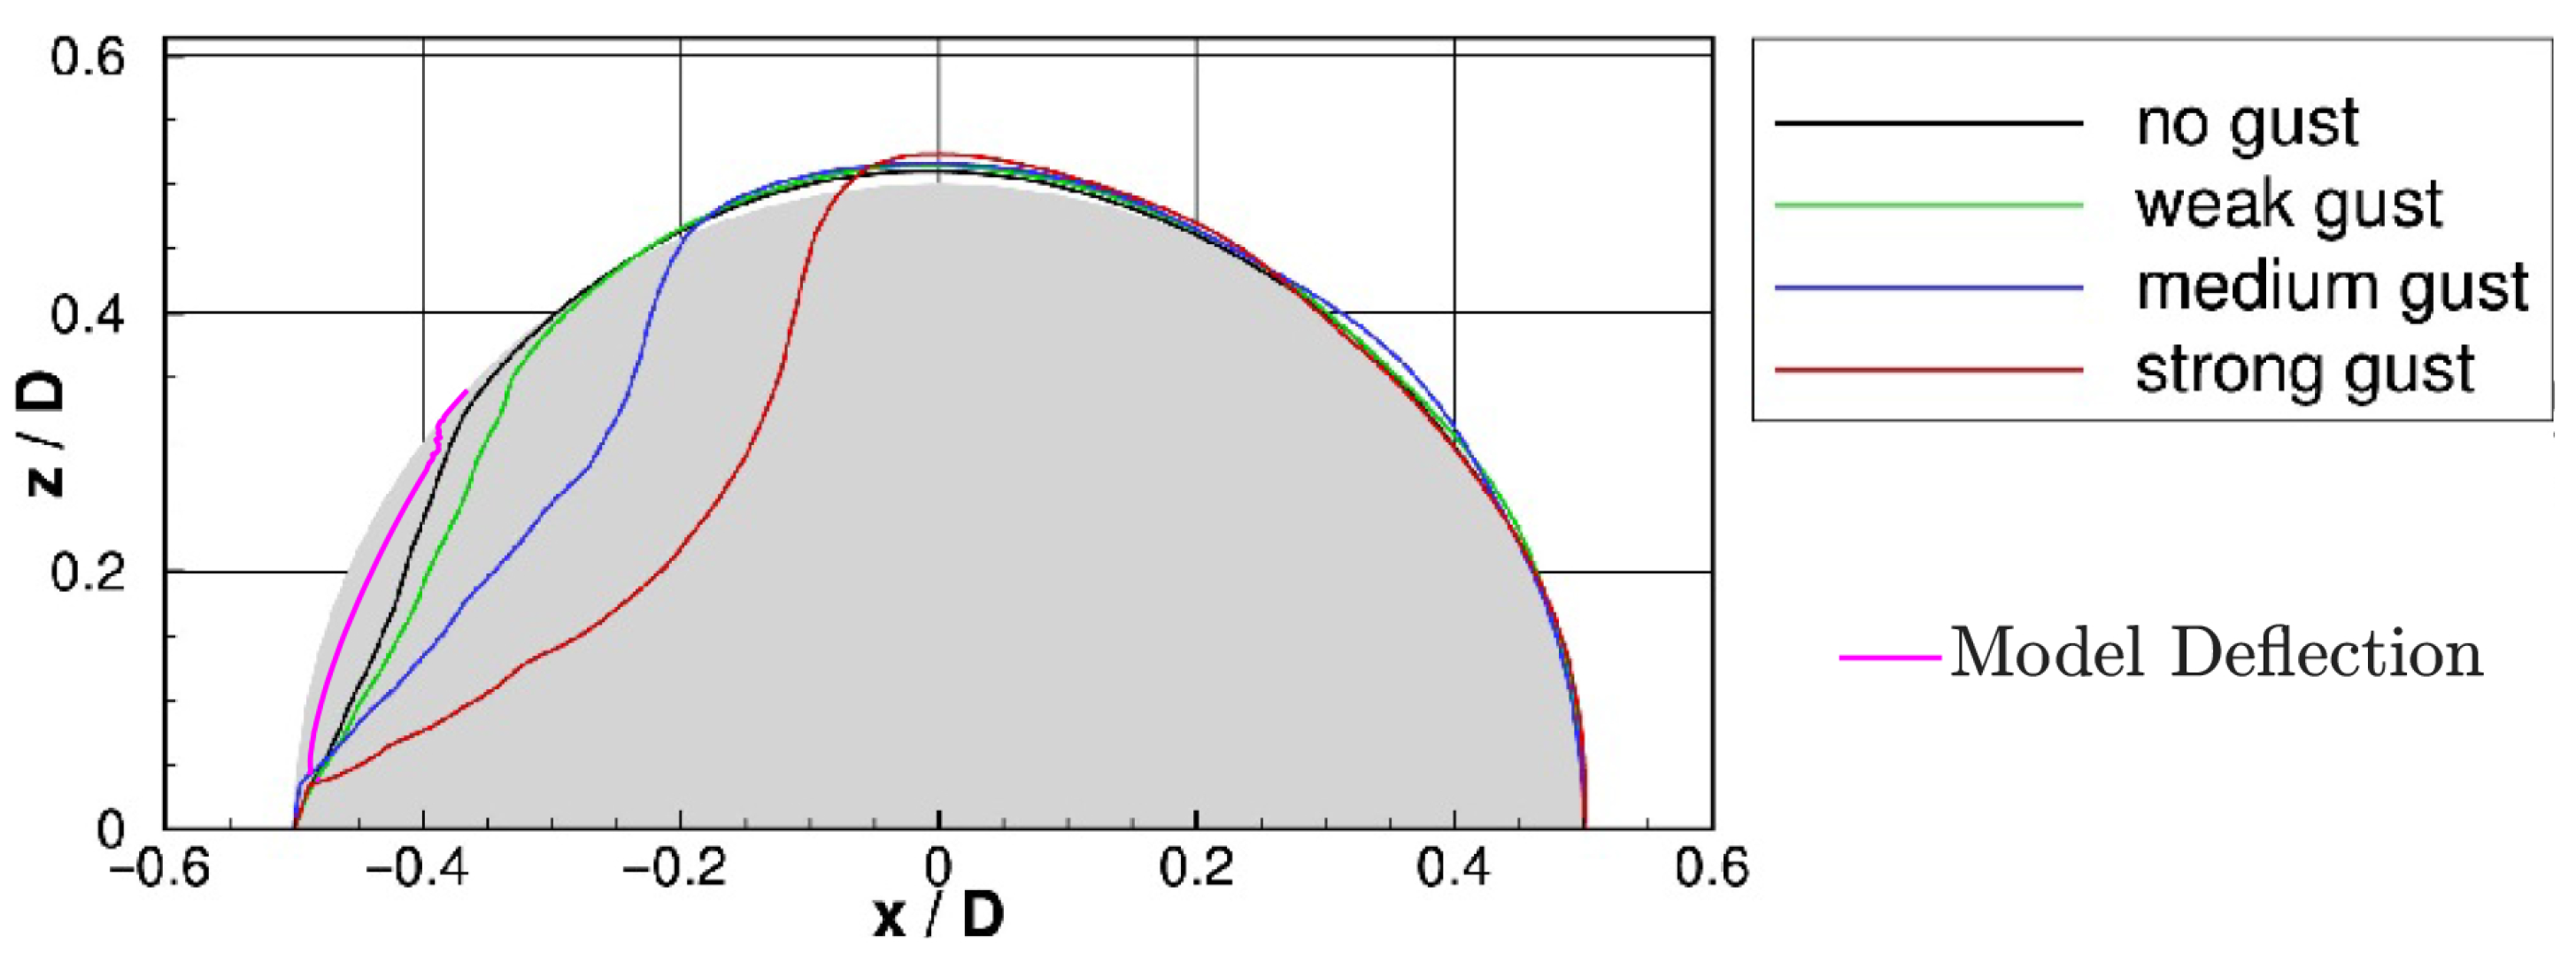
FSI investigates the interaction between the fluid reacting to the structure, and vice versa. The results show that the LE wind loading causes a concavity in the LE region. This is dependent on two critical factors, the Reynolds number of the flow and the structural stiffness of the model. De Nayer et al. [
23] investigates the deformation of a flexible membrane with the addition of a gust load at
. The deformation of the structure in [
23] matches with the position of deformation observed within the experiment. Comparing
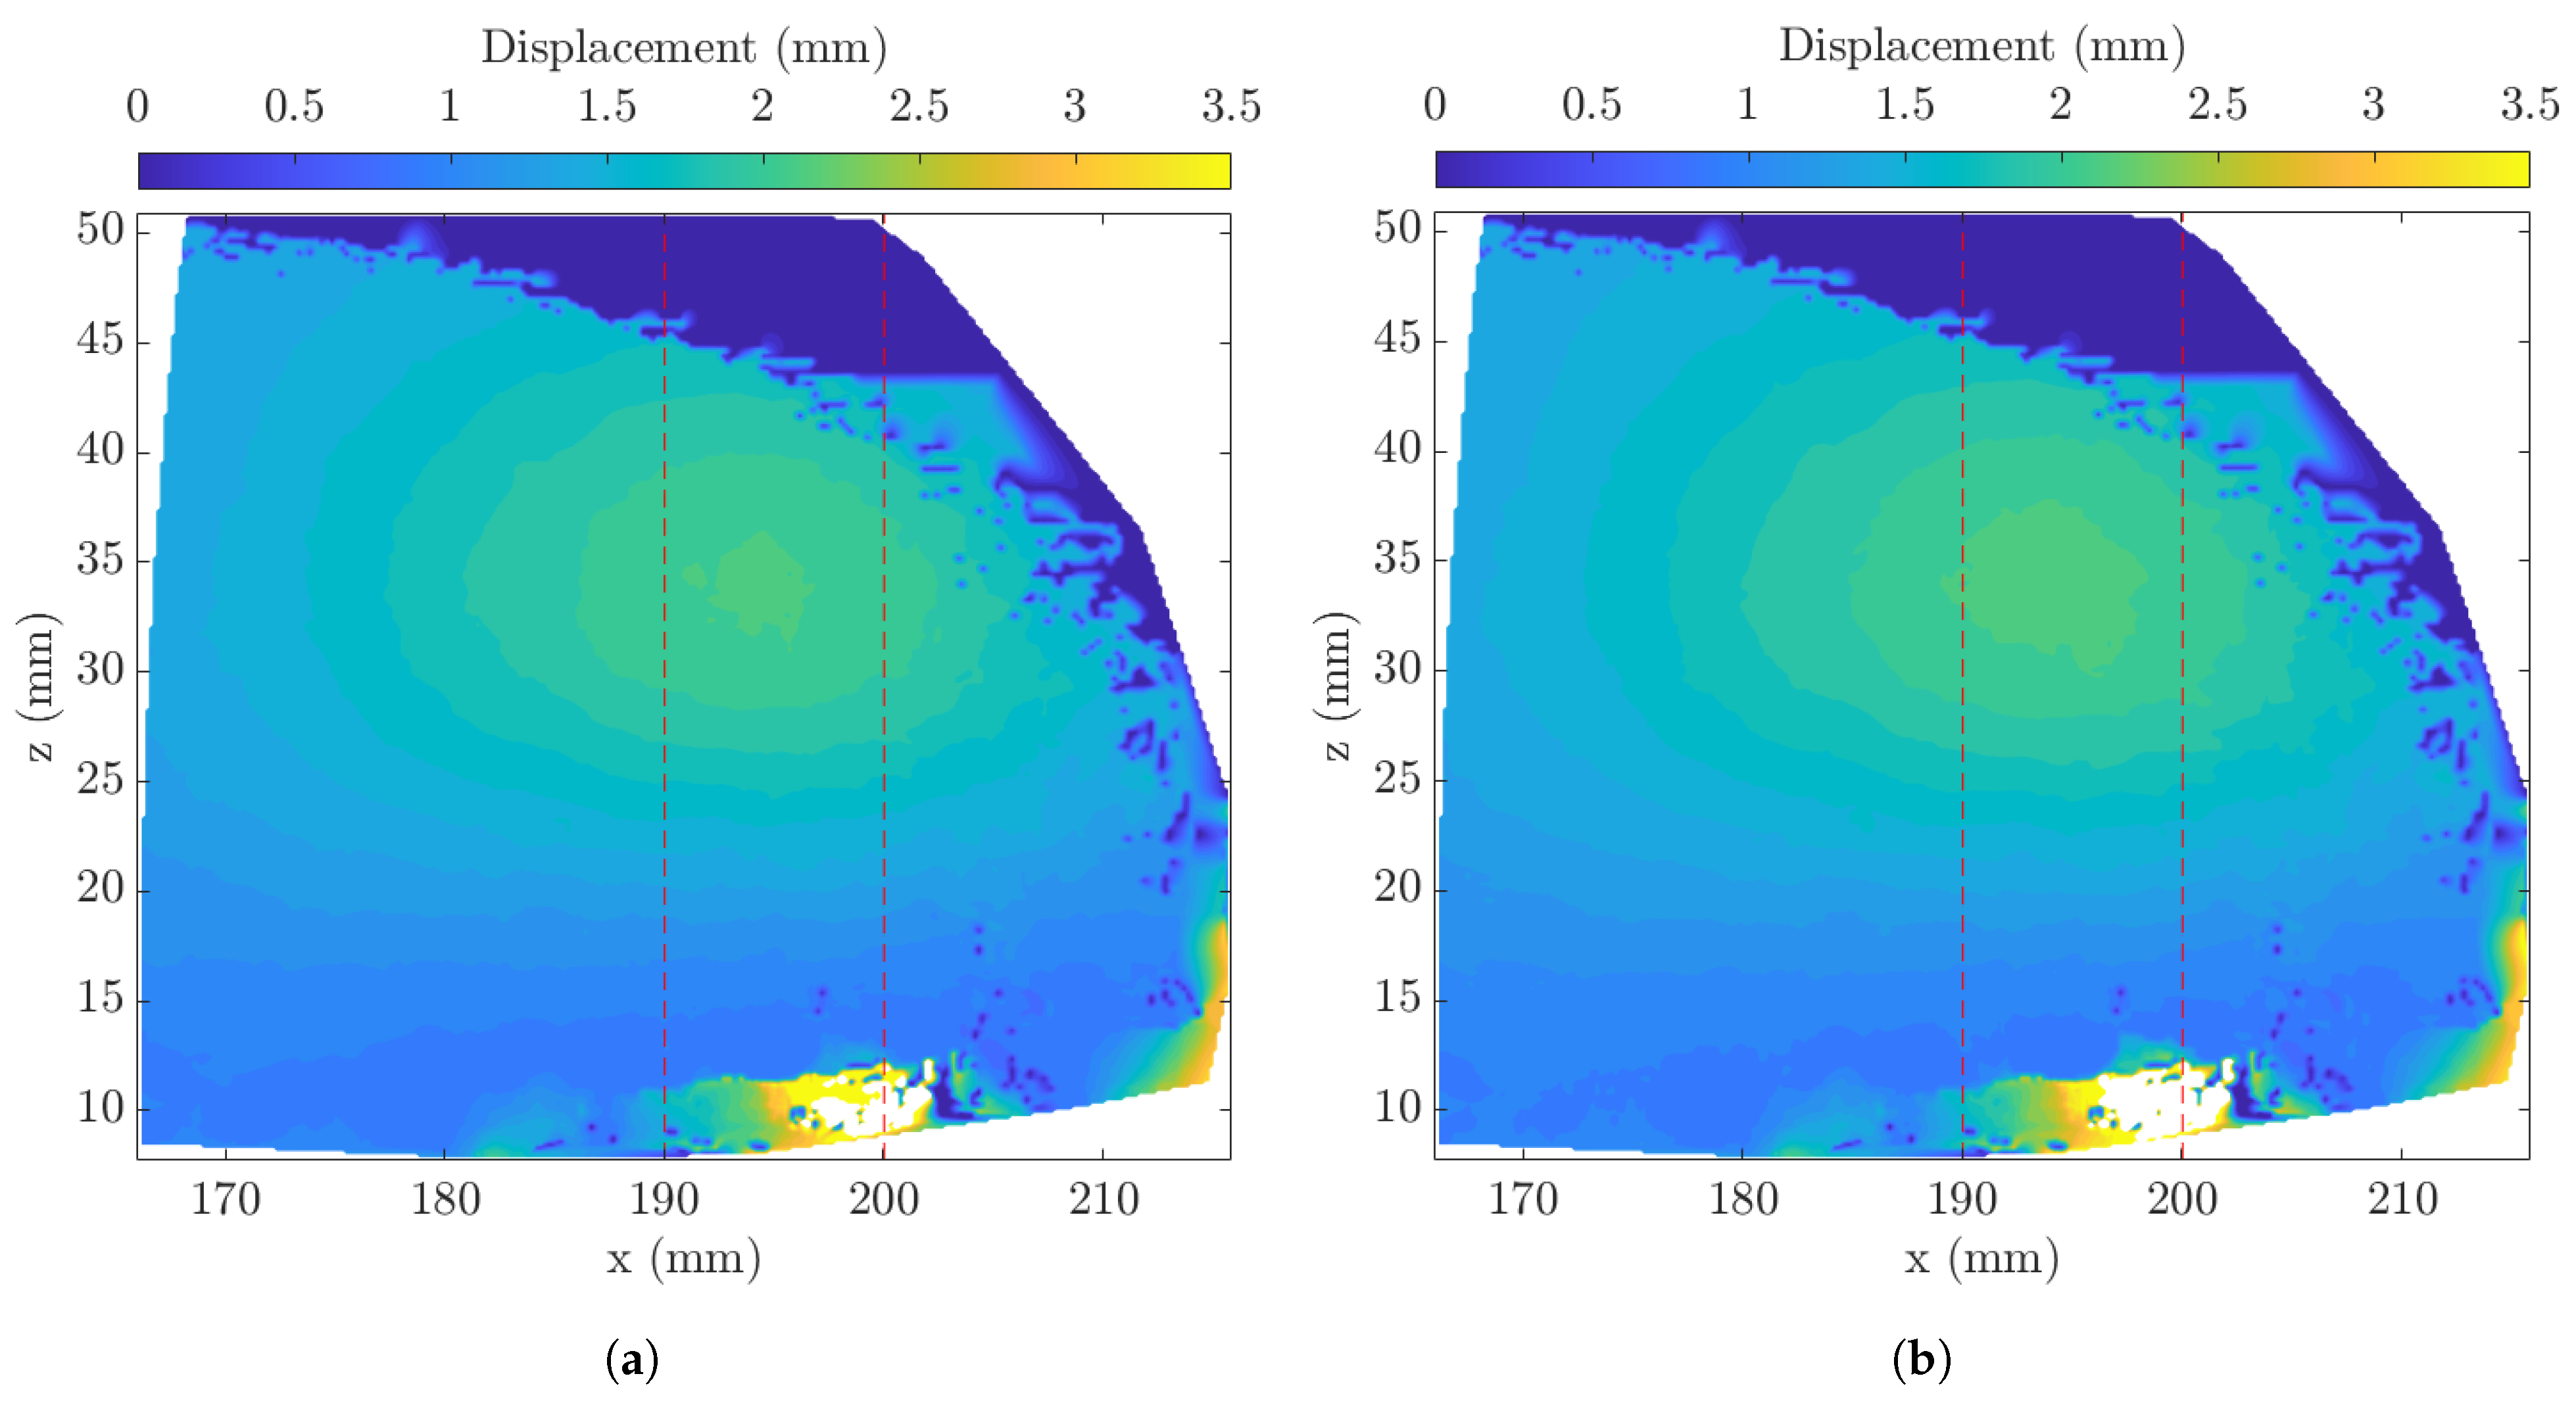
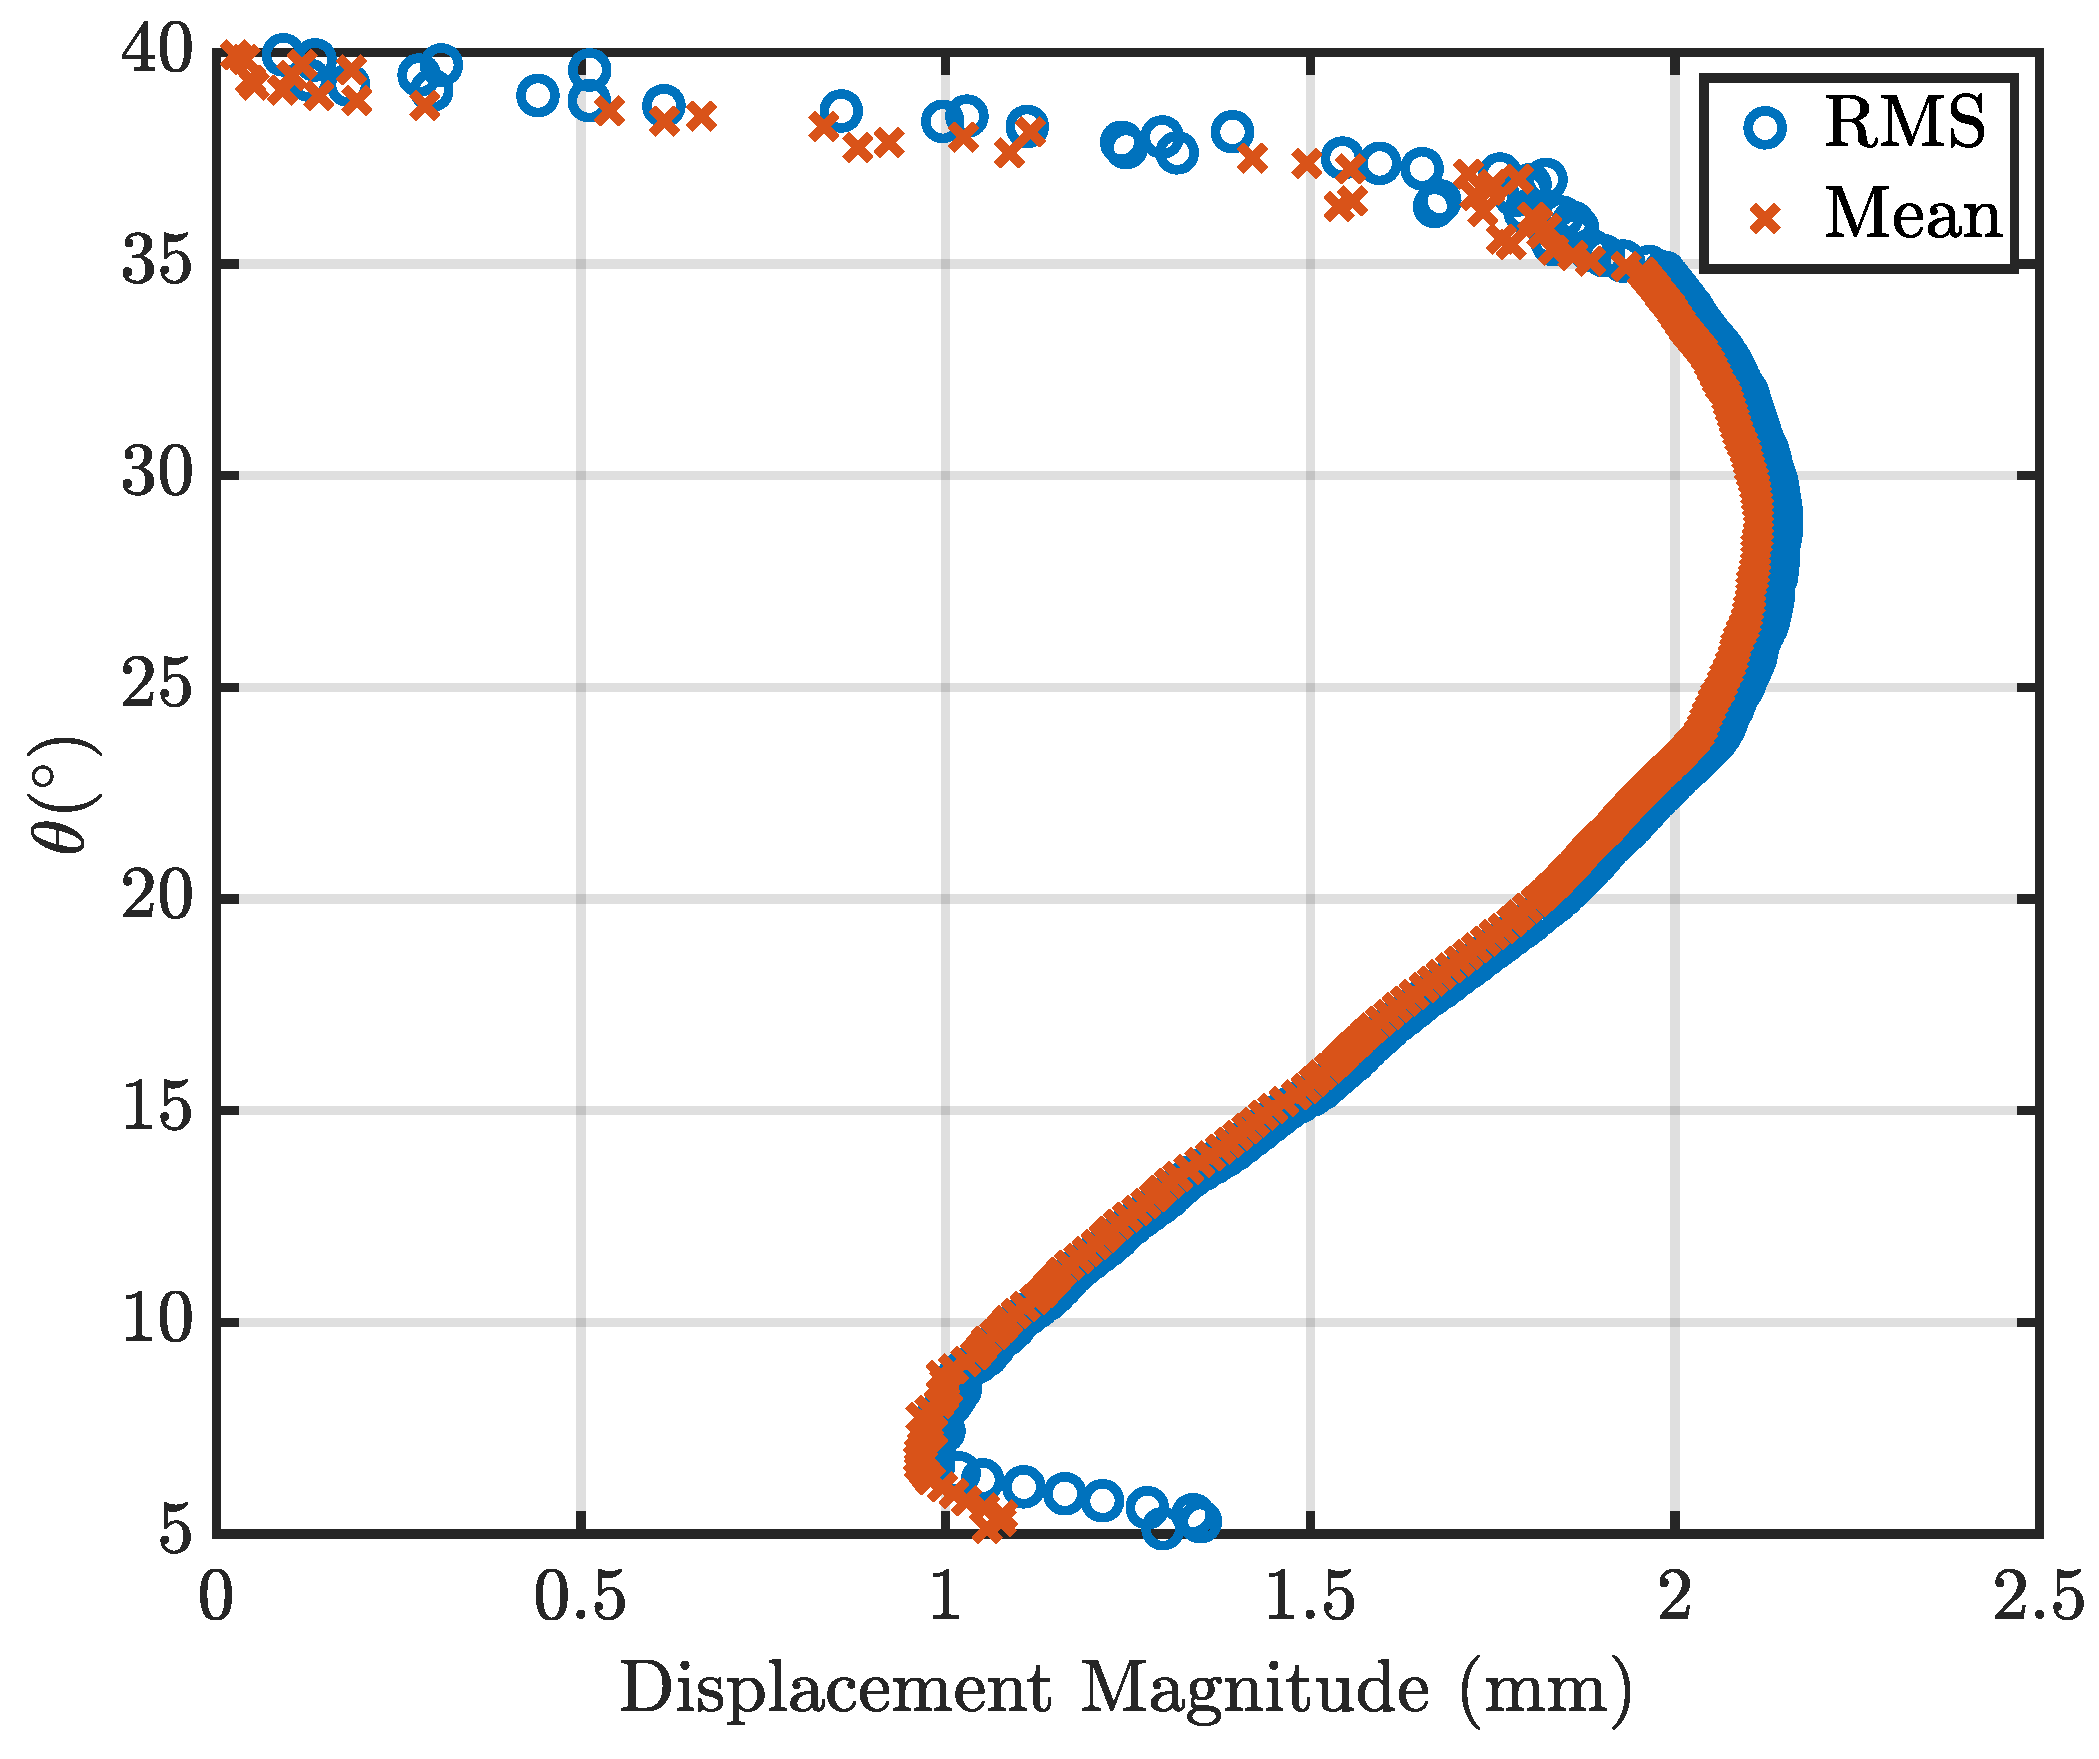
Figure 17 and
Figure 18, the major location of deformation is consistent with the numerical analysis of the deformation for the no-gust case, as indicated in
Figure 20. The region of deformation is between
0 and
0.3, which corresponds to the region bounded by
and
, as presented within this paper. The magnitude variation between the literature and the current experiment is primarily linked with the structural stiffness variations between the current experimental model and the numerical model used in [
23].
De Nayer et al. [
23] allows for an explanation as to the structural deformation behaviour. With an increase in gust strength, which is analogous to a time-varying increase in localised Reynolds number, the hemisphere structure forms an indentation across the LE. This causes the apex of the hemisphere to extend vertically, which in turn causes the sides of the hemisphere to become wider. This is also observed within the experiment conducted. Note [
23] uses an internally maintained gauge pressure, thus resulting in differing deformation magnitudes from the data presented in this paper. This change in the width, therefore, causes the hemisphere to morph into a non-symmetric oblate spheroid. This change in all three dimensions is linked with the change in the vortex behaviour observed downstream.
This process occurring will affect the extraction of energy from the surrounding fluid flow due to the deformation of the structure itself. This is evident in both the results presented by [
9] and within the results obtained from this experiment. The results show that the previously observed behaviour in the literature persists, similarly with an increase in Reynolds number and a change in structural characteristics. There is expected variance due to differing incoming boundary layers and the exact shape of the deformation of the A-25 model.
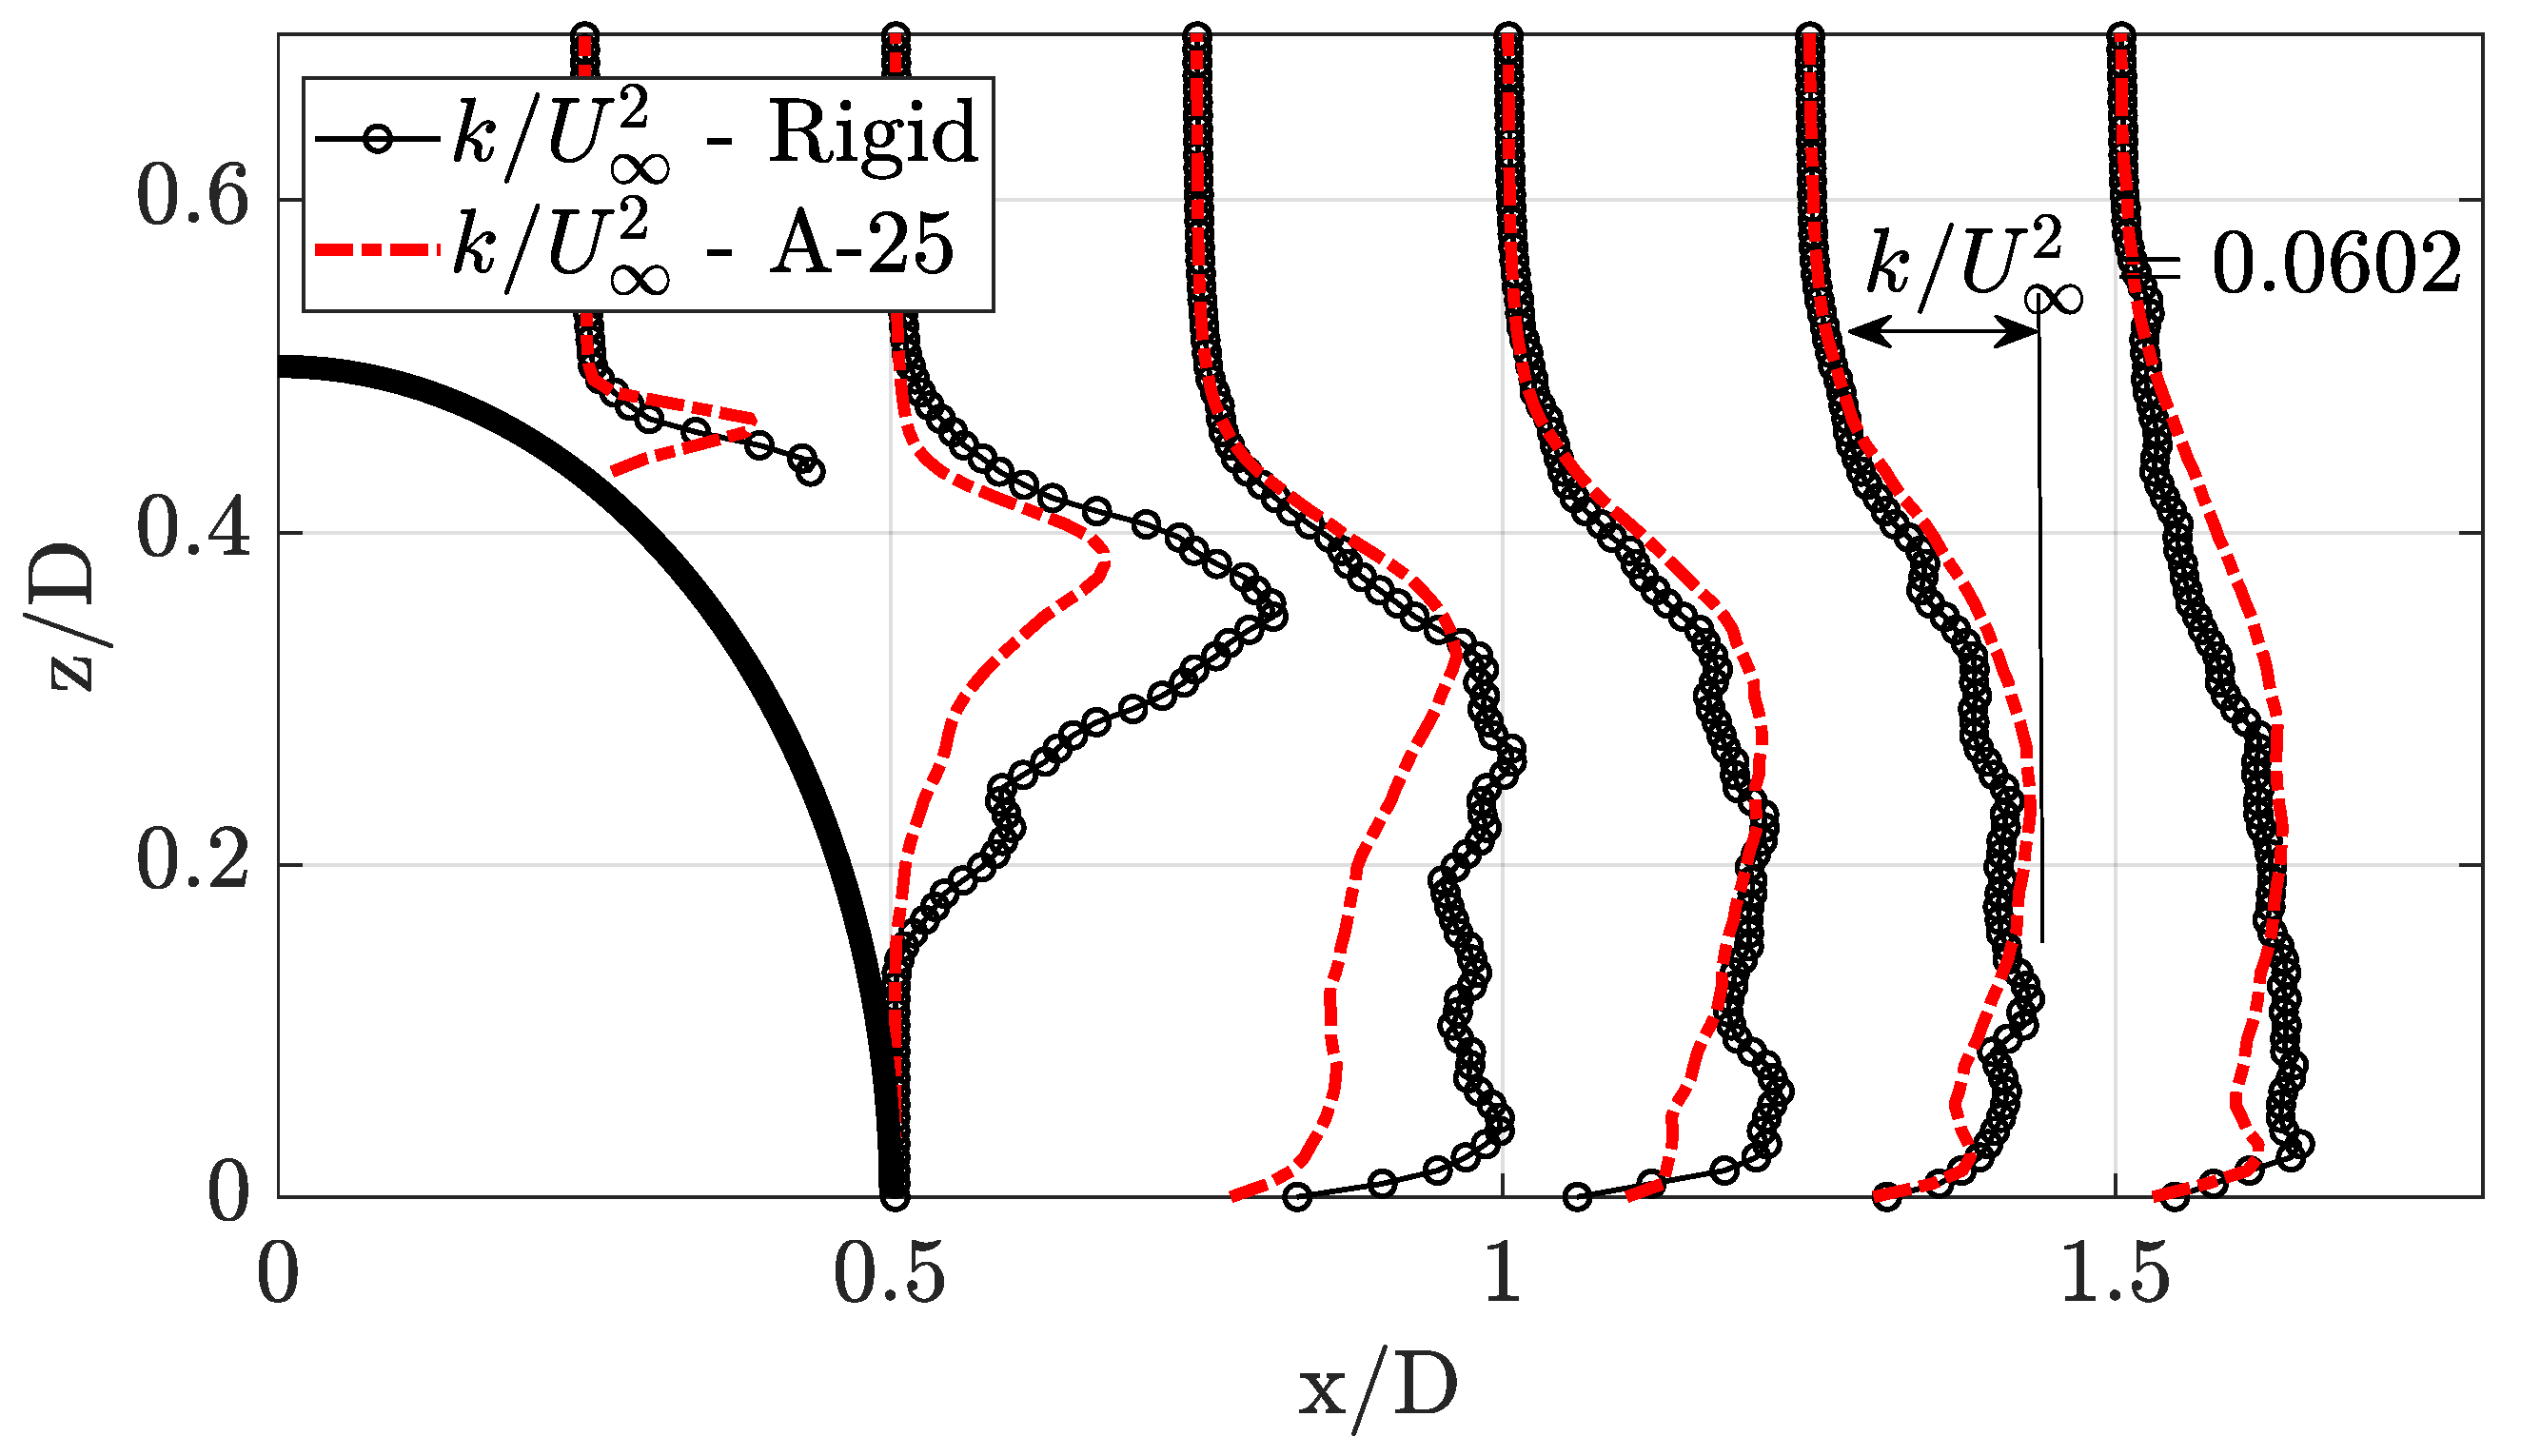
Figure 21 shows the TKE in the wake region. The TKE is calculated using:
[
24], where the velocity fluctuations are determined using the local velocity average at each grid location. This indicates that the deformation of the LE of the test model causes a noticeable drop in TKE in the immediate wake region. This indicates energy absorption of the flexible A-25 model from the flow. This variance is mainly in the near wake region, with the location of greatest TKE variance coinciding with the main recirculation vortex core. Observing the trend downstream up to
1.5, the TKE in the wake between the rigid model and the A-25 model begins to coincide. This indicates that the TKE dissipation along the streamwise direction is lower for the A-25 model than that of the rigid model. This is primarily driven by the mixing of small-scale eddies and turbulent transport properties [
25], which may be altered due to the presence of the flexible structure. As [
25] states, SPIV lacks the spatial resolution to allow the turbulence to be resolved down to the Kolmogorov scale, thus the specific turbulent energy dissipation rate calculated directly would be expected to underestimate the true energy dissipation rate without additional corrections. Note that the magnitude has been scaled by a factor of three to highlight the difference between
locations.
5. Conclusions
This paper has presented results linking the LE centreline deflection of a flexible hemisphere structure, with the wake behaviour downstream, along the same centreline slice. Testing was conducted at , with two models, a rigid and flexible model. The flexible, deformable model (A-25) was shown to experience deformation throughout the whole structure with a concave peak deformation occurring at along the centreline of the LE. This corresponds to a peak velocity reduction in the wake region between and with velocity inflection in both the RMS and average velocities, indicating shear stress and a pressure gradient within the field. The local minima were observed to be and for the RMS and average velocities, respectively. This velocity inflection was not visible for the rigid model.
Furthermore, the flexible A-25 model also shows a change in the position of the recirculation region vortex core from and for the rigid model to and for the flexible A-25 model. The recirculation region behaviour matches with the previous literature, with minor variance due to the differing incoming BL properties.
The flexible A-25 model exhibits larger variance from the existing literature, primarily due to the different location and shape of the LE deformation. The wake TKE was also observed for both models, indicating a lower TKE within the near wake region for the A-25 model. The TKE trend downstream indicates a lower dissipation rate for the A-25 model wake. This can be linked to the energy required to cause the deformation across the structure. In addition, the deformation was also observed to cause an elongation of the model height and expansion of the sides. This was in line with previously observed literature, with variation from material properties and the Reynolds number range of the flow.
In future work, to further analyse the deformation and flow, additional DIC will be conducted with a larger FOV to quantify the complete structural deformation. Ideally this new data will be synchronised with the SPIV recordings to allow time-resolved analysis and to investigate dynamic interaction between the structure and the surrounding flow, including the vortex interactions.
