1. Introduction
Low-level wind shear, characterized by rapid changes in wind speed and/or direction below 600
(2000
) AGL, poses a critical threat to aviation safety, particularly during takeoff and landing [
1,
2]. The F-factor, averaged over a one-kilometer radial distance (
FBAR) (a key metric derived from airborne weather radar), quantifies wind shear intensity along the flight path [
3,
4]. Accurate
FBAR prediction is therefore paramount for pilot situational awareness and timely avoidance maneuvers. The core scientific challenge addressed in this paper is the accurate estimation of vertical wind speed (
W), which is a primary limiting factor in the reliability of current
FBAR predictions [
5].
Traditional techniques for
W estimation, notably the Vicroy method [
6], rely on physics-based empirical models. These models often use simplified assumptions, such as axisymmetry in wind fields (e.g., microbursts), and employ empirical K-factors that may not adapt to the diverse and rapidly evolving spatio-temporal characteristics of real-world wind shear. Consequently, the Vicroy method can struggle to capture the true complexity of atmospheric turbulence and non-linear interactions, leading to significant errors in
W estimation, especially in non-idealized wind shear events [
7]. This study demonstrates that a data-driven deep learning approach can more effectively model these complex relationships, overcoming the limitations of models reliant on simplified physics.
Recent advances in deep learning offer powerful tools for learning complex patterns from data [
8,
9]. In meteorology, CNNs and LSTMs have shown promise for spatio-temporal tasks [
10,
11]. While some studies have applied ML to vertical velocity estimation from ground-based radar [
12] or general wind forecasting [
13], a significant research opportunity remains. Specifically, the application of a hybrid architecture combining CNNs, Bidirectional LSTMs, and Attention mechanisms to directly estimate
W from airborne radar scan line data for the explicit purpose of improving
FBAR prediction has not been fully explored.
This paper proposes a novel hybrid CNN-BiLSTM-Attention deep learning architecture to address this challenge. The primary objective is to significantly improve
W estimation accuracy from simulated airborne radar I/Q data, leading to more reliable
FBAR predictions. This work is aligned with the advancement of intelligent avionics for civil aircraft. Furthermore, the development methodology is consciously aligned with the safety assurance principles of emerging standards like SAE AS6983 [
14], considering a Design Assurance Level (DAL) C context, which is crucial for integrating machine learning into safety-critical aeronautical systems.
The main contributions of this paper are as follows: (1) The design and rigorous evaluation of a hybrid CNN-BiLSTM-Attention model for enhanced W estimation. (2) A comprehensive quantitative comparison of the proposed model’s performance against the Vicroy method and other ML approaches on a challenging simulated benchmark dataset. (3) An illustration of how deep learning development can align with the principles of emerging safety assurance standards.
This paper is structured as follows:
Section 2 reviews related work.
Section 3 details the data generation, model architecture, training,
FBAR calculation, and safety considerations.
Section 4 presents experimental results.
Section 5 discusses the implications, and
Section 6 provides conclusions and future work.
2. Related Work
The challenge of low-level wind shear and its impact on aviation has been a subject of extensive research and operational concern for decades. This section reviews key literature pertinent to wind shear hazard characterization, traditional and AI-based estimation techniques, and the evolving landscape of safety assurance for AI in aviation.
2.1. Wind Shear Hazard Characterization and the F-Factor
The F-factor, representing the rate of change of aircraft specific energy due to wind variations, is a cornerstone in modern wind-shear-alerting systems [
4]. A positive F-factor indicates performance-decreasing shear. The operational relevance of the 1 km averaged version (
FBAR) is underscored by its adoption in airborne wind-shear-warning systems and regulatory standards like RTCA DO-220A [
3]. The historical context is well documented in ICAO’s Manual on low-level wind shear [
1] and by Arbuckle et al. [
5]. Foundational work by Etkin [
2] also detailed the broader effects of turbulent wind on flight.
2.2. Vertical Wind (W) Estimation Techniques
Estimating
W is crucial for accurate F-factor calculation. The Vicroy method [
6] provides physics-based empirical models to estimate
W from along-beam radial velocity shear (
) and signal correlation (
). These models typically assume a relationship of the form
, where
is the vertical gradient of vertical wind, and K is an empirical factor (often K = 2 for
and
; K = 1, otherwise). This formulation is derived from theoretical considerations of microburst dynamics, which often assume an idealized, axisymmetric flow structure.
W is then obtained by integrating
along the radar beam. While effective in many scenarios, the Vicroy method’s performance can be limited when encountering real-world wind shear events that deviate significantly from these idealized assumptions—a key motivation for exploring data-driven alternatives.
2.3. Machine Learning in Meteorology and Radar Applications
The application of ML to meteorological problems has gained significant traction. ConvLSTM, introduced by Shi et al. [
10], explicitly models spatio-temporal correlations and has proven effective in precipitation nowcasting, as benchmarked in [
11]. More recent works have incorporated attention mechanisms into ConvLSTM frameworks for various forecasting tasks.
Specific to vertical air motion, Chase et al. (2024) [
12] employed U-Nets to estimate maximum vertical velocity from 3D radar reflectivity fields, highlighting both the potential and challenges of ML. Other applications include wind speed forecasting for energy production [
13] and specialized CNNs for wind interval prediction [
15]. General surveys on deep learning in weather prediction [
16,
17] provide comprehensive overviews. However, the application of a hybrid CNN-BiLSTM-Attention model for direct
W estimation from airborne radar scan line data to improve
FBAR prediction for civil aircraft remains a relatively underexplored area.
2.4. AI Certification and Safety Assurance in Aviation
Integrating AI/ML into safety-critical aerospace systems presents unique V&V challenges not fully addressed by standards like DO-178C [
18]. The SAE G-34 committee’s AS6983 standard [
14] is a key initiative, establishing a dedicated Machine Learning Development Lifecycle (MLDL) [
19]. This standard emphasizes data management rigor, model validation, robustness, and explainability, all of which are crucial for ensuring that AI contributions to safety are verifiable and trustworthy.
3. Materials and Methods
The methodological framework of this study is designed to address the core scientific problem of accurately estimating vertical wind speed (
W) from airborne radar data to improve
FBAR predictions. This involves a multi-stage process encompassing high-fidelity data simulation, extraction of relevant radar features, the design and optimization of a novel deep learning architecture, and a comparative evaluation against traditional and alternative machine learning techniques, all while considering aviation safety assurance principles.
Figure 1 provides a high-level overview of this process.
3.1. Data Generation and Preprocessing
The foundation of this study is a robust dataset derived from sophisticated simulations, ensuring access to both realistic radar measurements and corresponding ground truth atmospheric conditions.
3.1.1. Simulation Environment and Atmospheric Data
The foundation of this research rests upon simulated radar In-phase and Quadrature (I/Q) data, generated using the Airborne Doppler Weather Radar Simulation (ADWRS) system. ADWRS is a simulation tool developed by NASA and widely accepted by the aviation community for system evaluation and certification support [
3]. The atmospheric conditions, including the critical DFW test case, were sourced from the “Windshear Database for Forward-Looking Systems Certification” [
20], a publicly accessible resource developed specifically for this purpose.
For this study, we focused on the Dallas–Fort Worth (DFW) microburst event of 2 August 1985 (identified as Scenario C1-11), a scenario compliant with RTCA DO-220A [
3]. This event, extensively analyzed by Fujita [
21], is a widely recognized and challenging benchmark for evaluating airborne radar performance due to its severe, non-axisymmetric characteristics. The high-resolution numerical simulation of this event in the certification database provides the ground truth for all atmospheric variables, including the target vertical wind component (
W). ADWRS processes these atmospheric data files with defined radar parameters and flight paths to produce the I/Q data, forming the basis for our feature engineering.
3.1.2. Input Feature Engineering
A set of 10 distinct features was engineered from the raw ADWRS outputs for each range gate along a radar scan line. This feature extraction aimed to provide the model with comprehensive information about the radar returns and their local context:
range_m: The distance from the radar to the center of the range gate (m).
altitude_m: The altitude of the range gate above ground level (m).
u_r: The mean radial velocity (m/s) estimated via Pulse Pair Processing (PPP).
duds: The along-beam shear of radial velocity (s−1), calculated as the gradient of u_r using a 5-point Ordinary Least Squares (OLS) fit.
R_corr: The correlation coefficient from the 5-point OLS fit.
ref_gt: The ground truth reflectivity (dBZ) interpolated from the atmospheric database.
u_r_lag1, duds_lag1: Radial velocity and shear at the preceding range gate.
u_r_lead1, duds_lead1: Radial velocity and shear at the succeeding range gate.
The inclusion of lagged and lead features provides a localized spatial context (a 3-gate window, approx. 150 ) for each prediction.
3.1.3. Target Variable
The target variable is the ground truth vertical wind speed (W) in (positive upwards), sourced directly from the DFW case data and interpolated to the precise spatio-temporal coordinates of each radar range gate.
3.1.4. Data Structuring, Splitting, and Normalization
Final data preparation for model training involved several key steps:
Sequence Generation: Data from individual scan lines were formed into sequences of length 173 (maximum observed gates). Shorter sequences were padded with 0.0, and target W values were padded with NaNs, which were masked during loss calculation.
Data Splitting Strategy: The dataset was split based on unique radar scan identifiers. A stratified sampling approach was employed, categorizing scans based on the presence of significant downdrafts (W < ). The test set consisted of 2 scan scenarios, with one specifically chosen for containing the critical benchmark event to ensure evaluation under hazardous conditions. A validation set of 1 scan scenario was similarly selected. The final test set comprised 14,524 individual gate-level data points.
Normalization: All 10 input features were standardized using a scaler fitted only on the training set data.
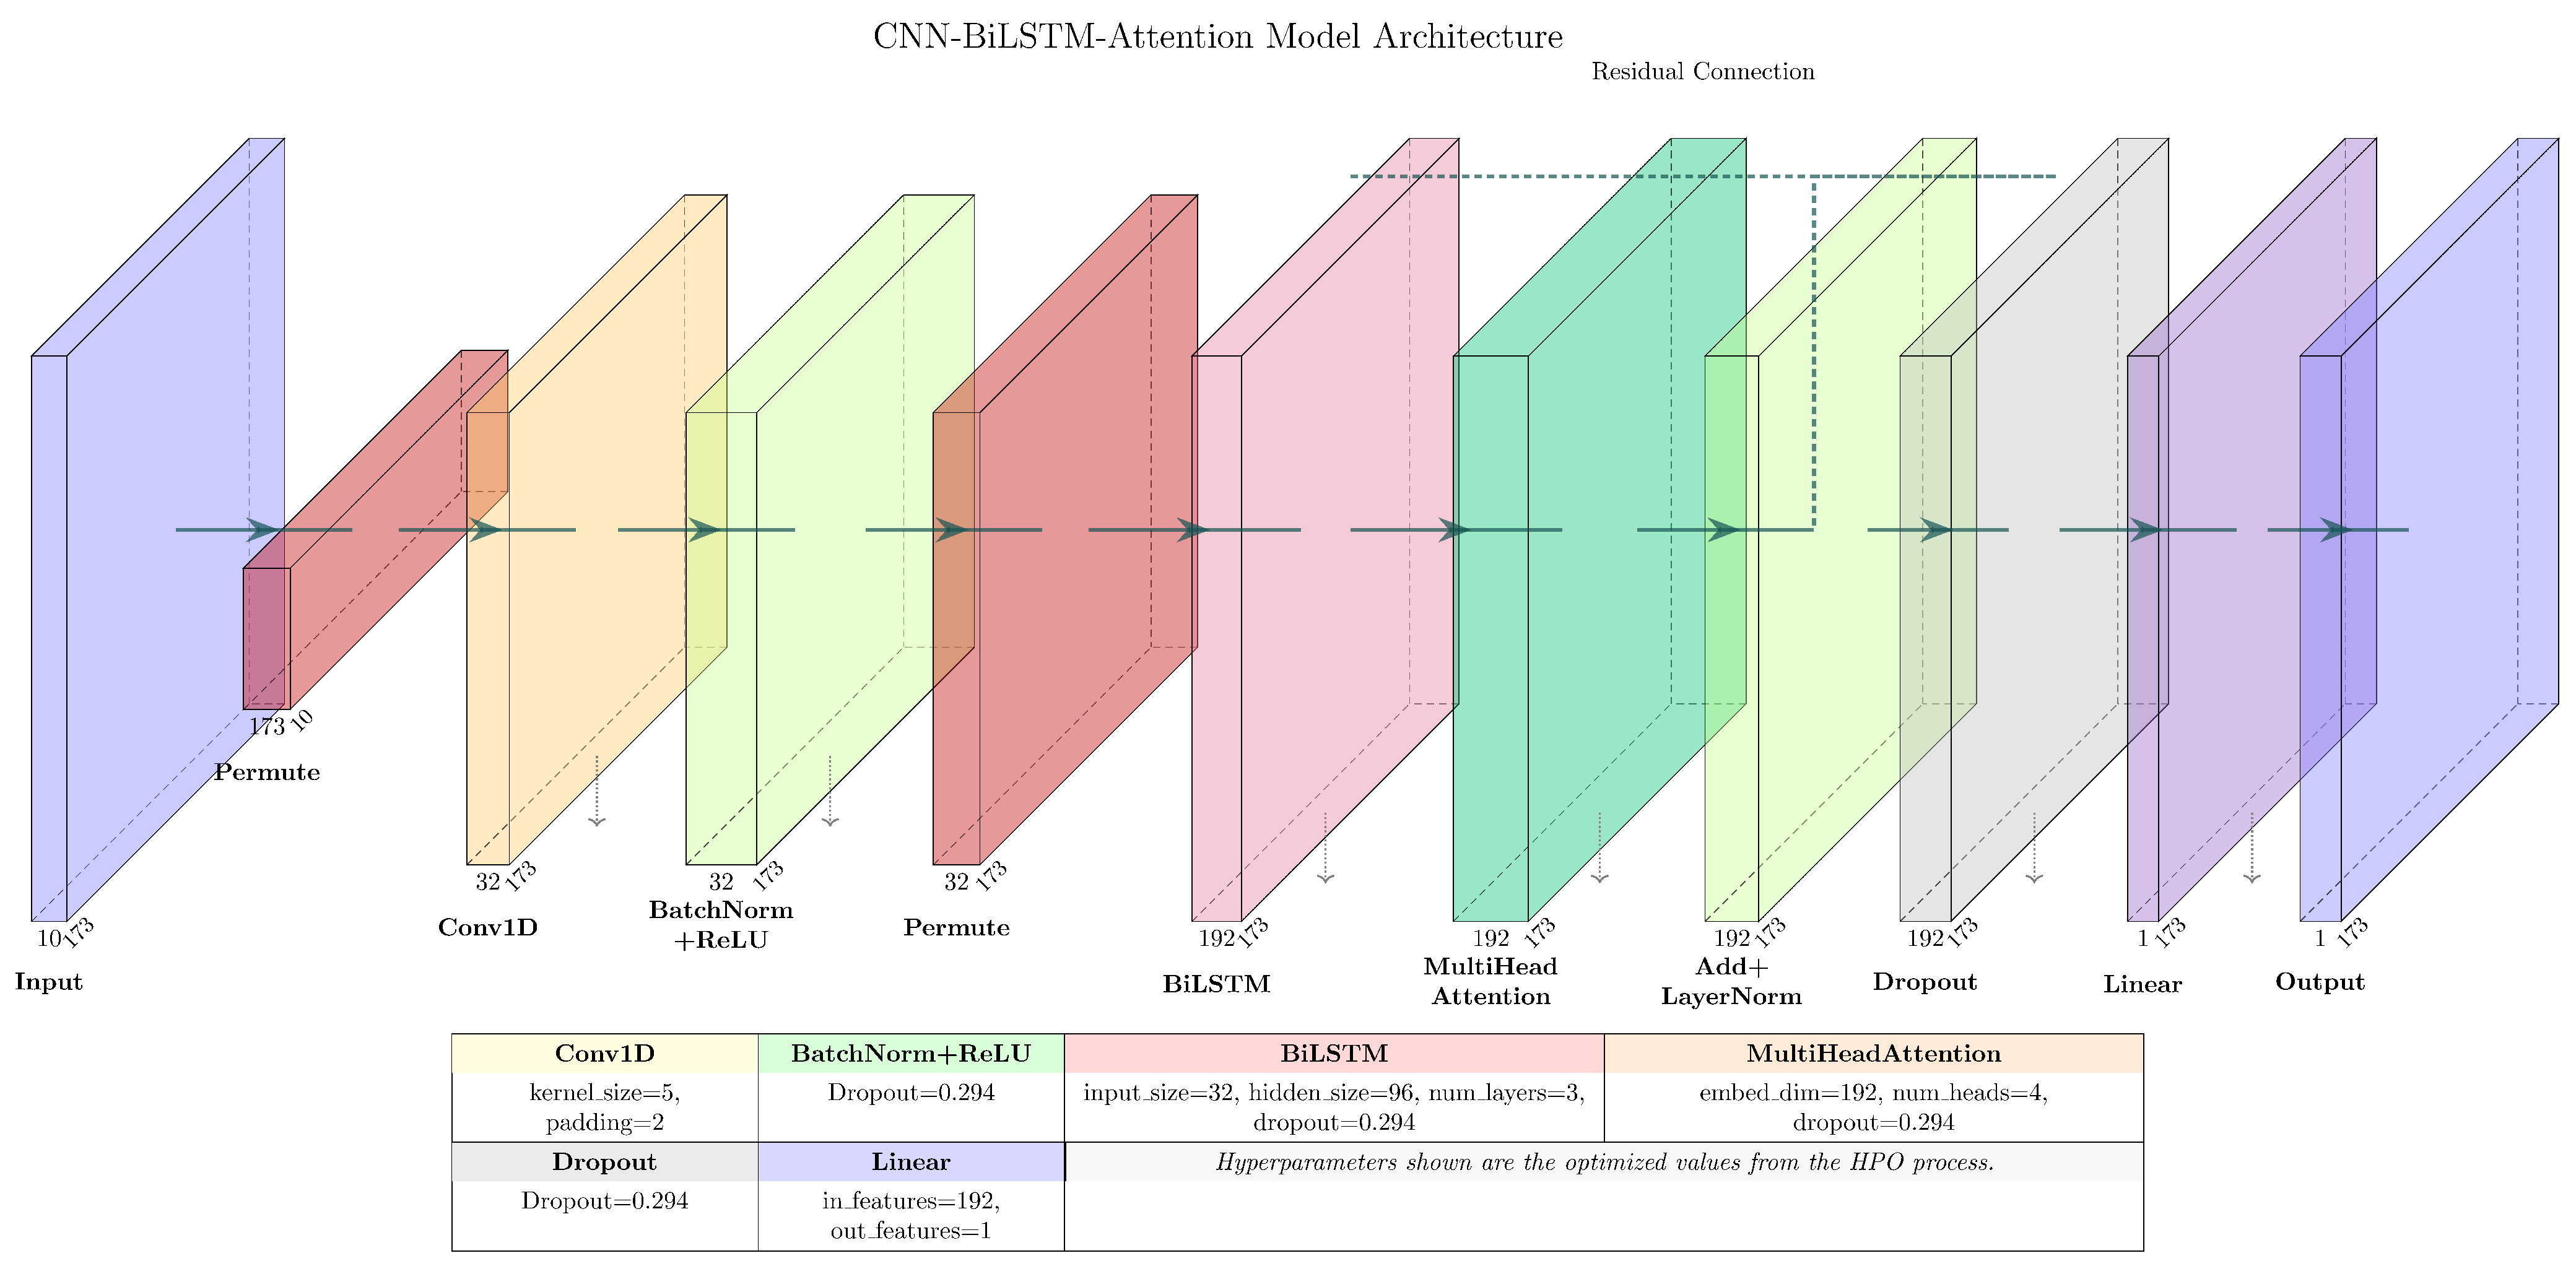
3.2. Proposed CNN-BiLSTM-Attention Model Architecture
The proposed model is a hybrid neural network designed to exploit the spatio-temporal nature of radar scan line data. The architecture, depicted in
Figure 2, consists of the following key components:
Input Layer: Accepts sequences of shape (batch_size, sequence_length = 173, num_features = 10).
1D Convolutional Block: A 1D CNN extracts local spatial features.
A
Conv1d layer with 32 channels and a kernel size of 5 is followed by
BatchNorm1d,
ReLU, and
Dropout (rate 0.2940). The convolutional operation at position
l for output channel
j is given by
where
X is the input sequence,
W is the kernel,
b is bias, and
is the ReLU activation.
Bidirectional LSTM Layers: Three layers of Bidirectional LSTMs (
LSTM) capture long-range dependencies. The core operations at each step
t are [
22]
Each LSTM layer has 96 hidden units per direction, and the final hidden state is .
Dropout (rate 0.2940) is applied between LSTM layers.
Multi-Head Self-Attention Layer: An attention mechanism dynamically weighs the importance of different parts of the sequence.
Residual Connection and Normalization: The attention output is added to its input (the LSTM output), forming a residual connection, followed by layer normalization.
Output Layer: A final Dropout and a Linear layer together map features to a single output, i.e., the predicted W.
This hierarchical architecture is designed to first learn local spatial features (CNN), then model sequential dependencies (BiLSTM), and finally re-weight representations based on contextual relevance (Attention).
3.3. Model Training and Hyperparameter Optimization
The model was trained to minimize Mean Squared Error (MSE),
, using the Adam optimizer [
24]. Hyperparameter optimization (HPO) was conducted using Ray Tune [
25] with the ASHA scheduler over 100 trials. The best HPO trial achieved a validation MSE of 0.1189.
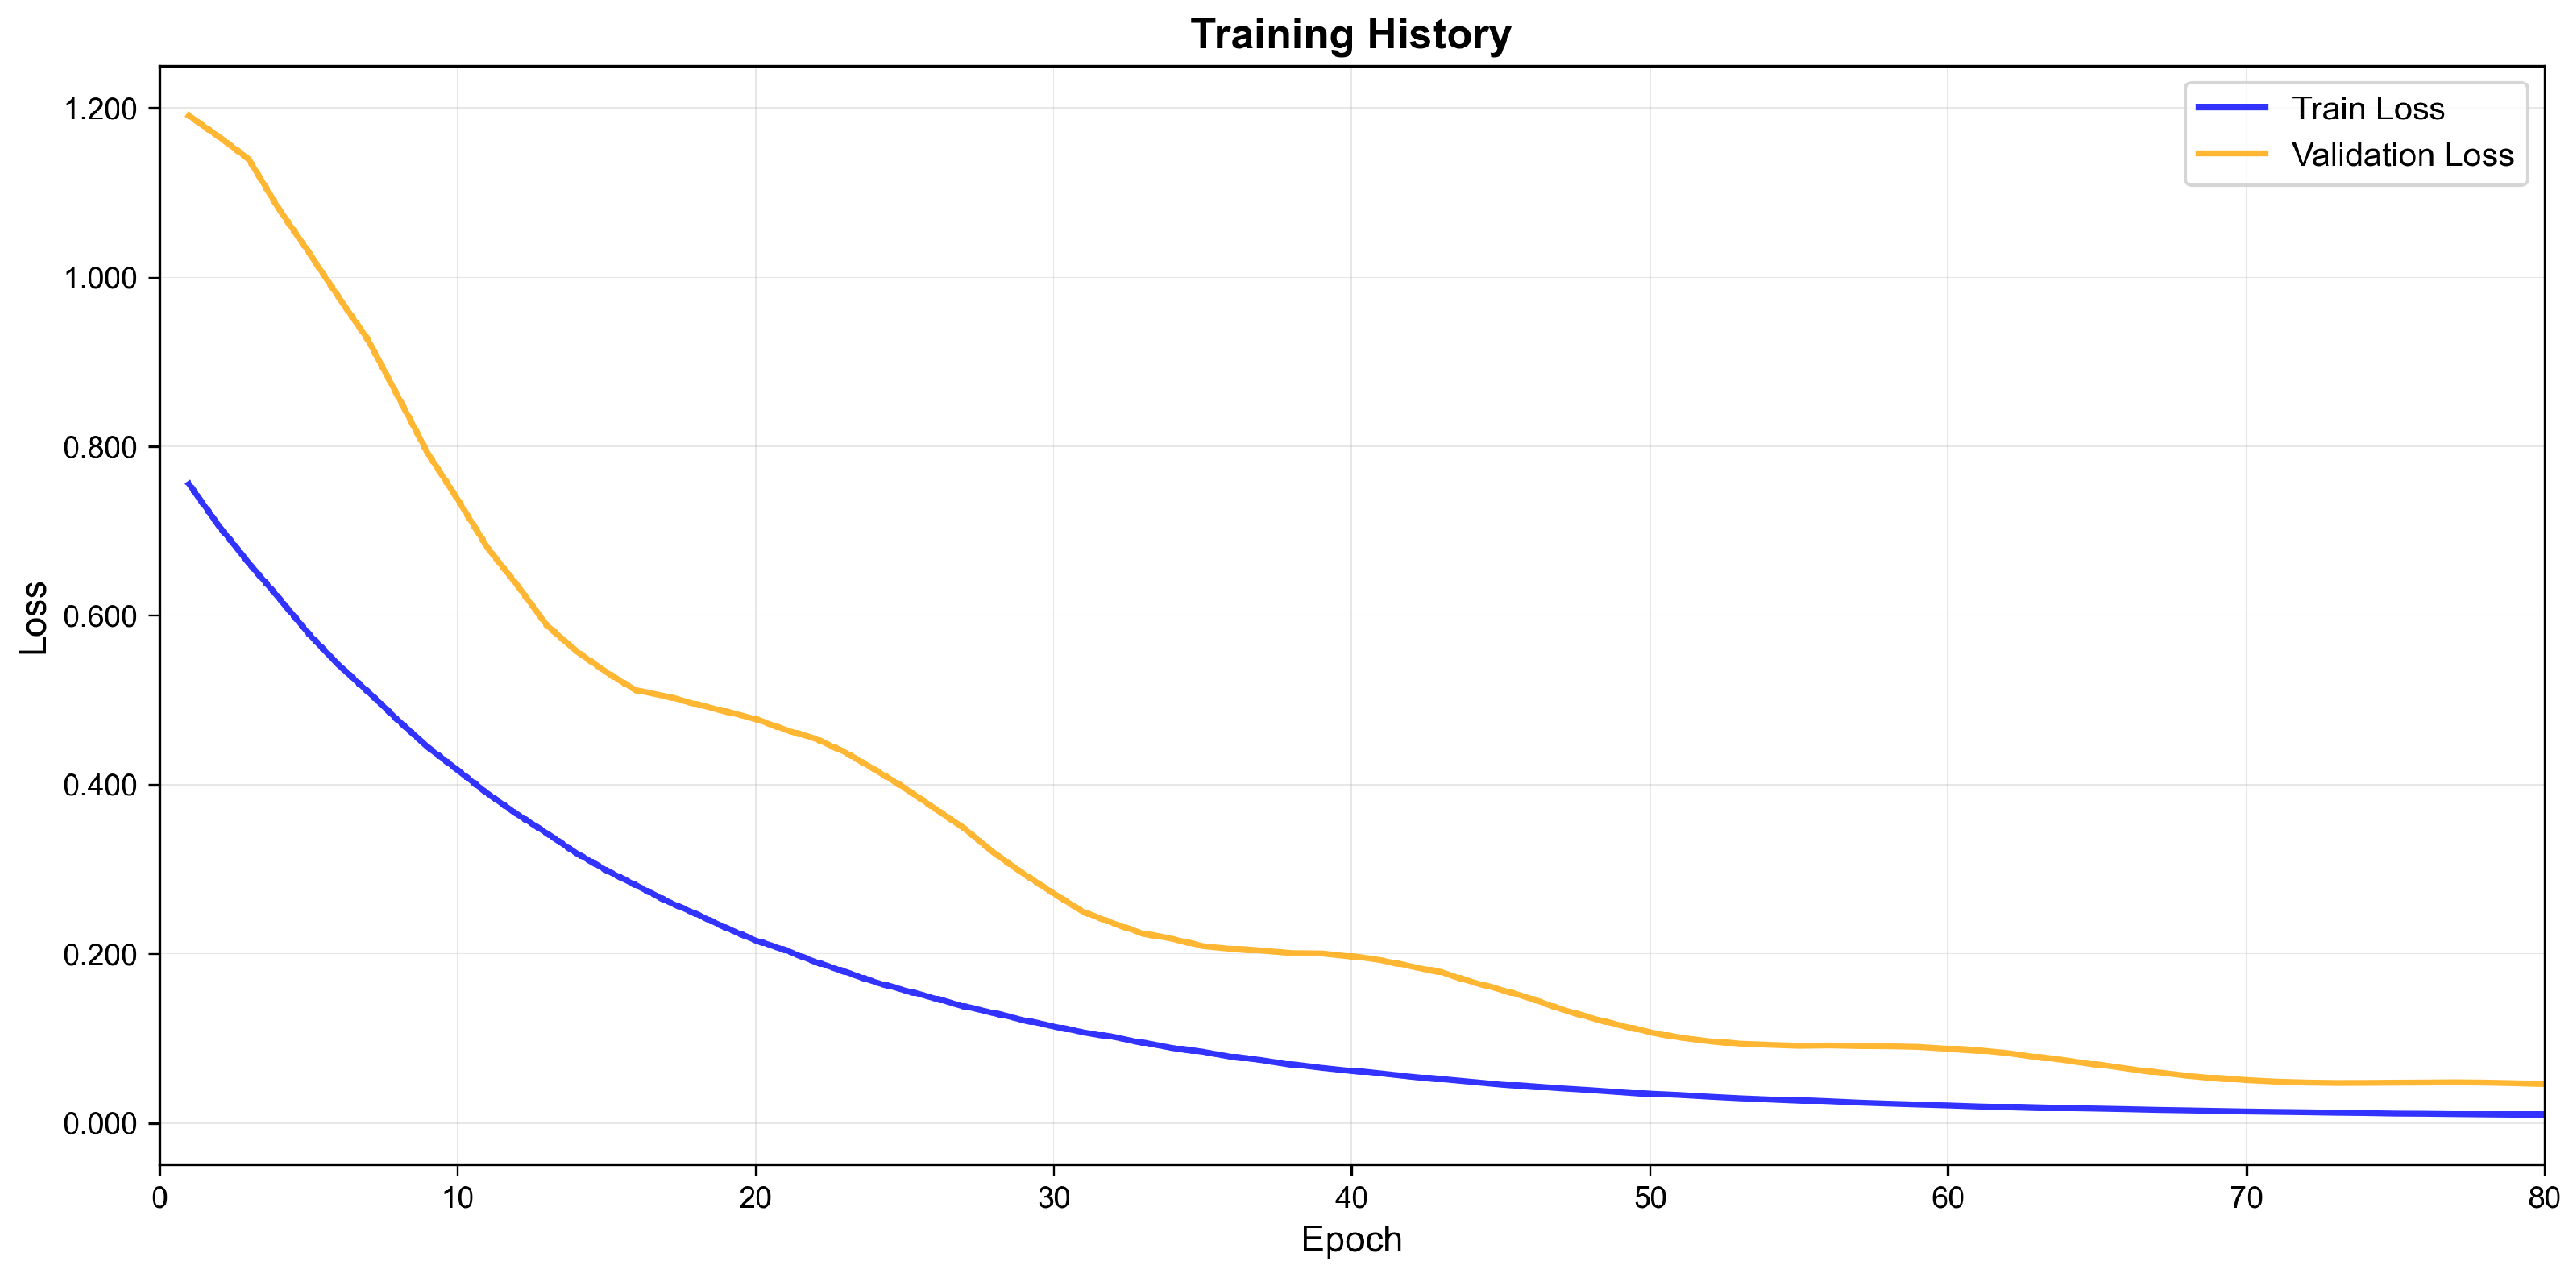
The final model, using optimized hyperparameters (e.g., learning rate 0.000606, 3 LSTM layers, 96 hidden units), was trained for up to 150 epochs with an early stopping patience of 30 epochs.
Figure 3 shows the training and validation loss curves.
Ablation Study of Key Hyperparameters
The HPO process systematically explored the hyperparameter space.
Table 1 shows that deviations from the optimal set generally led to increased validation loss, confirming the effectiveness of HPO and the model’s sensitivity to key architectural choices.
3.4. FBAR Calculation Method
The instantaneous F-factor is given by [
3,
7]
where
g is gravity,
is horizontal wind speed,
is horizontal wind change rate,
is vertical wind speed, and
is true airspeed ( 150
). F-factor values are then averaged over a 1
sliding window to produce
FBAR.
3.5. Baseline and Alternative Machine Learning Methods
To benchmark performance, the proposed model was compared against the following:
Vicroy Method (Baseline): A traditional physics-based empirical method [
6].
MLP-Enhanced Vicroy: An MLP predicts an adaptive K-factor for the Vicroy equation.
MLP-Corrected Vicroy: An MLP predicts a correction term for the Vicroy output.
Direct W MLP: An MLP directly predicts W from radar features.
Physics-Informed ConvLSTM: A ConvLSTM with a loss term incorporating a simplified continuity equation.
Spatio-Temporal Transformer: A Transformer-based architecture using self-attention.
3.6. Safety Assurance Considerations
The model development and evaluation were conducted with consideration for the principles of the emerging SAE AS6983 standard [
14], targeting a Design Assurance Level (DAL) C context.
Data Management (AS6983 Sec 6): We used a controlled, traceable data source (ADWRS) with documented scenarios (e.g., C1-11). Data preprocessing, including feature extraction (see step1_extract_features.py) and NaN handling (see step2_prepare_comprehensive_data.py), was codified for reproducibility. A stratified splitting strategy (see step3b_prepare_conv-lstm_data.py) ensured the test set contained operationally relevant hazardous conditions, fulfilling data representativeness requirements.
Model Design and Training (AS6983 Sec 7.1): The architecture was deliberately chosen for its suitability for spatio-temporal radar data. A systematic HPO process using Ray Tune was employed to find optimal parameters, which were documented (see best_hyperparameters_ray.json). The final training utilized a robust methodology with early stopping based on validation loss to prevent overfitting.
Model V&V (AS6983 Sec 7.2, 7.3): Performance was rigorously verified on an independent test set using predefined metrics (RMSE, MAE, POD, FAR), as implemented in our evaluation scripts (see step5b_evaluate_raytune.py). The stratified test set guaranteed verification under the most critical conditions defined in our dataset.
Lifecycle Data (AS6983 Sec 8): All key artifacts of the Machine Learning Development Lifecycle (MLDL)—including data processing scripts, model architecture definitions, training logs, HPO results, and evaluation reports (see evaluation_metrics.txt)—were systematically managed. This structured approach provides a foundation for the traceability and review required in a certified environment.
4. Results
4.1. Experimental Setup
The CNN-BiLSTM-Attention model was evaluated on a test set of 14,524 gate-level data points from two ADWRS scan scenarios. FBAR performance was compared on a subset of 2105 points corresponding to the direct flight path within the wind field.
4.2. Vertical Wind (W) Estimation Performance
Table 2 summarizes the
W estimation performance. The proposed model dramatically improves upon the Vicroy method. The unusually high RMSE for the Vicroy method is a confirmed result for this experiment and is attributed to the challenging nature of the DFW C1-11 test case. Its complex, non-axisymmetric wind fields deviate significantly from the idealized assumptions underpinning the Vicroy model’s empirical K-factors, thereby highlighting the method’s known limitations in such conditions and reinforcing the need for more adaptive models.
Figure 4 shows the strong agreement between the model’s predictions and the ground truth. Some underestimation of strong updrafts is noted, which may be due to their relative rarity in the training data and the nature of the MSE loss function.
Classification performance for strong downdrafts (
W <
) is presented in
Table 3.
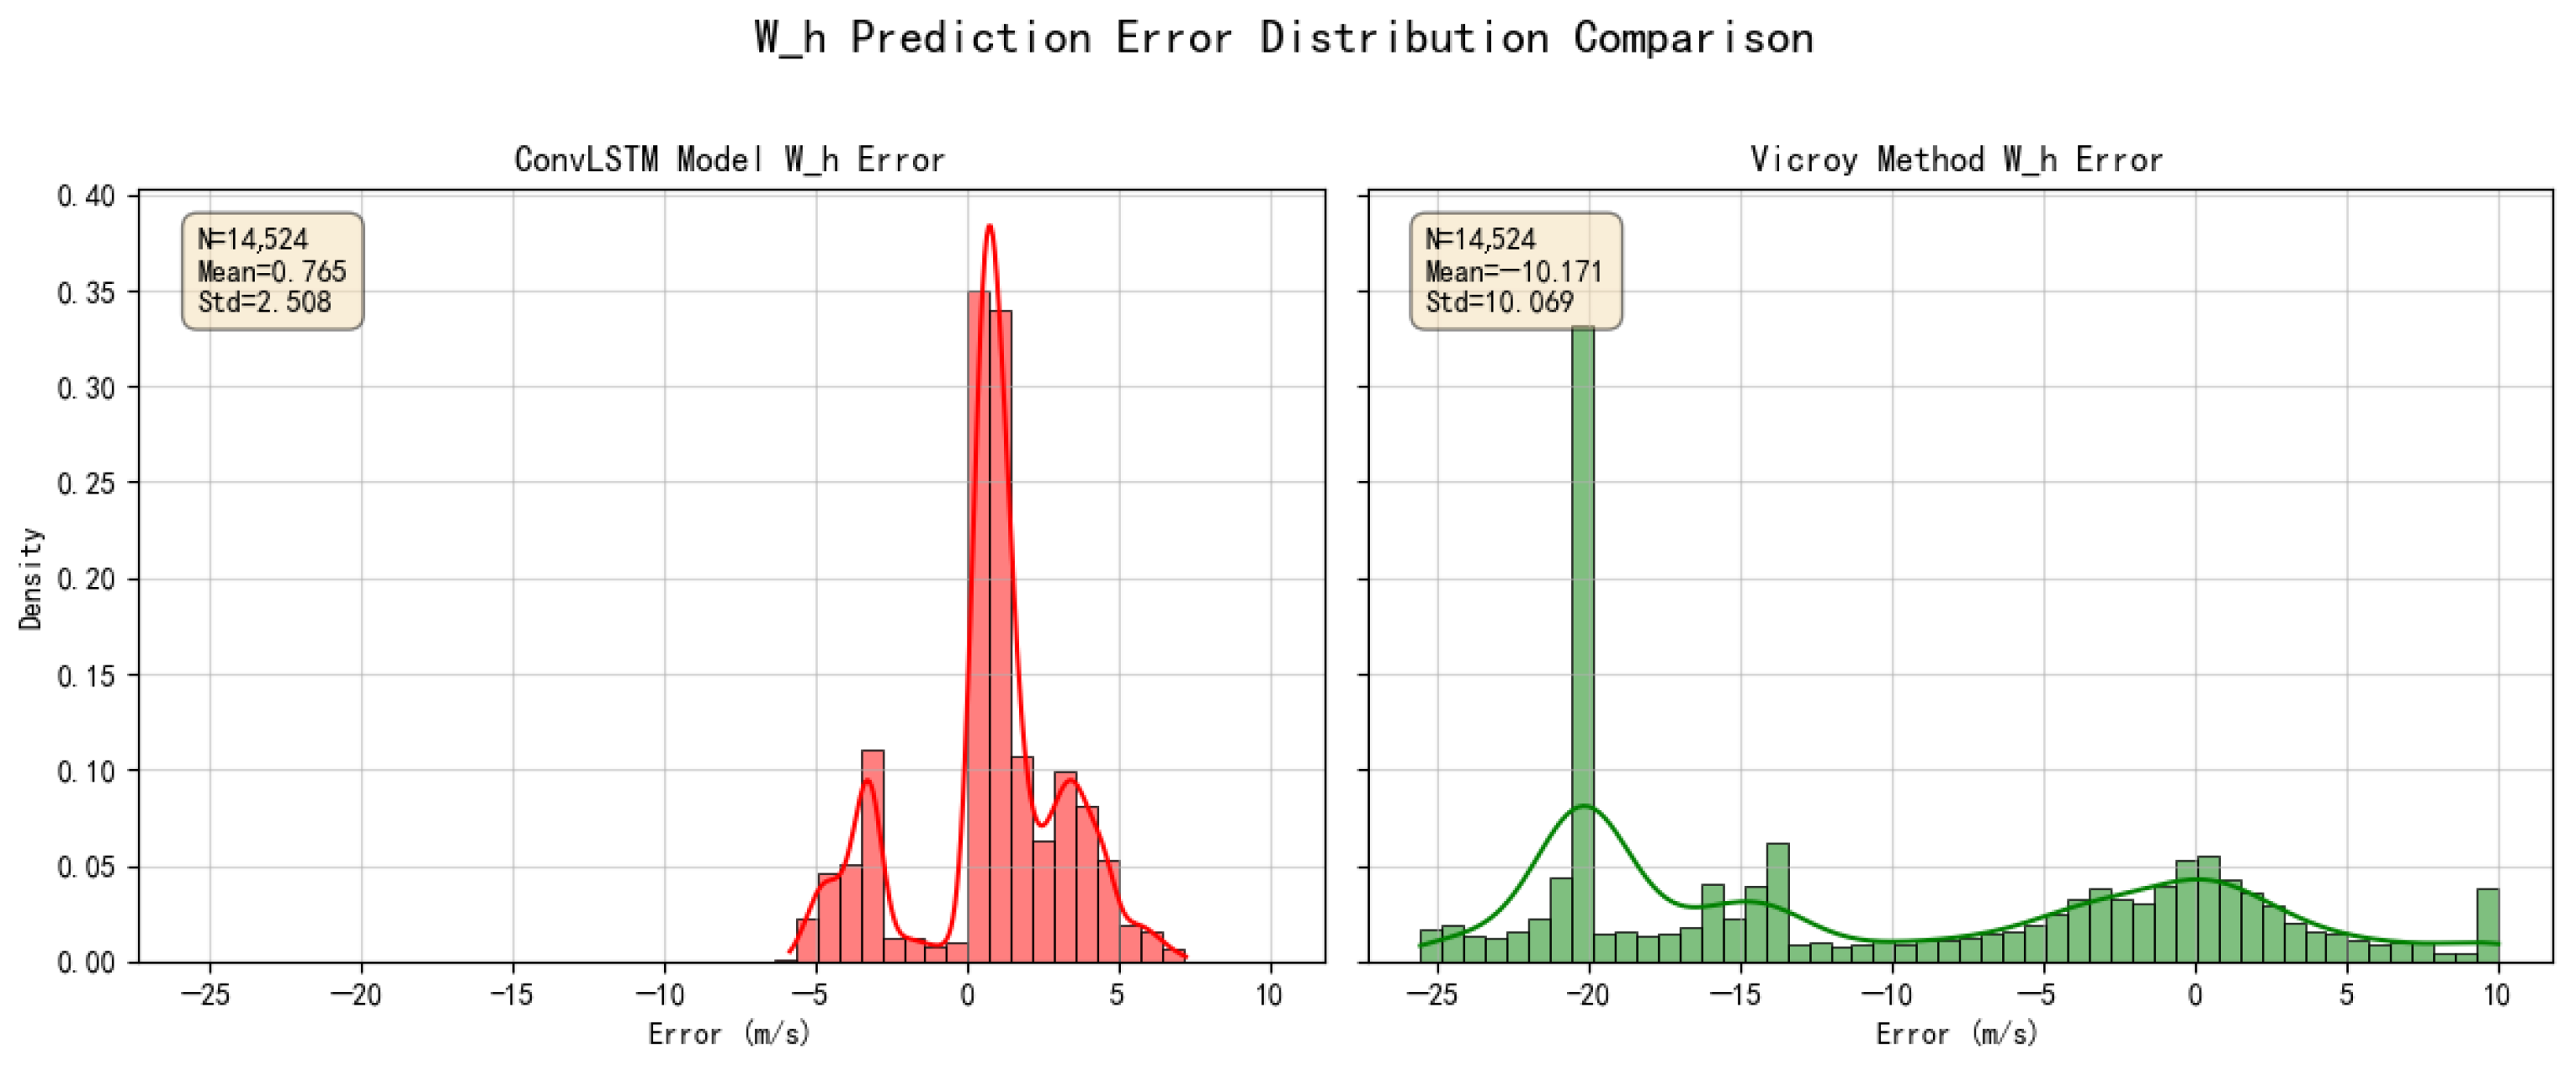
The model achieves a POD of 65.3% with a very low FAR of 1.7%. Error distributions (
Figure 5) show the proposed model’s errors are smaller and more centered around zero than Vicroy’s.
Qualitative examples (
Figure 6) illustrate the model’s ability to track
W variations along scan lines, capturing the general trend and magnitude of vertical winds.
4.3. FBAR Prediction Performance of the Proposed Model
Enhanced
W accuracy significantly improves
FBAR predictions (
Table 4, N = 2105 center-line points).
The model reduces
FBAR RMSE by 98.5% and MAE by 96.1%. Profile plots (
Figure 7 and
Figure 8) visually confirm this.
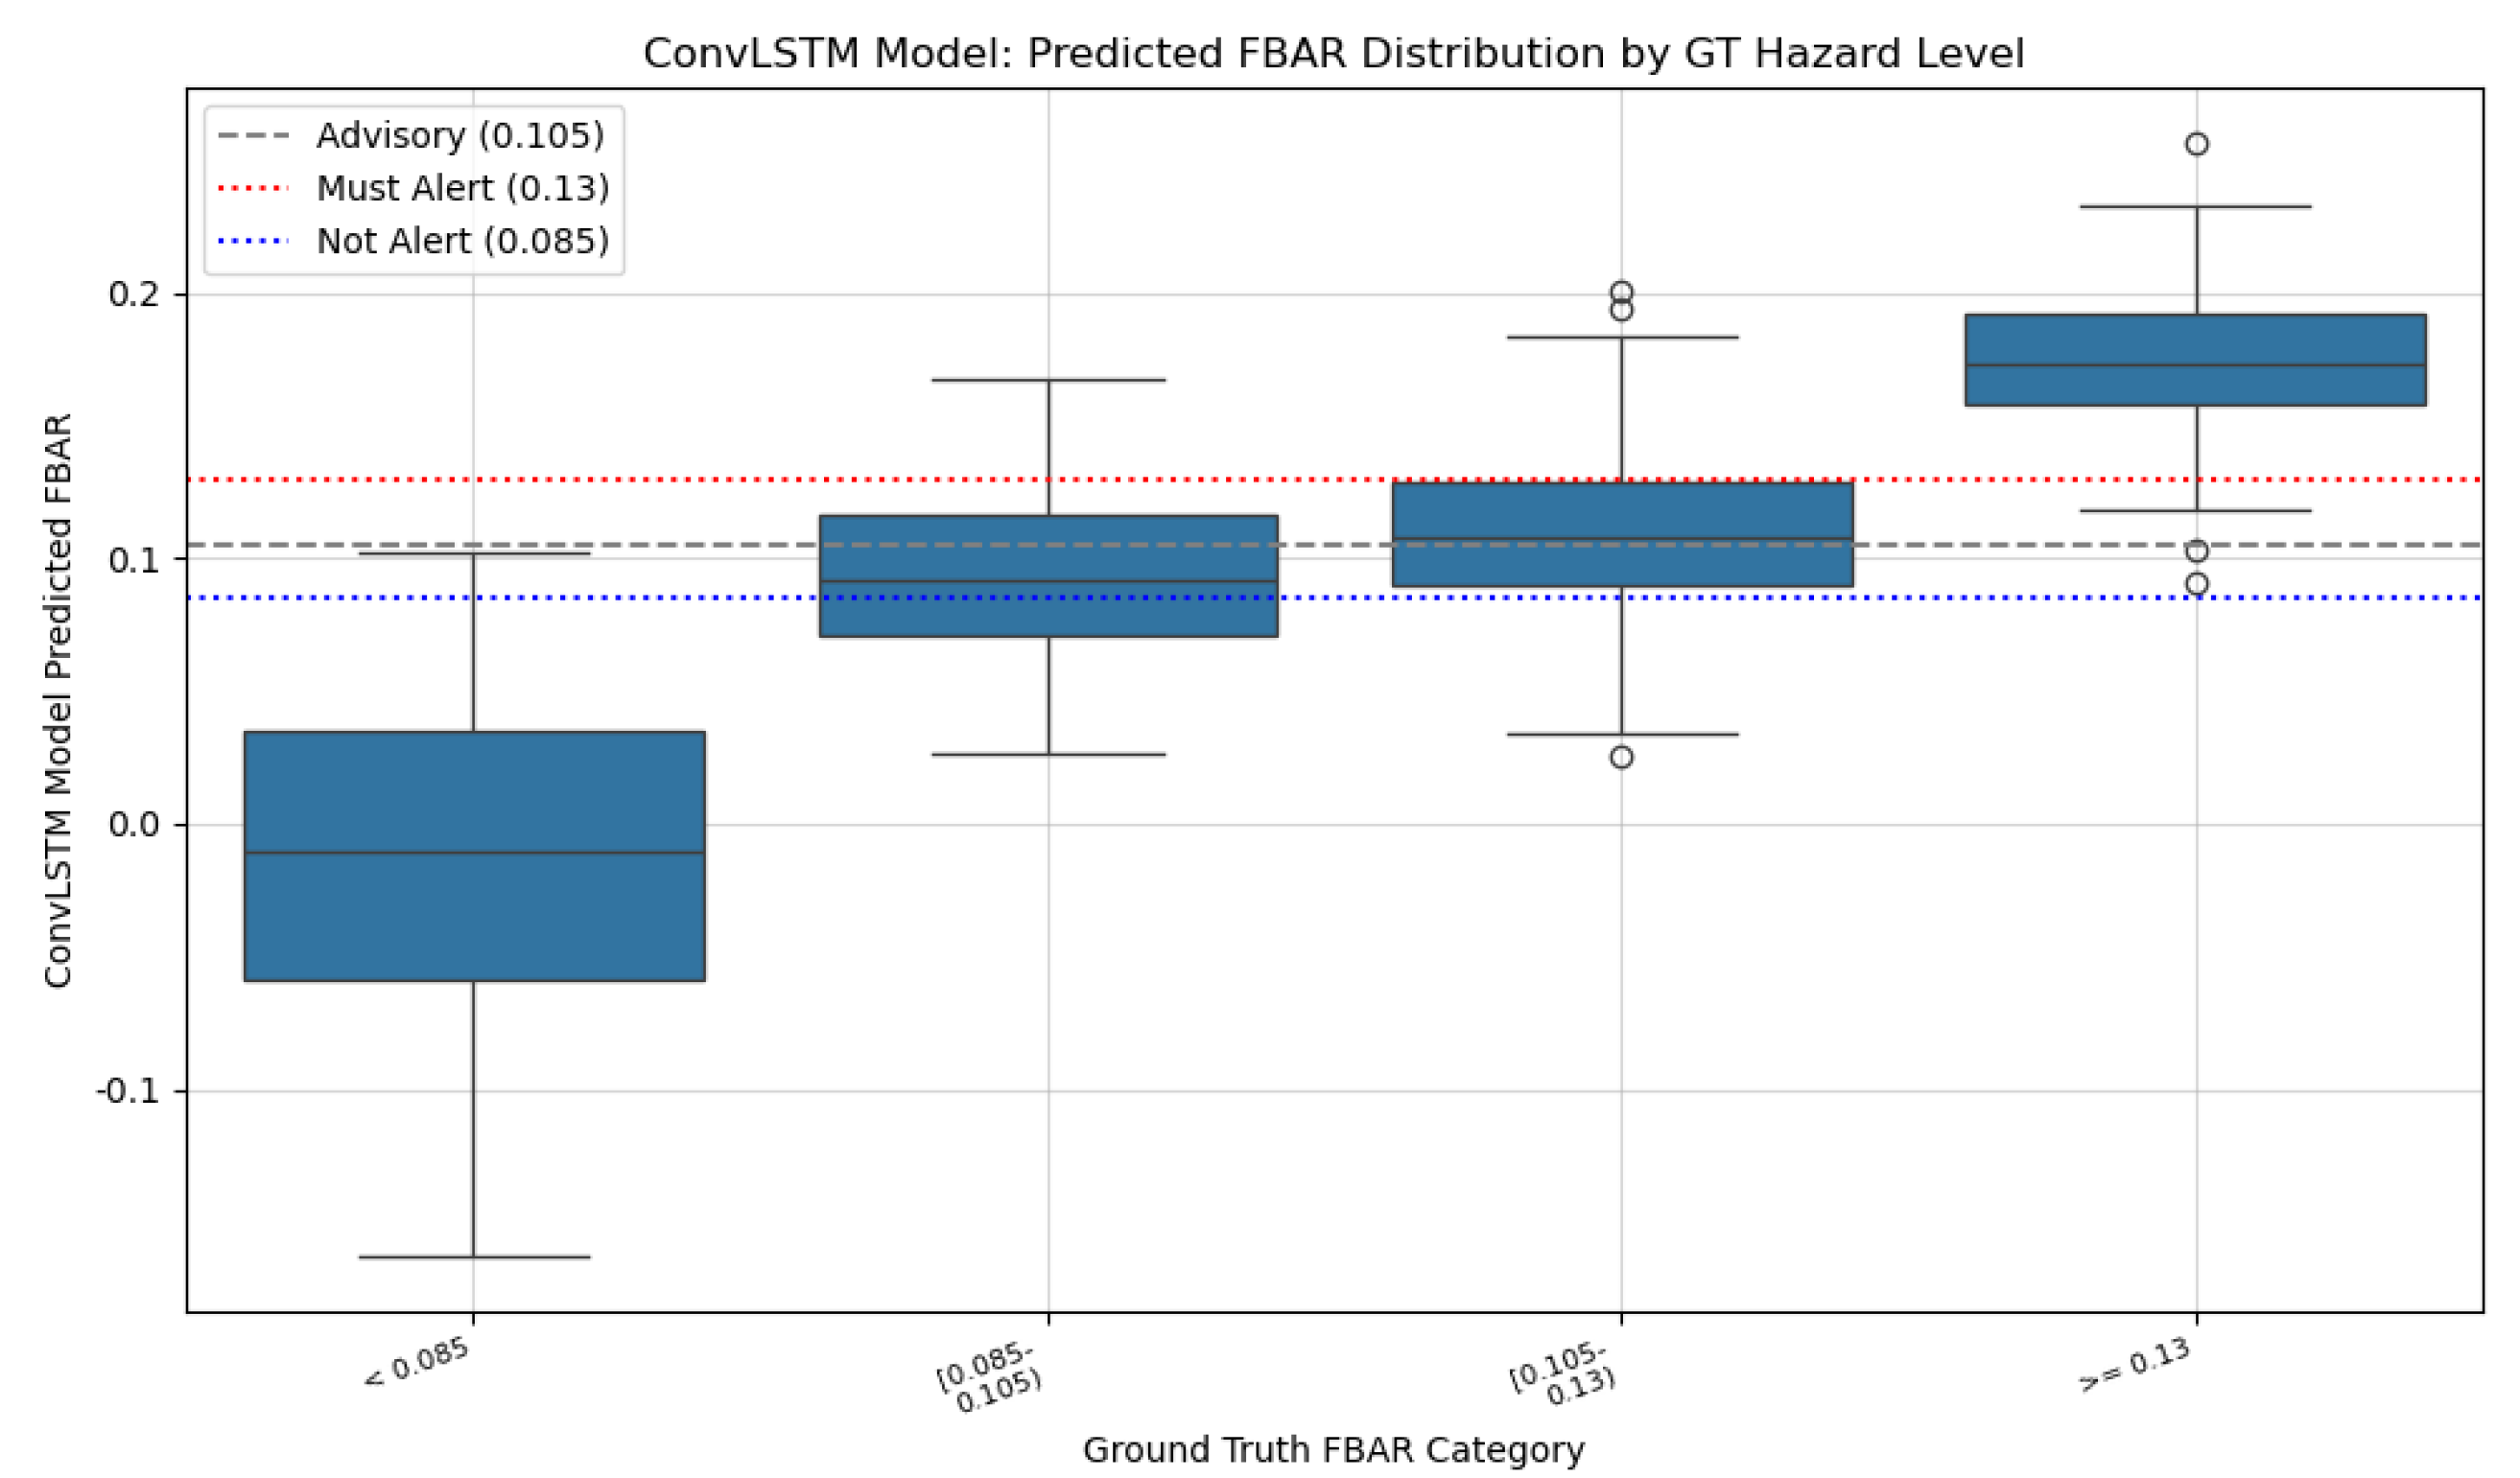
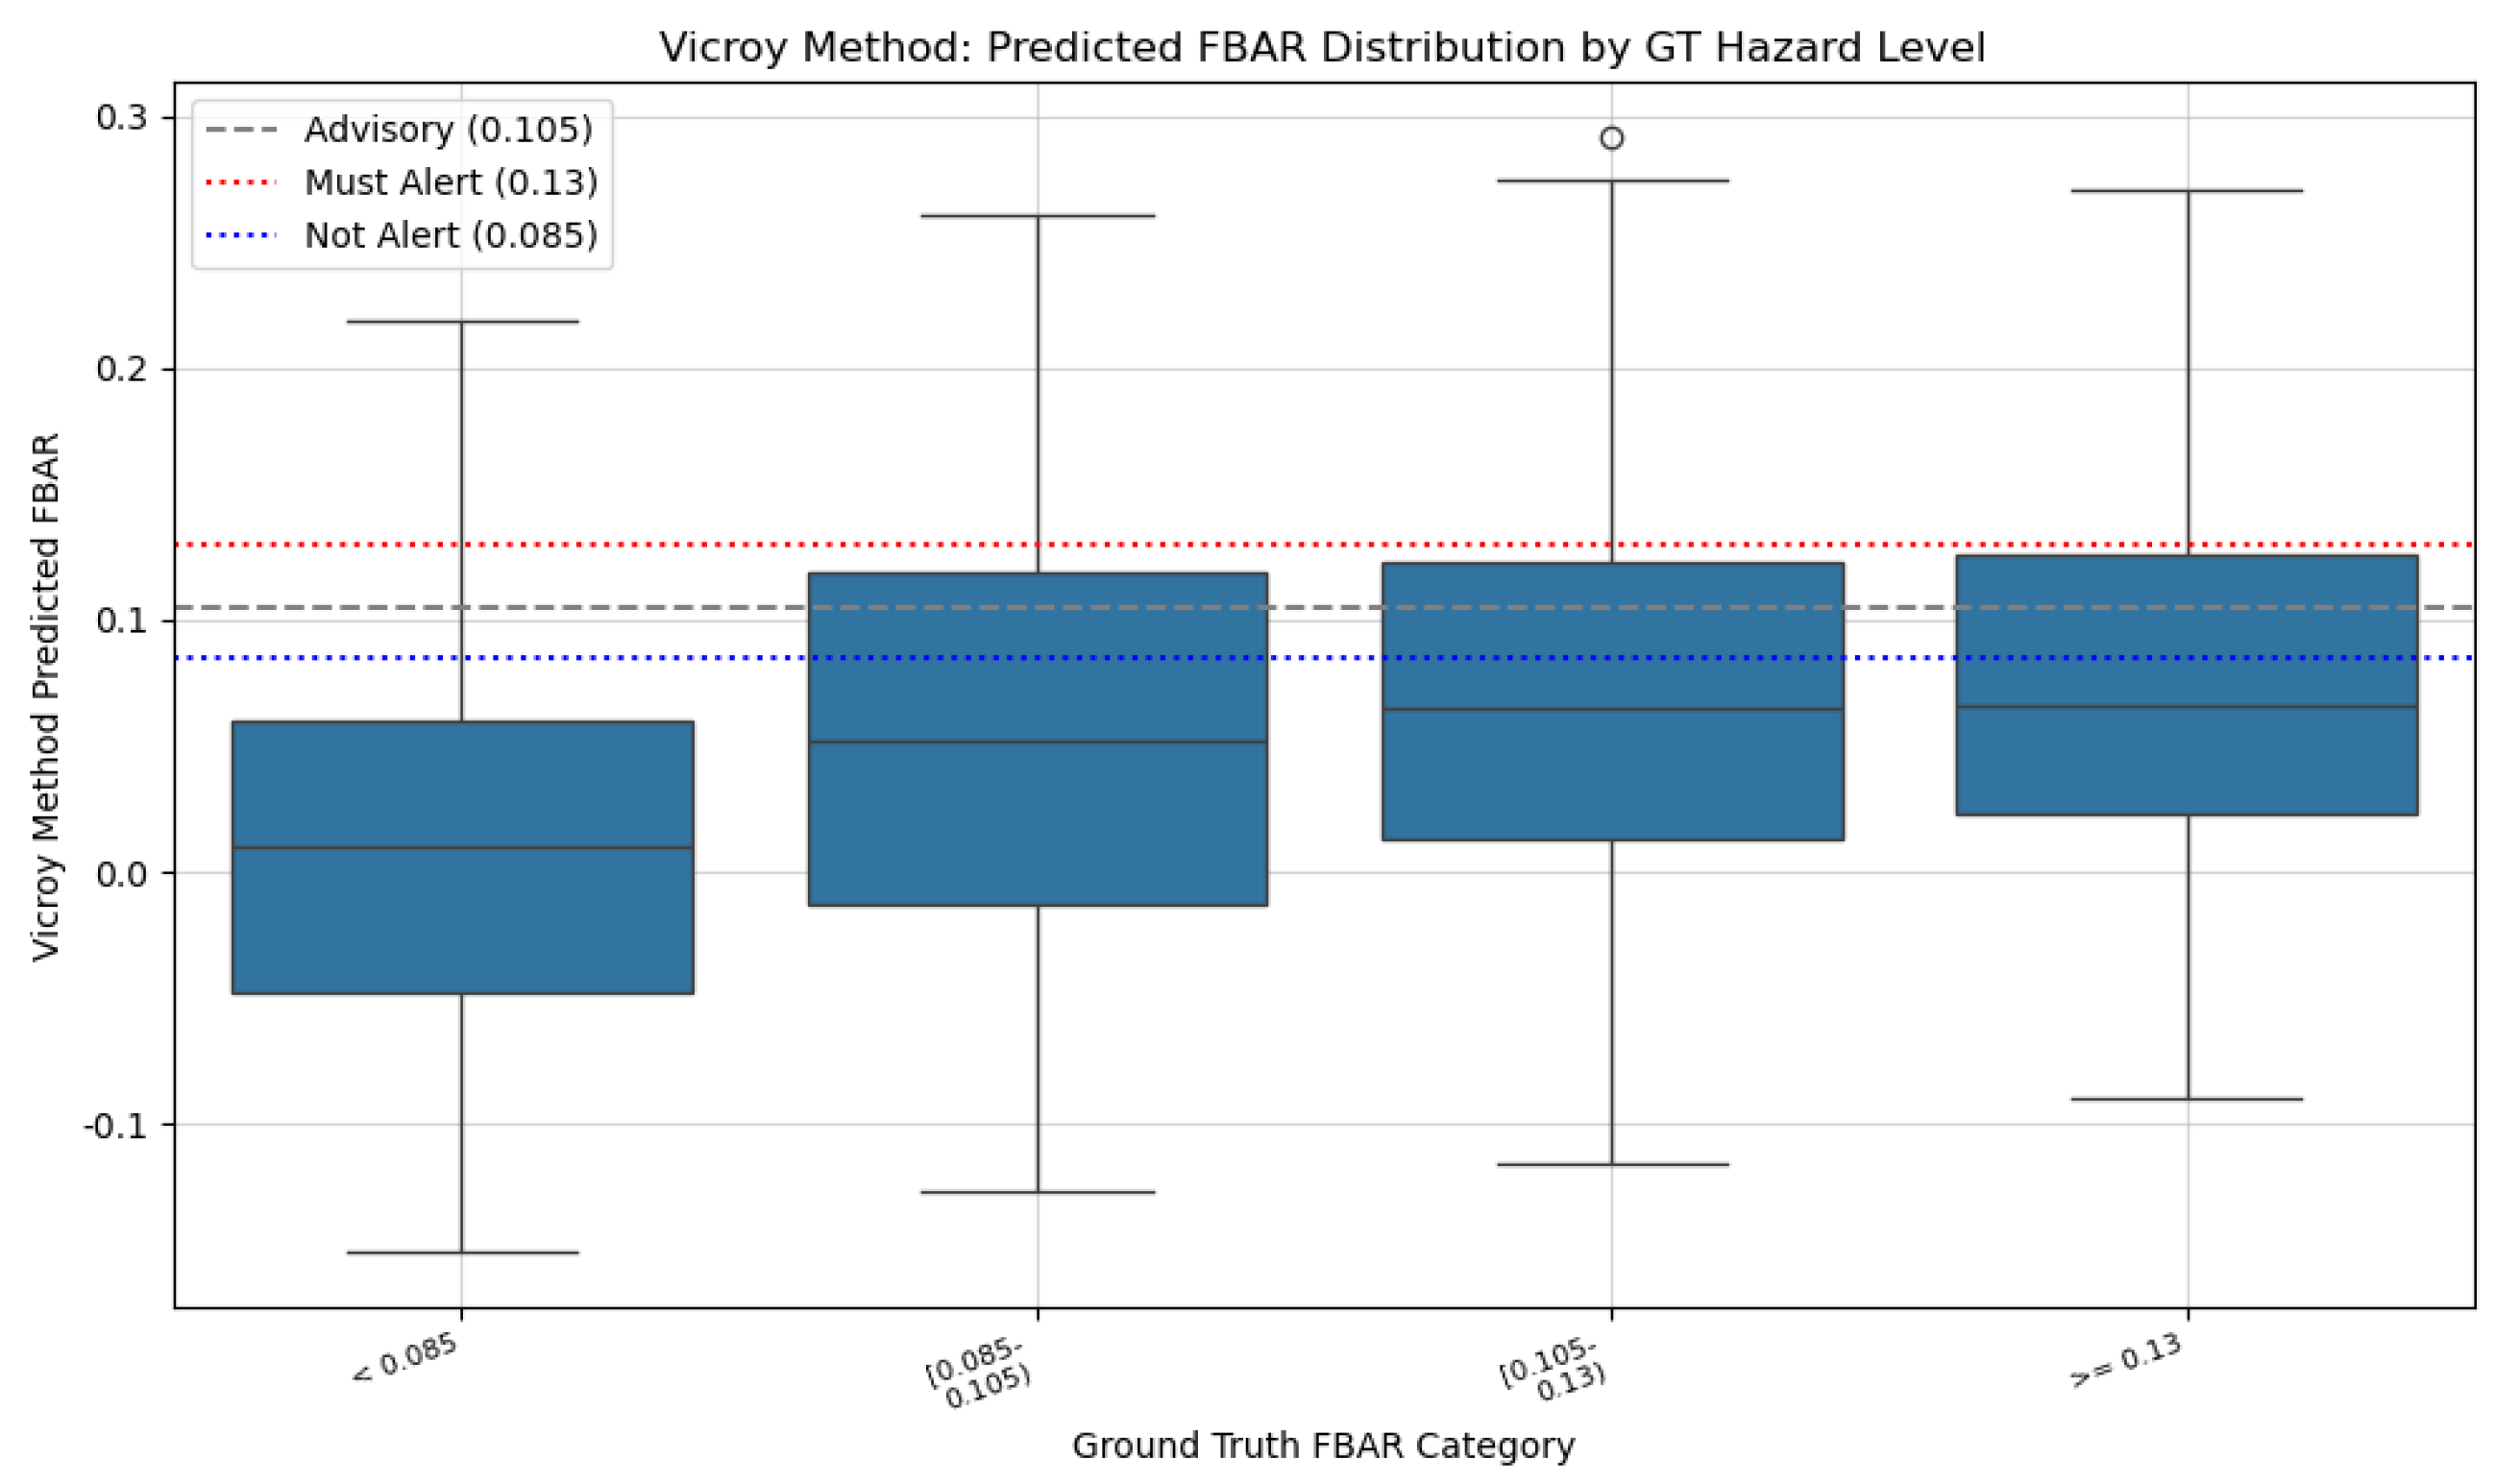
FBAR threshold analysis (
Figure 9 and
Figure 10) shows the proposed model’s superior classification of
FBAR values into hazard categories.
4.4. Performance Comparison with Alternative Machine Learning Methods
A comparative analysis was conducted against alternative ML approaches, as detailed in
Section 3.5. Performance is summarized in
Table 5 for
W and
Table 6 for
FBAR.
5. Discussion
The collective results strongly support the hypothesis that a well-designed deep learning model can significantly enhance W estimation, leading to substantially more accurate FBAR predictions. The proposed model’s RMSE of for W (vs. Vicroy’s ) on the full test set underscores this. The hierarchical structure of the proposed model, processing local features with CNNs (convolutional neural networks), sequential context with BiLSTMs (Bidirectional Long Short-Term Memory), and salient feature weighting with Attention, appears particularly effective. It likely learns to identify precursor patterns in the radar data that are indicative of vertical air motion—relationships that are difficult to encapsulate in fixed empirical rules like those in the Vicroy method. Any perceived differences between the model’s derived F-factor profiles and the raw DFW wind field database are expected, as the model processes simulated radar returns (which include effects like volume averaging) and calculates a derived, smoothed hazard metric (FBAR), rather than directly reporting instantaneous wind speeds. The model’s success suggests an ability to learn a more nuanced and data-adaptive mapping from radar observables to the underlying vertical wind field than is possible with pre-defined physical simplifications. This inherent flexibility as a data-driven pattern-recognition engine suggests the architecture is highly adaptable for other complex atmospheric phenomena, such as turbulence. Unlike traditional methods that rely on rigid, phenomenon-specific rules (e.g., axisymmetry), the proposed model could be retrained on datasets with turbulence metrics (e.g., Eddy Dissipation Rate) to learn their unique radar signatures, offering a versatile tool for a wider range of aviation hazards.
The comparative analysis with alternative machine learning architectures consistently demonstrated the superior or highly competitive performance of the proposed HPO-tuned CNN-BiLSTM-Attention model. While other advanced architectures like the Spatio-Temporal Transformer also surpassed the Vicroy baseline significantly, the proposed model excelled in the fundamental task of W prediction. This superior W estimation is crucial, as it forms the physical basis for FBAR calculation; a model that better understands the underlying vertical wind field is theoretically more likely to produce robust FBAR values across a wider range of conditions.
However, the Spatio-Temporal Transformer model, despite strong FBAR performance, exhibited limitations. A key observation was the spatial sparsity of its underlying W predictions, generating valid estimates for only a small fraction of range gates in the test cases. This sparsity subsequently limited the spatial coverage of the derived FBAR. This contrasts with the proposed CNN-BiLSTM-Attention model, which provides more continuous predictions. This behavior suggests the Transformer architecture might be more sensitive to the completeness of input data windows. In operational scenarios where continuous hazard assessment is critical, this characteristic would need significant improvement.
The model’s compatibility with “clear-air” conditions is demonstrated by its training on entire scan lines, which inherently include not only the high-reflectivity hazardous core but also the surrounding non-hazardous periphery. By learning from these complete sequences, the architecture learns to associate the low-signal characteristics of benign regions with safe, near-zero FBAR outputs. This ability to distinguish non-hazardous clean-air areas from hazardous cores is a key advantage that effectively mitigates the risk of false alerts in the regions adjacent to a weather event.
Despite successes, the proposed model shows some underestimation of peak updrafts and relies on simulated data. From a safety assurance perspective, the systematic development process (HPO, independent testing, documented lifecycle artifacts) aligns with AS6983 principles, providing a foundation for trustworthy ML systems in avionics. The low FAR for hazardous W detection is operationally encouraging for future integration into civil aircraft safety systems. Furthermore, this foundational study focused on performance with high-quality, complete data; the model’s resilience to missing or incorrect individual inputs has not yet been systematically tested. However, we hypothesize that the architecture, which utilizes a comprehensive set of 10 features and an Attention mechanism, may offer greater robustness than methods reliant on fewer inputs. The model could theoretically learn to down-weigh anomalous data points based on the surrounding spatio-temporal context, a hypothesis that requires rigorous verification.
6. Conclusions
This paper has presented a novel CNN-BiLSTM-Attention deep learning model that demonstrates a transformative improvement in estimating vertical wind speed (W) from simulated airborne radar data, directly enhancing the accuracy of F-Factor Along Track (FBAR) predictions. Compared to the traditional Vicroy method, the proposed model reduced W estimation RMSE from to . This translated to a 98.5% reduction in FBAR RMSE, showcasing the model’s ability to learn complex, non-linear relationships from radar signatures that empirical models cannot capture. The scientific contribution lies in demonstrating that a hybrid architecture, systematically optimized, can significantly outperform established methods in a complex geophysical estimation task critical to aviation safety.
A significant aspect of this research was the deliberate effort to align the model’s development with the principles of the emerging SAE AS6983 standard. This included systematic data management, robust model design, and comprehensive verification, providing a blueprint for developing and validating ML systems for safety-critical aeronautical applications. The success of this approach underscores the potential for advanced AI to power the next generation of intelligent, data-informed avionics in civil aircraft.
While the results are highly promising, future work is needed to advance the model towards operational readiness:
Validation on Real-World Airborne Radar Data: This is the most critical next step. Acquiring and evaluating the model on actual flight data are essential to assess its robustness to real-world factors like sensor noise, clutter, and atmospheric variability not present in the simulation.
Expansion and Diversification of Training Data: The training dataset should be expanded with more ADWRS scenarios representing diverse meteorological phenomena (e.g., gust fronts, different microburst types) and dynamic flight conditions (e.g., varying aircraft attitudes) to enhance generalization.
Refinement of Model and Training Process: Explore alternative loss functions (e.g., Huber loss, quantile loss) to improve prediction of rare, extreme events and reduce sensitivity to outliers. Conduct formal statistical significance testing to bolster performance claims.
Explainability, Robustness, and Uncertainty Quantification: To address the critical safety risk of “dangerous residuals” (large prediction errors under specific conditions), a multi-faceted V&V (Verification and Validation) strategy is planned. This includes systematic corner-case testing with simulated sensor noise and edge-of-the-envelope flight conditions. Implementing Explainable AI (XAI) techniques is essential to perform root cause analysis on any significant errors found during testing [
26]. Critically, our future work will focus on uncertainty quantification (UQ), enabling the model to output not just a prediction but also a confidence level. This allows the system to flag or disregard low-confidence estimates, providing a crucial safety layer for certification.
Operational Feasibility Study: Assess computational requirements (inference time, memory) for on-board implementation on representative avionics hardware. This includes exploring model optimization techniques like pruning and quantization.
In conclusion, this research provides compelling evidence that specifically designed deep learning methodologies can revolutionize airborne wind shear detection for civil aviation. The substantial improvements in hazard prediction, coupled with a safety-conscious development process, pave the way for a new generation of more reliable and effective weather avoidance systems, significantly enhancing global aviation safety.
Author Contributions
Conceptualization, F.H.; methodology, F.H.; software, F.H.; validation, F.H.; formal analysis, F.H.; investigation, F.H.; resources, F.H.; data curation, F.H.; writing—original draft preparation, F.H.; writing—review and editing, F.H.; visualization, F.H.; supervision, G.S. All authors have read and agreed to the published version of the manuscript.
Funding
This research received no external funding.
Institutional Review Board Statement
Not applicable.
Informed Consent Statement
Not applicable.
Data Availability Statement
The data presented in this study are available on request from the corresponding author. The simulation data are based on the publicly available “Windshear Database for Forward-Looking Systems Certification” provided by NASA, ensuring the foundational atmospheric conditions are reproducible.
Acknowledgments
The authors would like to thank the developers of the Airborne Doppler Weather Radar Simulation (ADWRS) system and the providers of the DFW wind shear database for making their tools and data available to the research community.
Conflicts of Interest
The authors declare no conflicts of interest.
Abbreviations
The following abbreviations are used in this manuscript:
| ADWRS | Airborne Doppler Weather Radar Simulation |
| AGL | Above Ground Level |
| CNN | Convolutional Neural Network |
| DAL | Design Assurance Level |
| DFW | Dallas–Fort Worth |
| FBAR | F-Factor Averaged over a One-Kilometer Radial Distance |
| LSTM | Long Short-Term Memory |
| MAE | Mean Absolute Error |
| ML | Machine Learning |
| MLDL | Machine Learning Development Lifecycle |
| MLP | Multi-Layer Perceptron |
| MSE | Mean Squared Error |
| OLS | Ordinary Least Squares |
| OOD | Out-Of-Distribution |
| POD | Probability of Detection |
| RMSE | Root-Mean-Squared Error |
| V&V | Verification and Validation |
| W | Vertical Wind Speed |
| XAI | Explainable Artificial Intelligence |
References
- International Civil Aviation Organization. Manual on Low-level Wind Shear, 1st ed.; Doc 9817, AN/449; ICAO: Montreal, QC, Canada, 2005. [Google Scholar]
- Etkin, B. The Turbulent Wind and Its Effect on Flight. J. Aircr. 1981, 18, 327–345. [Google Scholar] [CrossRef]
- RTCA, Inc. Minimum Operational Performance Standards (MOPS) for Airborne Weather Radar Systems with Forward-Looking Windshear Detection Capability; RTCA DO-220A Change 1; RTCA, Inc.: Washington, DC, USA, 2018. [Google Scholar]
- Bowles, R.L. Reducing windshear risk through airborne systems technology. In Proceedings of the 17th Congress of the International Council of the Aeronautical Sciences (ICAS), Stockholm, Sweden, 9–14 September 1990; pp. 1603–1630. [Google Scholar]
- Arbuckle, P.D.; Lewis, M.S.; Hinton, D.A. Airborne Systems Technology Application to the Windshear Threat; NASA-TM-111452; NASA Langley Research Center: Hampton, VA, USA, 1996.
- Vicroy, D.D. Microburst Vertical Wind Estimation from Horizontal Wind Measurements; NASA-TP-3460; NASA Langley Research Center: Hampton, VA, USA, 1994.
- Proctor, F.H.; Hinton, D.A. A Windshear Hazard Index. In Proceedings of the 9th Conference on Aviation, Range and Aerospace Meteorology, Orlando, FL, USA, 11–15 September 2000; American Meteorological Society: Boston, MA, USA, 2000; pp. 482–487. [Google Scholar]
- LeCun, Y.; Bengio, Y.; Hinton, G. Deep learning. Nature 2015, 521, 436–444. [Google Scholar] [CrossRef] [PubMed]
- Goodfellow, I.; Bengio, Y.; Courville, A. Deep Learning; MIT Press: Cambridge, MA, USA, 2016. [Google Scholar]
- Shi, X.; Chen, Z.; Wang, H.; Yeung, D.Y.; Wong, W.K.; Woo, W.C. Convolutional LSTM Network: A Machine Learning Approach for Precipitation Nowcasting. In Advances in Neural Information Processing Systems 28; Cortes, C., Lawrence, N.D., Lee, D.D., Sugiyama, M., Garnett, R., Eds.; Curran Associates, Inc.: Red Hook, NY, USA, 2015; pp. 802–810. [Google Scholar]
- Shi, X.; Gao, Z.; Lausen, L.; Wang, H.; Yeung, D.Y.; Wong, W.K.; Woo, W.C. Deep Learning for Precipitation Nowcasting: A Benchmark and a New Model. In Advances in Neural Information Processing Systems 30; Guyon, I., Luxburg, U.V., Bengio, S., Wallach, H., Fergus, R., Vishwanathan, S., Garnett, R., Eds.; Curran Associates, Inc.: Red Hook, NY, USA, 2017; pp. 5617–5627. [Google Scholar]
- Chase, R.J.; McGovern, A.; Homeyer, C.R.; Marinescu, P.J.; Potvin, C.K. Machine Learning Estimation of Maximum Vertical Velocity from Radar. Artif. Intell. Earth Syst. 2024, 3, 127–143. [Google Scholar] [CrossRef]
- Ibrahim, M.; Alsheikh, A.; Al-Hindawi, Q.; Al-Dahidi, S.; ElMoaqet, H. Short-Time Wind Speed Forecast Using Artificial Learning-Based Algorithms. Comput. Intell. Neurosci. 2020, 2020, 8439719. [Google Scholar] [CrossRef] [PubMed]
- SAE International G-34 Committee on Artificial Intelligence in Aviation. Process Standard for Development and Certification/Approval of Aeronautical Safety-Related Products Implementing AI; AS6983 Draft 4B; SAE International: Warrendale, PA, USA, 2022. [Google Scholar]
- Wang, J.; Li, Z. Wind speed interval prediction based on multidimensional time series of Convolutional Neural Networks. Eng. Appl. Artif. Intell. 2023, 121, 105987. [Google Scholar] [CrossRef]
- Ren, X.; Li, X.; Ren, K.; Song, J.; Xu, Z.; Deng, K.; Wang, X. Deep Learning-Based Weather Prediction: A Survey. Big Data Res. 2020, 23, 100178. [Google Scholar] [CrossRef]
- Shi, J.; Shirali, A.; Jin, B.; Zhou, S.; Hu, W.; Rangaraj, R.; Wang, S.; Han, J.; Wang, Z.; Lall, U.; et al. Deep Learning and Foundation Models for Weather Prediction: A Survey. arXiv 2024, arXiv:2401.06907. [Google Scholar]
- RTCA, Inc. DO-178C / ED-12C, Software Considerations in Airborne Systems and Equipment Certification; RTCA, Inc.: Washington, DC, USA, 2011. [Google Scholar]
- Gentile, G.; Kaakai, F.; Dmitriev, K.; Adibhatla, S.; Baskaya, E.; Bezzecchi, E.; Bharadwaj, R.; Brown, B.; Gingins, C.; Grihon, S.; et al. Toward a Machine Learning Development Lifecycle for Product Certification and Approval in Aviation. SAE Int. J. Aerosp. 2022, 15, 127–143. [Google Scholar] [CrossRef]
- Switzer, G.F.; Proctor, F.H.; Hinton, D.A.; Aanstoos, J.V. Windshear Database for Forward-Looking Systems Certification; NASA-TM-109012; NASA Langley Research Center: Hampton, VA, USA, 1993.
- Fujita, T.T. DFW Microburst on August 2, 1985; SMRP Research Paper No. 217; University of Chicago Press: Chicago, IL, USA, 1986. [Google Scholar]
- Hochreiter, S.; Schmidhuber, J. Long Short-Term Memory. Neural Comput. 1997, 9, 1735–1780. [Google Scholar] [CrossRef] [PubMed]
- Vaswani, A.; Shazeer, N.; Parmar, N.; Uszkoreit, J.; Jones, L.; Gomez, A.N.; Kaiser, Ł.; Polosukhin, I. Attention is All you Need. In Advances in Neural Information Processing Systems 30; Guyon, I., Luxburg, U.V., Bengio, S., Wallach, H., Fergus, R., Vishwanathan, S., Garnett, R., Eds.; Curran Associates, Inc.: Red Hook, NY, USA, 2017. [Google Scholar]
- Kingma, D.P.; Ba, J. Adam: A Method for Stochastic Optimization. arXiv 2014, arXiv:1412.6980. [Google Scholar]
- Liaw, R.; Liang, E.; Nishihara, R.; Moritz, P.; Gonzalez, J.E.; Stoica, I. Tune: A Research Platform for Distributed Model Selection and Training. arXiv 2018, arXiv:1807.05118. [Google Scholar] [CrossRef]
- Yang, R.; Hu, J.; Li, Z.; Mu, J.; Yu, T.; Xia, J.; Li, X.; Dasgupta, A.; Xiong, H. Interpretable machine learning for weather and climate prediction: A review. Atmos. Environ. 2024, 338, 120797. [Google Scholar] [CrossRef]
Figure 1.
Conceptual overview of the research methodology, highlighting the flow from data simulation to model evaluation and safety considerations.
Figure 1.
Conceptual overview of the research methodology, highlighting the flow from data simulation to model evaluation and safety considerations.
Figure 2.
Schematic of the CNN-BiLSTM-Attention model architecture used for W estimation. Hyperparameters shown are the optimized values from the HPO process.
Figure 2.
Schematic of the CNN-BiLSTM-Attention model architecture used for W estimation. Hyperparameters shown are the optimized values from the HPO process.
Figure 3.
Training and validation loss curves for the final model. Early stopping based on validation loss prevents overfitting.
Figure 3.
Training and validation loss curves for the final model. Early stopping based on validation loss prevents overfitting.
Figure 4.
Scatter plot: Proposed model predicted W vs. actual W on the test set (N = 14,524 points). RMSE = , correlation = 0.974.
Figure 4.
Scatter plot: Proposed model predicted W vs. actual W on the test set (N = 14,524 points). RMSE = , correlation = 0.974.
Figure 5.
Error distribution for W estimation: Proposed model (left, red) vs. Vicroy method (right, green) on the test set. Note the different x-axis scales, highlighting the large error range of the Vicroy method.
Figure 5.
Error distribution for W estimation: Proposed model (left, red) vs. Vicroy method (right, green) on the test set. Note the different x-axis scales, highlighting the large error range of the Vicroy method.
Figure 6.
Examples of proposed model’s W prediction (red dashed lines) vs. actual W (blue solid lines) on selected test set sequences.
Figure 6.
Examples of proposed model’s W prediction (red dashed lines) vs. actual W (blue solid lines) on selected test set sequences.
Figure 7.
FBAR profile comparison for test scan 1, line 30. The model-derived
FBAR (black solid line, labeled “
FBAR”) closely tracks the complex ground truth profile (not explicitly plotted but represented by the accurate model
FBAR), whereas a Vicroy-derived
FBAR would exhibit large deviations (per
Table 4).
Figure 8.
FBAR profile comparison for test scan 9, line 30. GT FBAR (black), Vicroy FBAR (green), proposed model FBAR (magenta). Hazard thresholds are shown.
Figure 8.
FBAR profile comparison for test scan 9, line 30. GT FBAR (black), Vicroy FBAR (green), proposed model FBAR (magenta). Hazard thresholds are shown.
Figure 9.
Proposed model: Predicted FBAR distribution by ground truth FBAR hazard category (N = 2105).
Figure 9.
Proposed model: Predicted FBAR distribution by ground truth FBAR hazard category (N = 2105).
Figure 10.
Vicroy method: Predicted FBAR distribution by ground truth FBAR hazard category (N = 2105).
Figure 10.
Vicroy method: Predicted FBAR distribution by ground truth FBAR hazard category (N = 2105).
Table 1.
Impact of hyperparameter variations on validation loss (MSE) during HPO. Baseline (optimal) validation loss ≈ 0.1189.
Table 1.
Impact of hyperparameter variations on validation loss (MSE) during HPO. Baseline (optimal) validation loss ≈ 0.1189.
| Parameter Varied | Setting (Trial ID Suffix) | Validation Loss (MSE) |
|---|
| Baseline (Optimal HPO-Derived) | As per Section 3.2 | 0.1189 |
| LSTM Hidden Size (per dir.) | 64 (_002) | 3.8785 |
| 192 (_000) | 0.2354 |
| LSTM Layers | 1 (_001) | 0.2291 |
| 2 (_010, Conv.Ch = 48, Drop = 0.1455) | 0.8356 |
| Residual Connections | False (_004) | 16.5227 |
Table 2.
W Estimation regression performance on the full test set (N = 14,524 points).
Table 2.
W Estimation regression performance on the full test set (N = 14,524 points).
| Method | RMSE (m s) | MAE (m s) | Correlation |
|---|
| Proposed Model (CNN-BiLSTM-Attention) | 0.6233 | 0.3254 | 0.9736 |
| Vicroy Method | 14.3120 | 11.7693 | 0.1377 |
Table 3.
Proposed model W classification performance for strong downdrafts (W < ) on the test set (N = 14,524 points).
Table 3.
Proposed model W classification performance for strong downdrafts (W < ) on the test set (N = 14,524 points).
| Metric | TP | FN | FP | TN | Value |
|---|
| CSI | 1262 | 671 | 22 | 12,569 | 0.6455 |
| POD | 0.6529 |
| FAR | 0.0171 |
Table 4.
FBAR prediction performance comparison (N = 2105 points from center line, within wind field of test scans).
Table 4.
FBAR prediction performance comparison (N = 2105 points from center line, within wind field of test scans).
| FBAR Source (Wh Estimate from) | RMSE | MAE | Correlation |
|---|
| Proposed Model (CNN-BiLSTM-Attention) | 0.0591 | 0.0434 | 0.8876 |
| Vicroy Method | 4.0535 | 1.1101 | 0.0801 |
| Improvement (RMSE) | 98.54% |
| Improvement (MAE) | 96.09% |
Table 5.
W Estimation performance comparison: Proposed model vs. alternative ML methods and Vicroy baseline a.
Table 5.
W Estimation performance comparison: Proposed model vs. alternative ML methods and Vicroy baseline a.
| Method | RMSE (m s) | MAE (m s) | Correlation | N (Points) |
|---|
| Vicroy Method (Baseline) | 14.3120 | 11.7693 | 0.1377 | 14,524 |
| MLP-Enhanced Vicroy (K-Factor) | 10.4716 | 9.1959 | 0.0803 | 204 |
| MLP-Corrected Vicroy () | 7.8752 | 6.7209 | −0.0230 | 204 |
| Direct MLP (+Ref) | 0.8845 | 0.6445 | 0.7009 | 204 |
| Physics-Informed ConvLSTM | 0.3763 | 0.3202 | 0.7869 | 1254 |
| Spatio-Temporal Transformer | 1.2516 | 1.1642 | 0.9100 | 1010 |
| Proposed CNN-BiLSTM-Attention Model | 0.6233 | 0.3254 | 0.9736 | 14,524 |
Table 6.
FBAR prediction performance comparison: Proposed model vs. selected advanced ML methods and Vicroy baseline.
Table 6.
FBAR prediction performance comparison: Proposed model vs. selected advanced ML methods and Vicroy baseline.
| FBAR Source (W Estimate from) | RMSE | MAE | Correlation | N (Points) |
|---|
| Vicroy Method (Baseline) | 4.0535 | 1.1101 | 0.0801 | 2105 |
| Physics-Informed ConvLSTM | 0.0604 | 0.0444 | 0.8903 | 1952 |
| Spatio-Temporal Transformer | 0.0555 | 0.0306 | 0.9014 | 1093 |
| Proposed CNN-BiLSTM-Attention Model | 0.0591 | 0.0434 | 0.8876 | 2105 |
| Disclaimer/Publisher’s Note: The statements, opinions and data contained in all publications are solely those of the individual author(s) and contributor(s) and not of MDPI and/or the editor(s). MDPI and/or the editor(s) disclaim responsibility for any injury to people or property resulting from any ideas, methods, instructions or products referred to in the content. |
© 2025 by the authors. Licensee MDPI, Basel, Switzerland. This article is an open access article distributed under the terms and conditions of the Creative Commons Attribution (CC BY) license (https://creativecommons.org/licenses/by/4.0/).


