Article

Wind Tunnel Experimental Study on Dynamic Coupling Characteristics of Flexible Refueling Hose–Drogue System

Institute of Aerospace Technology, China Aerodynamics Research and Development Center, Mianyang 621000, China
*
Author to whom correspondence should be addressed.
Aerospace 2025, 12(7), 646; https://doi.org/10.3390/aerospace12070646
Submission received: 26 May 2025 / Revised: 10 July 2025 / Accepted: 16 July 2025 / Published: 21 July 2025
(This article belongs to the Section Aeronautics)

Abstract

During the process of flexible aerial refueling, the flexible structure of the hose drogue assembly is affected by internal and external interference, such as docking maneuvering, deformation of the hose, attitude changes, and body vibrations, causing the hose to swing and the whipping phenomenon, which greatly limits the success rate and safety of aerial refueling operations. Based on a 2.4 m transonic wind tunnel, high-speed wind tunnel test technology of a flexible aerial refueling hose–drogue system was established to carry out experimental research on the coupling characteristics of aerodynamics and multi-body dynamics. Based on the aid of Videogrammetry Model Deformation (VMD), high-speed photography, dynamic balance, and other wind tunnel test technologies, the dynamic characteristics of the hose–drogue system in a high-speed airflow and during the approach of the receiver are obtained. Adopting flexible multi-body dynamics, a dynamic system of the tanker, hose, drogue, and receiver is modeled. The cable/beam model is based on an arbitrary Lagrange–Euler method, and the absolute node coordinate method is used to describe the deformation, movement, and length variation in the hose during both winding and unwinding. The aerodynamic forces of the tanker, receiver, hose, and drogue are modeled, reflecting the coupling influence of movement of the tanker and receiver, the deformation of the hose and drogue, and the aerodynamic forces on each other. The tests show that during the approach of the receiver (distance from 1000 mm to 20 mm), the sinking amount of the drogue increases by 31 mm; due to the offset of the receiver probe, the drogue moves sideways from the symmetric plane of the receiver. Meanwhile, the oscillation magnitude of the drogue increases (from 33 to 48 and from 48 to 80 in spanwise and longitudinal directions, respectively). The simulation results show that the shear force induced by the oscillation of the hose and the propagation velocity of both the longitudinal and shear waves are affected by the hose stiffness and Mach number. The results presented in this work can be of great reference to further increase the safety of aerial refueling.

1. Introduction

Aerial refueling refers to the technology that an aircraft carrying fuel (tanker) refuels another aircraft (receiver) at high altitude with refueling equipment. It allows fuel supplementation during flight, which greatly increases the cruising range and flight duration of the receiver. Aerial refueling technology has been widely developed over the last decades. Using aerial refueling technology to provide aerial refueling services for large cargo aircraft can greatly increase the transportation distance of cargo aircraft, increase the payload of cargo aircraft, and reduce the operating cost of cargo aircraft, so it has broad application prospects in commercial and other fields.
There are two main approaches to aerial refueling: one is a hose–drogue type [1,2], also known as a soft hose type, and the other is a telescopic tube type [3,4], also known as a hard tube type. The equipment used in soft-hose-type aerial refueling is called a refueling pod or refueling platform, which is installed inside the fuselage or under the wing of the tanker, and the nose of the receiver is equipped with a fixed or retractable oil receiver probe [5]. When refueling, the hose is extended from inside the refueling platform, the end of which is equipped with an umbrella-shaped drogue with a self-locking mechanism to prevent unwanted undocking during the refueling, forming a hose–drogue assembly. The receiver approaches the tanker on a designated path to form a refueling formation and tries to capture the drogue with its receiver probe in a stable approaching state. After successful capture, the self-locking mechanism works to maintain the docking, providing a stable window for the fuel to be transferred. After fuel transferring, as the receiver leaves the refueling formation, the docking load reaches a critical value, triggering the self-locking mechanism to release the receiver probe [6]. The efficiency of soft hose refueling is not as high as that of hard tube refueling when it comes to refueling a single receiver [7]. However, due to its multi-objective refueling ability and considerably low maintenance cost, soft hose refueling has become the most extensive aerial refueling method at present [8].
Air refueling consists of five stages [9,10]: a rendezvous stage, formation stage, docking stage, refueling stage, and disconnect stage. During the formation and docking stages, some unwanted phenomena may occur, such as bending, drifting, shaking, and oscillation of the hose, swinging of the drogue, and collision between the drogue and the pod hatch while winding. The deformation and movement of the hose and drogue are mainly determined by the aerodynamic force acting on them. The complex aerodynamic force acting on the refueling hose–drogue system directly affects the difficulty of refueling docking. The dynamic characteristics of the hose–drogue system play a very important role in the process of flexible aerial refueling. Research on the accurate dynamic behavior of the hose and drogue during docking and oil transferring is a necessary prerequisite for successful refueling.
There are three main approaches in the investigations of dynamic characteristics of the hose and drogue: a numerical simulation [11,12], a wind tunnel test [13], and a flight test [14]. Chen [1] carried out investigations on the motion characteristics of the drogue at different docking velocities in the docking process by numerical simulation, summarized the motion law of the drogue, and provided aerodynamic technical reference for aerial refueling. Hao et al. [14] conducted flight tests to analyze the swing characteristics of the drogue, which has referential significance for future numerical simulations of the drogue swinging, future flexible aerial refueling flight tests, and also refuel docking safety. Ro et al. [14,15] conducted both wind tunnel tests and CFD simulations to investigate the aerodynamic characteristics of the hose–drogue assembly, especially the aerodynamic drag characteristics of the drogues with different geometric configurations, and established an empirical model based on statistics to predict the drag coefficient of the drogues with different geometric configurations.
An experimental test is one of the main approaches in investigations of the aerial refueling process, which includes a ground test and a flight test. Compared to a CFD simulation, a wind tunnel test is capable of creating a more realistic environment and obtaining more convincing results. On the other hand, compared to flight tests, wind tunnel studies of the air refueling hose–drogue system are safer, more efficient, and more cost-effective. Huang et al. [13] simulated the rewinding process to investigate the aerodynamic stability of the drogue in the wake field of tankers through wind tunnel tests, obtained the sinking amount and oscillation amplitude of the drogue using a binocular stereo vision measurement system, and studied the influence of different refueling pods, landing gear bulges, and refueling pod positions on the stability of the hose and drogue. Wen et al. [16] measured the docking load of the oil-receiving device through a ground test and analyzed the variation law of the docking load with different docking speeds.
At the end of the docking stage, when the oil receiver probe approaches the drogue, due to the offset of the receiver probe, the drogue moves away from its equilibrium position and then oscillates around this position, which is called the head wave effect [17]. Dai et al. [18] established a model of the flow field around the receiver nose, expressed by a stream function, and further increased the accuracy by correcting the deviation with numerical simulation results. Dogan et al. [19] established a head wave model suitable for hard tube refueling based on a source–sink solution and analyzed the mechanism of the head wave effect through a numerical simulation. Xu et al. [20] used a mathematical formula method to effectively model the head wave effect of an F-18 fighter jet. Bhandari et al. [21] used the Rankine half-body model to simulate the head wave effect and analyzed the influence of head wave and turbulence on the hose–drogue assembly.
Strong aerodynamic interference and a dynamic coupling phenomenon between aircraft exist in extremely close formations like aerial refueling. Meanwhile, due to the adoption of a hose and drogue in flexible aerial refueling, when the hose and the drogue are extended and released from the pod, the motion form is extremely complex under the action of gravity, aerodynamic force, and elastic force at the same time. Moreover, the spatial shape and motion characteristics of the assembly are easily affected by turbulence. In the process of docking, one end of the hose connected with the refueling pod is in the influence area of the tanker fuselage wake, while the other end connected to the drogue is in the influence area of the head wave of the receiver. Additionally, the overlapping influence areas of the tanker and the receiver result in a strong nonlinear interference. In the process of oil transferring, the pressure pulsation caused by the flow in the soft hose is also an influencing factor that cannot be neglected in the analysis of the dynamic characteristics of the hose. Therefore, the aerial refueling process involves a complex coupling between the rigid–flexible–liquid refueling hose and the surrounding unsteady flow field. The interaction of various factors often leads to various unwanted phenomena, which lead to the failure of refueling operations and greatly limit the safety and success rate of aerial refueling operations.
Hose–drogue assembly is a flexible multi-body system, and its dynamic coupling characteristics are very complex, so its accurate modeling research has always been a popular line of research in aerodynamics. However, the lack of in-depth research on aerodynamic interference and dynamic coupling in aerial refueling formations has become a bottleneck, restricting the development of aerial refueling technology.
In this work, utilizing a 2.4 m transonic wind tunnel, pioneering efforts are made to establish high-speed wind tunnel test technology of the flexible aerial refueling hose–drogue system and innovatively conduct experimental studies on the coupling characteristics of aerodynamics and multi-body dynamics based on this technology. Based on flexible multi-body dynamics, a dynamic model of the system containing the tanker, the hose, the drogue, and the receiver is established. The influence of the hose’s stiffness, Mach number, and head wave effect on the hose’s shear force, longitudinal wave, and shear wave propagation velocity during the refueling process is systematically analyzed through calculation results based on multiple conditions.

2. Wind Tunnel Test and Verification Scheme

2.1. Wind Tunnel

The tests involved in this work are carried out in a 2.4 m transonic wind tunnel, an intermittent, induction, and semi-reflux pressurized wind tunnel, of which the test Mach number range is 0.3~1.2, and the test Reynolds number range is 1.76 × 10⁶~17.00 × 10⁶ (chord length 0.24 m). The size of the test section is 2.4 m × 2.4 m × 7.0 m, of which the wall plate is provided with a 60° inclined hole with an aperture of 24 mm along the axial direction. The opening–closing ratio can be adjusted by washboard or manual plugging. The wall configuration parameters are as listed in Table 1.
As shown in 
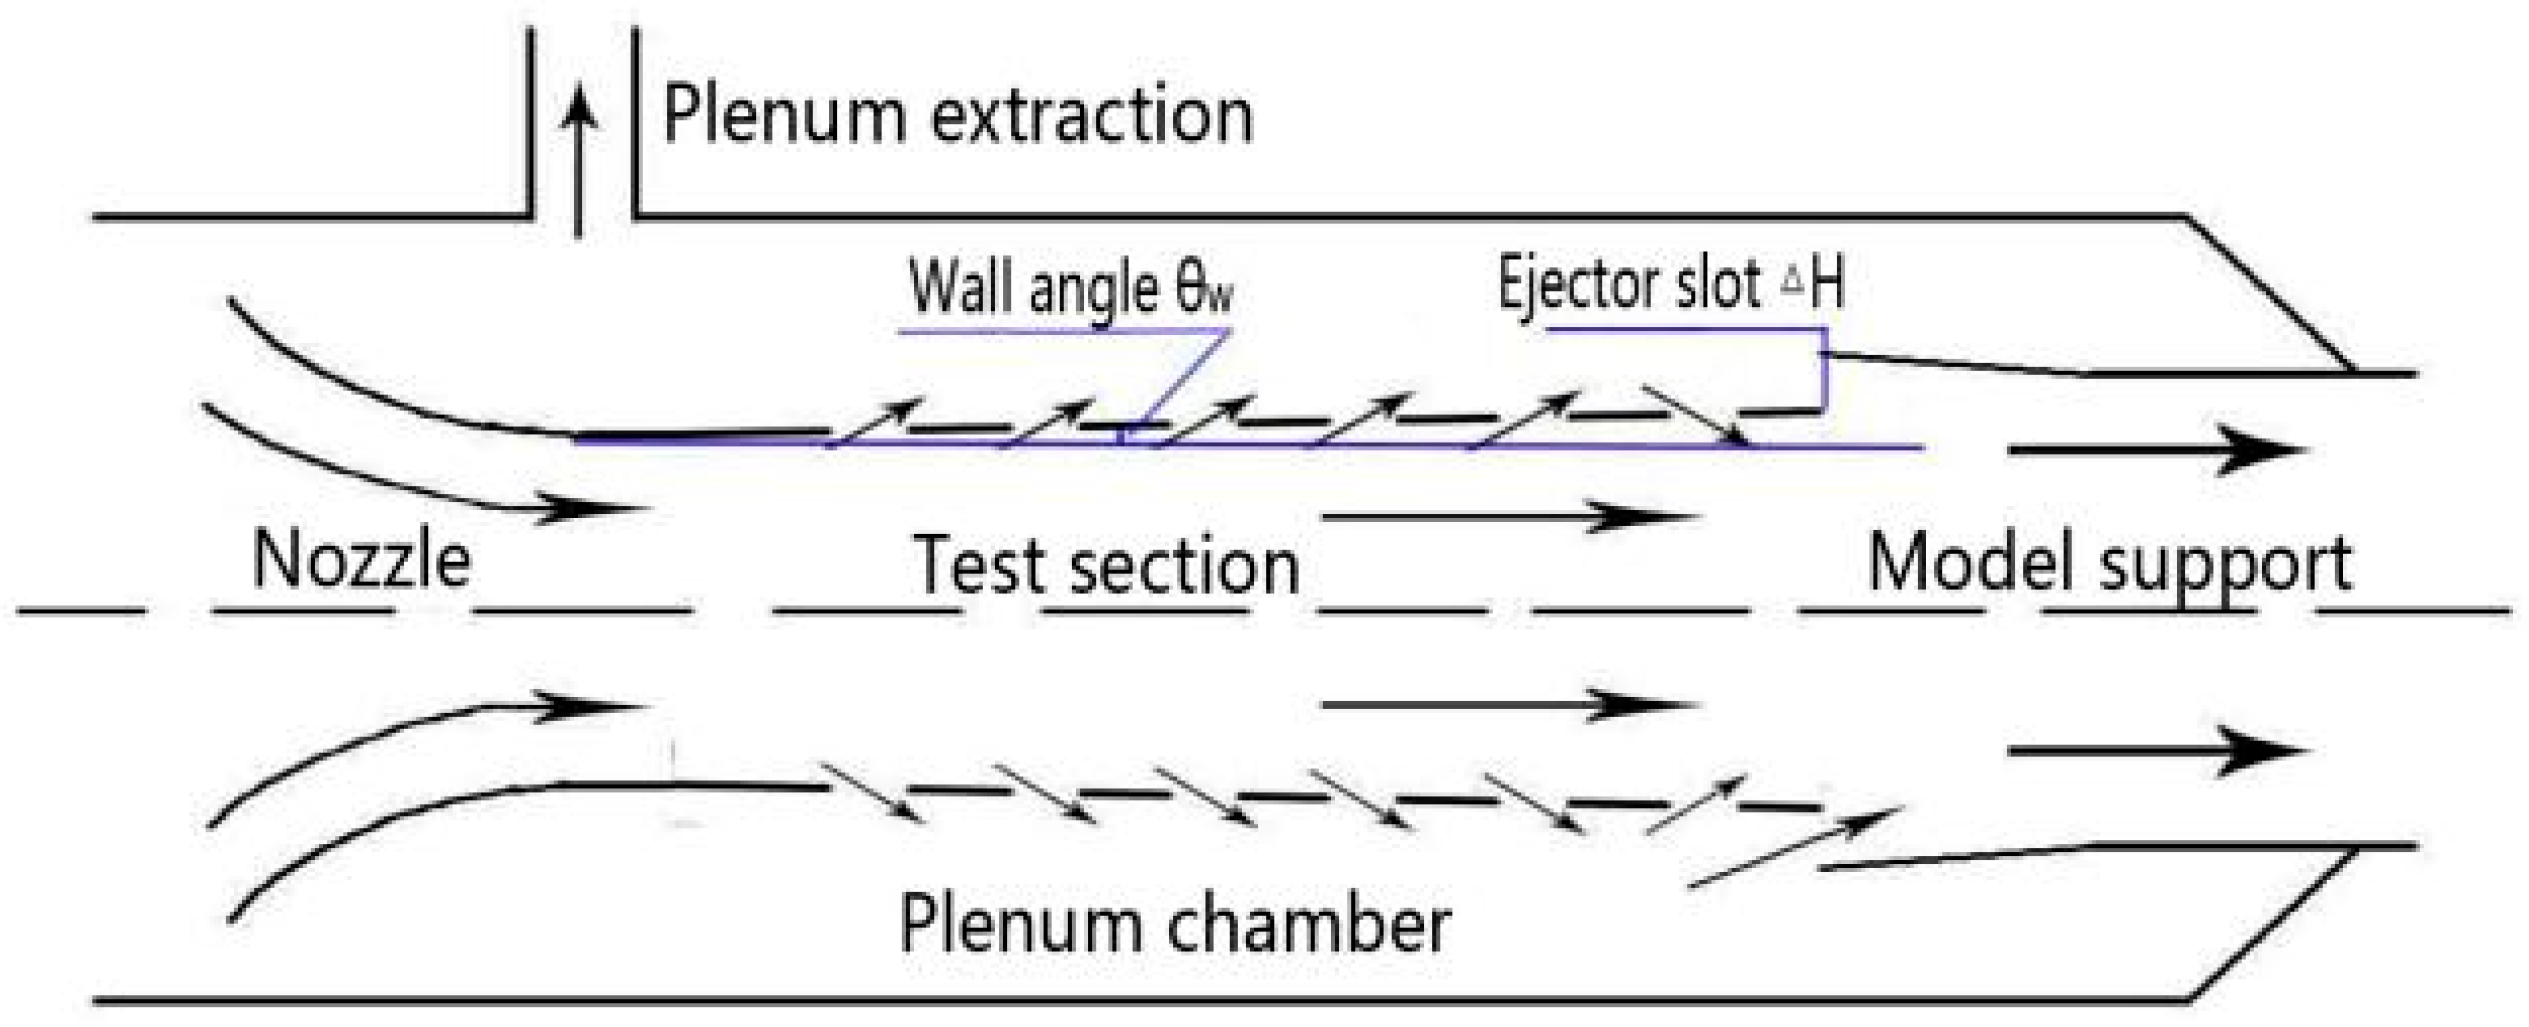
Table 1, the wall porosity ratio τ is defined as the ratio of the total opening area to the panel area occupied by the opening area of the test section. The definitions of ejector slot ΔH and wall angle θ W are shown in Figure 1. The pressure in the chamber is reduced by controlling the suction of the chamber or the main airflow injection. The subsonic airflow at the end of the nozzle enters the test section and is accelerated by the expansion of the hole wall, thus obtaining a transonic flow. Another purpose of the hole wall is to reduce or eliminate the wave reflection interference in the transonic flow field and improve the uniformity of the flow field.
The ejector slot can be used to reduce the pressure in the chamber and increase the lower pressure limit of the suction system in the chamber to reduce the operation cost. The main function of the expansion angle is to compensate for the boundary layer thickness, eliminate the Mach number (pressure) gradient in the test section, and improve the uniformity of airflow in the middle and rear part of the test section during supersonic operations. The 2.4 m transonic wind tunnel has good airflow uniformity and Mach number control accuracy, and the Mach number control error is below 0.002, which meets the test requirements of the hose–drogue system.

2.2. Test Scheme

Based on the mature and abundant supporting technologies in the channel wall test section of the 2.4 m transonic wind tunnel, the coupling characteristics of aerodynamics and multi-body dynamics are investigated. Involving the VMD, high-speed photography, dynamic scale, and other experimental techniques, the dynamic characteristics of the hose–drogue system under the action of high-speed airflow and the approaching state of the oil receiver are obtained.
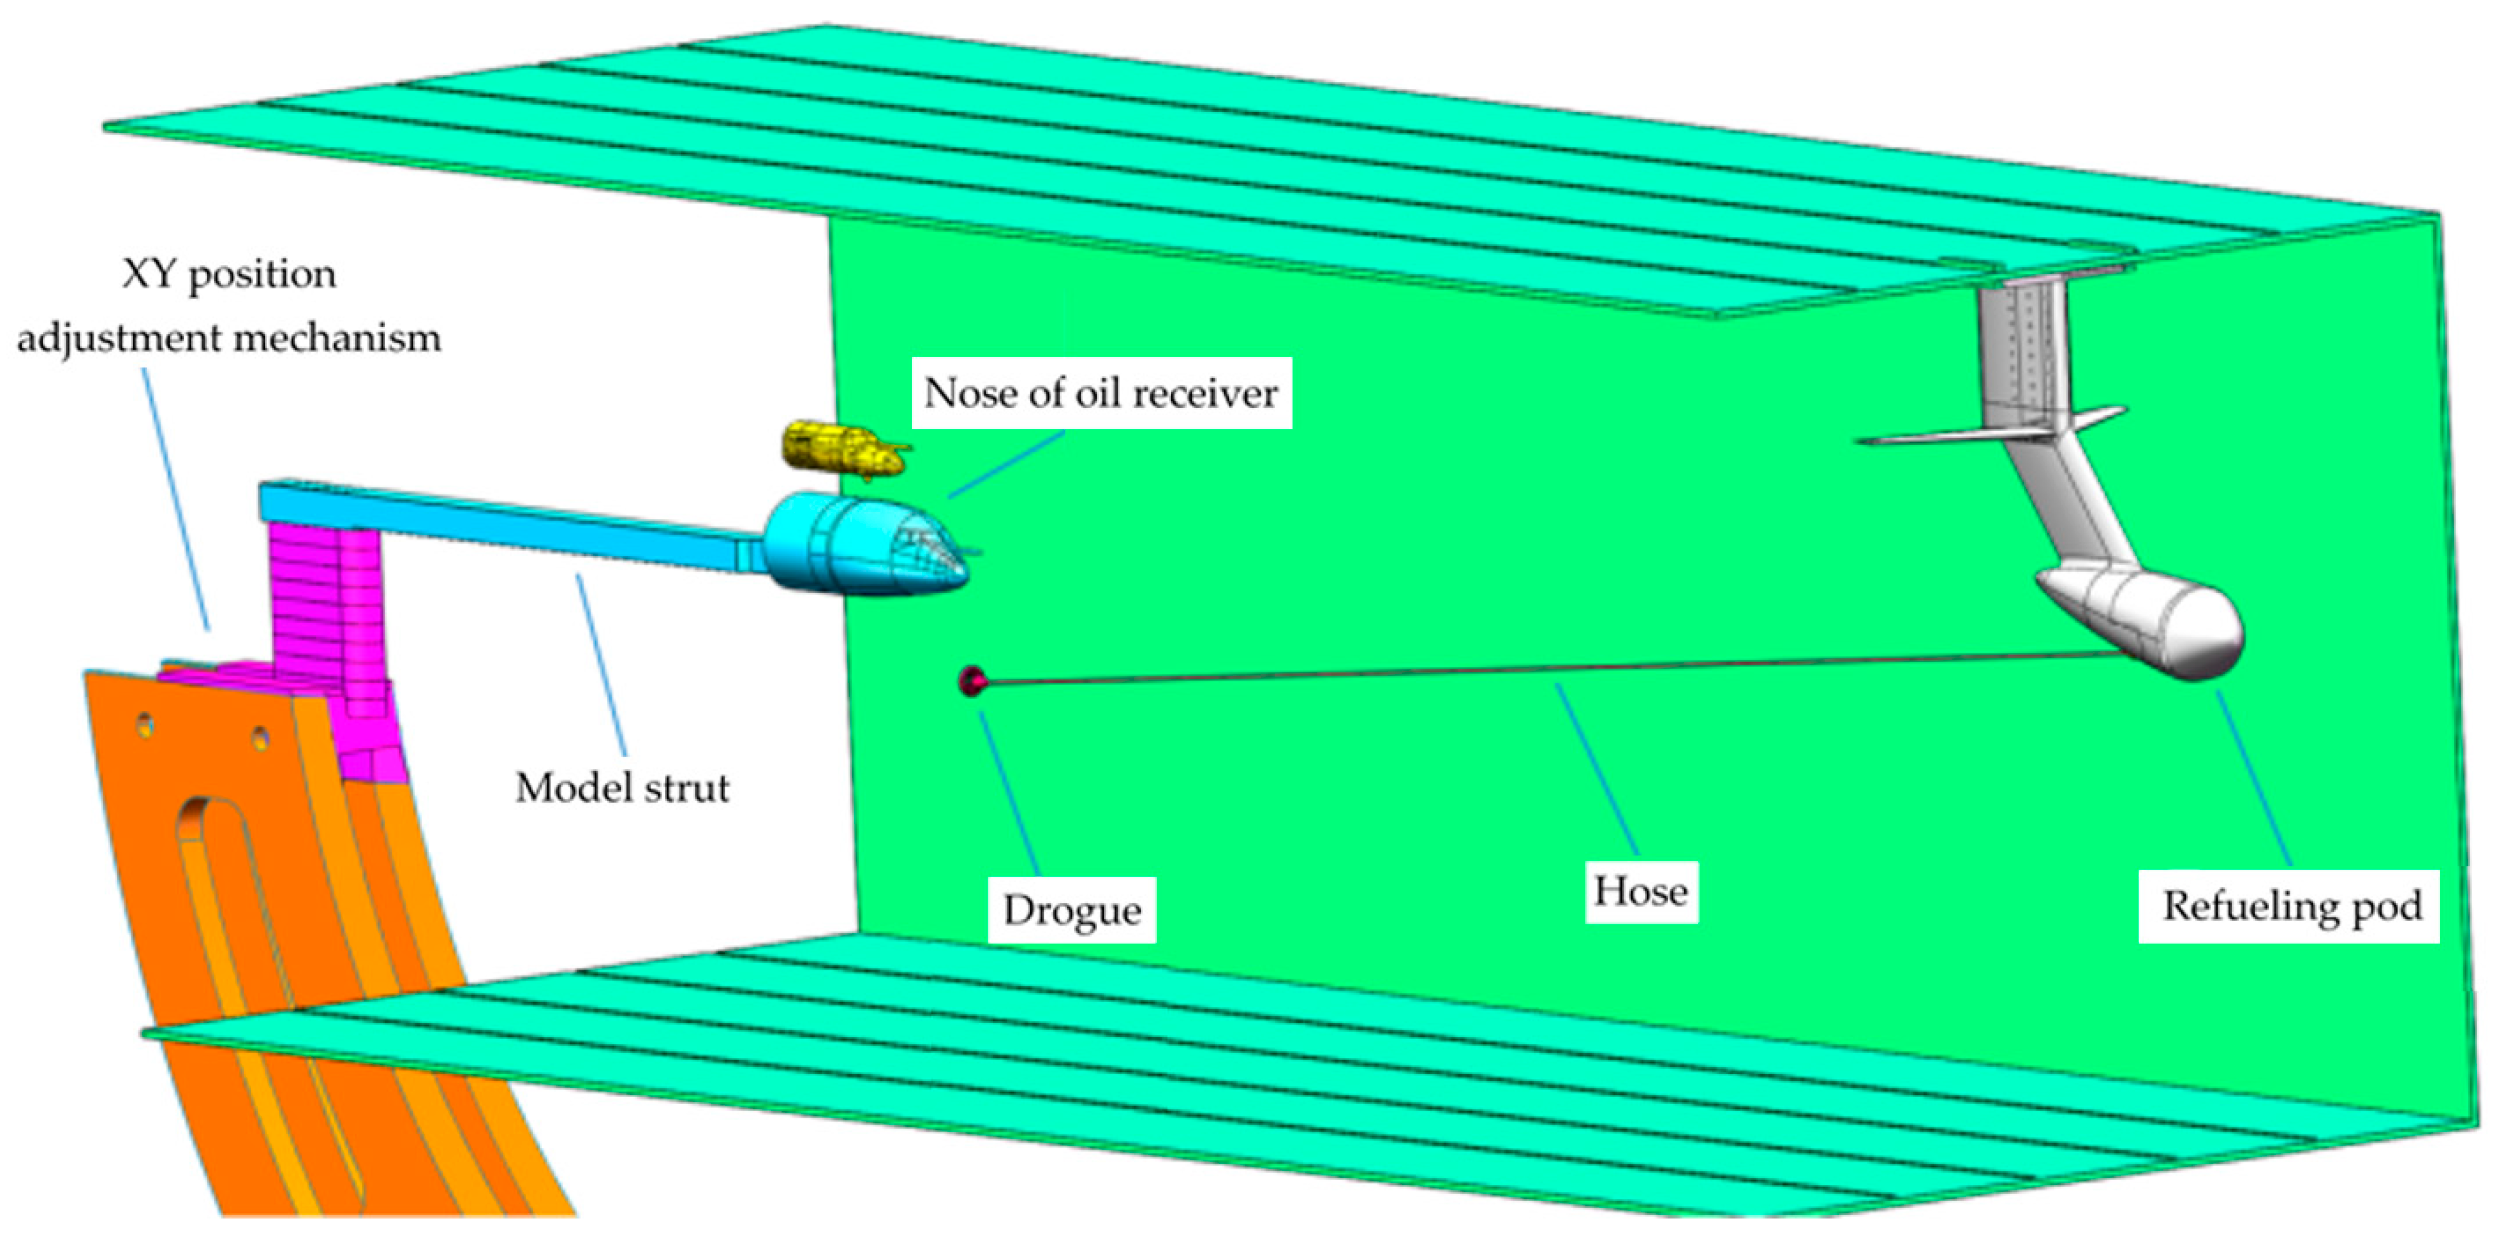
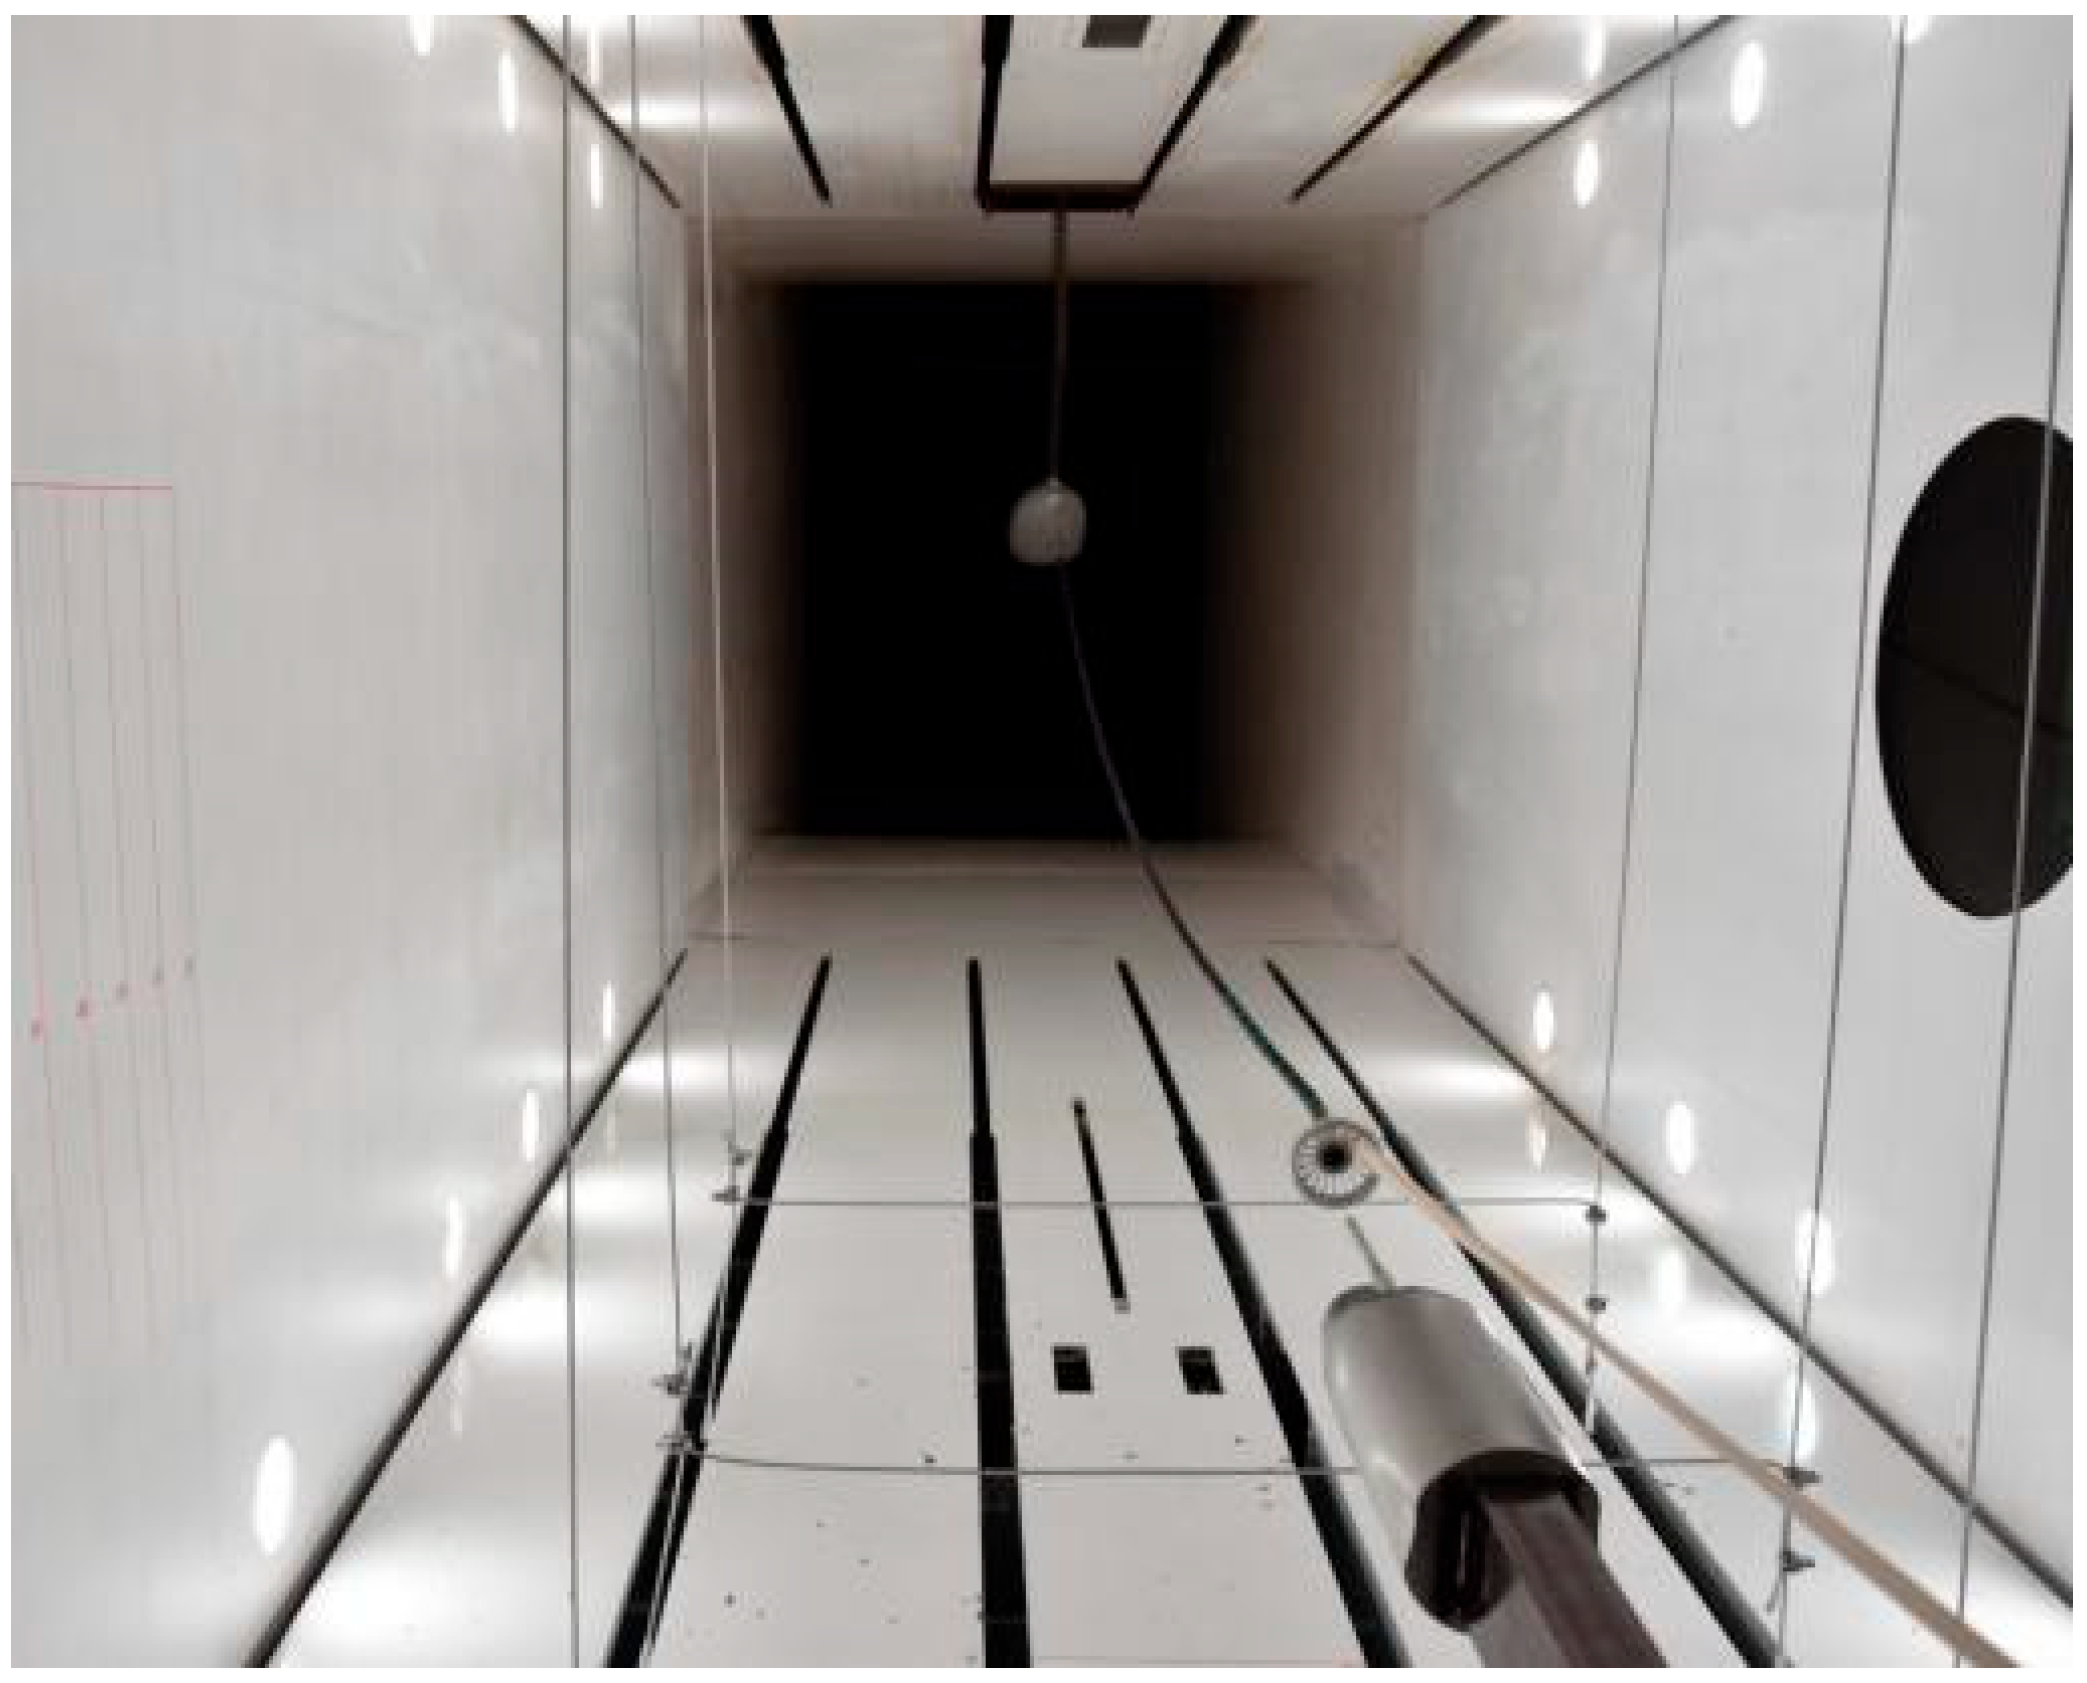
The model scale is 1:10. The tail of the tanker and support mechanism consists of a bow-shaped clamp, a T-shaped bracket, vertical and horizontal tails, the rear section of the fuselage, a scale joint, a dummy scale, a hose joint, a hose, and a drogue. The size of the tanker model is 1060 × 849 × 1060 mm3, and the adjustable vertical position range is 200 mm. The T-shaped bracket is connected to the upper wall plate of the wind tunnel by the bow-shaped clamp on both sides. The vertical tail of the tanker is connected with the T-shaped bracket, and the upper and lower positions of the vertical tail can be adjusted by selecting different connecting holes on the lap surface. The dummy scale is connected to the rear section of the fuselage by a flange. At both ends of the hose, special adapters are used to connect the drogue and the scale. The tail of the tanker fuselage and the support mechanism are shown in Figure 2 and Figure 3.

2.3. Binocular Visual Displacement Measurement Method

During the test, the hose–drogue system swings due to the perturbation in the airflow. In order to capture the motion of the hose–drogue system, a binocular visual system is used to measure the trajectory of motion.
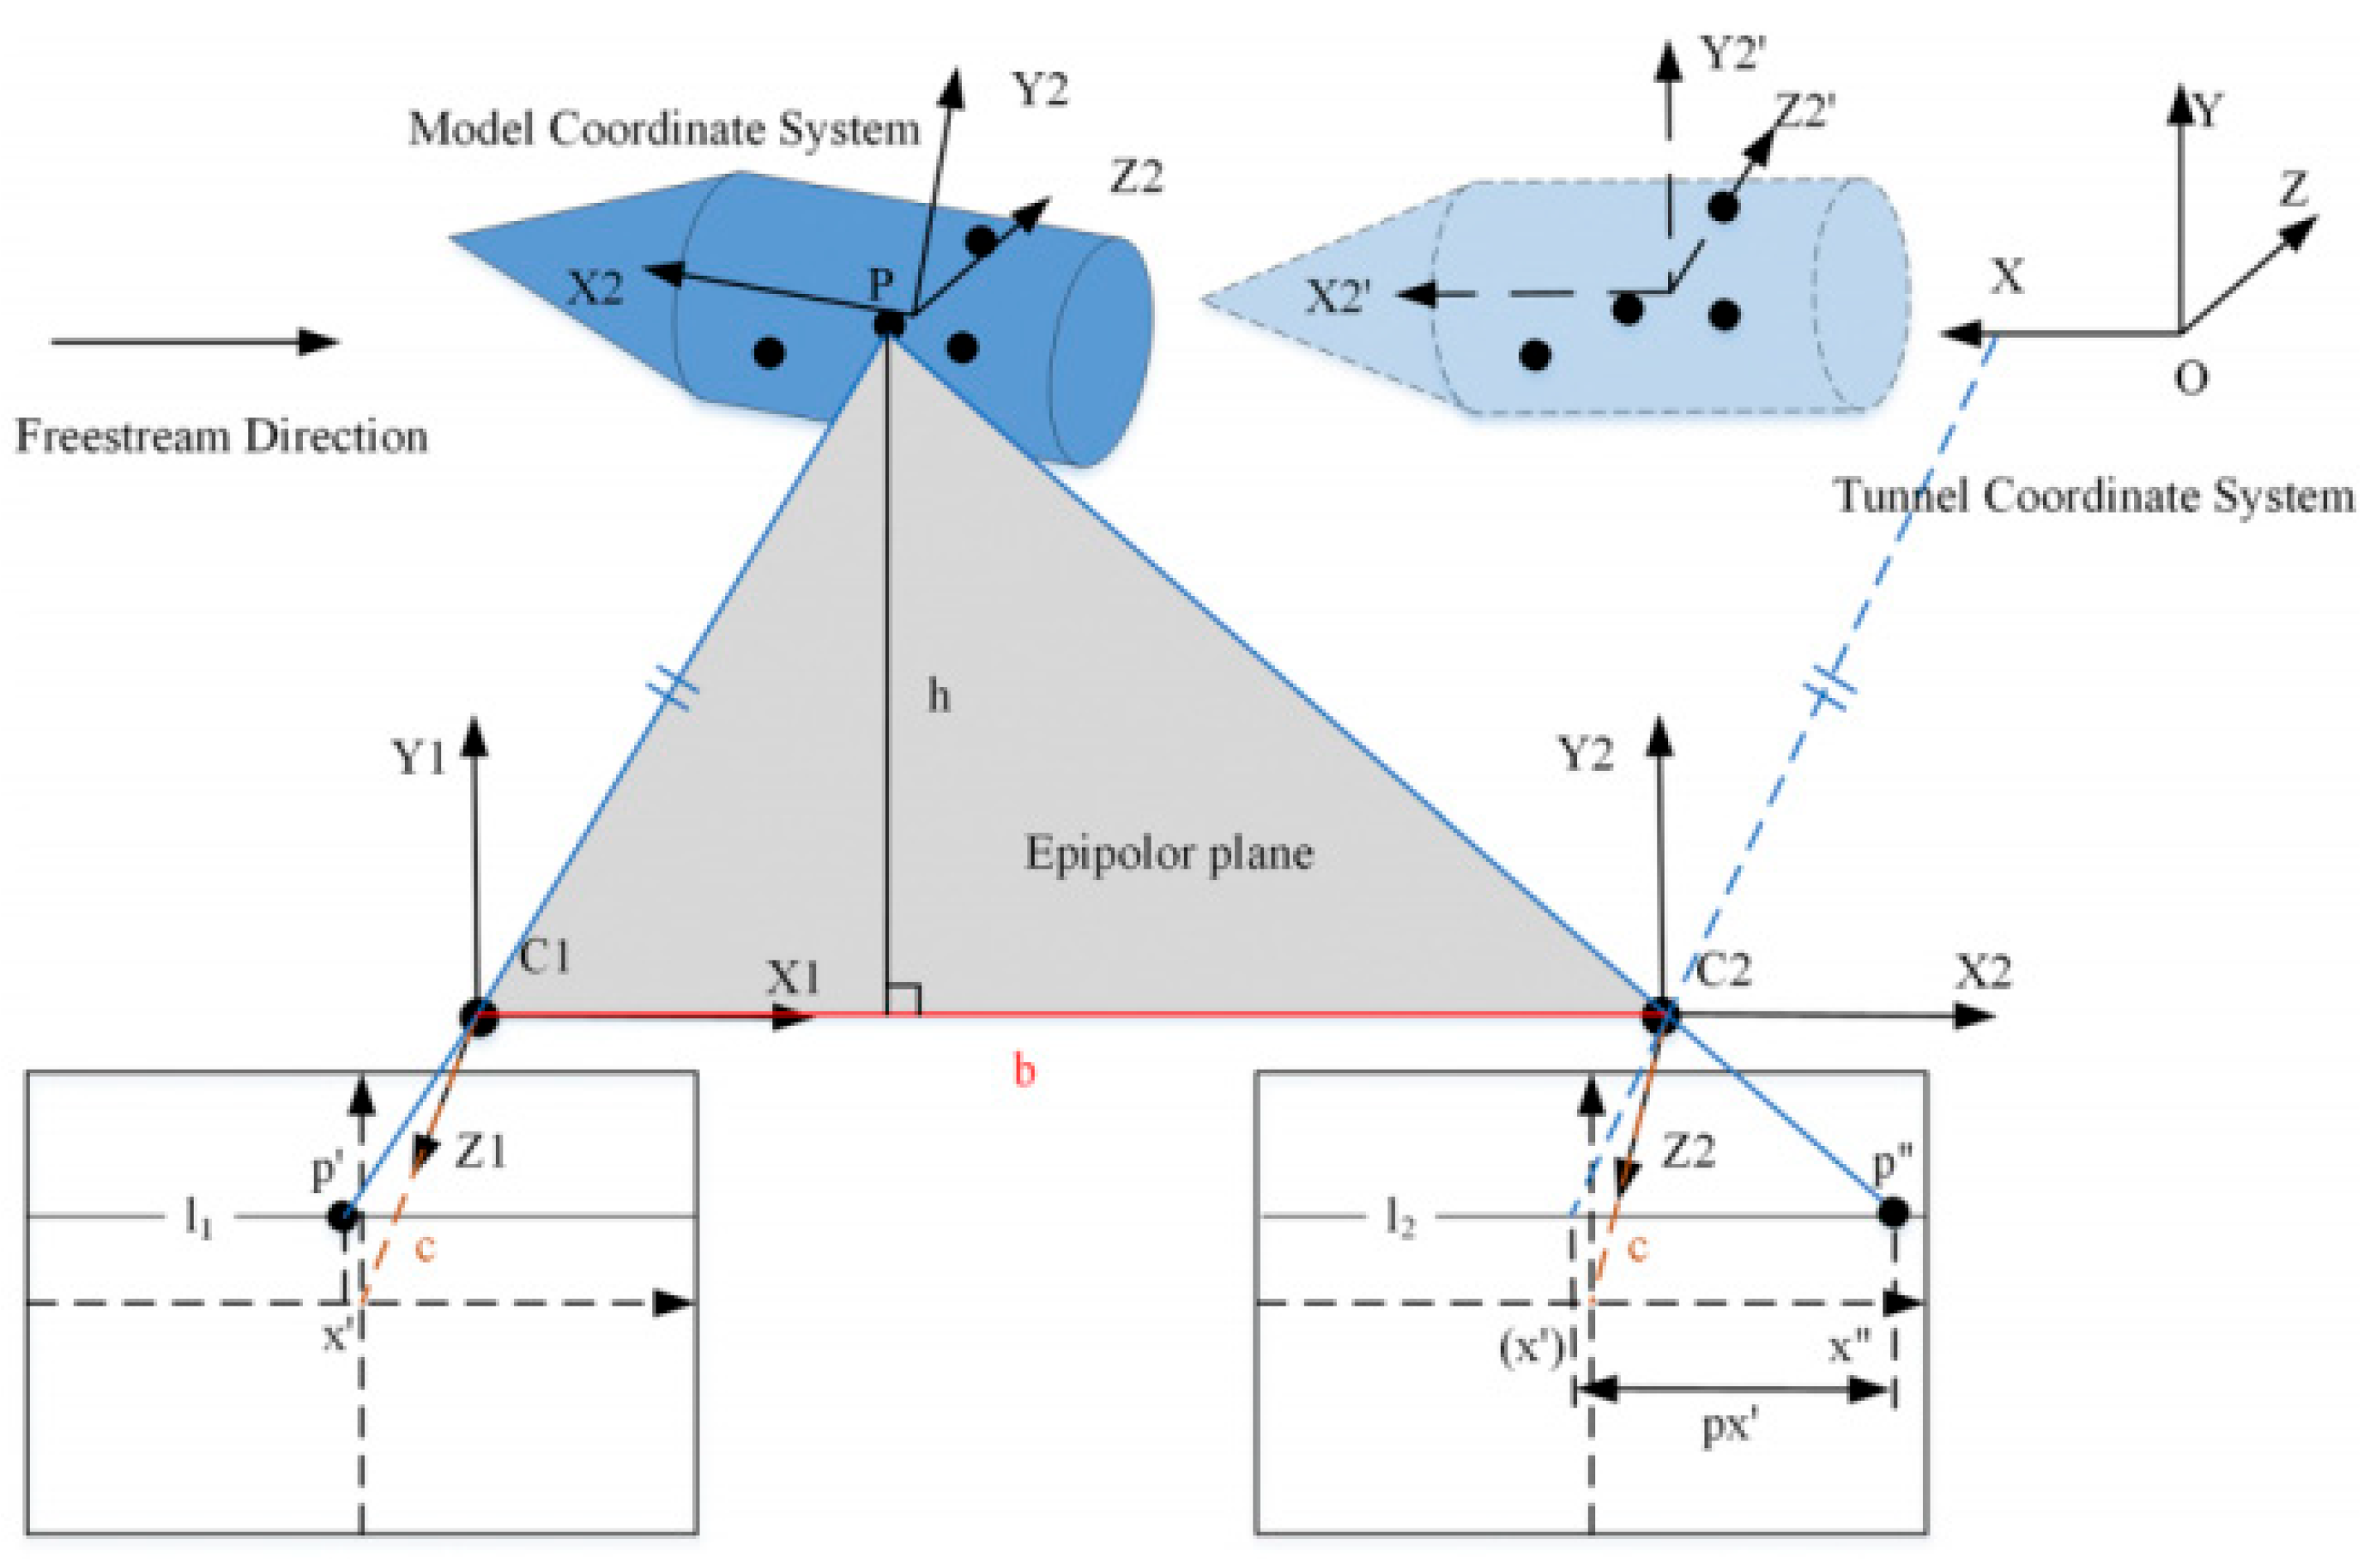
Videogrammetry Model Deformation (VMD) is an optical non-contact measurement technology based on photogrammetry, which is mainly used to measure the spatial position and attitude of the test model and the deformation of the wing under an aerodynamic load. The schematic diagram of the VMD system is shown in Figure 4. The triangulation positioning method is used to locate and track the marking points located on the surface of the model, thus obtaining both the position and attitude of the test model.
The circular marking points are positioned on the surface of the tested model so as to produce artificial marker images with high contrast and realize fast, accurate, and reliable sub-pixel image coordinate positioning. The ‘+’ shaped marking points are positioned on the inner wall of the wind tunnel, which, with an extraction algorithm, offers a datum for solving the coordinates of the marking points on the surface of the tested model. Via field calibration, the VMD system is capable of transforming the coordinates of the marking points from either the wind tunnel or test model coordinate systems to another. The geometric deformation of the model can be calculated quantitatively by tracking and comparing the displacement changes in the model marking points in the model coordinate system during the test.
The VMD measurement system in the 2.4 m transonic wind tunnel uses two cameras to locate and track the marking points on the surface of the test model through the optical window at the top or side wall of the test section. During the tests, the VMD system acquires and stores the images and then calculates the deformation offline after each test.
As shown in Figure 5, the motion and deformation changes are calculated by measuring location changes in the marking points on the hose. Meanwhile, the motion of the drogue is obtained by measuring the location change in the marking point on the drogue.
The mathematical model of the locations of the camera, the marking points, and the images points is as follows:
x + f a 1 ( X X s ) + b 1 ( Y Y s ) + c 1 ( Z Z s ) a 3 ( X X S ) + b 3 ( Y Y s ) + c 3 ( Z Z s ) + x u = x 0 y + f a 2 ( X X s ) + b 2 ( Y Y s ) + c 2 ( Z Z s ) a 3 ( X X S ) + b 3 ( Y Y s ) + c 3 ( Z Z s ) + y u = y 0
where ( x 0 ,   y 0 ) is the center of the camera image plane, f is the focal length of the camera, and ( x u ,   y u ) is the distortion parameter obtained by camera calibration; ( X s ,   Y s ,   Z s ) are the coordinates of the camera in the ground coordinate system, ( X ,   Y ) and ( X ,   Y ,   Z ) are the image coordinates of the marking points in image plane and 3-D ground systems, and ( a 1 ,   a 2 ,   a 3 ,   b 1 ,   b 2 ,   b 3 ,   c 1 ,   c 2 ,   c 3 ) are the directional cosines in the rotation matrix R composed of camera attitude angles ( ϕ ,   ω ,   κ ):
a 1 = cos ϕ cos κ sin ϕ sin ω sin κ b 1 = cos ω sin κ c 1 = sin ϕ cos κ + cos ϕ sin ω sin κ a 2 = cos ϕ sin κ sin ϕ sin ω cos κ b 2 = cos ω cos κ c 2 = sin ϕ sin κ + cos ϕ sin ω cos κ a 3 = sin ϕ cos ω b 3 = sin ω c 3 = cos ϕ cos ω
Given the position and attitude parameters of the camera and the image plane coordinates of the marking points, the coordinates of the marking points in the ground coordinate system can be obtained by Equation (2).
If the ground coordinate system does not coincide with the wind tunnel coordinate system, it is necessary to convert the ground coordinate system of the marking points into the wind tunnel coordinate system, and the conversion is as follows:
X f Y f Z f = λ R X Y Z + X 0 Y 0 Z 0
where λ is the scaling factor, R is the rotation matrix, and ( X 0 , Y 0 , Z 0 ) are the translation of the ground coordinate system to the wind tunnel coordinate system.
In this work, a Canny edge detection operator is used to extract the edges of the circular image of the marking points on the tested model. Then, median filtering is used to filter out the noise inside the circle, and the positioning accuracy of 0.01–0.03 pixels is achieved by using the gray barycenter method, the least square fitting method, and the gray barycenter weighting method.

2.4. Flexible Multi-Body Dynamic Modeling of Hose–Drogue Assembly

As mentioned in former sections, a flexible aerial refueling device mainly includes a refueling hose, a stabilized drogue, a mechanical reel, and other parts. In this work, an ALE variable-length cable/beam element is used to model the hose. The specific ideas of flexible multi-body dynamics and aerodynamic modeling of a hose–drogue are as follows:
Based on flexible multi-body dynamics, the absolute node coordinates (ANCF) beam element based on an Arbitrary Lagrange–Euler description (ALE) is used to model the hose, which is capable of reflecting the large-scale deformation characteristics and variable length characteristics of the hose. The hose is divided into N elements and N + 1 nodes. The first N − 1 elements are Lagrange elements, and the last element is an ALE element. Different from the conventional Lagrange description method, the node-generalized coordinates of the ALE element include not only the global coordinates of the nodes but also the material coordinates, which are the hose length from the starting point to a specific node, as shown in Figure 6.
The aerodynamic load calculation of the hose–drogue system includes aerodynamic load calculations of both the hose and the drogue. The aerodynamic load of a hose element includes both tangential aerodynamic force and normal aerodynamic force calculations. The tangential and normal distributions of aerodynamic coefficients can be obtained by the equation of a typical flow around a cylinder, Hoerner’s empirical formula of tangential friction, CFD calculations, or wind tunnel tests.

3. Results Analysis and Discussion

3.1. Rope Towing State Under Different Mach Numbers

Firstly, the drag state changes in the hose–drogue system under different Mach numbers are analyzed. The length of the test hose is 5 m, and it is hung on the central refueling platform. The damping coefficient of the stabilizing umbrella is 0.5. Five different Mach numbers are tested, which are 0.4, 0.5, 0.55, 0.6, and 0.7.
Figure 7a shows the hose posture under different Mach numbers. It can be seen from the figure that with the increase in Mach numbers, the hose sinking amount decreases, and the drogue is closer to the aircraft in the z direction. This is because the increase in Mach numbers leads to the increase in aerodynamic drag by the hose and drogue, which makes the hose and drogue move upward when the force is balanced, resulting in the drogue being closer to the turbulent downstream of the tanker, increasing the aerodynamic interference of the tanker and increasing the difficulty of docking and refueling. In order to increase the sinking amount at a low altitude, it is necessary to reduce the drag coefficient of the stable parachute, such as by reducing the area of the stable parachute, so as to obtain a larger sinking amount of the drogue at a low altitude. Figure 7b shows the drag of the hose at different Mach numbers. As can be seen from the diagram, with the increase in the Mach number, the drag of the hose increases in a parabolic form.

3.2. Investigation on the Head-Wave Effect

Figure 8 shows the longitudinal position change in the drogue under different proximity distances of the oil receiver. It can be seen that with the decrease in distance between the oil receiver and the drogue, from 100 mm to 20 mm, the drogue moves downward by 31 mm (from 787 mm to 756 mm). Figure 9 shows the movement trace of the drogue in the streamwise section under different proximity distances of the receiver. Due to the fact that the oil-receiving pipe is not located on the symmetrical plane of the receiver, the asymmetric disturbance of the airflow causes the drogue to move to the side of the oil-receiving pipe. Meanwhile, as the distance of the oil receiver and the drogue decreases from 1000 mm to 20 mm, the amplitude of the oscillation of the drogue increases from 33 to 48 and from 48 to 80 in spanwise and longitudinal directions, respectively.

3.3. Deformation Analysis of Hose in the Tanker Wake Field

The attitude and deformation of the hose and drogue system are of great significance to docking and refueling. Generally, due to the fact that without hose deformation, the aerodynamic coefficients of the drogue are basically unchanged, the factors affecting the hose and drogue system are directly related to the flow environment in which the system is located, which is the local pressure perturbation. And the pressure perturbation is directly related to the local density and velocity of the flow. In addition to the compressibility effect, the air density is directly affected by the altitude of the aircraft. See Table 2 for some parameters of the hose and drogue.
In the simulation carried out in this work, the flight speed is Ma = 0.6, the altitude is 5600 m, and the hose length is 14.6 m. At exactly 4 s after the start of the simulation, the receiver rushes forward for 1 m and keeps its position unchanged, which, assuming the winch does not react to the tension change in the hose, will result in a whipping phenomenon.
Figure 10 shows the deformation of the hose changing with time. It can be seen that when whipping occurs, the hose bends downward, which travels to the drogue in the form of a shear wave, which influences the aerodynamic force and the hose restoring force. When encountering the drogue, the shear wave reflects and begins to travel to the pod again, which is consistent with the actual whipping during aerial refueling.

3.4. Investigation on the Influence of Hose Stiffness on the Hose–Drogue System

Excessive shear force caused by the swinging and “whipping” phenomenon of the hose–drogue system is a major cause of hose damage. Therefore, the maximum shear force of the hose is considered as an index to measure the swinging phenomenon in this work, and the influence of different factors on the hose swinging phenomenon is analyzed. Keeping other conditions unchanged, the phenomenon of “whipping” under high stiffness (16 MPa) and low stiffness (4 MPa) is analyzed. The spatial–temporal evolution of the vertical shear force of high-stiffness and low-stiffness hoses is given in Figure 11. The positions where shear waves first form are different between high stiffness and low stiffness. Under high stiffness, they occur near the refueling pod, while under low stiffness, they are close to the middle of the hose and 10 m away from the refueling pod. It can be seen from Figure 12 that there is obvious shear wave propagation under high hose stiffness, and the propagation speed is higher than that under low hose stiffness.
On the basis of the vertical velocity waterfall diagram of hose nodes presented in Figure 11, the propagation velocities of the longitudinal wave and shear wave are identified.
As shown in Figure 12, the stiffness of the hose has an influence on the propagation velocities of the longitudinal wave and shear wave of the hose. With the increase in the elastic modulus of the hose (from 4 MPa to 16 MPa), the propagation velocities of the longitudinal wave and shear wave propagating along the hose are accelerated (the velocity of the longitudinal wave from 35.2 m/s to 71.1 m/s and the velocity of the shear wave from 13.8 m/s to 22.9 m/s).
Figure 13 shows the maximum shear force of the hose under different stiffnesses. The shear force caused by the “whipping” phenomenon increases (from 2.4 kN to 7.3 kN) with the increase in the elastic modulus of the hose (from 4 MPa to 16 MPa). It can be seen that it is more advantageous to use the hose with lower stiffness while keeping the strength of the hose material unchanged.

3.5. Investigation on the Influence of Mach Number on the Hose–Drogue System

Keeping other conditions unchanged, investigations on the “whipping” phenomena at both high and low Mach numbers (Mach numbers 0.7 and 0.3) are carried out. As shown in Figure 14, with the increase in the Mach number, the propagation velocities of the longitudinal and shear waves both increase, which is due to the greater aerodynamic force imposed on the hose at a higher Mach number.
Based on the vertical velocity waterfall diagram of hose nodes presented in Figure 15, the propagation velocities of both longitudinal and shear waves are identified.
As shown in Figure 15, the propagation velocity variations in the longitudinal and shear waves are different with the increase in the Mach number due to the difference in the propagation orientations of the longitudinal and shear waves.
With the increase in the Mach number (from 0.3 to 0.7), the propagation velocity of the longitudinal wave decreases (from 51.4 m/s to 49.5 m/s) due to the fact that the longitudinal wave propagates upstream along the hose; meanwhile, the propagation velocity of the shear wave increases (from 16.3 m/s to 21.1 m/s) due to the fact that the shear wave propagates downstream along the hose.
The maximum shear force of the hose at different Mach numbers is shown in Figure 16. It can be seen that the shear force caused by the “whipping” phenomenon increases (from 2.6 kN to 8.0 kN) with the increase in Mach numbers (from 0.3 to 0.7). Extra attention should be paid during aerial refueling at high Mach numbers, considering the excessive influence of the “whipping” phenomenon in such conditions.

3.6. Analysis of the Influence of Head Wave and Wake on Hose–Drogue System

Keeping other conditions unchanged, investigations on the “whipping” phenomenon considering the influence of the head wave, the tanker wake, and both are carried out. As is shown in Figure 17, the results indicate that the existence of the head wave and the tanker wake is of great influence on the “whipping” phenomenon, while effects on the propagation velocities of the longitudinal and shear waves are at a negligible level. Table 3 gives the maximum shear force of the hose when considering the influence of the head wave effect and the tanker wake. It can be seen that the shear force increases with the existence of the head wave and decreases with the existence of the tanker wake. However, during an actual aerial refueling process, the existence of the head wave and the tanker wake cannot be neglected, which significantly increases the shear force of the hose. The head wave and the tanker wake influence the peak shear force that is caused by the “whipping” phenomenon by introducing perturbations on the flow field around the hose and drogue and changing the aerodynamic forces on them.

4. Conclusions

Through the work presented above, the influence of the approaching distance of the dynamic characteristics of the hose–drogue system and the Mach number and hose stiffness on the wave propagation velocity and shear force is obtained. The detailed conclusions are as follows.
(a) The dynamic coupling test technology of a flexible aerial refueling hose–drogue system is established in a 2.4 m transonic wind tunnel. Adopting VMD, high-speed photography, and dynamic scale test technology, the dynamic characteristics of the hose–drogue system under the action of high-speed airflow and the approaching of the oil receiver are obtained.
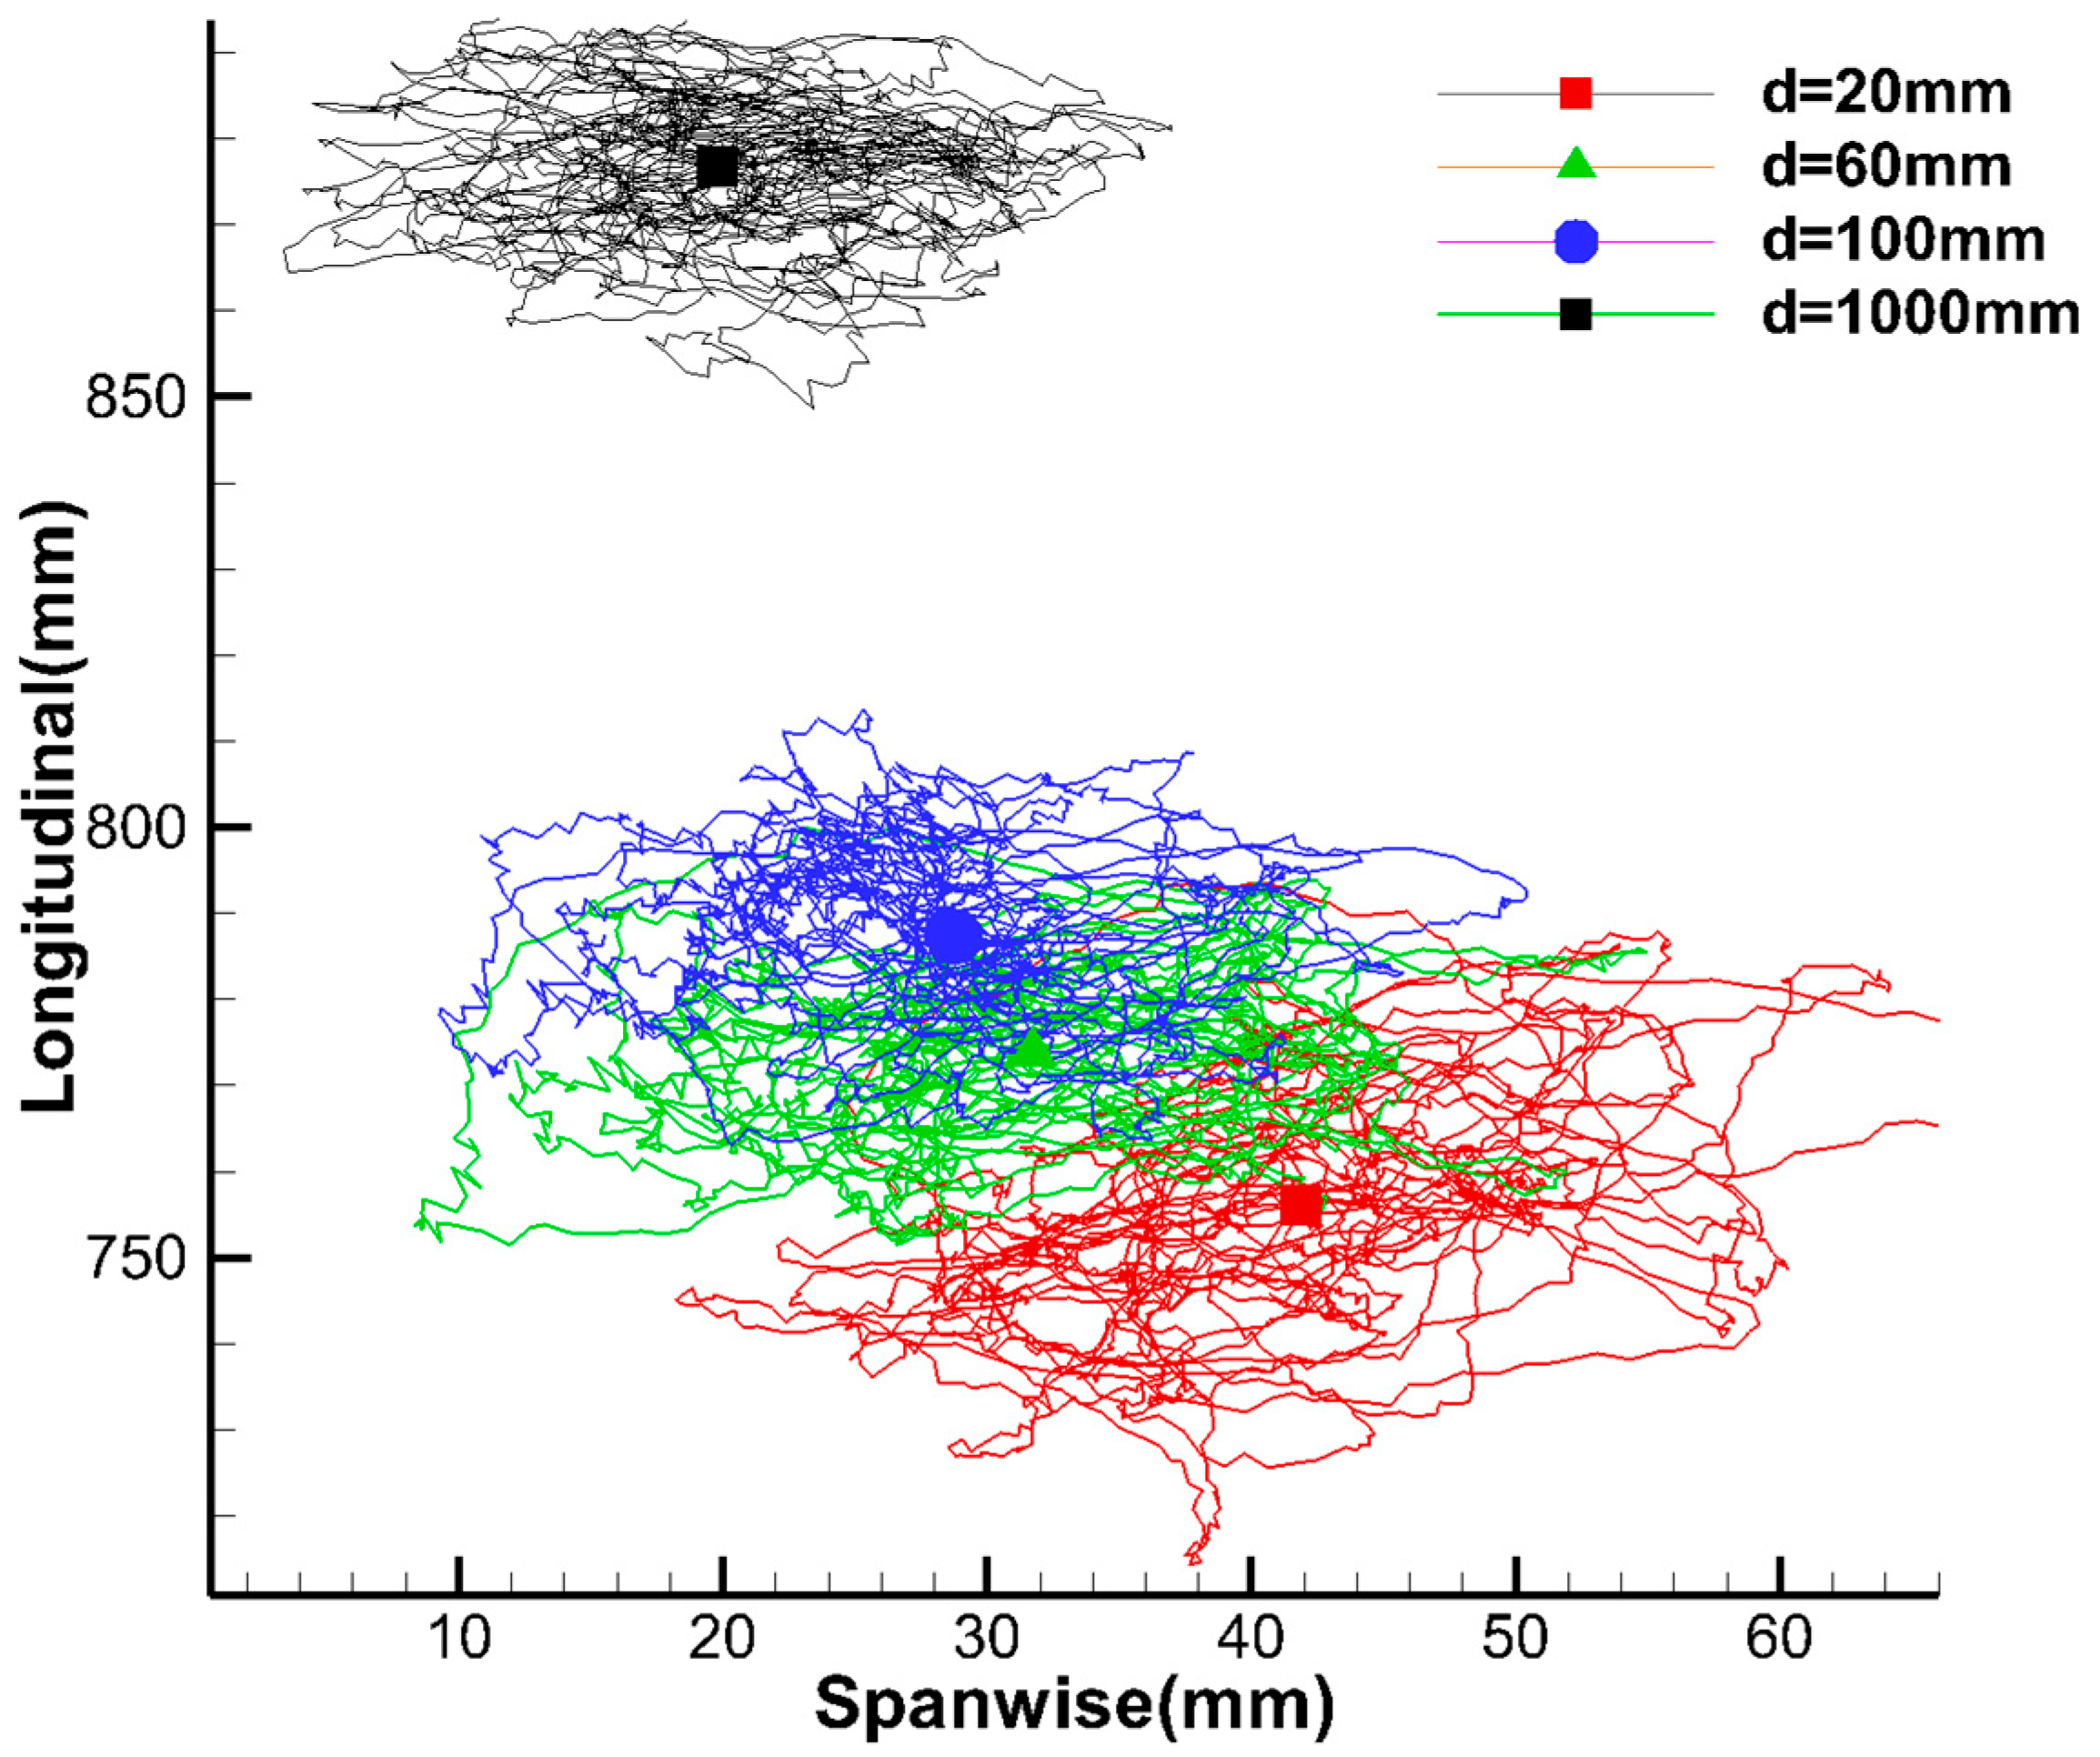
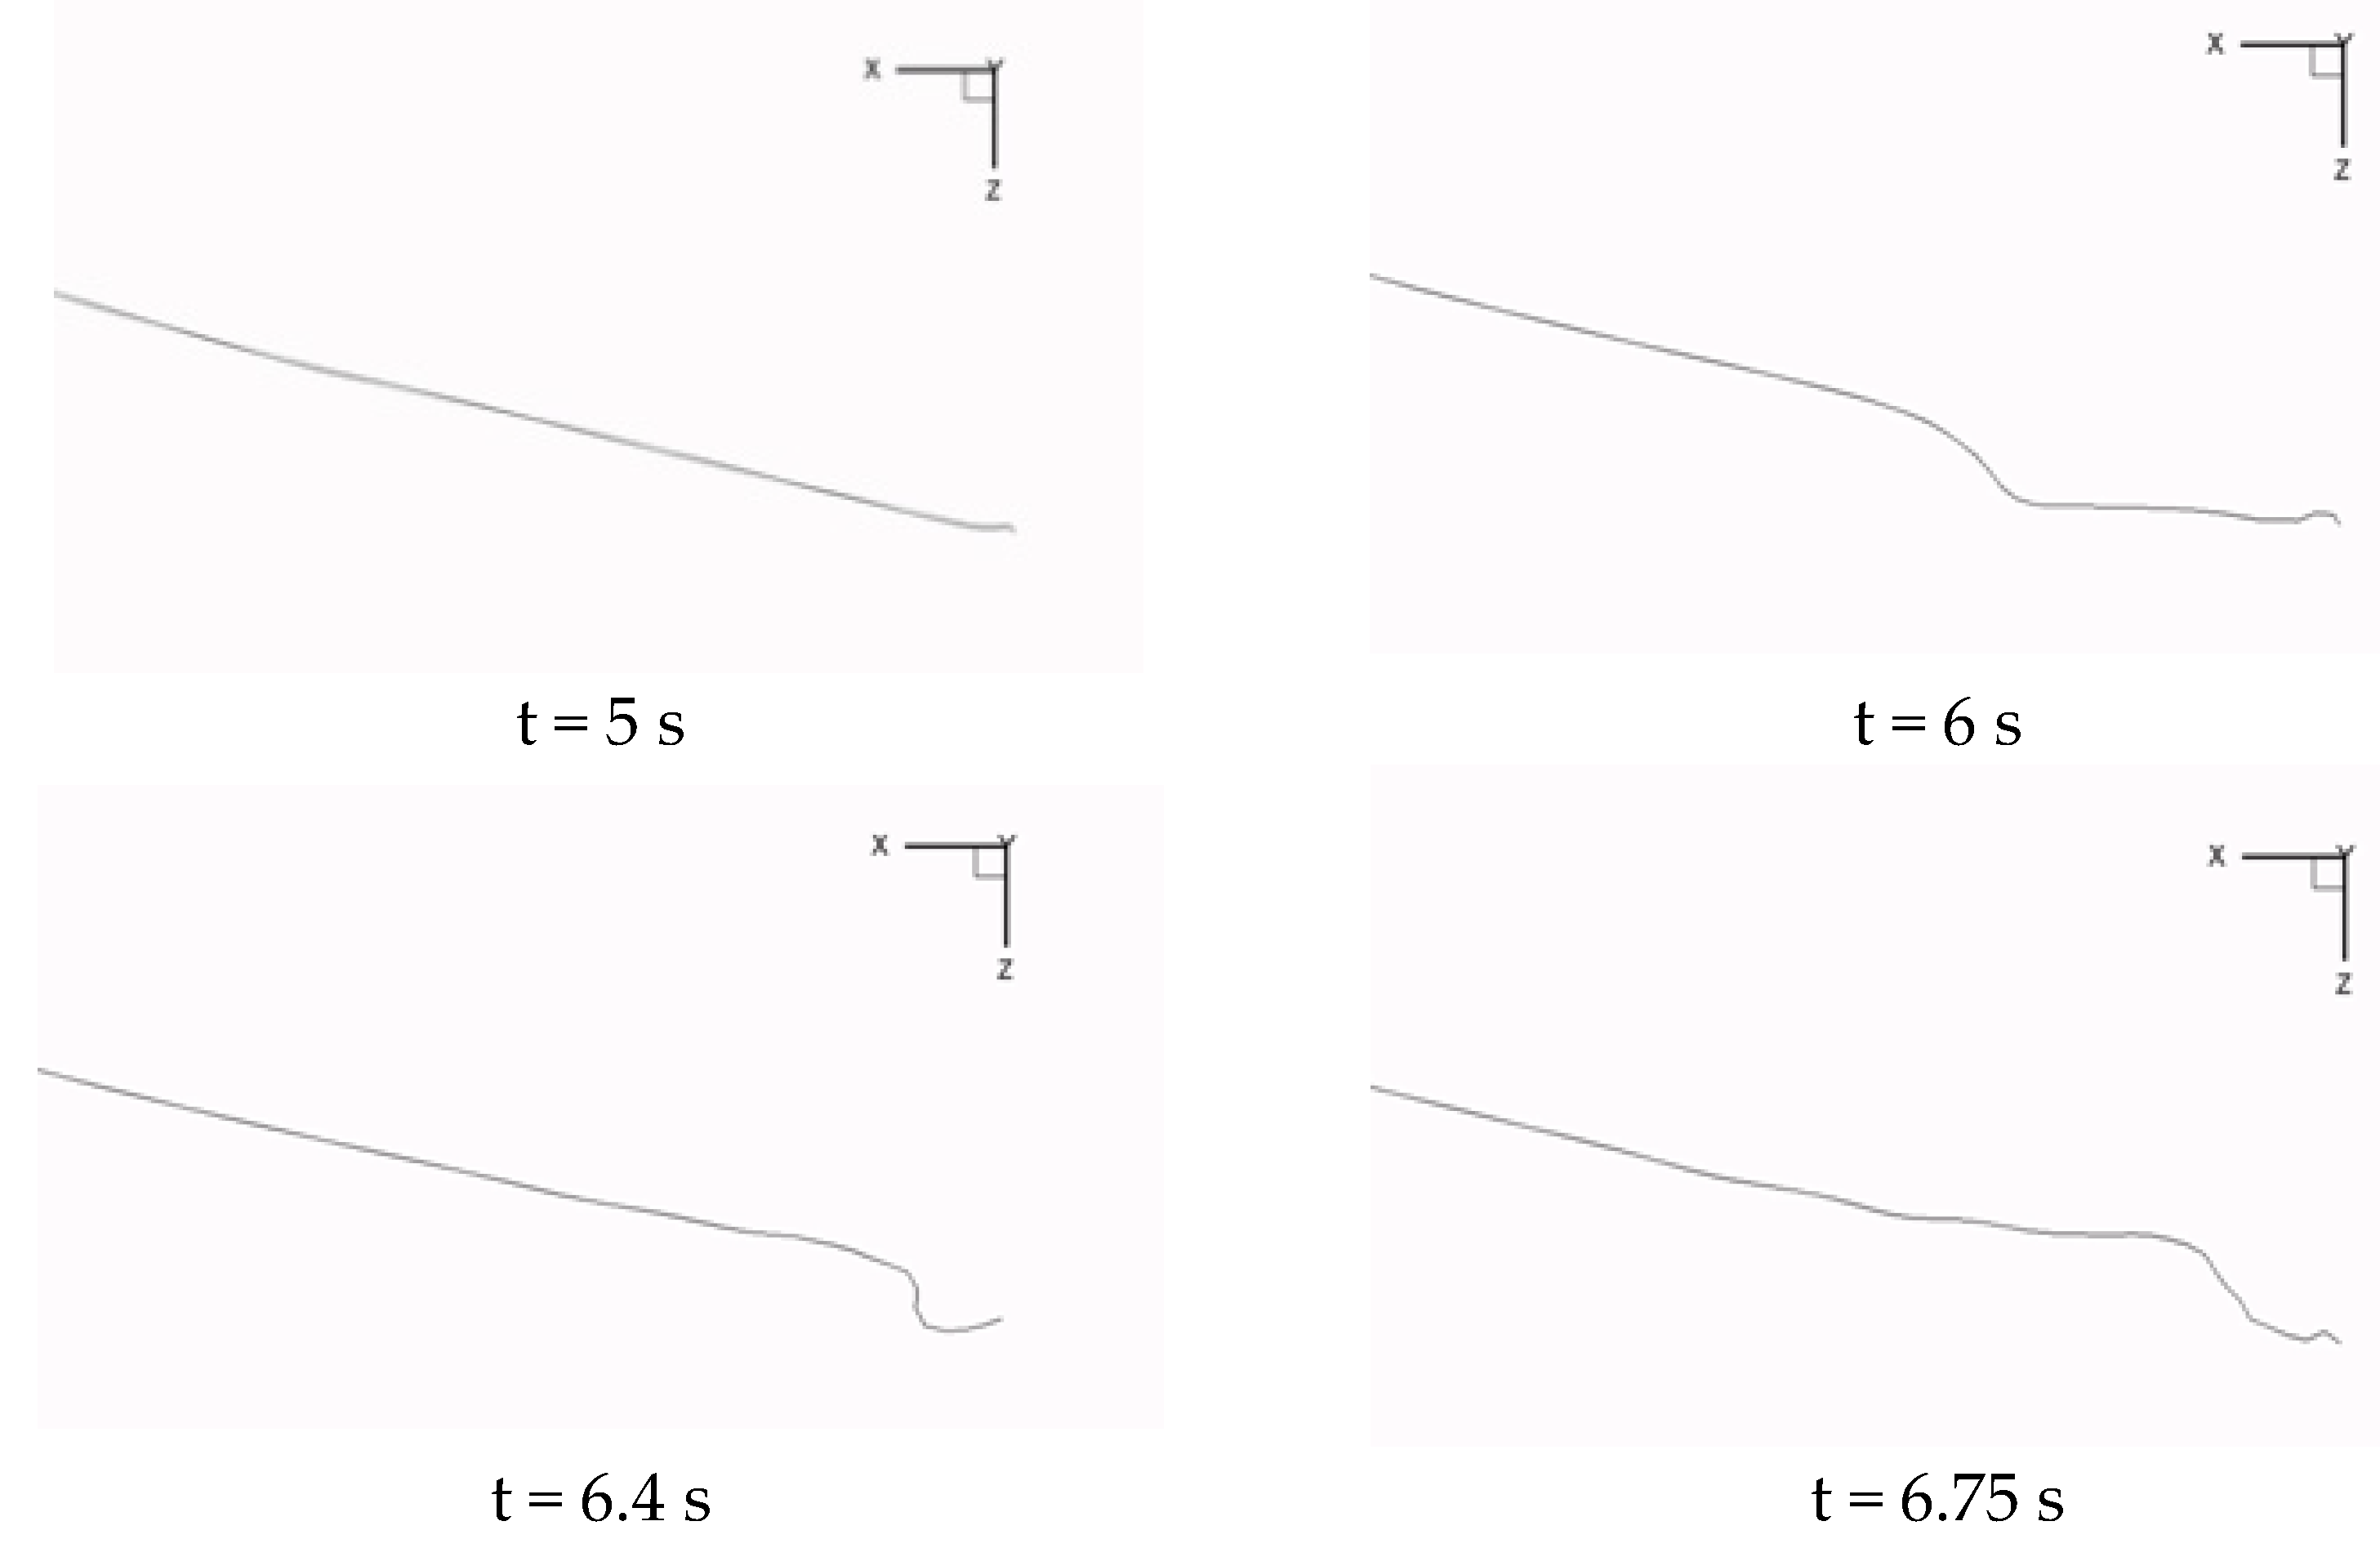
(b) With the decrease in the flow direction distance between the receiver and the drogue, the sinking amount of the drogue increases. Meanwhile, because the oil-receiving pipe of the receiver is not located in the middle of the nose, an asymmetric disturbance of the airflow is caused, which leads the drogue to move to the side of the oil-receiving pipe. With the distance decreasing, the swing of the hose–drogue system increases.
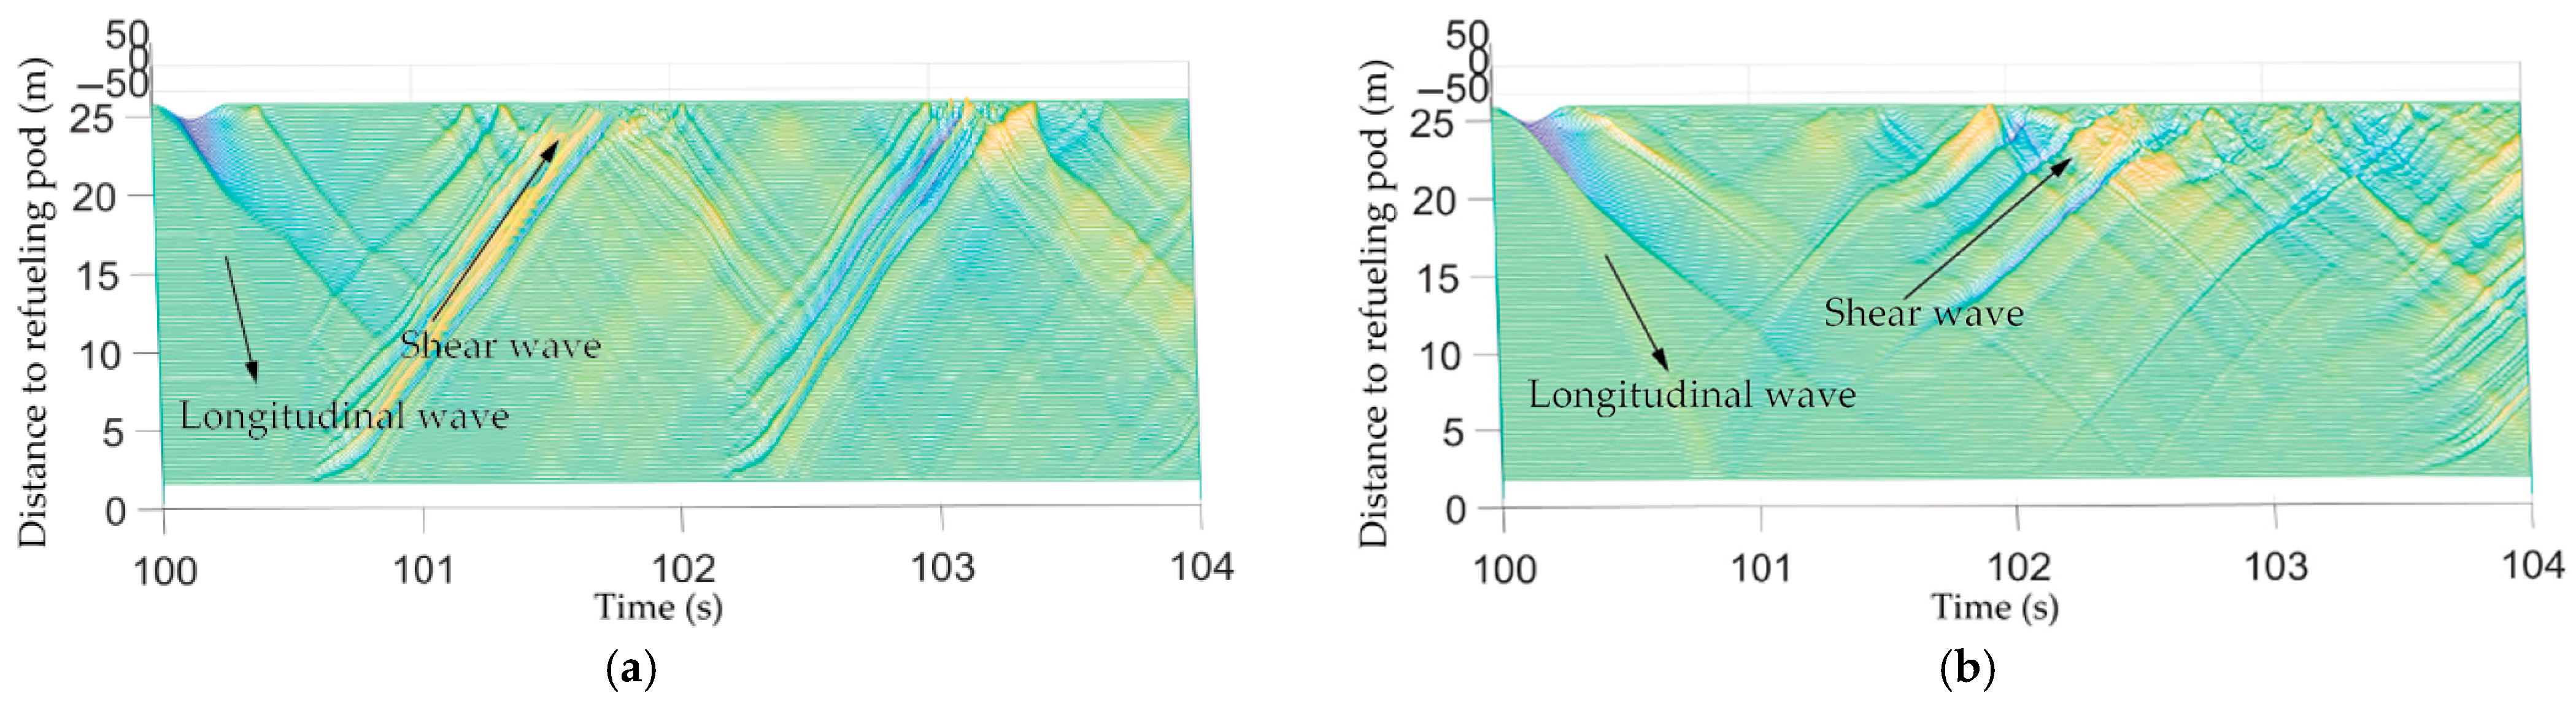
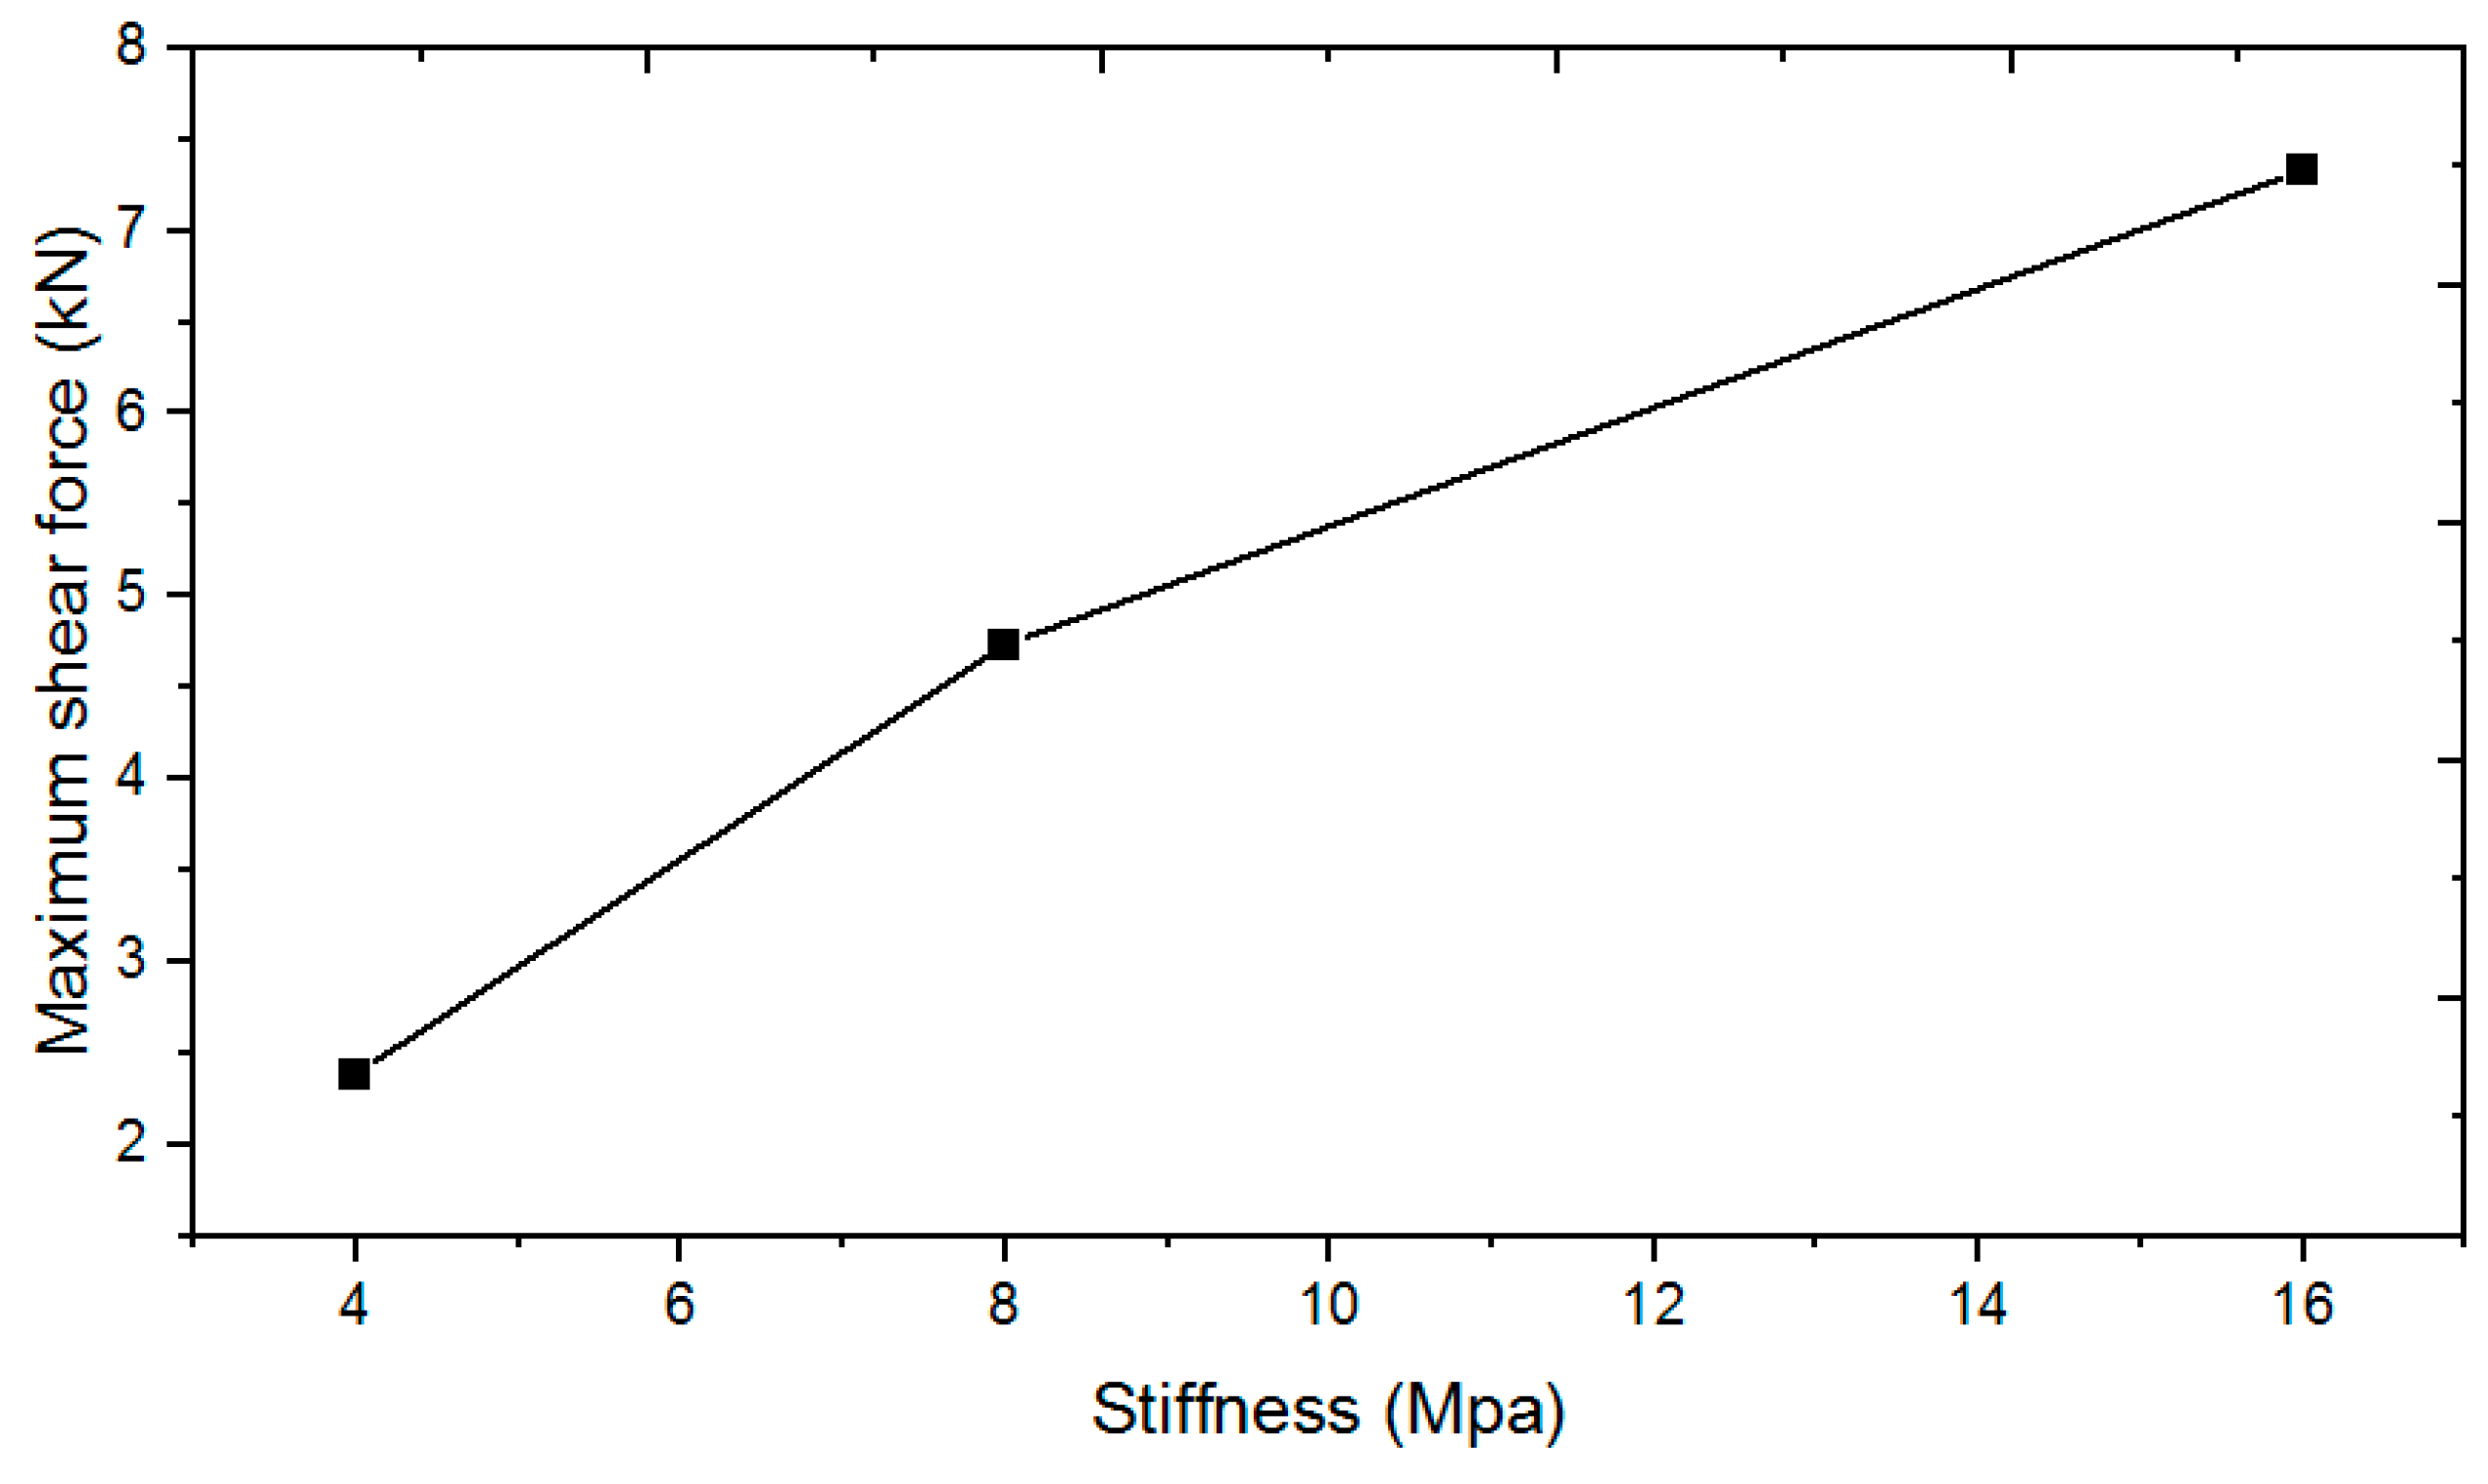
(c) According to the calculation results of multiple working conditions, the influence laws of various factors on the stability and oscillation amplitude of the hose–drogue system of the soft refueling device are analyzed. The hose stiffness and Mach number all influence the hose shear force caused by the swing of the hose–drogue system, and the hose stiffness and Mach number have an obvious influence on the propagation velocity of the longitudinal wave and shear wave of the hose. Using softer hose material and reducing the flight Mach number are helpful to mitigate the influence of the refueling swing and whipping in the air.

Author Contributions

Conceptualization, Y.W.; validation, Y.G.; formal analysis, Y.W.; investigation, E.S.; data curation, Q.C.; writing—original draft preparation, Y.W.; writing—review and editing, Y.W.; visualization, Y.G.; supervision, J.H.; project administration, E.S.; funding acquisition, J.H. All authors have read and agreed to the published version of the manuscript.

Funding

This research received no external funding.

Data Availability Statement

The data that support the findings of this study are available from the corresponding author upon reasonable request.

Conflicts of Interest

The authors declare no conflicts of interest.

References

  1. Chen, L.L. Research on Aerodynamic Compatibility and Dynamic Characteristics of Hose-Drogue Aerial Refuling System. Ph.D. Thesis, Nanjing University of Aeronautics & Astronautics, Nanjing, China, 2017. [Google Scholar]
  2. Peng, K.; Yu, Z.H.; Xie, C. Research on aerial fuel receiving method for fixed wing aircraft. Aeronaut. Manuf. 2016, 97–101+109. Available online: https://d.wanfangdata.com.cn/periodical/hkgyjs201603017 (accessed on 4 May 2025).
  3. Quan, Q.; Wei, Z.B.; Gao, J.; Zhang, R.F.; Cai, K.Y. A survey on modeling and control problems for probe and drogue autonomous aerial refueling at docking stage. Acta Aeronaut. Astronaut. Sin. 2014, 35, 2390–2410. [Google Scholar]
  4. Lu, Y.P.; Yang, C.X.; Liu, Y.Y. A survey of modeling and control technologies for aerial refueling system. Acta Aeronaut. Astronaut. Sin. 2014, 35, 2375–2389. [Google Scholar]
  5. Liu, Z. Research on Flight Control Technology of the Receiver Aircraft in Probe-and-Drogue Autonomous Aerial Refueling. Master’s Thesis, Nanjing University of Aeronautics & Astronautics, Nanjing, China, 2012. [Google Scholar]
  6. Thomas, P.R.; Bhandari, U.; Bullock, S.; Richardson, T.S.; Du Bois, J.L. Advances in air to air refuelling. Prog. Aeosp. Sci. 2014, 71, 14–35. [Google Scholar] [CrossRef]
  7. Vachon, M.J.; Ray, R.J. Calculated Drag of an Aerial Refueling Assembly Through Airplane Performance Analysis. In Proceedings of the 42nd AIAA Aerospace Sciences Meeting and Exhibit, Reno, Nevada, 5–8 January 2004. [Google Scholar]
  8. Vassberg, J.; Yeh, D.; Blair, A.; Evert, J. Numerical Simulations of KC-10 In-Flight Refueling Hose-Drogue Dynamics with an Approaching F/A-18D Receiver Aircraft. In Proceedings of the 23rd AIAA Applied Aerodynamics Conference, Toronto, ON, Canada, 6–9 June 2005. [Google Scholar]
  9. Liu, Z.J.; Song, C.C.; Liang, J.Y.; Li, Q.; He, W. Advances in modeling and control of probe-drogue aerial refueling. Chin. J. Eng. 2021, 43, 150–160. [Google Scholar]
  10. Chen, Y.X. Numerical Simulation of Hose-Drogue Release and Retraction Dynamics. Master’s Thesis, National University of Defense Technology, Changsha, China, 2016. [Google Scholar]
  11. Zhang, J.D.; Zuo, Q.; Lin, M.; Huang, W.; Pan, W.; Cui, G. Numerical simulation on near-field evolution of wake vortices of ARJ21 plane with crosswind. Acta Aeronaut. Astronaut. Sin. 2022, 43, 125043. [Google Scholar]
  12. Wang, R.; Zhuo, Z.; Guo, R.H.; Huang, Y.C. Multi-body dynamics simulation and experiment of solar-powered UAV parachute landing. Acta Aeronaut. Astronaut. Sin. 2022, 43, 225721. [Google Scholar]
  13. Huang, X.; Lu, J.; Zhang, H.Y.; Wang, X. Wind tunnel test technique for aerodynamic stability of refueling hose-drogue of aerial tanker. Acta Aerodyn. Sin. 2019, 37, 140–146. [Google Scholar]
  14. Hao, Y.Y.; Wang, J.L.; Han, B. Analysis of swing characteristics of probe and drogue aerial refueling paradrogue. Mod. Mach. 2019, 3, 60–63. [Google Scholar]
  15. Ro, K.; Kamman, J.W. Modeling and Simulation of Hose-Paradrogue Aerial Refueling Systems. J. Guid. Control Dyn. 2010, 33, 53–63. [Google Scholar] [CrossRef]
  16. Wen, M.; Zhang, X.M.; Niu, H.W.; Zhang, Q. Load measurement scheme of refueling receptacles in aerial refueling process and ground test verification. Mech. Sci. Technol. Aerosp. Eng. 2020, 39, 1307–1312. [Google Scholar]
  17. Ro, K.; Kuk, T.; Kamman, J.W. Dynamics and Control of Hose-Drogue Refueling Systems During Coupling. J. Guid. Control Dyn. 2011, 34, 1694–1708. [Google Scholar] [CrossRef]
  18. Dai, X.H.; Wei, Z.B.; Quan, Q. Modeling and simulation of bow wave effect in probe and drogue aerial refueling. Chin. J. Aeronaut. 2016, 29, 448–461. [Google Scholar] [CrossRef]
  19. Dogan, A.; Blake, W.; Haag, C. Bow Wave Effect in Aerial Refueling: Computational Analysis and Modeling. J. Aircr. 2013, 50, 1856–1868. [Google Scholar] [CrossRef]
  20. Xu, J.; Zhang, X.F. Dynamic modeling and simulation of bow wave effect in hose-drogue aerial refueling system. Flight Dynmics 2019, 37, 40–44. [Google Scholar]
  21. Bhandari, U.; Thomas, P.R.; Richardson, T.S. Bow wave effect in probe and drogue aerial refuelling. In Proceedings of the AIAA Guidance, Navigation, and Control (GNC) Conference, Boston, MA, USA, 19–22 August 2013. [Google Scholar]
Figure 1. Flow sketch in transonic wind tunnel test section.
Aerospace 12 00646 g001
Figure 2. Overall test scheme and device grogram.
Aerospace 12 00646 g002
Figure 3. Installation of hose–drogue system and test model in wind tunnel.
Aerospace 12 00646 g003
Figure 4. VMD measuring system principle.
Aerospace 12 00646 g004
Figure 5. Arrangement of marking points on hoses.
Aerospace 12 00646 g005
Figure 6. ALE cable model diagram of refueling hose.
Aerospace 12 00646 g006
Figure 7. Towing state of hose at different Mach numbers in wind tunnel. (a) Rope towing state; (b) drag force varies with Mach number.
Aerospace 12 00646 g007
Figure 8. Longitudinal position change in drogue at different approaching distances of receiver.
Aerospace 12 00646 g008
Figure 9. Movement course and track of the drogue in the vertical flow section at different approaching distances of the receiver.
Aerospace 12 00646 g009
Figure 10. Simulation of hose whipping.
Aerospace 12 00646 g010
Figure 11. Spatial–temporal evolution diagram of hose changes under different hose stiffnesses. (a) High stiffness (16 MPa); (b) Low stiffness (4 MPa).
Aerospace 12 00646 g011
Figure 12. Propagation velocity of longitudinal wave and shear wave under different hose stiffnesses.
Aerospace 12 00646 g012
Figure 13. Maximum shear force of hose under different hose stiffnesses.
Aerospace 12 00646 g013
Figure 14. Spatial–temporal evolution diagram of hose changes under different Mach numbers. (a) Ma = 0.7; (b) Ma = 0.3.
Aerospace 12 00646 g014
Figure 15. Propagation velocity of longitudinal wave and shear wave under different Mach numbers.
Aerospace 12 00646 g015
Figure 16. Maximum shear force of hose under different Mach numbers.
Aerospace 12 00646 g016
Figure 17. Spatial–temporal evolution diagram of head wave influence on hose. (a) Considering the influence of head wave; (b) considering the influence of tanker wake; (c) considering both the influence of head wave and tanker wake.
Aerospace 12 00646 g017
Table 1. Wall configurations of 2.4 m transonic wind tunnel.
Wall ConfigurationFull Model Test SectionHalf Model Test Section
Wall porosity ratio τ (%)Upper and lower0–7.50–12.6
side0–8.50–8.1
overall0–8.00–10.4
Ejector-slot ΔH (mm)286290
Wall angle θ W (°)0,0.2,0.30
Table 2. Main parameters of the hose and drogue.
Physical ParametersValue
Outer diameter of hose/mm68
Inner diameter of hose/mm54
Linear density of hose oil filling/kg/m4.2
Drogue mass/kg40
Damping area of stable umbrella/m20.204
Table 3. Maximum shear force of the hose.
Influencing FactorsNoneOnly Head WaveOnly Tanker Wake Both
Peak shear force(kN)4.685.364.037.89
Disclaimer/Publisher’s Note: The statements, opinions and data contained in all publications are solely those of the individual author(s) and contributor(s) and not of MDPI and/or the editor(s). MDPI and/or the editor(s) disclaim responsibility for any injury to people or property resulting from any ideas, methods, instructions or products referred to in the content.

