Abstract
In airport operations management, accurately estimating the service durations of ground support equipment such as Potable Water Trucks (PWTs) is essential for improving resource allocation efficiency and ensuring timely aircraft turnaround. Traditional estimation methods often use fixed averages or assume normal distributions, failing to capture real-world variability and extreme scenarios effectively. To address these limitations, this study performs a comprehensive statistical analysis of PWT service durations using operational data from Beijing Daxing International Airport (ZBAD) and Shanghai Pudong International Airport (ZSPD). Employing chi-square goodness-of-fit tests, twenty probability distributions—including several heavy-tailed candidates—were rigorously evaluated under segmented scenarios, such as peak versus non-peak periods, varying temperature conditions, and different aircraft sizes. Results reveal that heavy-tailed distributions offer context-dependent advantages: the stable distribution exhibits superior modeling performance during peak operational periods, whereas the Burr distribution excels under non-peak conditions. Interestingly, contrary to existing operational assumptions, service durations at extremely high and low temperatures showed no significant statistical differences, prompting a reconsideration of temperature-dependent planning practices. Additionally, analysis by aircraft category showed that the Burr distribution best described service durations for large aircraft, while stable and log-logistic distributions were optimal for medium-sized aircraft. Numerical simulations confirmed these findings, demonstrating that the proposed heavy-tailed probabilistic models significantly improved resource prediction accuracy, reducing estimation errors by 13% to 25% compared to conventional methods. This research uniquely demonstrates the practical effectiveness of employing context-sensitive heavy-tailed distributions, substantially enhancing resource efficiency and operational reliability in airport ground handling management.
1. Introduction
In airport operations, the efficient functioning of support vehicles is vital for maintaining flight punctuality and ensuring overall operational efficiency. As a key component among airport support vehicles, PWTs provide essential water supplies to flights. The duration of their service directly affects flight turnaround times and significantly influences airport resource allocation and scheduling. Therefore, accurately understanding the distribution characteristics of PWT service durations is crucial for optimizing airport management and enhancing service quality.
Although previous studies [1,2,3,4] have explored the service durations of support vehicles, they primarily employed fixed values or simple averages to estimate service durations, failing to adequately account for the inherent randomness and complexity of real-world operations. Such methods, while simplifying calculations, may introduce biases that compromise the accuracy of airport scheduling and management decisions.
This paper introduces a statistically rigorous and scientifically grounded approach to address these issues. Twenty widely utilized engineering Probability Distribution (PD) models were selected to fit the service duration data of PWTs, and chi-square tests were rigorously applied to evaluate their fitting performance. This approach aims to systematically identify and validate the most suitable PD models, providing a reliable theoretical foundation and data support for optimizing airport resource allocation and scheduling strategies. Additionally, this study investigates the impact of different operational conditions on PWT service durations. Specifically, a segmented analysis was performed based on departure peak and non-peak periods, varying temperatures (high, medium, and low), and different aircraft categories (medium and large). Probability distribution fitting and chi-square tests were conducted for each segment to identify the key factors influencing service durations and to quantify variations under different operational conditions.
The structure of this paper is organized as follows: Section 2 provides a critical review of the existing literature, highlighting key gaps related to traditional estimation methods for ground support vehicle service durations. Section 3 outlines the methodological framework in detail, including the selection and application of 20 candidate probability distributions, procedures for data segmentation by key operational factors (peak/non-peak periods, temperature ranges, and aircraft categories), and specific procedures for the chi-square goodness-of-fit tests. Subsequently, Section 4 presents a comprehensive statistical analysis, identifying context-specific optimal distributions for modeling PWT service durations, and quantitatively demonstrating their performance through rigorous numerical simulations. The validation includes a comparative assessment of predicted truck requirements against actual operational data from two of China’s busiest airports, ZBAD and ZSPD, demonstrating the superior predictive accuracy of the proposed models over traditional fixed-average and normal distribution assumptions. Finally, Section 5 synthesizes the study’s main contributions, discussing practical implications for airport operational management, addressing the study’s limitations, and suggesting avenues for future research.
2. Literature Review
Airport ground handling comprises numerous interdependent tasks (e.g., fueling, catering, potable water servicing) that must be completed in a short timeframe to ensure punctual flight departures [5,6]. Efficient coordination of ground support activities directly affects turnaround times and operational reliability [5]. Consequently, a substantial body of research has focused on optimizing ground handling operations, scheduling support resources, and modeling service durations. This section critically reviews the relevant literature, highlighting how the current study on heavy-tailed service duration modeling of PWTs is positioned within and advances airport ground handling research. The review is organized into four parts: Section 2.1 covers ground handling operations and vehicle scheduling approaches; Section 2.2 discusses the use of simulation and treatment of uncertainty in ground handling; Section 2.3 examines statistical modeling of service durations in prior studies; and Section 2.4 identifies the research gap addressed by this study.
2.1. Ground Handling Operations and Scheduling
Effective scheduling of ground handling operations has been a long-standing challenge due to the need to assign multiple support vehicles and staff to aircraft tasks under tight time constraints [6]. Early studies on aircraft ground service scheduling applied operations research techniques to optimize task sequences and resource allocation. For example, Ip [1] formulated the ground service scheduling problem as a combinatorial optimization and proposed a genetic algorithm to coordinate various support tasks (catering, cleaning, fueling, etc.) for minimal turnaround time. Similarly, subsequent works introduced heuristic and metaheuristic scheduling algorithms to improve the assignment of ground support vehicles and personnel. These optimization-focused studies often assumed deterministic or fixed service times for each task (sometimes differentiated by aircraft type or service category) to simplify the scheduling problem. Using fixed-duration estimates can reduce computational complexity and facilitate scheduling in busy hub airports. However, a critical limitation is that fixed or average service durations fail to capture real-world variability. Factors like last-minute maintenance issues, weather disruptions, flight delays, and human factors (e.g., varying crew efficiency) introduce substantial randomness into service times. As a result, schedules based on deterministic times risk being suboptimal or infeasible when stochastic delays occur, prompting delays that propagate to flight departures. Recent research began to acknowledge these issues: for instance, some studies incorporated buffer times or stochastic parameters into scheduling models, and Zhu [7] explored scheduling algorithms under uncertain task durations. Nevertheless, many traditional scheduling approaches did not explicitly model the full distribution of service times, focusing instead on average-case estimates. The present study contributes to this area by providing statistically robust estimates of service duration distributions (including their extreme values), which can be used to inform more resilient ground handling schedules. By characterizing heavy-tailed behavior in service durations, this work addresses a key limitation of prior scheduling models—the underestimation of variability—thereby enabling schedules that are better cushioned against extreme delays compared to those using fixed-time assumptions.
2.2. Simulation and Uncertainty in Ground Handling
Given the complexity and uncertainty in ground operations, simulation has emerged as an essential tool for analysis and planning. Researchers have developed detailed simulation models (discrete-event, agent-based, etc.) to mimic aircraft turnaround processes and evaluate how random service durations impact overall performance. For example, Kwasiborska [5] built a Simio-based simulation of airport ground handling, demonstrating that using realistic service time distributions is crucial for accurate process modeling. Lao [8] created an agent-based ground handling simulator to study resource utilization, highlighting the importance of capturing variability in support vehicle service times rather than relying on point estimates. In a survey of scheduling under uncertainty, Sheibani [6] emphasized the value of Monte Carlo simulation to account for stochastic service durations in critical path analyses. Likewise, Kierzkowski and Kisiel [9,10] integrated random service time generators into their ground handling simulation models, acknowledging that turnaround activities have inherently random durations. These works collectively underline that uncertainty must be explicitly modeled to obtain robust and reliable solutions in ground operations. In line with this, some recent approaches combine optimization with simulation: Guimarans [11] proposed a stochastic scheduling method that embeds Monte Carlo simulation within a resource allocation algorithm, thereby producing more robust ground support schedules under random service and travel times. Such hybrid methods showed improved on-time performance by evaluating schedule candidates against a range of simulated scenarios. However, a notable gap in the simulation studies to date is the lack of emphasis on heavy-tailed service time distributions. Most simulations assumed either empirical distributions or well-known light-tailed models (e.g., normal or exponential) for service durations. If the true service time distribution has a heavy tail (meaning a higher probability of extreme long durations than a normal distribution would predict), using lighter-tailed assumptions can under-represent the risk of severe delays. The current study addresses this shortcoming by identifying and validating heavy-tailed distributions for PWT service times. The improved fidelity in service time modeling can directly enhance simulation-based evaluations of ground handling operations, enabling more accurate assessment of delay risks and resource requirements under uncertainty.
2.3. Statistical Modeling of Service Durations
Another stream of relevant research has focused on empirically analyzing and modeling the duration of ground handling services. These studies aim to derive probability distributions or predictive models for task durations using historical data. Early efforts in this area provided descriptive statistics: for instance, Chen [12] and Li [13] evaluated airport support capacity by calculating average service times and basic variability measures from operational records. While such analyses offered initial benchmarks, they often failed to account for outliers and distributional shape, limiting the accuracy of predictions. Subsequent works took steps toward including probabilistic models. Some authors computed average duration values by task or used simple assumed distributions (e.g., uniform or triangular distributions) in simulation studies. For example, certain airport bus transfer and passenger boarding simulations treated service times with triangular distributions or fixed means to simplify calculations. These simplifications eased computational load but risked overlooking data heterogeneity, as real service times often show skewed or multi-modal patterns. To improve realism, a number of studies began fitting standard parametric distributions to ground service duration data. Researchers have tried normal, lognormal, and gamma distributions for various support activities, finding that fitted models better reflect actual operation times than constant averages. For instance, Xing [14] and Xu [15] modeled certain vehicle service processes with lognormal or gamma distributions, demonstrating reduced error in capacity simulations. However, a recurring issue was the lack of rigorous goodness-of-fit testing and rationale for distribution choice. In many cases, distributions were selected ad hoc or without statistically comparing alternatives, and significance tests (e.g., chi-square or Kolmogorov–Smirnov) were not consistently applied. Studies by Zhu [7,16] fitted multiple distributions to aircraft service tasks, but did not thoroughly discuss which model was most applicable under different conditions or confidence levels. Feng [17] specifically examined the distribution of aircraft boarding durations, considering normal, Poisson, and Weibull models. Their results indicated possible deviation from the normal assumption, but low p-values in goodness-of-fit tests meant no single distribution could be confidently generalized. These mixed outcomes suggest that more flexible or heavy-tailed distributions might be needed for complex service processes. Indeed, some recent evidence supports the presence of heavy tails: a 2023 study by Harjono [18] on overall aircraft ground times at a major airport found that many flight categories are best described by heavy-tailed distributions like the Burr and generalized extreme value distributions. In their analysis, narrow-body and wide-body flights for certain airlines exhibited Burr or generalized extreme value distributed ground times, indicating a higher likelihood of very long turnaround outliers than traditional models would predict. This insight aligns with the intuition that rare but significant delays (e.g., a very slow potable water service due to equipment failure) can heavily skew the distribution. However, heavy-tailed models (such as Pareto, Burr, log-logistic, or stable distributions) have seldom been explicitly considered in prior ground handling studies—likely due to their mathematical complexity and the conventional focus on well-known distributions. Our study builds on this research by systematically evaluating a broad family of distributions (including several heavy-tailed candidates) for modeling PWT service durations. By applying rigorous goodness-of-fit tests (chi-square) and comparing across multiple scenarios, we provide a comprehensive statistical characterization of service time behavior. This addresses the limitations of earlier works by offering clear criteria for distribution selection and highlighting context-dependent model performance (e.g., which distribution fits best during peak periods versus off-peak).
2.4. Identification of the Research Gap
From the above review, it is evident that while considerable progress has been made in ground handling research, critical gaps remain at the intersection of operations scheduling, simulation under uncertainty, and statistical modeling of service times. Ground support scheduling studies (Section 2.1) underscore the importance of accurate service duration estimates but largely rely on simplified assumptions, lacking incorporation of the full stochastic nature of service processes. Simulation-based research (Section 2.2) demonstrates the need to model uncertainty and variability in turnaround operations, yet prior simulations rarely accounted for heavy-tailed extreme events in service durations. Statistical analyses of service times (Section 2.3) have introduced distribution fitting into ground handling, but have often been limited to a narrow set of distributions (typically light-tailed) and have not rigorously justified the choice of models or examined the influence of different operational conditions. No previous study, to our knowledge, has explicitly focused on heavy-tailed probability distributions in the context of specific ground support services (such as potable water provision) or performed a segmented analysis to see how distributional characteristics change with context (peak versus off-peak, weather, aircraft size, etc.). This represents a significant research gap. The current study addresses this gap by providing a focused investigation into PWT service durations with a twofold novelty: (1) a broad evaluation of candidate distributions (20 in total, including heavy-tailed families) using goodness-of-fit testing to determine the statistically best-fitting models; and (2) a context-sensitive analysis that compares distribution fits across different scenarios (traffic peaks, temperature ranges, aircraft categories). By doing so, we directly respond to the shortcomings identified in past work—namely, the lack of sufficient statistical analysis and unclear criteria for distribution selection in modeling ground service times. Our findings not only fill a gap in the literature by spotlighting heavy-tailed distributions (e.g., Burr, stable) as viable models for certain conditions, but also offer practical insights: knowing the appropriate service time distribution for a given context can improve resource allocation decisions and the realism of simulation and scheduling models. In summary, this study advances airport ground handling research by bridging the domains of scheduling, simulation, and statistical modeling, ultimately enhancing the understanding of service duration variability and how to effectively model it for improved operational efficiency.
3. Analysis Model for PWT Service Duration
This section outlines the analytical model developed to analyze and evaluate the service duration of PWT at airports. The model comprises several critical components, including data selection and preprocessing, fitting of single-parameter, two-parameter, and multi-parameter PDs, and rigorous evaluation via the chi-square goodness-of-fit test. Through these steps, the optimal PD model for PWT service duration under various operating conditions is identified, providing a robust framework for the optimization of airport ground operations and resource allocation.
The model’s workflow is illustrated visually in Figure 1, which provides a clear and concise overview of the process from data selection through to the final model evaluation.
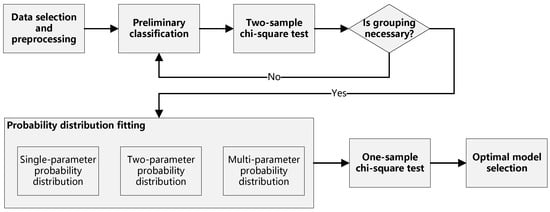
Figure 1.
Workflow of the analysis model for PWT service duration.
3.1. Data Selection and Preprocessing
This study utilized operational records of PWT service durations from ZBAD and ZSPD for the year 2023. The raw dataset, containing approximately 360,000 records, was extracted from the airports’ turnaround tracking systems (Airport-Collaborative Decision Making (A-CDM)), which log the start and end times of each PWT service event using automated vehicle positioning systems combined with onboard operational buttons. The accuracy of these automated records was validated through manual sampling checks, confirming data reliability. We cleaned the dataset by removing incomplete entries lacking either start or end times, as well as erroneous entries such as negative or zero durations. These problematic records collectively constituted approximately 0.11% of the total dataset. After cleaning, the data were checked thoroughly for consistency and completeness, resulting in a high-quality dataset representative of diverse operational conditions. The large sample size and inclusion of data from two different airports lend robustness to our statistical analysis and increase confidence in the reliability of the results.
Key fields from each data record are shown in Table 1. The service duration of the PWT for each pair of arrival and departure flights was calculated as the difference between the potable water fill end time and the potable water fill start time.

Table 1.
Sample data format.
Furthermore, beyond temperature-based segmentation, we also checked for temporal patterns such as time-of-day or day-of-week effects; however, no consistent additional temporal trend was observed once peak versus non-peak operational periods (see Section 4.1) were accounted for.
3.2. Parametric Probability Distributions
Parametric probability distributions (PDs) are essential tools in statistical modeling, allowing for the concise characterization of variability in observed data through mathematical expressions. Commonly utilized parametric distributions include single-parameter (e.g., exponential, Poisson, Rayleigh), two-parameter (normal, lognormal, Weibull, logistic, gamma, etc.), and multi-parameter distributions (e.g., Burr, generalized extreme value, generalized Pareto, stable).
Table 2 summarizes the 20 common probability distributions evaluated in this study. Single-parameter distributions such as exponential and Poisson are useful for simple scenarios with minimal variability. Two-parameter distributions (e.g., normal and lognormal) allow for more realistic modeling by accounting for additional variability or skewness, while multi-parameter distributions like Burr and stable offer flexibility in capturing heavy-tailed data, which frequently occurs in airport service operations.
Table 2.
Common PDs.
Specifically, the stable distribution, characterized by four parameters, exhibits notable flexibility in modeling datasets characterized by significant skewness and heavy tails, making it particularly suited for representing complex operational conditions such as peak airport departure periods. Similarly, the three-parameter Burr distribution offers substantial adaptability, efficiently capturing the variations in service duration associated with different aircraft categories and operational intensities.
This structured overview establishes a clear context for choosing appropriate statistical distributions for modeling airport ground handling service durations, which are inherently stochastic, varied, and influenced by multiple operational factors.
3.3. Probability Distribution Fitting and Sample Group Testing
In statistical analysis, one-sample and two-sample tests [40] are frequently employed to assess differences between sample data and theoretical distributions, or between two distinct datasets. One-sample tests assess whether a sample conforms to a known theoretical distribution. In contrast, two-sample tests compare the distributions of two sample groups to determine if they are statistically similar.
Standard one-sample test methods include the chi-square [41], Kolmogorov–Smirnov [42], and Anderson–Darling [43] tests. The chi-square test compares observed frequency distributions against expected frequencies, rendering it suitable for categorical data; however, it requires large sample sizes, particularly when numerous categories are involved. The Kolmogorov–Smirnov test compares the sample distribution to the theoretical distribution. It is suitable for continuous data, with the advantage of not requiring data binning, although it is sensitive to extreme values. The Anderson–Darling test, similar to the Kolmogorov–Smirnov test, is more sensitive to discrepancies in the distribution tails, making it better suited for evaluating the fit of distribution tails.
Standard two-sample test methods include the chi-square, t-test [44], and Mann–Whitney U-test [45]. The chi-square test compares the distributions of two datasets, though it requires balanced sample sizes and category frequencies. The t-test compares the means of two independent samples, assuming normal distribution and equal variances, making it suitable for continuous data, but it is sensitive to deviations from normality. The Mann–Whitney U-test is a non-parametric test used to compare the distributions of two independent samples applicable to non-normally distributed data. However, it does not provide information on the specific shape of the distributions.
In this study, we selected the chi-square test to evaluate the goodness-of-fit of single-sample PDs. This choice is based on several key considerations: First, the chi-square test is well suited for discrete and categorical data, and the PWT service duration data in this study is recorded in whole minutes, making it appropriate for chi-square testing. Second, the chi-square test effectively detects differences between sample data and theoretical distributions, allowing for a robust assessment of fit quality. Furthermore, the chi-square test can handle multiple categories, providing detailed analysis across various periods or classifications.
The large dataset in this study also plays a critical role in choosing the chi-square test. Large sample sizes ensure sufficient category frequencies, leading to more stable and reliable chi-square statistics and, thus, enhancing the accuracy and significance of results. This characteristic makes the chi-square test particularly suitable for categorical analysis of large datasets.
Additionally, the chi-square test is employed for two-sample testing to assess whether two data groups originate from the same distribution. This is crucial in determining the necessity for further categorization or grouping of data. Using the two-sample chi-square test, we can explore whether there are significant differences in PWT service durations under different conditions, thereby informing the analysis of these classification factors.
In summary, the chi-square test is a flexible and effective tool suitable for this study’s one-sample and two-sample data analysis needs. Therefore, we have chosen the chi-square test as the primary method for testing the service duration data of PWTs.
3.3.1. Chi-Square Test Methodology
The chi-square test is a statistical method employed to evaluate the discrepancy between observed and expected frequencies. The statistical significance of this discrepancy can be assessed through the calculation of the chi-square statistic , degrees of freedom df, and p-value.
The chi-square statistic is calculated using the following formula:
where represents the observed frequency, and represents the expected frequency.
Degrees of freedom represent the number of independent pieces of information in the data set. For the chi-square test, degrees of freedom are calculated as follows:
where k is the number of categories, and p is the number of estimated parameters.
The p-value is calculated from the chi-square statistic and degrees of freedom, indicating the significance of the difference between observed and expected data. The calculation formula is
where F is the cumulative distribution function of the chi-square distribution, defined as
where is the gamma function, and x is the integration variable. The gamma function is defined as
Calculating the chi-square statistic , degrees of freedom df, and p-value enables the assessment of the discrepancy between observed and expected data. A large chi-square statistic corresponds to a small p-value, indicating a significant discrepancy between the observed and expected data. Conversely, a small chi-square statistic corresponds to a large p-value, indicating a minor discrepancy between the observed and expected data.
3.3.2. Interpreting the Chi-Square Test
The null hypothesis () of the chi-square test states that there is no significant discrepancy between the observed and expected data. This implies that the observed data conform to the specified theoretical distribution or, in the case of an independence test, that no significant difference exists between two observed datasets. The p-value indicates the probability of obtaining the observed data (or more extreme results) assuming that the null hypothesis is true, thereby quantifying the degree of deviation from the null hypothesis. The confidence level (Confidence Level (CL)) represents the stringency of rejecting the null hypothesis, with typical CLs set at 95% and 99%.
If the p-value is lower than the significance level (typically ), there is sufficient statistical evidence to reject the null hypothesis, indicating a significant discrepancy between the observed data and the specified distribution or dataset. Conversely, if the p-value is greater than or equal to the significance level, the evidence is insufficient to reject the null hypothesis, indicating no significant discrepancy.
Generally, a larger p-value implies a better fit between the probability distribution and the observed data, while a smaller p-value suggests a poorer fit. The specific fit quality can be classified into five ranges based on typical confidence levels (95% and 99%), as summarized in Table 3.
Table 3.
p-value ranges and corresponding fit quality descriptions at 95% and 99% CLs.
4. Experimental Results and Discussion
In this study, a comprehensive statistical analysis of the processed PWT service duration data from ZBAD was performed. The analysis primarily centers on ZBAD. Based on the distribution characteristics of the data, we calculated the service duration density for ZBAD, as shown in Figure 2. After thoroughly analyzing the data from ZBAD, a comparative analysis with the corresponding data from ZSPD was conducted.
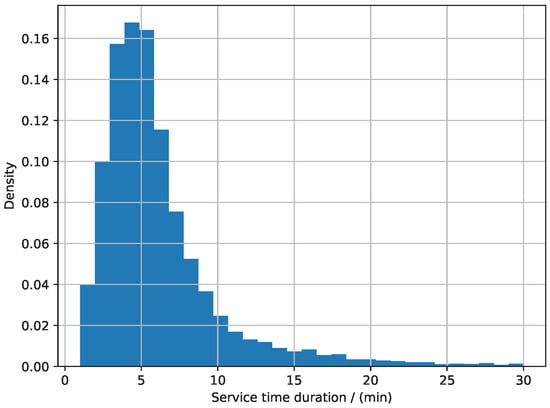
Figure 2.
Density distribution of PWT service duration.
Essential statistical characteristics, including the mean, variance, median, skewness, and kurtosis, were comprehensively analyzed to evaluate the PWT service durations. These statistics provide critical insights into the central tendency, dispersion, symmetry, and tail characteristics of the data distribution.
The analysis revealed that the mean service duration was 5.82 min, indicating that the average PWT service duration across the sample was close to 6 min. This finding is consistent with previous research [5], which reported a mean service duration of 6.47 min for similar services. The median was 5 min, suggesting that 50% of the service durations were 5 min or less. The variance was 17.28, indicating considerable dispersion in the service durations. The skewness was 2.30, demonstrating a significant right skew in the data, with most service durations concentrated at shorter times but with a long right tail. The kurtosis was 7.13, indicating that the distribution had a higher peak than a normal distribution, with more pronounced heavy tails. These statistical analyses provide a solid foundation for understanding the characteristics of PWT service duration data.
Following this initial analysis of the overall data characteristics, the necessity and feasibility of classifying data according to various factors were further explored. Such classification is valuable in identifying variations under differing conditions and in elucidating underlying causal factors. This is particularly important for enhancing ground service efficiency, formulating targeted strategies, and optimizing resource allocation. The need for classification analysis is based on the following considerations:
- Firstly, different operational conditions may significantly affect PWT service durations. For instance, the varying flight densities during peak and non-peak departure periods may lead to differences in service demand and pressure, subsequently impacting service duration. An in-depth analysis of these factors can help airport management better understand resource requirements during peak periods and enable more effective scheduling and management.
- Secondly, external environmental conditions, such as temperature variations, may also influence the efficiency and speed of ground service operations. Extreme temperatures could reduce equipment efficiency or increase operation time, affecting PWT service duration distribution. By analyzing the impact of temperature on service duration, we can better understand and address the operational challenges posed by different climate conditions.
- Thirdly, different aircraft types may also vary service demand and duration significantly. Larger aircraft typically require more water replenishment, leading to longer service durations. We can develop more refined service standards and operational procedures tailored to specific aircraft types by analyzing different aircraft categories.
- We also acknowledge the potential influences of factors such as PWT capacity and the number of PWTs simultaneously servicing an aircraft. However, given the uniformity of PWT capacity across both airports and the standardized PWT allocation by Civil Aviation Administration of China (CAAC) based on aircraft categories, these factors are implicitly captured in the aircraft-category analysis. Therefore, a separate analysis of these factors was not necessary, ensuring both methodological simplicity and operational clarity.
These classification factors were partly selected based on feedback obtained from frontline management and operational staff at the airport. The survey results suggest that the abovementioned factors could significantly influence the efficiency and duration of PWT services in practice. Therefore, a classification analysis of these factors is necessary.
Although these classifications are grounded in operational experience and frontline feedback, their specific necessity and statistical significance require further validation. To this end, we perform chi-square tests after classification to assess whether statistically significant differences exist between the classified groups. The chi-square tests determine whether statistically significant differences exist among the classified groups, indicating whether these groups originate from distinct distributions. This confirms the rationality and scientific robustness of the classifications.
Overall, by classifying the data according to peak and non-peak departure periods, temperature variations, and aircraft categories, we can more accurately identify the key factors affecting PWT service durations. This approach contributes to improving service efficiency and resource utilization and provides a scientific basis for decision making in airport ground service management. In the subsequent analysis, we will examine the impact of these classification factors in detail to offer practical recommendations for optimizing airport ground services.
4.1. Classification Based on Peak and Non-Peak Departure Periods
When serving departing flights, PWTs experience increased workloads during peak departure periods, necessitating continuous sequential servicing of aircraft. This scenario often results in relatively shorter service durations. Conversely, during non-peak periods, when workloads are lower and the requirement for continuous service decreases, service durations may become relatively longer.
The peak and non-peak departure periods were classified as follows: Initially, the number of departing flights per hour throughout the day was determined. Subsequently, the distribution of these hourly departure numbers was arranged in ascending order. Finally, following recommendations from the International Civil Aviation Organization (ICAO) regarding airport capacity evaluation methods [46], periods with departure numbers above the 75th percentile were classified as peak periods, while those below this threshold were classified as non-peak periods. This method ensures a statistically robust and officially supported classification into peak and non-peak periods.
To quantitatively analyze the impact of peak and non-peak periods on PWT service duration, a chi-square test was employed to determine whether service durations during these periods originate from the same statistical distribution at the 95% and 99% CLs. The chi-square test results indicated a chi-square statistic of 1180.67 with 784 degrees of freedom and a p-value of . These results suggest that there are statistically significant differences between service duration distributions during peak and non-peak periods, as indicated by their failure to pass the chi-square test at both the 95% and 99% CLs.
In summary, there is a significant difference in the distribution of PWT service durations between peak and non-peak departure periods. During peak periods, the service duration is shorter due to the demand for continuous service, while during non-peak periods, the service duration is longer due to the lower frequency of service.
Furthermore, to analyze the impact of peak and non-peak periods in more detail, we fitted multiple PDs to the service duration data for both scenarios. By fitting single-parameter, two-parameter, and multi-parameter PDs, we can better understand the distribution characteristics of PWT service durations under different conditions.
Figure 3 provides a comprehensive visualization of the fitting results for single-parameter, two-parameter, and multi-parameter PDs applied to PWT service duration data during peak and non-peak periods. Specifically, Figure 3a shows the fitting curves and error bars for single-parameter PDs, Figure 3b presents the fitting results for two-parameter distributions, and Figure 3c illustrates the fitting outcomes for multi-parameter distributions. Through this figure, we can qualitatively assess the relationship between the fitted PD curves and the original data distribution.
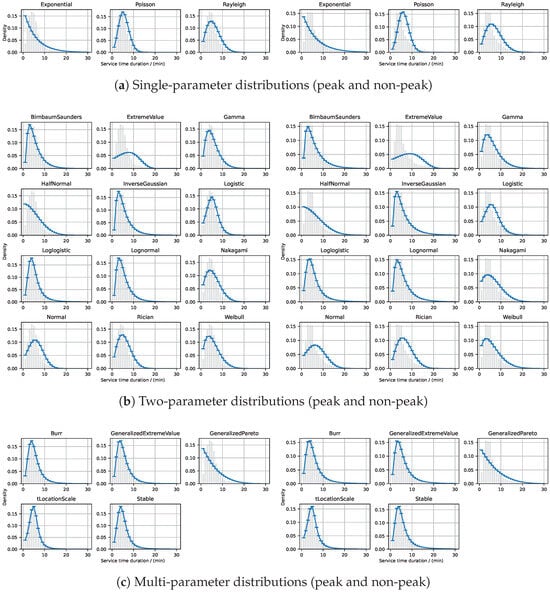
Figure 3.
PD fitting results for PWT service durations during departure peak and non-peak periods, using single-parameter, two-parameter, and multi-parameter models.
Considering the complete dataset, the optimal probability distributions for peak and non-peak periods along with their estimated parameters (obtained via maximum likelihood estimation) are as follows:
- Peak period (stable distribution): The service duration data during peak periods were optimally modeled by the stable distribution. The stable distribution does not generally have a simple closed-form Probability Density Function (PDF), but is, instead, characterized by its characteristic function, given as follows:When :When :where is the stability parameter characterizing tail heaviness, is the skewness parameter describing asymmetry, is the scale parameter, and is the location parameter. Specifically, the maximum likelihood estimation yielded the following fitted parameter values for the stable distribution during peak periods:Considering the complete dataset, the stable distribution characterized by these parameters effectively captures the heavy-tailed nature of service durations observed during peak periods, as confirmed by a chi-square goodness-of-fit test statistic of and an associated p-value of , indicating an excellent statistical fit.
- Non-peak period (Burr distribution): The service duration data during non-peak periods were optimally modeled by the Burr distribution (Type XII). The PDF of the Burr distribution is explicitly given bywhere and are the shape parameters that control the tail behavior and flexibility, and is the scale parameter. Specifically, the maximum likelihood estimation yielded the following fitted parameter values for the Burr distribution during non-peak periods:Considering the complete dataset, the Burr distribution characterized by these parameters effectively captures the variability of service durations observed during non-peak periods, as confirmed by a chi-square goodness-of-fit test statistic of and an associated p-value of , indicating an excellent statistical fit.
Additionally, to assess robustness, 100 randomized experiments were performed, each fitting distributions to 80% randomly sampled data from the original dataset. The results of the chi-square tests quantitatively evaluating the fitting performance are presented in Figure 4, offering detailed statistical insights into the goodness-of-fit assessments.
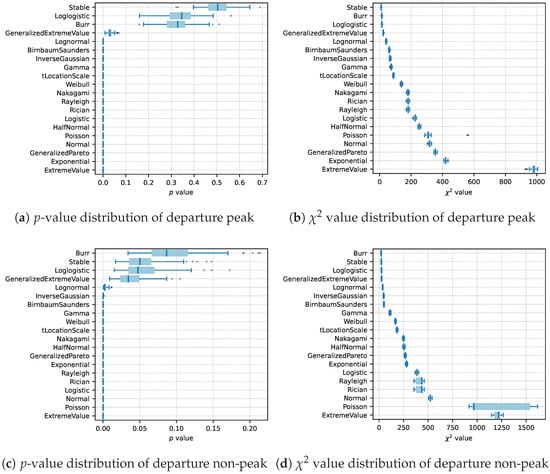
Figure 4.
Chi-square test results of PWT service durations are categorized by departure peak and non-peak periods, showing p-value and value distributions. Each distribution is based on 100 random samples, where 80% of the original data were used for fitting in each sample.
In Figure 4, based on a comprehensive evaluation of the fitting performance of various PDs for PWT service durations during peak and non-peak periods, several key conclusions are evident. During peak periods, the distribution exhibits clear regularity and stability, with the stable distribution showing the best overall fit (chi-square statistic = 9.30, p-value = 0.51). The Burr and log-logistic distributions also exhibit robust performance, successfully passing the goodness-of-fit tests at both the 95% and 99% CLs. In contrast, the generalized extreme value distribution demonstrates moderate fitting performance, passing the test at the 95% level but failing at the more stringent 99% level.
During non-peak periods, although the regularity is comparatively weaker, the Burr distribution achieves the best fit (chi-square statistic = 21.40, p-value = ), closely followed by the stable and log-logistic distributions. These three distributions consistently pass the chi-square tests at both confidence levels, indicating robust suitability for modeling non-peak service durations. However, as observed during peak periods, the generalized extreme value distribution exhibits limited accuracy, failing at the more stringent 95% confidence level.
Other evaluated distributions consistently demonstrate inferior performance across both peak and non-peak scenarios, indicating that future modeling efforts should prioritize the more accurate stable, Burr, and log-logistic distributions, rather than general or less suitable alternatives. Future research could explore alternative distribution models or employ advanced data processing techniques to further enhance fitting accuracy and predictive precision.
4.2. Classification Based on Temperatures
When servicing departing flights, ambient temperature exerts a significant influence on the potable water demand of aircraft, which in turn can impact the service durations of PWTs. Therefore, in this study, temperatures were classified into three categories—low, medium, and high—in accordance with the National Oceanic and Atmospheric Administration’s Climate (NOAA) climate classification standard [47]. The specific thresholds are defined as follows: low temperature (below 50 °F), medium temperature (50 °F to 70 °F), and high temperature (above 70 °F). This classification facilitates a more precise assessment of temperature’s influence on PWT service durations.
To quantitatively assess the impact of temperature on PWT service durations, a chi-square test was employed to examine whether the distributions of service durations under low-, medium-, and high-temperature conditions differ significantly at the 95% and 99% CLs. The results of the chi-square test are presented in Figure 5. The specific outcomes are summarized as follows:
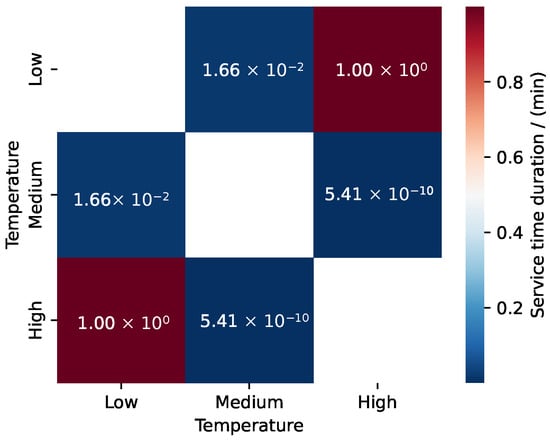
Figure 5.
Chi-square test results: Heatmap of p-values for comparing PWT service durations between different temperature categories (high, medium, and low temperatures). The focus is on the pairwise comparisons among these temperature categories.
- The chi-square statistic comparing service durations between low- and medium-temperature conditions is 841.19, with 756 degrees of freedom and a p-value of , indicating a statistically significant difference at the 95% CL, but no significance at the 99% CL.
- The chi-square statistic comparing low- and high-temperature conditions is 646.95, with 784 degrees of freedom and a p-value of 0.99, suggesting no statistically significant differences at either the 95% or 99% CLs.
- The chi-square statistic for the comparison between medium- and high-temperature conditions is 1017.69, with 756 degrees of freedom and a p-value of , indicating a statistically significant difference at both the 95% and 99% CLs.
Notably, contrary to the common assumption that higher temperatures would lead to increased potable water demand, the analysis reveals that the service duration distributions under low and high temperatures are remarkably similar. This finding suggests that low and high temperatures can be combined into one category based on their similar effects on PWT service durations. This conclusion can facilitate simpler PWT scheduling and enhance operational efficiency. Therefore, significant differences in PWT service duration distributions are observed when comparing low with medium temperatures and medium with high temperatures, but no significant difference emerges when comparing low and high temperatures.
Several PDs were fitted for each temperature category to further investigate the influence of temperature variations on PWT service durations. Single-parameter, two-parameter, and multi-parameter PDs were applied to gain deeper insights into the distribution characteristics of PWT service durations under different temperature conditions. Figure 6 illustrates the fitting results of the single-parameter, two-parameter, and multi-parameter models under high, medium, and low temperatures. Figure 6a depicts the single-parameter PD fitting curves with corresponding error bars for the three temperature categories; Figure 6b presents the fitting results obtained from two-parameter models; and Figure 6c provides the fitting results for multi-parameter distributions. Based on the fitting curves and error bars depicted in Figure 6, the relationship between the fitted distributions and the original data distributions under different temperature conditions can be visually evaluated.
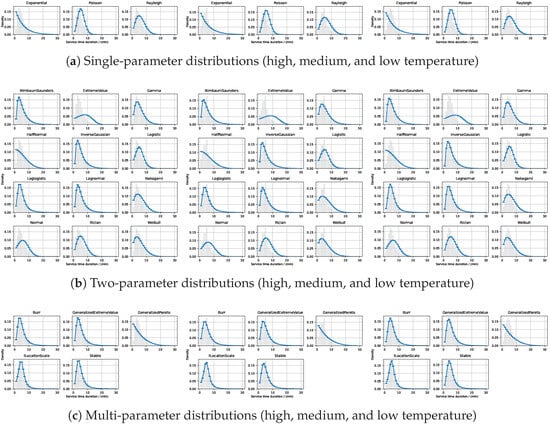
Figure 6.
PD fitting results for PWT service durations under different temperature conditions (high, medium, and low). The fitting results are presented for single-parameter, two-parameter, and multi-parameter models.
Considering the complete dataset, the optimal probability distributions for service durations under different temperature conditions, along with their estimated parameters (obtained via maximum likelihood estimation), are as follows:
- High temperature (generalized extreme value distribution): The generalized extreme value distribution effectively captures the service duration under high-temperature conditions. Its PDF is explicitly given bywhere k is the shape parameter, is the scale parameter, and is the location parameter. Specifically, the estimated parameters for the generalized extreme value distribution during high-temperature conditions wereConsidering the complete dataset, the generalized extreme value distribution with these parameters yielded a chi-square statistic of and a p-value of , indicating an excellent fit.
- Medium temperature (log-logistic distribution): The log-logistic distribution optimally fits the medium-temperature scenario, characterized by its PDF as follows:where is the scale parameter and is the shape parameter. The estimated parameters for medium-temperature conditions wereConsidering the complete dataset, despite its relatively better fit, the medium-temperature log-logistic distribution obtained a chi-square statistic of and a p-value of .
- Low temperature (Stable distribution): The stable distribution again proved optimal for modeling low-temperature conditions, characterized by parameters similar in form to Equations (6) and (7). Specifically, the estimated parameters wereConsidering the complete dataset, the stable distribution exhibited strong fitting performance for low-temperature conditions, yielding a chi-square statistic of and a p-value of 0.30, indicating an excellent statistical fit.
Furthermore, to verify robustness, 100 randomized experiments were conducted, each fitting 80% randomly sampled data from the original dataset. The chi-square test results presented in Figure 7 provide a quantitative analysis of the fitting accuracy, confirming the applicability and precision of these distribution models.
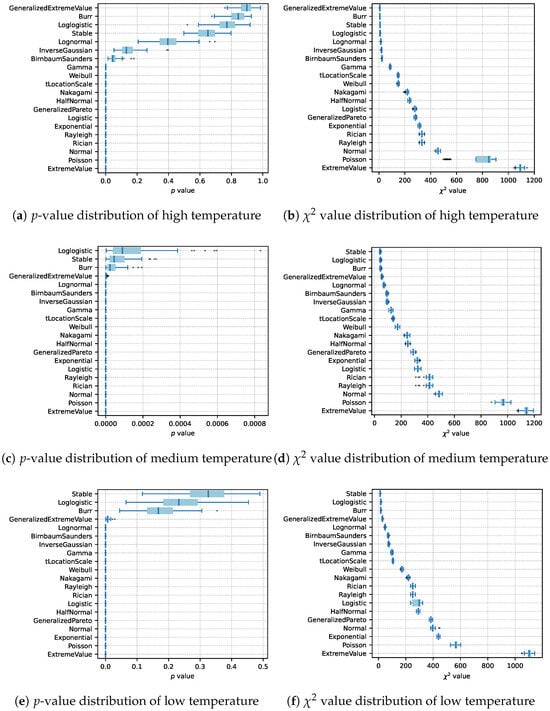
Figure 7.
Chi-square test results of PWT service durations are categorized by temperature, showing p-value and value distributions. Each distribution is based on 100 random samples, where 80% of the original data were used for fitting in each sample.
In Figure 7, based on the results from the PD fitting under different temperature conditions, the following detailed conclusions can be made.
In the high-temperature category, the PD fitting of PWT service durations demonstrates strong fitting performance. The generalized extreme value distribution achieves the best fit, with a p-value of 0.89 and a chi-square statistic of 7.07 (averaged over 100 random samples in Figure 7), indicating no statistically significant difference from the observed data. Additionally, the Burr, stable, and log-logistic distributions also exhibit robust fits. Thus, the distribution of service durations under high temperatures is relatively stable.
The medium-temperature scenario is comparatively more complex. Although stable, log-logistic, and Burr distributions are ranked highest, none adequately fit the data. The observed data reveal a pronounced peak around a service duration of 5 min, followed by a sharp decline at 6 min, suggesting the influence of specific operational factors. One hypothesis is that at moderate temperatures, ground handling operations occur under standard conditions without weather-induced stress or special procedures, leading to greater variability arising from human factors or inconsistent operational pacing. Equipment may also operate at peak efficiency in mild weather, minimizing mechanical delays and making procedural or behavioral variations more pronounced. As a result, temperature alone may not adequately characterize the distribution of service times for the medium temperature range. In practical terms, this finding cautions that resource planning based solely on temperature categories can be unreliable for moderate conditions; airport managers might need to incorporate additional operational parameters or adopt adaptive strategies when scheduling PWT services on mild days. Recognizing this limitation, we have identified investigation into the root causes of the medium-temperature anomaly as an important direction for future research.
In the low-temperature category, the PD fitting also performs robustly, with the stable distribution demonstrating particularly strong fit, indicating consistent distribution patterns.
In summary, the distribution of PWT service durations varies significantly across temperature categories, with more regular patterns at high and low temperatures, and greater variability under medium conditions. These findings suggest that temperature exerts a substantial influence on service durations, and further research into medium-temperature anomalies could optimize operational processes and enhance efficiency.
4.3. Classification Based on Aircraft Categories
According to expert experience, when PWTs service large aircraft (such as Category E), service durations are typically longer due to greater potable water requirements. Conversely, medium aircraft (such as Category C) typically require shorter service durations due to lower water requirements. Based on this expert insight, service durations in this study were categorized into two groups: medium and large aircraft; however, further statistical validation is necessary to confirm this categorization.
To quantitatively evaluate the impact of aircraft type on PWT service durations, a chi-square test was conducted to determine whether service durations for medium and large aircraft significantly differ at the 99% CL. The chi-square test results indicate that the chi-square statistic comparing service durations for medium and large aircraft is 735.35, with 700 degrees of freedom and a p-value of 0.17. This result indicates that the service duration distributions for medium and large aircraft do not exhibit statistically significant differences at the 99% and 95% CLs. Thus, despite the intuitive expectation that large aircraft should require longer service durations due to higher water requirements, the chi-square test results demonstrate no statistically significant differences between medium and large aircraft.
Various PDs were applied to the service duration data based on aircraft categories (medium and large) to further investigate the impact of aircraft type on PWT service durations. Single-parameter, two-parameter, and multi-parameter PDs were fitted to gain a deeper understanding of the distribution characteristics of PWT service durations under different conditions. Figure 8 illustrates the fitting results obtained for medium and large aircraft. Figure 8a depicts the fitting curves with associated error bars for single-parameter distributions; Figure 8b displays the fitting results for two-parameter distributions; and Figure 8c shows the fitting results for multi-parameter distributions.
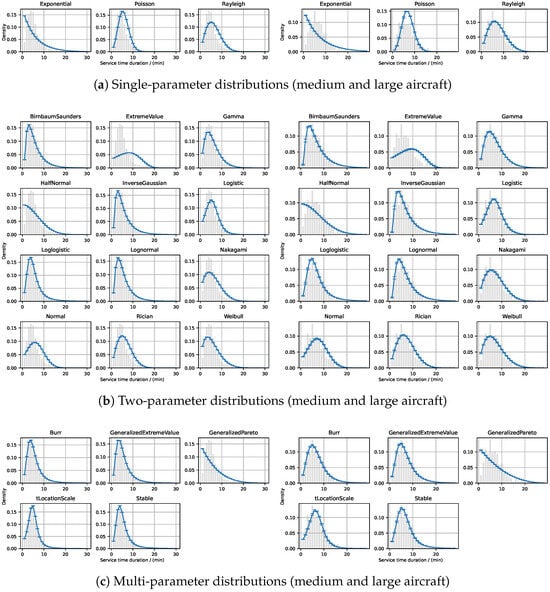
Figure 8.
PD fitting results for PWT service durations categorized by aircraft categories (medium and large aircraft). The fitting results are presented for single-parameter, two-parameter, and multi-parameter models.
The relationship between the fitted PDs and the original data distributions can be qualitatively evaluated using the fitting curves and error bars presented in Figure 8.
Considering the complete dataset, for aircraft size categories, the optimal probability distributions and their estimated parameters (obtained via maximum likelihood estimation) are as follows:
- Medium aircraft (log-logistic distribution): The log-logistic distribution optimally models the service durations for medium-sized aircraft, characterized by parameters similar in form to Equation (13):Considering the complete dataset, this log-logistic distribution demonstrated robust fitting, yielding a chi-square statistic of and a p-value of .
- Large aircraft (Burr distribution): The Burr distribution (Type XII) provides the optimal fit for large aircraft service durations, characterized by a PDF similar to Equation (9). Specifically, the estimated parameters for large aircraft wereConsidering the complete dataset, the Burr distribution provided a chi-square statistic of and a p-value of , indicating strong fitting performance.
Additionally, to ensure robustness, 100 randomized experiments were conducted by fitting probability distributions to 80% randomly sampled data from the original dataset. The quantitative chi-square test results are illustrated in Figure 9.
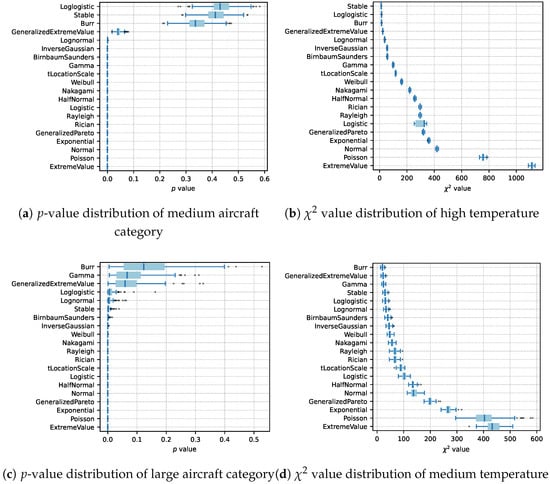
Figure 9.
Chi-square test results of PWT service durations are categorized by aircraft categories, showing p-value and value distributions. Each distribution is based on 100 random samples, where 80% of the original data were used for fitting in each sample.
The PD fitting for medium aircraft service durations, with p-values and chi-square statistics averaged over 100 random samples as depicted in Figure 9, indicates that the stable and log-logistic distributions provide optimal fits. Specifically, the stable distribution has a p-value of 0.41 and a chi-square statistic of 11.37, while the log-logistic distribution has a p-value of 0.43 and a chi-square statistic of 14.25. These two distributions rank first and second, respectively, exhibiting no statistically significant difference from the observed data at the 95% and 99% CLs. The Burr distribution ranks third, achieving a p-value of 0.34 and a chi-square statistic of 14.49. These three distributions exhibit robust fitting performances, showing no statistically significant difference from the observed data. The generalized extreme value distribution demonstrates moderate fitting performance, with a p-value of 0.04 and a chi-square statistic of 23.11, passing the test at the 99% CL but failing at the 95% CL, indicating a comparatively suboptimal fit. The fitting performance of the remaining distributions declines progressively, indicating poor overall fit quality.
For large aircraft service durations, the Burr distribution exhibits optimal fitting performance, with a p-value of 0.14 and a chi-square statistic of 20.65, thus ranking first. The gamma and generalized extreme value distributions also demonstrate strong fits, with p-values of 0.09 and 0.07, respectively, showing no statistically significant differences from the observed data at the 95% and 99% CLs. The log-logistic distribution exhibits moderate fitting performance, with a p-value of and a chi-square statistic of 31.38, passing the test at the 99% CL but failing at the 95% level, indicating a relatively suboptimal fit. The fitting performance of the remaining distributions progressively declines, indicating poor fitting quality.
In summary, the Burr distribution stands out as exhibiting optimal fitting performance for large aircraft service duration data. In contrast, the stable and log-logistic distributions excel in describing medium aircraft service duration data. The generalized extreme value distribution shows moderate fitting capability in both categories but is inferior compared to the top-performing distributions. Apart from the top-ranking distributions, other evaluated distributions consistently exhibit poor fitting performance across both aircraft categories.
4.4. Comparison of Optimal Distributions for ZBAD and ZSPD
This section provides a comparative analysis of the optimal probability distributions describing PWT service durations at ZBAD and ZSPD across different operational conditions. Specifically, the top-performing distributions are compared for each classification factor, including peak and non-peak departure periods, temperature variations, and different aircraft categories. The optimal distributions are selected based on the outcomes of chi-square goodness-of-fit tests (specifically, the p-values), which evaluate the adequacy of fit between each distribution and the observed service duration data. Table 4 summarizes the three optimal distributions for each operational condition across both airports. These distributions were selected according to their statistical performance, as indicated by their p-values. A p-value greater than 0.05 typically indicates a good fit, suggesting that the distribution adequately captures the service duration data for the respective category.
Table 4.
Top 3 optimal distributions for PWT service durations at ZBAD and ZSPD.
From the table above, we can observe the following trends:
- Peak departure periods: Both airports demonstrate that the stable distribution provides the most suitable fit for service durations during peak periods, with comparable p-values of 0.51 for ZBAD and 0.53 for ZSPD. The Burr distribution also exhibits strong fitting performance, ranking second at both airports, closely followed by the log-logistic distribution.
- Non-peak departure periods: During non-peak periods, the Burr distribution demonstrates optimal fitting performance at both airports, followed by the stable and log-logistic distributions. This suggests that the Burr distribution effectively captures the higher variability in service durations during non-peak periods, characterized by less consistent service demand.
- Temperature conditions: Under both high and low temperature conditions, the stable distribution consistently demonstrates superior fitting performance across both airports. This indicates the robustness of the stable distribution in capturing service duration patterns across diverse temperature conditions at both airports. The Burr and log-logistic distributions also show robust fitting performance, regularly appearing among the top three optimal distributions at both airports.
- Aircraft categories: When considering aircraft categories, the Burr distribution provides the optimal fit for large aircraft at both airports, while the stable and log-logistic distributions are more suitable for service durations of medium aircraft, exhibiting consistent results at both airports.
In summary, the optimal distributions for PWT service durations at ZBAD and ZSPD consistently align across different operational scenarios. This highlights the robustness and generalizability of the proposed methodology, indicating its applicability to other airports operating under comparable conditions. These findings offer valuable insights into optimizing PWT scheduling and resource allocation strategies, thus supporting their broader applicability to similar airport environments.
4.5. Rationale for Selected Distributions
This section discusses the underlying rationale for selecting specific probability distributions by examining the characteristics and influencing factors of PWT service durations, followed by an in-depth analysis of why particular distributions are suitable for different operational scenarios.
4.5.1. Characteristics and Influencing Factors of PWT Service
PWT service constitutes an integral component of the aircraft ground handling process, typically involving driving the PWT to the aircraft, connecting hoses for potable water supply, and subsequently disconnecting and removing the equipment upon completion. The duration required for this process is influenced by multiple operational factors. For instance, aircraft type and potable water demand directly influence service duration; long-haul wide-body aircraft typically require larger volumes of water, thus extending service times. Moreover, personnel allocation and coordination also significantly impact service efficiency, with increased workforce and equipment availability generally enhancing operational efficiency [48]. The distinction between peak and non-peak periods primarily arises from differences in resource allocation and concurrent operational demand. During peak hours, flights are densely scheduled with minimal intervals, resulting in tight ground handling schedules, and, frequently, the flight gap is counted in seconds, leaving almost no buffer time to accommodate unplanned delays [49]. Consequently, once a particular flight’s service experiences delay during a peak period, it may trigger subsequent delays, thereby adversely affecting resource availability for following operations [50]. In contrast, during non-peak periods, although fewer flights are scheduled, staff and equipment allocations may also be reduced or managed more flexibly, potentially causing delays whereby some flights begin service later or even “miss the scheduled handling window” [51,52]. Additionally, extreme weather conditions, such as excessively high or low temperatures, significantly influence PWT service efficiency. Empirical data [48] indicate that service duration exhibits greater variability under adverse weather conditions, as safety protocols may necessitate pauses or additional inspections, leading to significantly prolonged service durations for a subset of flights. Overall, the distribution of PWT service durations demonstrates right-skewed and heavy-tailed characteristics. Although most service durations fall within the typical range, congestion during peak hours, inappropriate resource allocation, or extreme weather conditions occasionally result in considerably prolonged durations compared to the mean value.
4.5.2. Applicability of PDs in Different Operational Conditions
Statistical analysis of PWT service duration data reveals variations in tail characteristics across different operational conditions, thus necessitating the application of appropriate heavy-tailed distributions for accurate fitting.
In high- and low-temperature environments, the distributions of service durations exhibit significant dispersion and pronounced heavy tails, indicating that most observations concentrate in one region while occasionally producing exceptionally large values. The stable distribution [38,39], commonly referred to as the -stable distribution, is a class of heavy-tailed distributions characterized by sharp peakedness and pronounced heavy tails. When the stability parameter , the theoretical variance diverges and becomes infinite [53]. This property implies that the stable distribution is capable of effectively capturing extremely prolonged service durations observed under extreme conditions. For example, in extremely cold environments, equipment failures or additional safety inspections can significantly extend the duration of potable water service; in such scenarios, the heavy tail of the stable distribution appropriately assigns higher-probability weights to these rare but significant delays. Moreover, according to the generalized central limit theorem, the sum of multiple independent heavy-tailed random delays tends to converge towards a stable distribution. The PWT service process is influenced by numerous stochastic factors (e.g., valve malfunctions, human errors, communication delays), whose combined fluctuations are exacerbated under extreme weather conditions, thereby thickening the tail of the distribution and causing it to approximate a stable form. In summary, the statistical properties of the stable distribution (notably its high kurtosis and infinite variance) align closely with the occurrence of outliers and heightened uncertainty observed in the service duration data under extreme temperature conditions. This alignment makes the stable distribution particularly suitable for fitting data under extreme temperature scenarios, effectively characterizing the phenomenon commonly described as “the longer you wait, the more you might have to wait” [54].
During non-peak periods, PWT service durations also exhibit heavy-tailed characteristics, although the specific shape of the distribution may differ significantly from that observed under extreme weather conditions. During non-peak hours, flights are less frequent, and some services may commence later or proceed at a more leisurely pace, resulting in a distribution characterized by a prolonged tail with distinct inflection points. For example, while the majority of flights complete potable water services within a typical duration, a minority may experience substantial delays due to relaxed scheduling practices, such as staff attending to alternative duties. The Burr distribution [34], often referred to as Burr Type XII, is a highly flexible heavy-tailed distribution that includes two adjustable shape parameters, allowing for precise modulation of tail thickness and overall distribution shape according to empirical data. Notably, it encompasses the log-logistic, Pareto, and other distributions as special cases, enabling the modeling of a wide range of tail behaviors, from moderately heavy to extremely heavy-tailed scenarios [55]. Previous studies [56] have demonstrated that the Burr distribution is particularly effective in describing phenomena such as travel time reliability, which are characterized by routine fluctuations. For non-peak PWT service, the Burr distribution effectively characterizes the scenario of “numerous observations concentrated within a typical range combined with a small number of extremely prolonged durations”; the initial section of the distribution declines steeply, corresponding to most flights being serviced quickly, while the tail decreases gradually, representing the minority of flights experiencing notably delayed service durations. This statistical property closely aligns with observations from non-peak periods, during which ground staff and equipment allocations occasionally lack urgency or timely scheduling, thus causing certain service durations to significantly exceed the average. The flexibility of the Burr distribution’s shape parameters facilitates its accurate fitting of this “concentrated main body with a heavy tail” pattern, making it particularly suitable for modeling service durations during non-peak periods.
The log-logistic distribution demonstrated consistently satisfactory fitting performance across several classification conditions, indicating that the general characteristics of PWT service durations are consistent with its underlying assumptions. The log-logistic distribution is based on the assumption that the logarithm of the variable follows a logistic distribution; it is commonly utilized in lifetime and survival analysis, particularly suited for describing scenarios in which event occurrence rates initially increase and subsequently decrease [28]. Compared to the lognormal distribution [29], the log-logistic distribution exhibits an even heavier tail. In the context of aircraft ground handling time, this implies that it can effectively capture normal variability as well as a considerable proportion of extreme delays. In practical applications, the log-logistic distribution, owing to its mathematical simplicity and pronounced heavy-tailed property, has been extensively applied in diverse fields such as hydrology (e.g., flood levels), economics (wealth distributions), and network transmission times, where a small proportion of extreme values substantially influences the overall distribution [28]. Under various classification conditions, PWT service data frequently exhibit right-skewness, characterized by tails decaying more gradually than those of exponential distributions, thus indicating heavy-tailed behavior. The log-logistic distribution possesses precisely this heavy-tailed characteristic and requires only two parameters to define its shape, thereby enabling stable and robust fits across various scenarios, including peak periods and moderate temperature conditions. Beyond academia, parallel findings exist in transportation practice; for example, studies that modeled bus travel times during peak hours demonstrated that the log-logistic distribution adequately represents travel time distributions [57]. This observation further underscores the broad applicability and robustness of the log-logistic distribution. For PWT service, the majority of scenarios display common characteristics such as unimodality, right-skewness, and a certain degree of heavy-tailed behavior; the log-logistic distribution, due to its limited number of parameters, effectively captures these fundamental attributes, thereby positioning itself as a universally applicable distribution across multiple operational conditions.
4.5.3. Empirical Evidence and Practical Validation
From the perspectives of both aviation operations management and statistical analysis, the selection of these specific probability distributions is clearly justified. Firstly, existing research in airport ground handling [48,49] demonstrates that aircraft turnaround time is influenced by multiple factors, including aircraft type, personnel and equipment availability, and weather conditions. For example, a case study conducted at Kosice Airport [48] measured the ground handling times of numerous flights, revealing that aircraft size, baggage quantity, cabin cleanliness, and weather significantly influence the duration of each ground service element and consequently the overall turnaround time. Among these factors, weather is particularly notable; adverse operating conditions such as extreme heat or cold reduce staff efficiency and necessitate increased safety protocols. Empirical data [48] indicate that ground services are significantly more susceptible to severe delays under these conditions. This observation aligns closely with our analytical findings, which demonstrate that service duration data under high- and low-temperature conditions require the stable distribution to accurately fit their heavy-tailed characteristics. Furthermore, statistics on flight delays corroborate the widespread occurrence of heavy-tailed phenomena under extreme weather conditions; in the context of the U.S. air traffic control system, “weather is the greatest cause of flight delays”, responsible for over 60% of delays exceeding 15 min [58]. This finding underscores the significant impact of adverse weather on generating abnormally prolonged service durations, thus aligning with the heavily-tailed nature of PWT service time distributions observed under high- or low-temperature scenarios.
Furthermore, empirical observations from actual airport operations offer supplementary evidence concerning the differences in PWT service durations during peak and non-peak hours. At large airports with highly congested flight schedules, peak hours often feature tight schedules that offer minimal buffer time; consequently, once ground handling for one aircraft experiences delays, the flight may miss its allocated slot, resulting in cascading delays to subsequent flights [50]. This cascading effect aligns with the extreme-tail phenomena characterized by heavy-tailed distributions, wherein a single service delay may generate multiple subsequent flight delays, causing waiting times to grow in a power-law manner. In contrast, during non-peak hours, when an aircraft arrives late or its service is delayed, ground handling departments may reduce their operational urgency, considering that the flight has already exceeded its scheduled window; thus, the service might be rescheduled to a later time and carried out at a slower pace [50]. Greater flexibility in service agreements during non-peak periods, along with potential reductions in nighttime staffing levels, can contribute significantly to instances of exceptionally prolonged service durations. Consequently, the heavy-tailed characteristic of the Burr distribution is necessary to accurately represent service duration data during non-peak periods. Similar phenomena can be observed in other transportation sectors; for instance, buses during non-peak hours often exhibit higher variability in waiting times, and empirical analyses frequently reveal heavy tails, thus requiring log-logistic or Burr distributions for accurate modeling [56,57].
Finally, from the broader perspective of statistical theory, the selection of these specific probability distributions is further validated. The utilization of heavy-tailed distributions has gained widespread recognition in recent decades, primarily due to the frequent occurrence of real-world phenomena—such as communication network traffic, financial returns, and meteorological disasters—which typically exhibit “high-frequency normal values coupled with low-frequency extreme values”, resulting in long-tailed characteristics [59]. The stable family (excluding its special case, the normal distribution) represents a classical group of heavy-tailed distributions, widely utilized for modeling data that exhibit potentially infinite variance [55]. Notably, renowned statistician John Nolan and others have extensively discussed the significance of stable distributions for modeling heavy-tailed phenomena [60]. Likewise, the Burr [34] and log-logistic [28] distributions are widely recognized as common heavy-tailed distributions in the literature. Their tail probabilities decay considerably more slowly than those of exponential distributions, implying that even after prolonged waiting periods, there remains a non-negligible probability of encountering further delays [54]. This aligns closely with the occurrence of sporadic extreme delays observed in aircraft ground handling operations. Other airports with operational characteristics resembling those examined in this study (e.g., highly congested or harsh-climate airports) are likely to exhibit similar heavy-tailed behavioral patterns in ground handling times, thereby necessitating comparable statistical models for accurate characterization. For instance, Newark Airport in New York frequently experiences cumulative delays under adverse weather conditions [58], illustrating that when high operational demands coincide with unfavorable conditions, the tail of the service time distribution tends to become significantly heavier, consistent with the empirical trends identified in the current study. In summary, from both airport management and statistical analysis perspectives, the application of stable, Burr, and log-logistic distributions to model PWT service durations across the various scenarios explored is well-founded. The heavy-tailed nature of these distributions aligns closely with the empirical characteristics observed in PWT operational data; this alignment is further supported by the existing literature and empirical case studies, reinforcing the validity and reliability of our conclusions.
4.6. Numerical Simulation of PWT Requirements
Comparison with prior studies further positions our findings within the broader research context. Consistent with earlier research, our study reinforces that accurate modeling of service durations requires consideration of variability and uncertainty. For instance, Kwasiborska [5] emphasized the significance of realistic service time distributions, Lao [8] demonstrated that variability in ground handling impacts turnaround performance, and Sheibani [6] highlighted the importance of stochastic scheduling to address operational uncertainty. Extending beyond these studies, our analysis specifically identifies optimal heavy-tailed distributions tailored to different operational scenarios, a detail that previous research had not explicitly established.
To validate the effectiveness of the proposed probability distributions—namely, the stable distribution for peak periods and the Burr distribution for non-peak periods—identified in the present study, we conducted comprehensive numerical simulations of potable water truck (PWT) requirements at ZBAD and ZSPD. Service durations were randomly generated from the fitted distributions, corresponding to the respective operational contexts (peak and non-peak periods), thereby accurately capturing real-world variability and concurrent truck utilization.
The simulation results demonstrated a close alignment with the actual operational requirements for trucks at both airports. At ZBAD, the proposed probability distribution models accurately estimated the requirement of 12 PWTs, precisely matching the actual observed demand. In contrast, traditional estimation methods substantially underestimated resource requirements: utilizing a fixed average service duration led to a prediction of only 9 trucks, resulting in a deviation of approximately 25%; meanwhile, an assumption based on a normal distribution predicted 10 trucks, thus underestimating the actual requirement by about 17%. Similarly, at ZSPD, simulations employing the stable and Burr distribution models provided accurate estimations, precisely reflecting the actual requirement of 15 PWTs. Alternative conventional methods exhibited notable inaccuracies: the fixed average method forecasted only 12 trucks, representing a shortfall of 20%, while the normal distribution-based method forecasted 13 trucks, leading to a 13% underestimation. Table 5 summarizes these comparisons, highlighting the notably superior predictive accuracy of the proposed probabilistic models in comparison to conventional estimation approaches.
Table 5.
Comparison of various estimation methods for predicted PWT usage and their deviation from actual values at airports ZBAD and ZSPD.
This comparative analysis demonstrates that traditional assumptions, such as the fixed-average and normal distribution methods, fail to sufficiently account for actual operational variability, particularly the heavy-tailed and skewed characteristics intrinsic to service durations. These conventional methods consistently resulted in underestimations of resource requirements, thus increasing the risk of operational delays during peak periods. In contrast, the proposed stable and Burr distributions effectively captured realistic operational variability, accurately representing extreme scenarios in service durations. Consequently, these distributions facilitate robust and precise guidance for resource allocation, significantly improving operational reliability and efficiency. This validation underscores the importance of adopting statistically rigorous heavy-tailed distributions to inform and enhance strategic decision-making in resource planning at major airports.
5. Conclusions
This study provided a comprehensive statistical analysis of PWT service durations at ZBAD and ZSPD. By rigorously evaluating 20 probability distributions under context-dependent operational scenarios—including peak and non-peak periods, temperature variations, and aircraft sizes—this research delivered valuable insights into accurately modeling service durations for effective resource allocation.
The stable distribution significantly outperformed alternatives in modeling service durations during peak operational periods, effectively capturing the heavy-tailed behaviors caused by stringent operational schedules. Conversely, the Burr distribution excelled under non-peak scenarios, accurately reflecting the higher variability due to flexible scheduling practices. Temperature-based segmentation revealed statistically similar service duration distributions under extremely high and low temperatures, challenging conventional temperature-based resource allocation assumptions. Several factors could explain this result. First, the sample sizes for both extreme-high- and extreme-low-temperature scenarios are relatively small, which limits the power of statistical tests to detect differences. Second, there may be confounding operational practices. For instance, during both very hot and very cold weather, ground crews and equipment are often adjusted (e.g., additional staff deployment or specialized procedures) to mitigate weather-related delays, leading to comparable service times under both extremes. Third, the temperature classification itself might have influenced the outcome: if our threshold for “extreme” temperatures grouped a broad range of conditions together, or if temperature readings were not precise, then genuine differences could have been masked. We highlight these possibilities to urge cautious interpretation of this counterintuitive finding, and we encourage further research to investigate service performance under extreme weather conditions. Furthermore, aircraft size analysis identified the Burr distribution as the optimal model for large aircraft, whereas stable and log-logistic distributions were optimal for medium-sized aircraft.
Numerical simulations validated these results, demonstrating the superior accuracy of the proposed models compared to traditional methods in predicting the number of required PWTs, reducing estimation errors by 13% to 25%.
The applicability of the proposed models is grounded in extensive empirical data from ZBAD and ZSPD, ensuring their robustness for large airports with similar traffic volumes and operational contexts. However, caution should be exercised when generalizing these findings to smaller airports or those with significantly different operational rules. Additional verification would be necessary to confirm the suitability of these heavy-tailed distributions in diverse contexts. Moreover, the parameter estimation of the stable distribution depends critically on the availability of extensive data; thus, practical deployment necessitates establishing robust data collection mechanisms.
Additionally, the methodology proposed in this research holds significant potential for broader applications beyond PWTs. Due to their similar operational characteristics and variability patterns, other types of airport ground support equipment—such as sewage trucks, garbage trucks, and shuttle buses—could benefit from the proposed heavy-tailed distribution modeling approach. Future studies might also extend this method to various ground handling processes (e.g., fueling, baggage handling, or catering) to assess potential efficiency improvements. Furthermore, integrating our context-sensitive probabilistic models into real-time scheduling and resource allocation systems represents a promising direction; for instance, developing an intelligent decision-support tool that dynamically selects optimal probability distributions based on changing operational conditions could significantly enhance responsiveness and accuracy. Gathering more extensive and diverse datasets from additional airports and spanning longer periods would also be valuable for validating and refining model parameters, thus improving the generalizability of our findings. Finally, exploring hybrid modeling approaches that combine statistical techniques with machine learning methods could further enhance predictive accuracy. By pursuing these research directions, researchers and practitioners can build on our methodology, improving airport ground handling efficiency, operational reliability, and adaptability across diverse contexts.
Author Contributions
Conceptualization, C.L.; data curation, Y.H.; formal analysis, C.L.; funding acquisition, M.H.; methodology, C.L.; project administration, M.H. and Z.Z.; software, C.L. and Y.H.; supervision, M.H., Z.Z. and Y.W.; validation, C.L.; visualization, Y.H.; writing—original draft, Y.H.; writing— review and editing, M.H., Z.Z. and Y.W. All authors have read and agreed to the published version of the manuscript.
Funding
This research was funded by the National Key R&D Program of China (No.2022YFB2602401); the National Key R&D Program of China (No.2021YFB1600500); the Civil Aviation Safety Capacity Building Project of the Civil Aviation Administration of China (IMH24006); the Natural Science Foundation of Jiangsu Province (BK20231447); and the Interdisciplinary Innovation Fund for Doctoral Students of Nanjing University of Aeronautics and Astronautics (KXKCXJJ202404).
Data Availability Statement
The raw data supporting the conclusions of this article will be made available by the authors on request.
Conflicts of Interest
The authors declare no conflicts of interest.
Abbreviations
The following abbreviations are used in this manuscript:
| A-CDM | Airport-Collaborative Decision Making |
| CAAC | Civil Aviation Administration of China |
| CL | Confidence Level |
| IBT | In-Block Time |
| ICAO | International Civil Aviation Organization |
| NOAA | National Oceanic and Atmospheric Administration’s Climate |
| OBT | Off-Block Time |
| PD | Probability Distribution |
| Probability Density Function | |
| PWT | Potable Water Truck |
| ZBAD | Beijing Daxing International Airport |
| ZSPD | Shanghai Pudong International Airport |
References
- Ip, W.H.; Wang, D.; Cho, V. Aircraft Ground Service Scheduling Problems and Their Genetic Algorithm With Hybrid Assignment and Sequence Encoding Scheme. IEEE Syst. J. 2013, 7, 649–657. [Google Scholar] [CrossRef]
- Zhang, K.; Fei, C.; Xie, B.; Wang, Y.; Gong, Z.; Xie, C.; Nguyen, T.M.T.; Yao, Y.; Miao, K. Multi-Constraint Optimized Planning of Tasks on Virtualized-Service Pool for Mission-Oriented Swarm Intelligent Systems. Appl. Sci. 2019, 9, 3010. [Google Scholar] [CrossRef]
- Wang, J. Research on Airport Special Vehicle Scheduling Problem Oriented to Service Strategy. Master’s Thesis, Civil Aviation University of China, Tianjin, China, 2018. [Google Scholar]
- Tang, F.; Zhang, R.; Liu, S. Airport Ground Service Oriented Multi-service Coordination Scheduling Algorithm. Control Eng. China 2020, 27, 1686–1692. [Google Scholar]
- Kwasiborska, A.; Postół, J. Modeling of Ground Handling Processes in Simio Software. In Advances in Air Traffic Engineering; Kwasiborska, A., Skorupski, J., Yatskiv, I., Eds.; Springer: Cham, Switzerland, 2021; pp. 57–75. [Google Scholar] [CrossRef]
- Sheibani, K. Scheduling aircraft ground handling operations under uncertainty using critical path analysis and Monte Carlo simulation: Survey and research directions. Int. J. Bus. Strategy Autom. (IJBSA) 2020, 1, 37–45. [Google Scholar] [CrossRef]
- Zhu, X.; Han, S. Centralized Scheduling of Service Vehicles for Aircraft Turnaround Based on Partheno-Genetic Algorithm. J. Southwest Jiaotong Univ. 2018, 53, 406–413. [Google Scholar]
- Lao, X.; Shen, Y.; Ran, X.; Zheng, Y.; Du, Y. An agent-based simulator for airport ground handling services. Procedia Comput. Sci. 2024, 238, 692–697. [Google Scholar] [CrossRef]
- Kierzkowski, A.; Kisiel, T. Simulation model of logistic support for functioning of ground handling agent, taking into account a random time of aircrafts arrival. In Proceedings of the International Conference on Military Technologies (ICMT) 2015, Brno, Czech Republic, 19–21 May 2015; pp. 1–6. [Google Scholar] [CrossRef]
- Kierzkowski, A.; Kisiel, T. A Simulation Model of Aircraft Ground Handling: Case Study of the Wroclaw Airport Terminal. In Proceedings of the Information Systems Architecture and Technology: Proceedings of 37th International Conference on Information Systems Architecture and Technology (ISAT 2016), Karpacz, Poland, 18–20 September 2016; Świątek, J., Wilimowska, Z., Borzemski, L., Grzech, A., Eds.; Springer: Cham, Switzerland, 2017; pp. 109–125. [Google Scholar] [CrossRef]
- Guimarans, D.; Padrón, S. A stochastic approach for planning airport ground support resources. Int. Trans. Oper. Res. 2022, 29, 3316–3345. [Google Scholar] [CrossRef]
- Chen, W. Analysis Method Research on the Data of Aircraft Ground Handling Services. Master’s Thesis, Civil Aviation University of China, Tianjin, China, 2017. [Google Scholar]
- Li, B.; Wang, L.; Xing, Z.; Luo, Q. Effective evaluation of ground support process for transit flight. Syst. Eng. Electron. 2020, 42, 1543–1549. [Google Scholar]
- Xing, Z.; Li, B.; Luo, Q. Operational effectiveness evaluation of ground service for transit flight. Syst. Eng. Electron. 2019, 41, 1071–1078. [Google Scholar]
- Xu, C.; Shao, Q. Optimization of Airport Ground Service Support Equipment Scheduling under Uncertain Operation Time. Sci. Technol. Eng. 2018, 18, 372–378. [Google Scholar]
- Zhu, X.; Xu, H.; Wang, S. Scheduling of Service Vehicles for Aircraft Turnaround Under Uncertain Task Duration. J. Nanjing Univ. Aeronaut. Astronaut. 2019, 51, 749–755. [Google Scholar] [CrossRef]
- Feng, X.; Zhang, X.; Chen, F. Boarding duration distribution of aircraft turnaround. J. Traffic Transp. Eng. 2017, 17, 98–105. [Google Scholar]
- Harjono, O.S.; Sembiring, J.; Pasaribu, H.M. Stochastic Modelling of Aircraft Ground Time at Soekarno-Hatta International Airport. War. Penelit. Perhub. 2023, 35, 291–303. [Google Scholar] [CrossRef]
- Lugo, M. The expectation of the maximum of exponentials. Stat 2011, 1–4. [Google Scholar]
- Koehrsen, W. The Poisson distribution and Poisson process explained. Towar Data Sci. 2019, 13, 1–13. [Google Scholar]
- Siddiqui, M.M. Statistical inference for Rayleigh distributions. J. Res. Natl. Bur. Stand. Sec. D 1964, 68, 1005–1010. [Google Scholar] [CrossRef]
- Rieck, J.R.; Nedelman, J.R. A Log-Linear Model for the Birnbaum—Saunders Distribution. Technometrics 1991, 33, 51–60. [Google Scholar] [CrossRef]
- Miniussi, A.; Marani, M. Estimation of Daily Rainfall Extremes Through the Metastatistical Extreme Value Distribution: Uncertainty Minimization and Implications for Trend Detection. Water Resour. Res. 2020, 56, e2019WR026535. [Google Scholar] [CrossRef]
- Algamal, Z.Y. Using maximum likelihood ratio test to discriminate between the inverse gaussian and gamma distributions. Int. J. Stat. Distrib. 2017, 1, 27–32. [Google Scholar]
- Kamalov, F.; Denisov, D. Gamma distribution-based sampling for imbalanced data. Knowl.-Based Syst. 2020, 207, 106368. [Google Scholar] [CrossRef]
- Mazucheli, J.; Dey, S. Bias-corrected maximum likelihood estimation of the parameters of the generalized half-normal distribution. J. Stat. Comput. Simul. 2018, 88, 1027–1038. [Google Scholar] [CrossRef]
- Menezes, A.F.B.; Mazucheli, J.; Dey, S. The unit-logistic distribution: Different methods of estimation. Pesqui. Oper. 2018, 38, 555–578. [Google Scholar] [CrossRef]
- He, X.; Chen, W.; Qian, W. Maximum likelihood estimators of the parameters of the log-logistic distribution. Stat. Pap. 2020, 61, 1875–1892. [Google Scholar] [CrossRef]
- Gualandi, S.; Toscani, G. Human behavior and lognormal distribution. A kinetic description. Math. Model. Methods Appl. Sci. 2019, 29, 717–753. [Google Scholar] [CrossRef]
- Reyes, J.; Rojas, M.A.; Venegas, O.; Gómez, H.W. Nakagami Distribution with Heavy Tails and Applications to Mining Engineering Data. J. Stat. Theory Pract. 2020, 14, 55. [Google Scholar] [CrossRef]
- Altman, D.G.; Bland, J.M. Statistics notes: The normal distribution. BMJ 1995, 310, 298. [Google Scholar] [CrossRef] [PubMed]
- Nicolas, J.M.; Tupin, F. A New Parameterization for the Rician Distribution. IEEE Geosci. Remote Sens. Lett. 2020, 17, 2011–2015. [Google Scholar] [CrossRef]
- Nassar, M.; Afify, A.Z.; Dey, S.; Kumar, D. A new extension of Weibull distribution: Properties and different methods of estimation. J. Comput. Appl. Math. 2018, 336, 439–457. [Google Scholar] [CrossRef]
- Taylor, M.A. Fosgerau’s travel time reliability ratio and the Burr distribution. Transp. Res. Part B: Methodol. 2017, 97, 50–63. [Google Scholar] [CrossRef]
- Esfeh, M.A.; Kattan, L.; Lam, W.H.; Esfe, R.A.; Salari, M. Compound generalized extreme value distribution for modeling the effects of monthly and seasonal variation on the extreme travel delays for vulnerability analysis of road network. Transp. Res. Part C Emerg. Technol. 2020, 120, 102808. [Google Scholar] [CrossRef]
- Kang, S.; Song, J. Parameter and quantile estimation for the generalized Pareto distribution in peaks over threshold framework. J. Korean Stat. Soc. 2017, 46, 487–501. [Google Scholar] [CrossRef]
- Mao, Y.; Gang, D. Wind power probability prediction based on t location-scale distribution. Electr. Power 2017, 50, 140–145. [Google Scholar]
- Kogon, S.M.; Williams, D.B. Characteristic function based estimation of stable distribution parameters. In A Practical Guide to Heavy Tails: Statistical Techniques and Applications; Birkhäuser Verlag: Basel, Switzerland, 1998; pp. 311–338. [Google Scholar]
- McCulloch, J.H. Simple consistent estimators of stable distribution parameters. Commun. Stat.-Simul. Comput. 1986, 15, 1109–1136. [Google Scholar] [CrossRef]
- Razali, N.M.; Wah, Y.B. Power comparisons of shapiro-wilk, kolmogorov-smirnov, lilliefors and anderson-darling tests. J. Stat. Model. Anal. 2011, 2, 21–33. [Google Scholar]
- McHugh, M.L. The Chi-square test of independence. Biochem. Medica 2013, 23, 143–149. [Google Scholar] [CrossRef] [PubMed]
- Berger, V.W.; Zhou, Y. Kolmogorov–Smirnov Test: Overview. In Wiley StatsRef: Statistics Reference Online; John Wiley & Sons, Ltd.: Hoboken, NJ, USA, 2014; Chapter 1; p. 1. [Google Scholar] [CrossRef]
- Scholz, F.W.; Stephens, M.A. K-Sample Anderson–Darling Tests. J. Am. Stat. Assoc. 1987, 82, 918–924. [Google Scholar] [CrossRef]
- Kim, T.K. T test as a parametric statistic. Korean J. Anesthesiol. 2015, 68, 540–546. [Google Scholar] [CrossRef] [PubMed]
- McKnight, P.E.; Najab, J. Mann-Whitney U Test. In The Corsini Encyclopedia of Psychology; John Wiley & Sons, Ltd.: Hoboken, NJ, USA, 2010; Chapter 1; p. 1. [Google Scholar] [CrossRef]
- ICAO. Regional Workshop on Traffic Forecasting and Economic Planning; ICAO: Montreal, QC, Canada, 2010. [Google Scholar]
- Richter-Menge, J.; Druckenmiller, M. State of the climate in 2019. Arctic 2020, 101, S239–S286. [Google Scholar]
- Szabo, S.; Pilát, M.; Makó, S.; Korba, P.; Čičváková, M.; Kmec, Ľ. Increasing the Efficiency of Aircraft Ground Handling—A Case Study. Aerospace 2022, 9, 2. [Google Scholar] [CrossRef]
- Sahadevan, D.; Al Ali, H.; Mukandavire, Z. Optimising Airport Ground Resource Allocation for Multiple Aircraft Using Machine Learning-based Arrival Time Prediction. Aerospace 2023, 10, 509. [Google Scholar] [CrossRef]
- Evler, J.; Asadi, E.; Preis, H.; Fricke, H. Airline ground operations: Schedule recovery optimization approach with constrained resources. Transp. Res. Part C-Emerg. Technol. 2021, 128, 103129. [Google Scholar] [CrossRef]
- Luethi, M.; Kisseleff, B.; Nash, A. Depeaking Strategies for Improving Airport Ground Operations Productivity at Midsize Hubs. Transp. Res. Rec. 2009, 2106, 57–65. [Google Scholar] [CrossRef]
- Jiang, H.; Zeng, W.; Wei, W.; Tan, X. A bilevel flight collaborative scheduling model with traffic scenario adaptation: An arrival prior perspective. Comput. Oper. Res. 2024, 161, 106431. [Google Scholar] [CrossRef]
- Bianchi, M.L.; Stoyanov, S.V.; Tassinari, G.L.; Fabozzi, F.J.; Focardi, S.M. Handbook of Heavy-Tailed Distributions in Asset Management and Risk Management; World Scientific: Singapore, 2019. [Google Scholar] [CrossRef]
- Bladt, M.; Yslas, J. Heavy-tailed phase-type distributions: A unified approach. Extremes 2022, 25, 529–565. [Google Scholar] [CrossRef] [PubMed]
- Klebanov, L.B. Heavy Tailed Distributions; Matfyzpress: Prague, Czech Republic, 2003; Volume 488. [Google Scholar]
- Taylor, M.A. Modelling travel time reliability with the Burr distribution. Procedia-Soc. Behav. Sci. 2012, 54, 75–83. [Google Scholar] [CrossRef]
- Büchel, B. Quantification and Prediction of Variability in Public Transport Operations. Ph.D. Thesis, ETH Zurich, Zürich, Switzerland, 2021. [Google Scholar]
- Maxson, R.W.; Truong, D.; Choi, W. Impact of Weather Factors on Airport Arrival Rates: Application of Machine Learning in Air Transportation. J. Aviat. Technol. Eng. 2024, 12, 5. [Google Scholar] [CrossRef]
- Rojo, J. Heavy-tailed densities. Wiley Interdiscip. Rev. Comput. Stat. 2013, 5, 30–40. [Google Scholar] [CrossRef]
- Vidyasagar, M. Modeling Extreme Events Using Heavy-Tailed Distributions. In Fusion Methodologies in Crisis Management: Higher Level Fusion and Decision Making; Springer: Berlin/Heidelberg, Germany, 2016; pp. 455–465. [Google Scholar]
Disclaimer/Publisher’s Note: The statements, opinions and data contained in all publications are solely those of the individual author(s) and contributor(s) and not of MDPI and/or the editor(s). MDPI and/or the editor(s) disclaim responsibility for any injury to people or property resulting from any ideas, methods, instructions or products referred to in the content. |
© 2025 by the authors. Licensee MDPI, Basel, Switzerland. This article is an open access article distributed under the terms and conditions of the Creative Commons Attribution (CC BY) license (https://creativecommons.org/licenses/by/4.0/).