Abstract
With the advancement in deep-space exploration, the injection technology using xenon as a working fluid in electric propulsion systems has emerged as a key area of interest. To delve into the gas-liquid dynamics of the liquid xenon injection process and the influence of gravity on this mechanism, this investigation employs a VOF two-phase flow model coupled with the Lee model to elucidate the characteristics of the two-phase flow during microgravity conditions. The findings uncover that in the absence of gravitational forces, gas-liquid stratification does not occur during the filling process. Consequently, this leads to an even distribution of gas and liquid within the tank, which in turn prolongs the filling duration in orbiting scenarios.
1. Introduction
With the continuous advancement of human space exploration and deep space investigation, low-temperature propellant filling technology is regarded as a crucial technique that can effectively extend the lifespan of electric propulsion spacecraft. The filling mechanism of xenon, a commonly used working fluid in electric propulsion systems, has garnered significant attention. In both gravitational and microgravity environments, the presence of bubbles in the filling pipeline and tank may lead to instability during the filling process, hindering accurate separation and positioning while also impacting precise propellant measurement. Failure to comprehensively analyze thermodynamic issues and boiling inhibition within the pipeline could result in unsuccessful fillings or major engineering errors. To ensure smooth liquid xenon filling operations, it is imperative to investigate pressure reduction and heating boiling characteristics of liquid xenon within pipelines under varying gravity conditions, as well as monitor pressure and temperature changes upon entry into filled tanks. Additionally, analyzing two-phase flow dynamics and heat transfer characteristics within pipelines and tanks will aid in identifying factors influencing tank filling rates within the system. These research findings will facilitate designing ground-based and orbital filling schemes that guarantee seamless processes while successfully accomplishing all required fillings.
With the continuous exploration of space and the development of deep space detection by humans, the common filling method for cryogenic fluids is no-vent filling. No-vent filling refers to the process of filling without discharging gas, which is suitable for on-orbit refueling of cryogenic propellants. Glenn Research Center of NASA began theoretical and experimental research on no-vent filling of cryogenic propellants. Chato [1] pointed out that the liquid injection temperature and the heat transfer coefficient at the gas-liquid interface seem to be one of the most critical influencing factors for no-vent filling, and reducing the initial wall temperature can suppress the sharp rise in pressure during the initial stage. During the filling process, the gas-liquid state is not always in thermodynamic equilibrium, and the heat transfer between the gas and the wall may be negligible. By dividing the tank into three parts: gas phase, liquid phase, and gas-liquid interface, the FILL model [2] uses the finite difference method to divide the tank and fluid into seven sections, including gas, liquid, gas-liquid interface layer, tank wall in contact with gas, tank wall in contact with liquid, and insulation layer of the tank wall, to apply to the calculation of no-vent filling processes under conventional gravity conditions. Fite [3] used lumped parameter methods to calculate the no-vent filling process of the tank, dividing the tank into four main parts: liquid, gas, cold wall, and hot wall. This calculation model is known as the NVF (No-Vent Fill) model, where physical quantities in each part are uniformly distributed, resulting in no pressure curve oscillation. The study found that when the filling rate exceeds 96%, the pressure rises sharply. In recent years, South Korea [4] has conducted experiments on no-vent filling of natural gas and CF4, and the experimental results indicate that the inlet temperature and initial wall temperature are critical factors influencing the thermodynamic characteristics of no-vent filling. In China, research activities on no-vent filling started relatively late. Wang Caili [5] studied the impact of filling structures on no-vent filling of cryogenic propellants. They found that reducing the inlet pressure extends the filling time and increases the filling rate. At the same time, when using an L-shaped filling method, the liquid sprays towards the wall. When the flow rate is small, some of the liquid flows down the wall, and some of it reflects back into the gas phase, forming droplets. Increasing the flow rate leads to more reflected liquid droplets. In a ground-based no-vent filling experiment with liquid nitrogen, Wang Caili [6] pointed out that the main indicators for evaluating no-vent filling performance are tank pressure, filling rate, and filling time. Good filling performance is characterized by low filling pressure, high filling efficiency, and short filling time. The study results showed that inlet temperature, initial tank temperature, inlet mass flow rate, filling port structure, and initial pressure of the tank being filled are key factors influencing no-vent filling, with inlet temperature considered the primary factor. Additionally, when using a top filling structure, the propellant in the tank is in thermodynamic equilibrium, whereas with a bottom filling structure, after the filling port is submerged, the temperature in the liquid phase remains consistent and is in a supercooled state, while the gas phase exhibits a thermal layer distribution and is in a superheated state. In 2015, Wang Lei [7] conducted a theoretical analysis of pressure, temperature, and other parameters during no-vent filling of liquid hydrogen under ground and microgravity conditions. He proposed that under microgravity conditions, the gas and liquid are in thermodynamic equilibrium and that reducing the inlet temperature, reducing the initial wall temperature, and thoroughly mixing the gas and liquid help reduce the maximum pressure in the tank being filled. Finally, in 2017, Ma Yuan [8,9] used Fluent to simulate and analyze the no-vent filling process of liquid nitrogen and liquid hydrogen under microgravity conditions. The two-phase flow models used included the VOF model and the Lee model. The study found that under microgravity conditions, the gas and liquid mix more uniformly, leading to a more stable pressure response and better filling performance. The filling structure has a weak influence on no-vent filling performance, and increasing the inlet subcooling can improve the reliability and efficiency of no-vent filling under microgravity conditions. In 2021, Tomasz [10] conducted experimental research on the mass flow rate of self-pressurizing propellants in rocket injectors, investigating the flow characteristics of propellants within these injectors. Their study provided critical insights for optimizing the design of rocket propulsion systems. The researchers employed innovative experimental methods to analyze variations in propellant mass flow rates under different operating conditions and identified key factors influencing mass flow. In 2022, Simone [11] proposed a void-fraction-based model for predicting the two-phase mass flow rate of nitrogen dioxide (NO2). This model aims to more accurately describe and predict the flow characteristics of NO2 by examining the void fraction in gas-liquid two-phase flows. The study combined experimental and theoretical analyses to develop the model, with detailed discussions on its formulation and validation methods. In 2024, Gong [12] utilized numerical simulations to investigate the dynamic behavior of gas-liquid two-phase flows in Tesla valves. Through computational analysis, they derived fundamental flow patterns and characteristics of the fluid. In 2024, Liang [13] focused on the behavior of bubble flow in inclined pipes and developed a predictive model for such flows. The study experimentally analyzed bubble dynamics under various conditions and used the collected data to construct a model for understanding and predicting bubble flow behavior in inclined pipelines. In 2024, Zhu [14] examined the influence of flow patterns on heat transfer models during flow boiling in rectangular microchannels. By analyzing flow boiling phenomena, the study established a flow-pattern-dependent heat transfer model, offering theoretical support for the design and optimization of microchannel thermal management systems.
In this study, Fluent 19.0 was used to conduct simulation analysis on the filling process of liquid xenon without exhaust, and the changes of pressure, temperature, and gas-liquid interface in the storage tank were mainly studied. The details of gas-liquid two-phase distribution and heat and mass transfer process in the storage tank during the filling process without exhaust were demonstrated. Firstly, the characteristics of liquid nitrogen filling on the ground without exhaust were verified by Fluent simulation. Then, the influence of the gravitational environment on the pressure, temperature, and gas-liquid interface distribution in the storage tank during the filling process of liquid xenon was compared and analyzed. Finally, the influence of inlet flow rate on the filling process of liquid xenon in the storage tank was analyzed.
2. Two-Phase Flow Model
Fluent software has built-in multiphase flow models such as Mixture and VOF, which can be used to deal with multiphase flow problems. In the calculation process, the tank is regarded as a rotationally symmetrical body, and a two-dimensional axisymmetric rotation model is used to simulate the flow field in the tank.
2.1. VOF Model
The VOF model is a model that can track the gas-liquid interface and is suitable for dealing with two or more incompatible phases. In this model, the control volume must be filled with a single phase or multiple phases, and it is not allowed to have areas without fluid filling.
For the phase, the volume fraction equation is
denotes density, denotes volume fraction, denotes velocity, denotes mass transfer from q phase to p phase, denotes mass transfer from p phase to q phase, and denotes the source phase. The volume fraction of the major phase should meet the following conditions:
The momentum equation is
which solves a single momentum equation by calculating the domain, the calculated velocity field will be shared by all phases. p denotes pressure, denotes viscosity, and denotes the gravitational body force. denotes external body forces, also contains other model-dependent source terms such as porous-media and user-defined sources. In addition, the energy equation is as follows:
E denotes energy, is effective thermal conductivity, T is temperature, h is specific enthalpy, is the diffusion flux of species j, is the effective stress tensor. contains contributions from radiation, as well as any other volumetric heat sources. The meanings of the terms in the equation are as follows: the first three items on the right represent heat conduction, component diffusion, and viscosity loss, respectively.
When there is a large difference in the velocity and temperature of the two phases near the interface, the calculation may diverge, which limits the accuracy of the calculation.
2.2. Lee Model
The phase transition model is the Lee model, the evaporation-condensation model built in Fluent software. In the Lee model, the gas phase transport equation is as follows:
if , then evaporation occurs, and the evaporation rate of the fluid is
if , condensation occurs, and the condensation rate of the vapor is
Among these parameters, represents the liquid phase temperature, represents the gas phase temperature, represents the saturation temperature, and coeff is a coefficient that needs to be carefully adjusted to adjust the rate of phase transition.
2.3. Standard k-ε Model
The turbulence model employed in this study is based on the Reynolds-Averaged Navier-Stokes (RANS) equations, specifically utilizing the standard k-ε model. As a semi-empirical formulation, the standard k-ε model operates under the assumption of fully turbulent flow while neglecting molecular viscosity effects. This approach offers balanced stability, computational efficiency, and reasonable accuracy, though it remains valid only for fully developed turbulent flows.
3. Example Verification
The experimental data verification is derived from Test 206 [6] in Wang Caili’s doctoral dissertation. The experiment used liquid nitrogen as the working medium. The geometric model of the tank in the experiment was used for the simulation calculation. The initial conditions of the simulation were the state of the tank before the experiment, and the filling conditions were used as the boundary conditions. The calculated results were compared with the experimental data. The tank has a capacity of 180 L and a wall thickness of 3 mm. The tank is designed with a cylindrical middle section and elliptical covers at the top and bottom ends. The diameter of the cylinder is 0.45 m, the height of the elliptical cover is 0.1125 m, and the height of the cylinder is 0.985 m. The geometry of the tank is shown in Table 1. The geometric structure is shown in Figure 1.

Table 1.
The geometry of the tank.

Figure 1.
Storage tank geometric structure diagram.
The grid division was performed using ICEM, and structured grids were used, with O-type grid division applied to the elliptical arc wall surface. Since the tank can be regarded as a rotationally symmetrical body, a two-dimensional axisymmetric method was adopted. The grid generation result is shown in Figure 2.
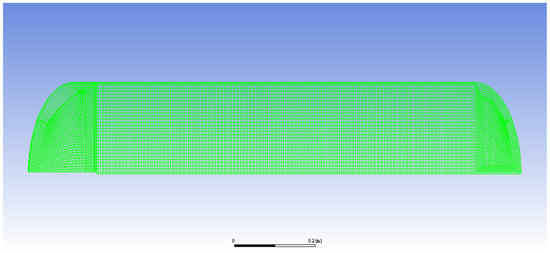
Figure 2.
Two-dimensional axisymmetric models and meshing.
The filling nozzle adopts a radial filling method at the bottom, with an initial wall temperature of 123 K, an inlet temperature of 79.13 K, and an average inlet mass flow rate of 0.508 kg/s. The maximum pressure that the tank can reach during filling is 6.2 bar, with a filling rate of 73.03% at this point, and the filling time required is 206 s. In an axisymmetric model rotationally symmetric geometry, the software by default calculates the total flow rate across the entire circumference (2π radians), not the local flow rate per 1-radian slice. The initial conditions and boundary conditions are shown in Table 2.
Table 2.
The initial conditions and boundary conditions of liquid nitrogen filling.
This study employed Fluent 19.0 to calculate the process of no-vented filling. A two-dimensional axisymmetric model was established, and the VOF model was used as the multiphase flow model. The Lee model was adopted as the phase change model with a coefficient set to 0.1, and the influence of surface tension was also considered. The turbulence model selected was the standard model, and the standard wall function method was used in the near-wall region. The experimental working fluid was liquid nitrogen, and the liquid phase was treated as an incompressible fluid with a constant density. The gas density was calculated using the ideal gas state equation. The pressure-velocity coupling employed the SIMPLE algorithm [15], and the pressure term was discretized using the PRESTO! format [16]. The volume fraction term was discretized using the Geo-Reconstruct format [17], while the density term, momentum term, turbulent kinetic energy term, turbulent dissipation term, and energy term were treated using the second-order upwind scheme. The models and numerical schemes are shown in Table 3.
Table 3.
Models and numerical schemes.
To ensure calculation accuracy and reduce computational cost, a grid independence verification was conducted, with four different grid quantities set: 5180, 8342, 10,923, and 13,705. The average pressure of the gas inside the tank was calculated, and the results for different grid quantities are shown in Figure 3. Finally, 10,923 grids were selected for the calculation.
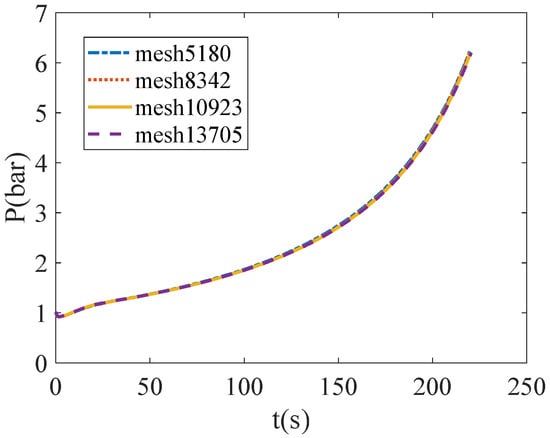
Figure 3.
The pressure curve changes with different mesh numbers.
The comparison between the calculated results and the experimental pressure curves is shown in Figure 4.
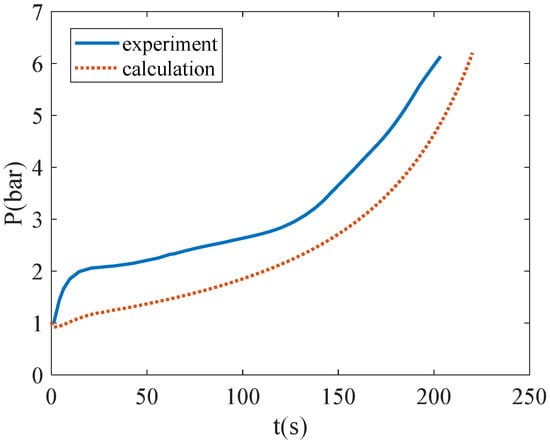
Figure 4.
Comparison of pressure curves between calculated and experimental values.
As can be seen from Figure 4, there is a certain gap between the simulation results and the experimental results, but the overall trend is similar, and the results are relatively close, which can reflect the general physical situation of the no-vented filling process.
Based on the simulation results of Fluent, a comparison of filling time and filling rate is shown in Table 4.
Table 4.
Error table of filling time and filling rate between calculated and experimental values.
According to the data in Table 4, we can see that there is approximately a 5% error between the calculated results and the experimental results. This error may be attributed to two reasons. Firstly, inconsistencies in the boundary conditions during the simulation process may lead to errors. Although the inlet flow rate data for the experiment is provided in the literature, the experiment actually adopts squeeze-type filling, and the flow rate provided in the literature is only an average value. As for the initial conditions, although the literature gives the initial temperature of the wall, the data in the literature is the average temperature, which does not reflect the specific thermal stratification inside the tank. Secondly, the phase change model used by Fluent for boiling and condensation calculations may not be well-suited for low-temperature liquid filling scenarios. As can be observed from Figure 4, there is a significant difference in the rate of pressure increase during the simulated vaporization phase, which may be due to inaccurate coefficient settings in Fluent for flash evaporation and wall heat release calculations. The setting of these coefficients depends on experimental data, but due to the lack of uniform and accurate settings, there may be differences between the simulation results and the experimental results. However, despite these differences, the error between the simulation results and the experimental results is not significant, and the trends are similar. Therefore, the simulation based on the two-phase flow model can still be used to calculate the filling time and filling rate for no-vented filling.
4. Simulation and Analysis of Liquid Xenon Non-Exhaust Filling Process
During ground filling, liquid xenon accumulates at the bottom of the tank; however, under orbital conditions, liquid xenon may not remain at the bottom of the tank. In a microgravity environment, the gas-liquid interface, phase change rate, and pressure distribution may change, thus necessitating a study on the effect of gravity on the process of filling liquid xenon into the tank. The inlet mass flow rate has a significant impact on the filling process, so it is necessary to explore this effect. Given the high cost of conducting orbital liquid xenon no-vented filling experiments, this article utilizes Fluent software to conduct simulation studies on the process of filling liquid xenon into the tank under microgravity conditions.
4.1. Simulation Setting of Liquid Xenon Without Exhaust Filling
The no-vented filling method for liquid xenon is similar to the filling process for liquid nitrogen. The geometric structure of the tank remains unchanged, with a capacity of 180 L, and a bottom radial filling method is adopted. The inlet temperature is set at 194 K, and the initial temperature of the tank wall is 210 K. The tank only contains the gas phase. During ground filling, the gravity level is set to standard gravity g; during on-orbit filling, the microgravity level is set to 10−6 g, and the pressure upper limit is chosen as the signal to stop filling. The VOF model is adopted as the two-phase flow model, and the Lee model is used as the phase change model. The saturation temperature is set as a function of pressure, using piecewise linear interpolation. The initial conditions and boundary conditions are shown in Table 5.
Table 5.
The initial conditions and boundary conditions of liquid xenon filling.
The specific parameters are listed in Table 6.
Table 6.
Xenon saturation pressure and saturation temperature interpolation table.
The liquid phase is considered an incompressible fluid. The density is 2943.5 kg/m3 and the gas phase adopts the ideal gas equation of state. The other gas-liquid two-phase physical property parameters are linearly interpolated; the detailed parameters are shown in Table 7.
Table 7.
Linear interpolation table of gas-liquid two-phase physical properties of xenon.
The surface tension was linearly interpolated, as shown in Table 8.
Table 8.
Xenon surface tension linear interpolation table.
4.2. The Comparison of the Differences in Xenon Filling Process for Storage Tanks Between Ground and Space Environments
4.2.1. Characteristics of Xenon Gas-Free Refueling on the Ground
The inlet mass flow rate is set to 1 kg/s, and the pressure upper limit of 6.2 bar is used as the signal to stop filling. Using the VOF model and the Lee model, the process of filling liquid xenon into the tank during ground filling is calculated. Figure 5 shows the calculation results, where the phase change rate is represented by the symbol Y.
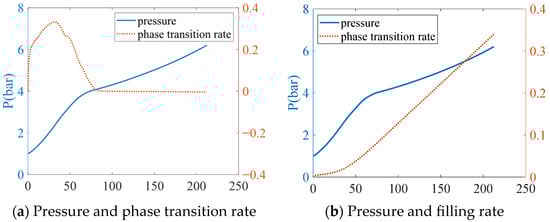
Figure 5.
The relationship between the pressure in the ground filling tank and the rate of phase change and filling rate.
From Figure 5, it can be observed that when the phase change rate changes rapidly, the rate of pressure increase is faster than when the phase change rate is close to 0. The rapid increase in pressure corresponds to the vaporization stage of liquid xenon, during which a larger amount of gas is generated. When the phase change rate approaches 0, the rate of pressure increase slows down, but still continues to increase. This is because even without the release of gas, the compression of the liquid can still lead to an increase in pressure. Under normal gravity conditions, the slope of the filling rate curve during the pressure increase stage is smaller, indicating a slower increase rate. This is because, under a given flow rate, rapid changes in the phase change rate can lead to the conversion of some liquid into gas, which is equivalent to a reduction in the liquid volume flow rate entering the tank, thus decreasing the slope of the filling rate curve.
Through Fluent simulation technology, the distribution characteristics of pressure, temperature, and gas-liquid interface within the tank can be observed. By capturing the situation at a filling time of 200 s, the pressure, temperature, gas-liquid interface position, and xenon density within the tank can be obtained, as shown in Figure 6.
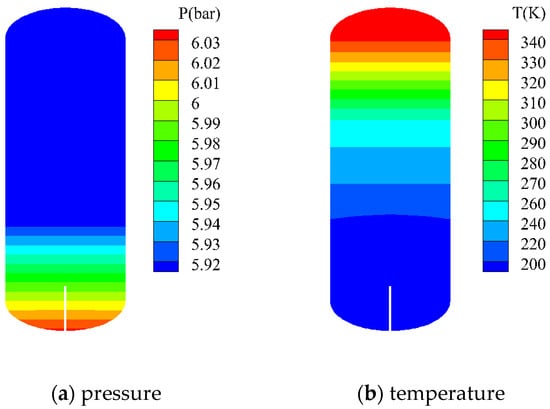
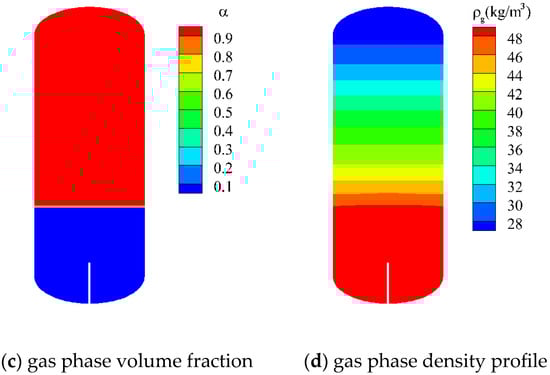
Figure 6.
Pressure, temperature, gas-liquid distribution and gas density distribution of liquid xenon injection in the ground.
According to the pressure map, a pressure stratification phenomenon can be observed in the liquid region, which is caused by gravity. The deeper the liquid, the higher the pressure. In the figure, the difference between the highest and lowest pressure points is approximately 0.1 atmospheres. From the temperature map, it can be observed that there is a thermal stratification phenomenon in the gas phase region. The temperature is lower near the liquid part and higher near the top of the tank, with a temperature difference of up to 140 K between the highest and lowest temperatures. The gas phase volume fraction map shows that during filling under gravity conditions, the gas-liquid interface position is relatively flat. From the gas phase density distribution map, it can be seen that in the gas phase region, the gas density is lower in areas farther away from the liquid. According to the ideal gas state equation, under basically constant pressure, the higher the gas temperature, the lower the density.
4.2.2. Liquid Xenon Has No Exhaust Filling Feature in Orbit
During ground filling, there exist pressure stratification and temperature stratification phenomena of liquid xenon within the tank. However, in a microgravity environment, the liquid will not be concentrated at the bottom of the tank due to the absence of gravity, resulting in differences in the distribution of pressure and temperature within the tank. No-venting filling mainly consists of vaporization, condensation, and compression stages. This study recorded three moments representing these three different stages by analyzing the distribution characteristics of pressure and temperature within the tank during the filling of liquid xenon into the tank in a microgravity environment, as shown in Figure 7.
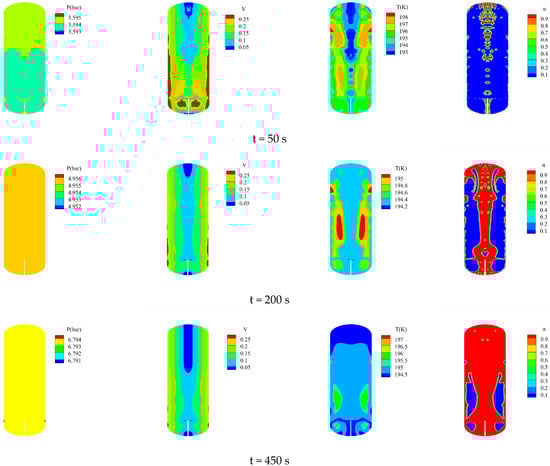
Figure 7.
Pressure and temperature distribution in the tank under microgravity conditions.
As can be seen from Figure 7, for the same filling time, the difference between the maximum and minimum pressure values within the tank is less than 0.01 bar, indicating a relatively uniform pressure distribution with no pressure stratification phenomenon. Similarly, the temperature distribution does not exhibit stratification. As shown in Figure 7, the velocity on both sides of the tank is higher than that at the center. At the beginning of the filling process, the liquid velocity inside the tank is very high. As filling continues, the velocity gradually decreases. According to Figure 7, when the filling time is 50 s, the difference between the maximum and minimum temperatures is less than 5 K. At a filling time of 200 s, the temperature difference is minimal, less than 1 K. And when the filling time is 450 s, the gap between the maximum and minimum temperatures is less than 3 K. Considering the temperature distribution across these three stages, it can be approximately assumed that the temperature within the tank is uniformly distributed. Figure 7 also indicates that the gas distribution inside the tank is consistent with the temperature distribution. Initially, bubbles accumulate in the central region. As filling progresses, the gas gradually occupies the entire tank, while the liquid is confined to the bottom layer.
Based on the observations in Figure 6 and Figure 7, there are significant differences in the pressure and temperature distributions within the tank under microgravity conditions compared to those under gravity conditions. In a gravity environment, pressure and temperature stratification phenomena are typically observed. However, in a microgravity environment, the pressure distribution is relatively uniform, and the pressure throughout the tank can be considered as a uniform parameter. Additionally, the difference between the maximum and minimum temperatures is small, and the distribution is relatively uniform, allowing the temperature within the tank to be treated as a uniform parameter as well.
4.2.3. Comparison of Gas-Liquid Interface in Different Gravity Environments
The filling conditions of liquid xenon differ between ground and orbit, with significant differences in the gas-liquid interface during the filling process. The distribution of the gas-liquid interface within the tank can be obtained through a two-dimensional two-phase flow model. Assuming an inlet mass flow rate of 1 kg/s, an inlet temperature of 194 K, an initial tank wall temperature of 210 K, and an initial pressure within the tank of 1 bar, the calculation results are shown in Figure 8.
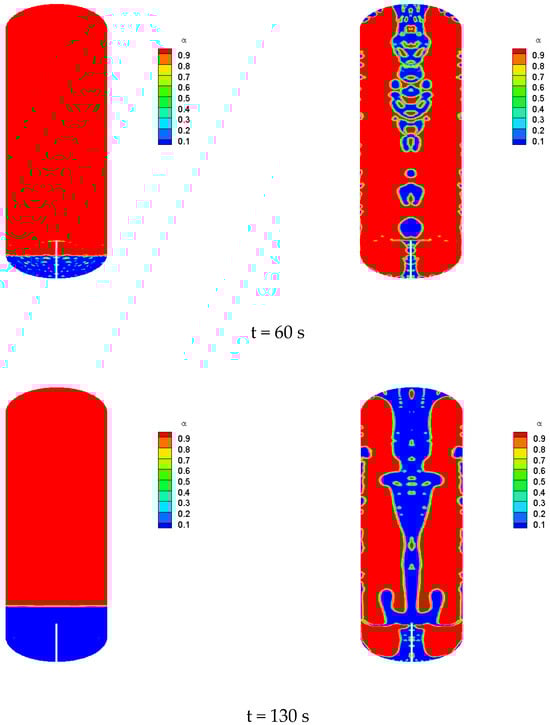
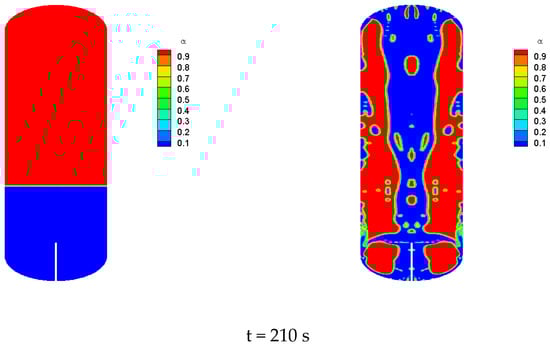
Figure 8.
Comparison of gas-liquid interface under different gravity conditions.
Based on the observation results in Figure 8, during ground filling, the liquid accumulates at the bottom of the tank, whereas in a microgravity environment, the liquid does not concentrate at the bottom, leading to a more uniform gas-liquid mixture. This results in better heat and mass transfer between the gas and liquid phases. As can be seen from the contour plot of the vapor volume fraction in Figure 8, during no-venting filling, the interface is relatively flat in a gravity environment, while it appears more chaotic in a microgravity environment, with the liquid primarily concentrated near the centerline and walls of the tank.
4.2.4. Influence of Gravity Environment on Xenon Filling Properties of Liquid
Based on previous analysis, it is evident that there are significant differences in pressure, temperature, and gas-liquid interface between ground and on-orbit filling of liquid xenon. By setting the inlet mass flow rate to 0.508 kg/s and maintaining other boundary and initial conditions, with the pressure upper limit set to 7 bar, we analyze the impact of gravity conditions on the on-orbit filling process of liquid xenon. The specific calculation results are presented in Table 9 and Figure 9.
Table 9.
Comparison of filling time and filling rate at different gravity levels.
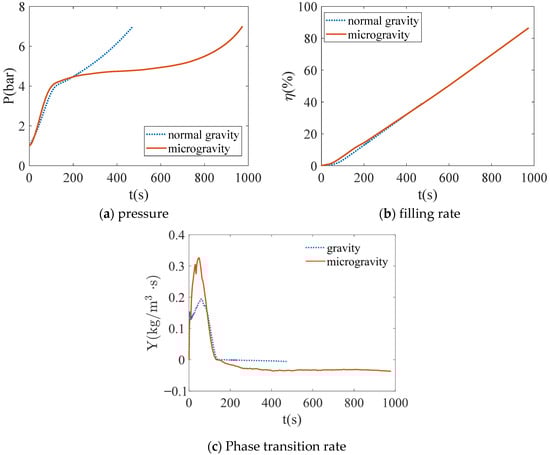
Figure 9.
Curves of pressure, filling rate and transformation rate under different gravity levels.
According to the observations in Figure 9, under microgravity conditions, the pressure growth rate is slower, the filling time is extended, and the phase change rate within the tank also increases. If the average phase change rate within the tank is positive, it indicates that the evaporation rate of the liquid is faster than the condensation rate of the gas, indicating that the liquid is evaporating overall within the tank. Conversely, if it is negative, it means that the condensation rate of the gas is faster than the evaporation rate of the liquid, indicating that the gas is condensing overall within the tank. As shown in Figure 9c, the phase change rate of xenon is higher under microgravity conditions compared to gravity conditions. Based on the observations in Figure 8, under microgravity conditions, the liquid does not concentrate at the bottom of the tank, and the gas-liquid interface is more chaotic, resulting in an increased area of the gas-liquid interface. This promotes the heat and mass transfer rates between the gas and liquid, leading to an increase in the phase change rate. Compared to the pressure curve under gravity conditions, a distinct slow growth segment is observed under microgravity conditions, as can be seen in Figure 9a. This is primarily because the condensation effect under microgravity conditions is significantly better than under gravity conditions, causing the gas to condense into liquid more quickly. This slows down the pressure growth rate, delays the emergence of the pressure stop signal, and extends the filling time. As can be seen in Figure 9b, although the derivative of the filling rate with time remains unchanged under microgravity conditions, the filling time is prolonged, resulting in a higher filling rate for the tank under microgravity conditions compared to gravity conditions.
Based on the analysis of Figure 8 and Figure 9 and Table 5, an important difference between ground filling and on-orbit filling lies in the presence or absence of gravity, which affects the distribution of the gas-liquid interface and alters the phase change rate between the gas and liquid. Under microgravity conditions, the gas-liquid contact area is larger, leading to an increased condensation rate, which results in a slower rise in pressure, an extended filling time, and an improved tank filling rate. This enhances the performance of no-venting filling. The increase in gas-liquid contact area promotes a faster phase change rate, bringing xenon closer to a thermodynamic equilibrium state, and resulting in a more uniform distribution of pressure and temperature within the tank.
The inlet mass flow rate is a critical factor that affects the filling process. Different inlet mass flow rates introduce different masses and kinetic energies, which influence the filling time and phase change rate, and consequently affect the changes in parameters such as pressure and temperature within the tank. This paper enumerates the filling conditions under different mass flow rates and analyzes the impact of inlet mass flow rate on filling time, filling rate, and phase change rate. The specific settings are an inlet temperature of 194 K, an initial tank wall temperature of 210 K, and an initial pressure within the tank of 1 bar. The calculation results are presented in Table 10 and Figure 10.
Table 10.
Comparison of filling time and filling rate without exhaust at different mass flow rates.
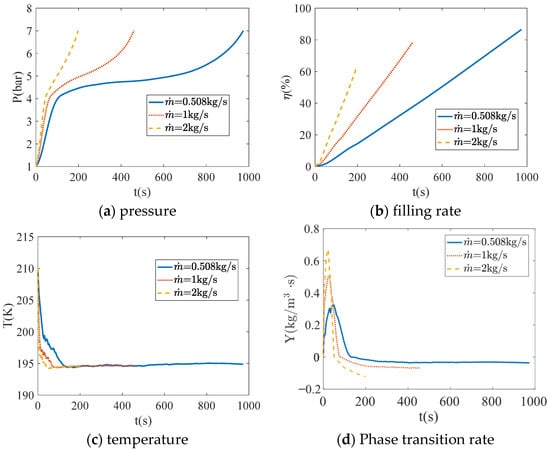
Figure 10.
Curve of phase transition rate at different mass flow rates.
Through the analysis of Figure 10, it can be seen that changes in mass flow rate affect the trends of pressure, temperature, and phase change rate, but do not alter their basic directional trends; rather, they influence their intensities. According to the pressure curve, it can be observed that changes in mass flow rate manifest as stages of sudden pressure increase, condensation, and compression. However, when the mass flow rate is excessively high, the distinction between the condensation and compression stages becomes less pronounced. A smaller mass flow rate results in a longer duration for the condensation stage. As evident from the filling rate curve, a higher mass flow rate leads to a faster increase in the filling rate and a higher filling rate per unit time. However, when pressure signals are used as an indicator to stop the filling process, the final filling rate is lower. The temperature curve reveals that an increase in mass flow rate accelerates the rate of temperature decline, but the final temperature within the tank remains the same. The phase change rate diagram indicates that a higher mass flow rate intensifies the phase change rate. During the vaporization stage, increasing the mass flow rate accelerates the phase change rate, releasing more gas, resulting in a faster rise in pressure, and reducing the time required for the vaporization stage. In the condensation stage, a higher mass flow rate speeds up the condensation rate, but this does not necessarily mean a slower rise in pressure because a greater mass flow rate brings more liquid to compress the gas, driving up the pressure. Therefore, a slow pressure rise process is not observed.
Based on the previous analysis, it can be seen that gravity conditions affect the distribution of the gas-liquid interface within the tank, and variations in mass flow rate also influence the gas-liquid interface during the filling of liquid xenon within the tank. As shown in Figure 11, we have captured the gas-liquid interface at different filling rates.
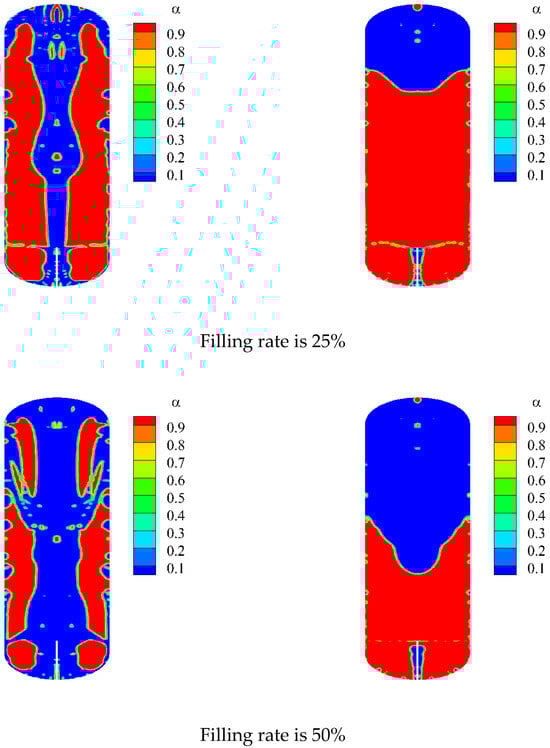
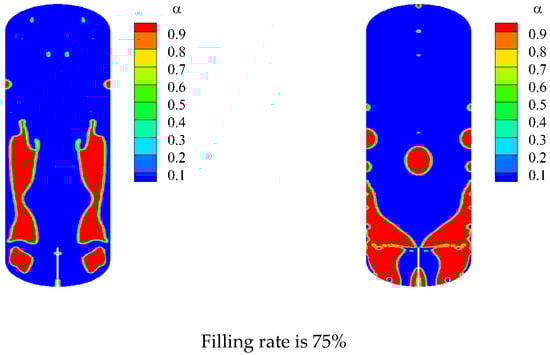
Figure 11.
Gas-liquid interface distribution under different inlet mass flow.
Figure 11 demonstrates the distribution of the gas-liquid interface under different inlet mass flow rates. The left side represents a mass flow rate of 1 kg/s, while the right side represents a mass flow rate of 0.25 kg/s. It can be observed that when the mass flow rate is high, the gas-liquid interface is relatively chaotic, with gas mainly accumulating in the region between the centerline and the walls of the tank. On the other hand, when the mass flow rate is low, the gas is primarily concentrated in the top region of the tank. According to Yarin’s review [18], when a liquid droplet impacts a wall, it may undergo spreading or splashing. When the flow rate is excessively high, inertia dominates, resulting in splashing when the liquid droplet hits the wall. Conversely, when the flow rate is too low, surface tension dominates, leading to spreading when the liquid droplet impacts the wall. Therefore, at a higher mass flow rate, the liquid splashes and flows along the walls towards the top of the tank due to inertia, and then collects and flows downward. At a lower mass flow rate, the liquid spreads upon impact with the wall and collects at the top of the tank under the influence of surface tension.
5. Conclusions
This study initially validated the ground-based vent-free filling process for liquid nitrogen and subsequently calculated the orbital vent-free filling process for liquid xenon. It analyzed the distribution characteristics of pressure, temperature, and gas-liquid interface during both ground-based and orbital vent-free filling. Finally, the study examined the impact of different mass flow rates on the vent-free filling of liquid xenon. Based on the comprehensive analysis, the following conclusions were drawn:
- (1)
- During ground-based vent-free filling, a gas-liquid stratification phenomenon occurs in the tank for liquid xenon in terms of pressure and temperature. However, during orbital vent-free filling, the pressure and temperature distribution within the tank are relatively uniform, with minimal differences between the highest and lowest values. When conducting vent-free filling of liquid xenon under microgravity conditions, the pressure and temperature within the tank can be considered as uniform parameters.
- (2)
- The Lee model may likely be unable to simulate the intense flash evaporation phenomenon occurring during the initial stages of tank filling, as it is more suitable for modeling less drastic phase-change processes. To address the severe flash evaporation problem during the initial phase of non-vented filling, modifications to the Lee model will be required in subsequent work.
- (3)
- In environments influenced by gravity, the gas-liquid interface is usually horizontal. Conversely, in microgravity environments, the gas and liquid mix more uniformly, accelerating the condensation rate and enhancing the condensation efficiency of vent-free filling. This results in a slower increase in pressure, an extended filling time, and an effective increase in the tank’s filling rate.
- (4)
- Inlet mass flow rate is a crucial factor in the vent-free filling process of liquid xenon. A higher mass flow rate leads to a higher filling rate per unit time, an increased phase change rate, and a faster pressure rise. Conversely, a lower mass flow rate facilitates gas-liquid mixing, effectively enhancing the final filling rate of the tank when a certain pressure signal is used as a stop criterion for filling.
Author Contributions
Z.-Y.W. and C.J. wrote the main manuscript text. Y.H. and Y.C. (Yong Chen) jointly supervised this work and modified the whole manuscript. K.L. and Y.C. (Yun Cheng) prepared the figures and tables in this manuscript. All authors have read and agreed to the published version of the manuscript.
Funding
This research is supported by the National Natural Science Foundation of China (Grant Nos. 52105290, 62373276 and 12172363).
Data Availability Statement
The data presented in this study are available on request from the corresponding author.
Conflicts of Interest
The authors declare no conflict of interest.
Nomenclature
| E | Energy (J) | Viscosity (Pa·s−1) | |
| F | External body forces (except gravity, N) | Effective thermal conductivity | |
| h | Specific enthalpy (J·kg−1) | Effective stress tensor | |
| J | Diffusion flux | coeff | Coefficient |
| S | Source | subscripts | |
| Volumetric heat sources | g | Gas | |
| T | Temperature (K) | h | Heat |
| V | Velocity (m·s−1) | j | Species |
| g | Gravitational acceleration (m·s−2) | l | Liquid |
| Mass flow rate (kg·s−1) | n | Number of phases | |
| p | Pressure (Pa) | p | Phase |
| Volume fraction | q | Phase | |
| Density (kg·m−2) | sat | Saturation boiling |
References
- Chato, D.J. Thermodynamic modeling of the no-vent fill methodology for transferring cryogens in low gravity. In Proceedings of the 24th Joint Propulsion Conference, Boston, MA, USA, 11–13 July 1988. [Google Scholar]
- Vaughan, D.A.; Schmidt, G.R. Analytical modeling of no-vent fill process. J. Spacecr. Rocket. 1991, 28, 574–579. [Google Scholar] [CrossRef]
- Sauter, D.; Hochstein, J.; Fite, L. Computational Modeling of Cryogenic Propellant Resupply. In Proceedings of the 44th AIAA Aerospace Sciences Meeting and Exhibit, Reno, NV, USA, 9–12 January 2006. [Google Scholar]
- Kim, Y.; Lee, C.; Park, J.; Seo, M.; Jeong, S. Experimental investigation on no-vent fill process using tetrafluoromethane (CF4). Cryogenics 2016, 74, 123–130. [Google Scholar] [CrossRef]
- Wang, C.; Wang, R.; Li, Y.; Xie, G.; Ding, C. Performance Comparison of 4 Different Filling Structures in Emission-free Filling. Cryogenics 2008, 35–39. [Google Scholar]
- Wang, C. Theoretical and Experimental Study on Non-Discharge Filling Characteristics of Cryogenic Liquids. Ph.D. Thesis, Shanghai Jiao Tong University, Shanghai, China, 2012. [Google Scholar]
- Wang, L.; Li, Y.; Zhang, F.; Ma, Y. Performance analysis of no-vent fill process for liquid hydrogen tank in terrestrial and on-orbit environments. Cryogenics 2015, 72, 161–171. [Google Scholar] [CrossRef]
- Ma, Y.; Li, Y.; Zhu, K.; Wang, Y.; Wang, L.; Tan, H. Investigation on no-vent filling process of liquid hydrogen tank under microgravity condition. Int. J. Hydrogen Energy 2017, 42, 8264–8277. [Google Scholar] [CrossRef]
- Ma, Y.; Wang, L.; Sun, P.; Li, P.; Li, Y. Numerical study of low temperature fluid filling process without exhaust in microgravity environment. Cryogenics 2017, 7–13. [Google Scholar]
- Tomasz, P.; Jacek, C. Experimental Study on the Mass Flow Rate of the Self-Pressurizing Propellants in the Rocket Injector. Aerospace 2021, 8, 317. [Google Scholar] [CrossRef]
- Simone, L.; Nicola, F.; Luca, M.; Davide, Z.; Filippo, M. A Two-Phase Mass Flow Rate Model for Nitrous Oxide Based on Void Fraction. Aerospace 2022, 9, 828. [Google Scholar] [CrossRef]
- Gong, J.; Li, G.; Liu, R.; Wang, Z. Numerical Calculation of Gas–Liquid Two-Phase Flow in Tesla Valve. Aerospace 2024, 11, 409. [Google Scholar] [CrossRef]
- Liang, X.; Wang, S.; Shen, W. Analysis of Bubble Flow in an Inclined Tube and Modeling of Flow Prediction. Aerospace 2024, 11, 655. [Google Scholar] [CrossRef]
- Zhu, J.; Zhang, P.; Tan, S.; Wang, T.; Guo, C.; Jiang, Y. Heat Transfer Model Based on Flow Pattern During Flow Boiling in Rectangular Microchannels. Aerospace 2024, 11, 733. [Google Scholar] [CrossRef]
- Patankar, S.V.; Spalding, D.B. A Calculation Procedure for Heat, Mass and Momentum Transfer in Three-Dimensional Parabolic Flows. Int. J. Heat Mass Transf. 1972, 1787–1806. [Google Scholar] [CrossRef]
- Patankar, S.V. Numerical Heat Transfer and Fluid Flow; Hemisphere: Washington, DC, USA, 1980. [Google Scholar]
- Youngs, D.L. Time-Dependent Multi-Material Flow with Large Fluid Distortion. In Numerical Methods for Fluid Dynamics; Academic Press: Cambridge, MA, USA, 1982; pp. 273–486. [Google Scholar]
- Yarin, A.L. DROP IMPACT DYNAMICS: Splashing, Spreading, Receding, Bouncing…. Annu. Rev. Fluid Mech. 2006, 38, 159–192. [Google Scholar] [CrossRef]
Disclaimer/Publisher’s Note: The statements, opinions and data contained in all publications are solely those of the individual author(s) and contributor(s) and not of MDPI and/or the editor(s). MDPI and/or the editor(s) disclaim responsibility for any injury to people or property resulting from any ideas, methods, instructions or products referred to in the content. |
© 2025 by the authors. Licensee MDPI, Basel, Switzerland. This article is an open access article distributed under the terms and conditions of the Creative Commons Attribution (CC BY) license (https://creativecommons.org/licenses/by/4.0/).