Article

Prediction of Propellant Electrostatic Sensitivity Based on Small-Sample Machine Learning Models

1
Xi’an Key Laboratory of Functional Organic Porous Materials, School of Chemistry and Chemical Engineering, Northwestern Polytechnical University, Xi’an 710000, China
2
Xi’an North Huian Chemical Industry Co., Ltd., Xi’an 710302, China
*
Authors to whom correspondence should be addressed.
These authors contributed equally to this work.
Aerospace 2025, 12(7), 622; https://doi.org/10.3390/aerospace12070622
Submission received: 27 May 2025 / Revised: 3 July 2025 / Accepted: 7 July 2025 / Published: 11 July 2025

Abstract

Hydroxyl-terminated-polybutadiene (HTPB)-based composite solid propellants are extensively used in aerospace and defense applications due to their high energy density, thermal stability, and processability. However, the presence of highly sensitive energetic components in their formulations leads to a significant risk of accidental ignition under electrostatic discharge, posing serious safety concerns during storage, transportation, and handling. To address this issue, this study explores the prediction of electrostatic sensitivity in HTPB propellants using machine learning techniques. A dataset comprising 18 experimental formulations was employed to train and evaluate six machine learning models. Among them, the Random Forest (RF) model achieved the highest predictive accuracy (R2 = 0.9681), demonstrating a strong generalization capability through leave-one-out cross-validation. Feature importance analysis using SHAP and Gini index methods revealed that aluminum, catalyst, and ammonium perchlorate were the most influential factors. These findings provide a data-driven approach for accurately predicting electrostatic sensitivity and offer valuable guidance for the rational design and safety optimization of HTPB-based propellant formulations.

1. Introduction

Composite solid propellants are crucial power sources for the flight of weapons such as missiles. Among the various types of solid propellants, hydroxyl-terminated polybutadiene (HTPB) solid propellant stands out due to its high energy density, excellent thermal stability, and controllability. It holds significant application value in aerospace and military fields and is currently the most widely used composite solid propellant [1,2,3]. However, due to the high content of sensitive energetic materials in their formulations, these propellants are highly susceptible to accidental initiation. Additionally, the proportion and quality of raw materials (e.g., particle size distribution, purity, and surface state) as well as the manufacturing process can also influence the electrostatic spark sensitivity of the final HTPB solid propellant [4]. During transportation, storage, or handling, exposure to static electricity beyond a certain threshold can easily induce rapid exothermic reactions, potentially resulting in fires or explosions. Such incidents pose serious risks to production safety and operational reliability [5,6].
Therefore, conducting research on the electrostatic safety properties of solid propellants, establishing reliable electrostatic sensitivity assessment methods, and deeply analyzing the structure−effect relationship between the formulation and electrostatic sensitivity can help explore effective techniques for reducing static sensitivity. It also provides solid theoretical support for the safe use and development of HTPB propellants, laying a scientific foundation for the optimization of propellant formulations and the establishment of safety protection measures [7,8,9]. Although optimizing the formulation design of HTPB propellant can effectively reduce its electrostatic accumulation and improve its electrostatic sensitivity, traditional propellant formulation experimental design often requires substantial time and resources. Moreover, due to the complexity and safety risks of the experimental process, it is often difficult to obtain ideal formulation results in a short period. The high cost and long cycle of experimental design limit the efficiency of propellant performance optimization, and some experimental processes may face unexpected safety risks, increasing the challenges of research and development [10].
In recent years, with the rapid development of artificial intelligence technology, machine-learning-based methods have been widely applied in the optimization and performance prediction of solid propellant formulations, demonstrating significant advantages [11,12,13]. For instance, Cheng et al. utilized machine learning methods to investigate the influence of AP particle size distribution and mass fraction on the mechanical properties of HTPB propellant, revealing the complex nonlinear relationship between propellant mechanical properties and particle grading [14]. Guo et al. constructed friction sensitivity and impact sensitivity prediction models for RDX-modified double-base propellants based on machine learning [15], achieving high precision and rapid prediction of propellant safety performance. Daniel et al. utilized a large amount of publicly available data to inform a random forest model for predicting the burning rate parameters of HTPB solid propellants [16]. Wang et al. introduced a framework integrating machine learning with genetic algorithms, enabling rapid screening of the most promising energetic compounds from a multitude of candidate materials [17]. Sun et al. conducted in-depth research on the combustion rate performance of HTPB propellant using machine learning technology, establishing a prediction model with material parameters and component contents as inputs and combustion rate values as outputs, with a maximum relative error of only 3.97%, significantly reducing the development cycle and cost of HTPB propellant [11]. These research findings fully indicate that machine learning technology can efficiently uncover the complex correlations between propellant formulation and performance, providing strong technical support for propellant design and optimization, and is expected to be used for the prediction of HTPB propellant electrostatic sensitivity.
In this study, we used a variety of machine learning methods to explore the influence of the raw material components of HTPB propellant on electrostatic sensitivity based on a small sample dataset. By training on limited formulation data and incorporating the leave-one-out validation method, we constructed a high-precision prediction model for electrostatic sensitivity based on the Random Forest algorithm. This model is capable of accurately predicting the electrostatic sensitivity of propellants even when sample data are relatively scarce, thereby providing a scientific basis for further propellant optimization and safety assessment.

2. Materials and Methods

2.1. Preparation of Propellant Samples and Measurement of Static Inductance

The data used in this study were obtained through experiments and consist of electrostatic sensitivity values for 18 groups of HTPB propellants with different formulations. As shown in Table 1, nine features from the HTPB propellant formulations were selected as input variables for predicting electrostatic sensitivity (ELEC) after variance filtering. The propellants with various formulations were mixed in different proportions, as shown in Table S1. The production and performance testing of the propellants were conducted as follows: The liquid and solid components were accurately weighed according to the formulation proportions and sequentially added into a vertical mixer for mechanical stirring to prepare a slurry. The mixture was processed for 135 min at 50 ± 2 °C, as per the process requirements, before discharging. The slurry was used to prepare test blocks, which were cured in an oven at 60 ± 2 °C for 4 days before conducting the electrostatic spark sensitivity test of the propellant. The electrostatic spark sensitivity test was carried out according to the standard QJ 20019.5-2018 [18], with a test charge of 50 mg, a capacitor of 10,000 pF, and a needle gap of 1 mm.

2.2. Model Selection and Evaluation

Currently, the most commonly used machine learning methods include Random Forest (RF) [19], Gradient Boosting Decision Tree (GBDT) [20], Neural Networks (NN), Support Vector Regression (SVR), Adaptive Boosting (ADA) [21], Extremely Randomized Trees (ET) [22], Multilayer Perceptron (MLP) [23], and K-Nearest Neighbors (KNN) [24], among others [25,26]. Machine learning methods have already been applied to explore the relationships between HTPB formulation components and their performance [13]. Based on the previous study, six typical machine learning models were employed for data training to predict the electrostatic sensitivity performance of HTPB solid propellant: RF, GBDT, ADA, ET, MLP, and KNN. Due to the small size of the data samples, in order to make full use of the limited dataset for model training, we did not adopt the traditional approach of dividing the dataset into training, validation, and test sets. Instead, we combined leave-one-out cross validation with random search for model hyperparameter optimization and used leave-one-out cross validation to assess the model’s generalization capability. This approach maximizes the utilization of information within the small dataset while reasonably evaluating the model’s generalization ability.
The prediction accuracy of the models during training and testing was evaluated using the following metrics: Coefficient of Determination R2, Root Mean Square Error (RMSE), Mean Absolute Error (MAE), Mean Absolute Percentage Error (MAPE), and Max Residual (MRes) [27,28]. The calculation methods for these metrics are as follows:
R 2 = 1 i = 1 n ( y t , i y p , i ) 2 i = 1 n ( y ¯ y p , i ) 2
R M S E = 1 1 n i = 1 n ( y t , i y p , i ) 2
M A E = 1 1 n i = 1 n | y t , i y p , i |
M A P E = 1 n i = 1 n | y t , i y p , i | y t , i × 100 %
M R e s = M a x | y t , i y p , i |
where n represents the number of data samples in the training or test set; y t , i and y p , i are the experimental and predicted values, respectively; and y¯ denotes the average of the experimental values in the dataset. The common range of R2 values is from 0 to 1; the higher the prediction accuracy of the model, the closer the value is to 1. The range of RMSE, MAE, and MAPE values is from 0 to 1; the higher the prediction accuracy of the model, the closer the value is to 0. A smaller MRes indicates a smaller maximum error between the predicted and experimental values, which implies better prediction stability of the model.

2.3. Feature Correlation Ranking of the Model

Machine learning models are often regarded as “black box” models, and due to their high non-linearity and complexity, it is difficult to directly interpret how each feature affects the final prediction. Feature importance evaluation is a crucial step in understanding model behavior and enhancing model interpretability. To effectively interpret these models and identify the key features that impact predictions, we employed the SHAP (Shapley Additive exPlanations) method [29] for feature importance assessment. SHAP is a game-theory-based method for evaluating feature importance, which provides a contribution value for each feature, quantifying its impact on the final prediction outcome. SHAP values are based on the Shapley value principle, a fair and consistent method for assigning feature contributions, widely used in game theory.
Specifically, given a feature j, the calculation formula for its Shapley value j f is as follows:
j f = S N { j } S ! N S 1 ! N ! [ f ( S { j } f ( S ) ) ]
where j f being larger indicates that the feature has a more significant impact on the prediction; N represents the set of all features, S is a subset of features, f ( S ) is the predictive output of the model with the feature set S (excluding feature j), and f S { j is the machine learning predictive output when the model includes the feature set S and the feature j.

2.4. Modeling Method

The modeling and data processing for this study were conducted using Python 3.12.7, with data manipulation performed using the Pandas library, and the machine learning models implemented based on Scikit-learn 1.6.0. The optimal hyperparameters for the respective models trained are shown in Table 2, and the model interpretation was completed using the SHAP library.

3. Results and Discussion

3.1. Data Set Characteristics

Based on the data samples of 18 HTPB propellant formulations and their electrostatic sensitivities, the distribution of electrostatic sensitivity values for the 18 groups ranges from 72.2 to 166.29 mJ. Subsequently, the Pearson correlation coefficients between features and between features and the prediction target were examined to explore their linear relationships [30]. The Pearson correlation coefficient ranges from −1 to 1, where 1 indicates a perfect positive linear correlation, −1 indicates a perfect negative linear correlation, and values closer to 0 indicate weaker linear correlation. According to an analysis of Figure 1, the correlation between ELEC and other features is generally weak, especially with S, RDX and NHJ, which are 0.10, −0.087, and 0.14, respectively. This suggests that the relationship between these features and ELEC cannot be effectively modeled by simple linear regression, and nonlinear machine learning models should be prioritized for subsequent analysis. Therefore, all features are retained as model inputs.

3.2. Model Prediction Accuracy

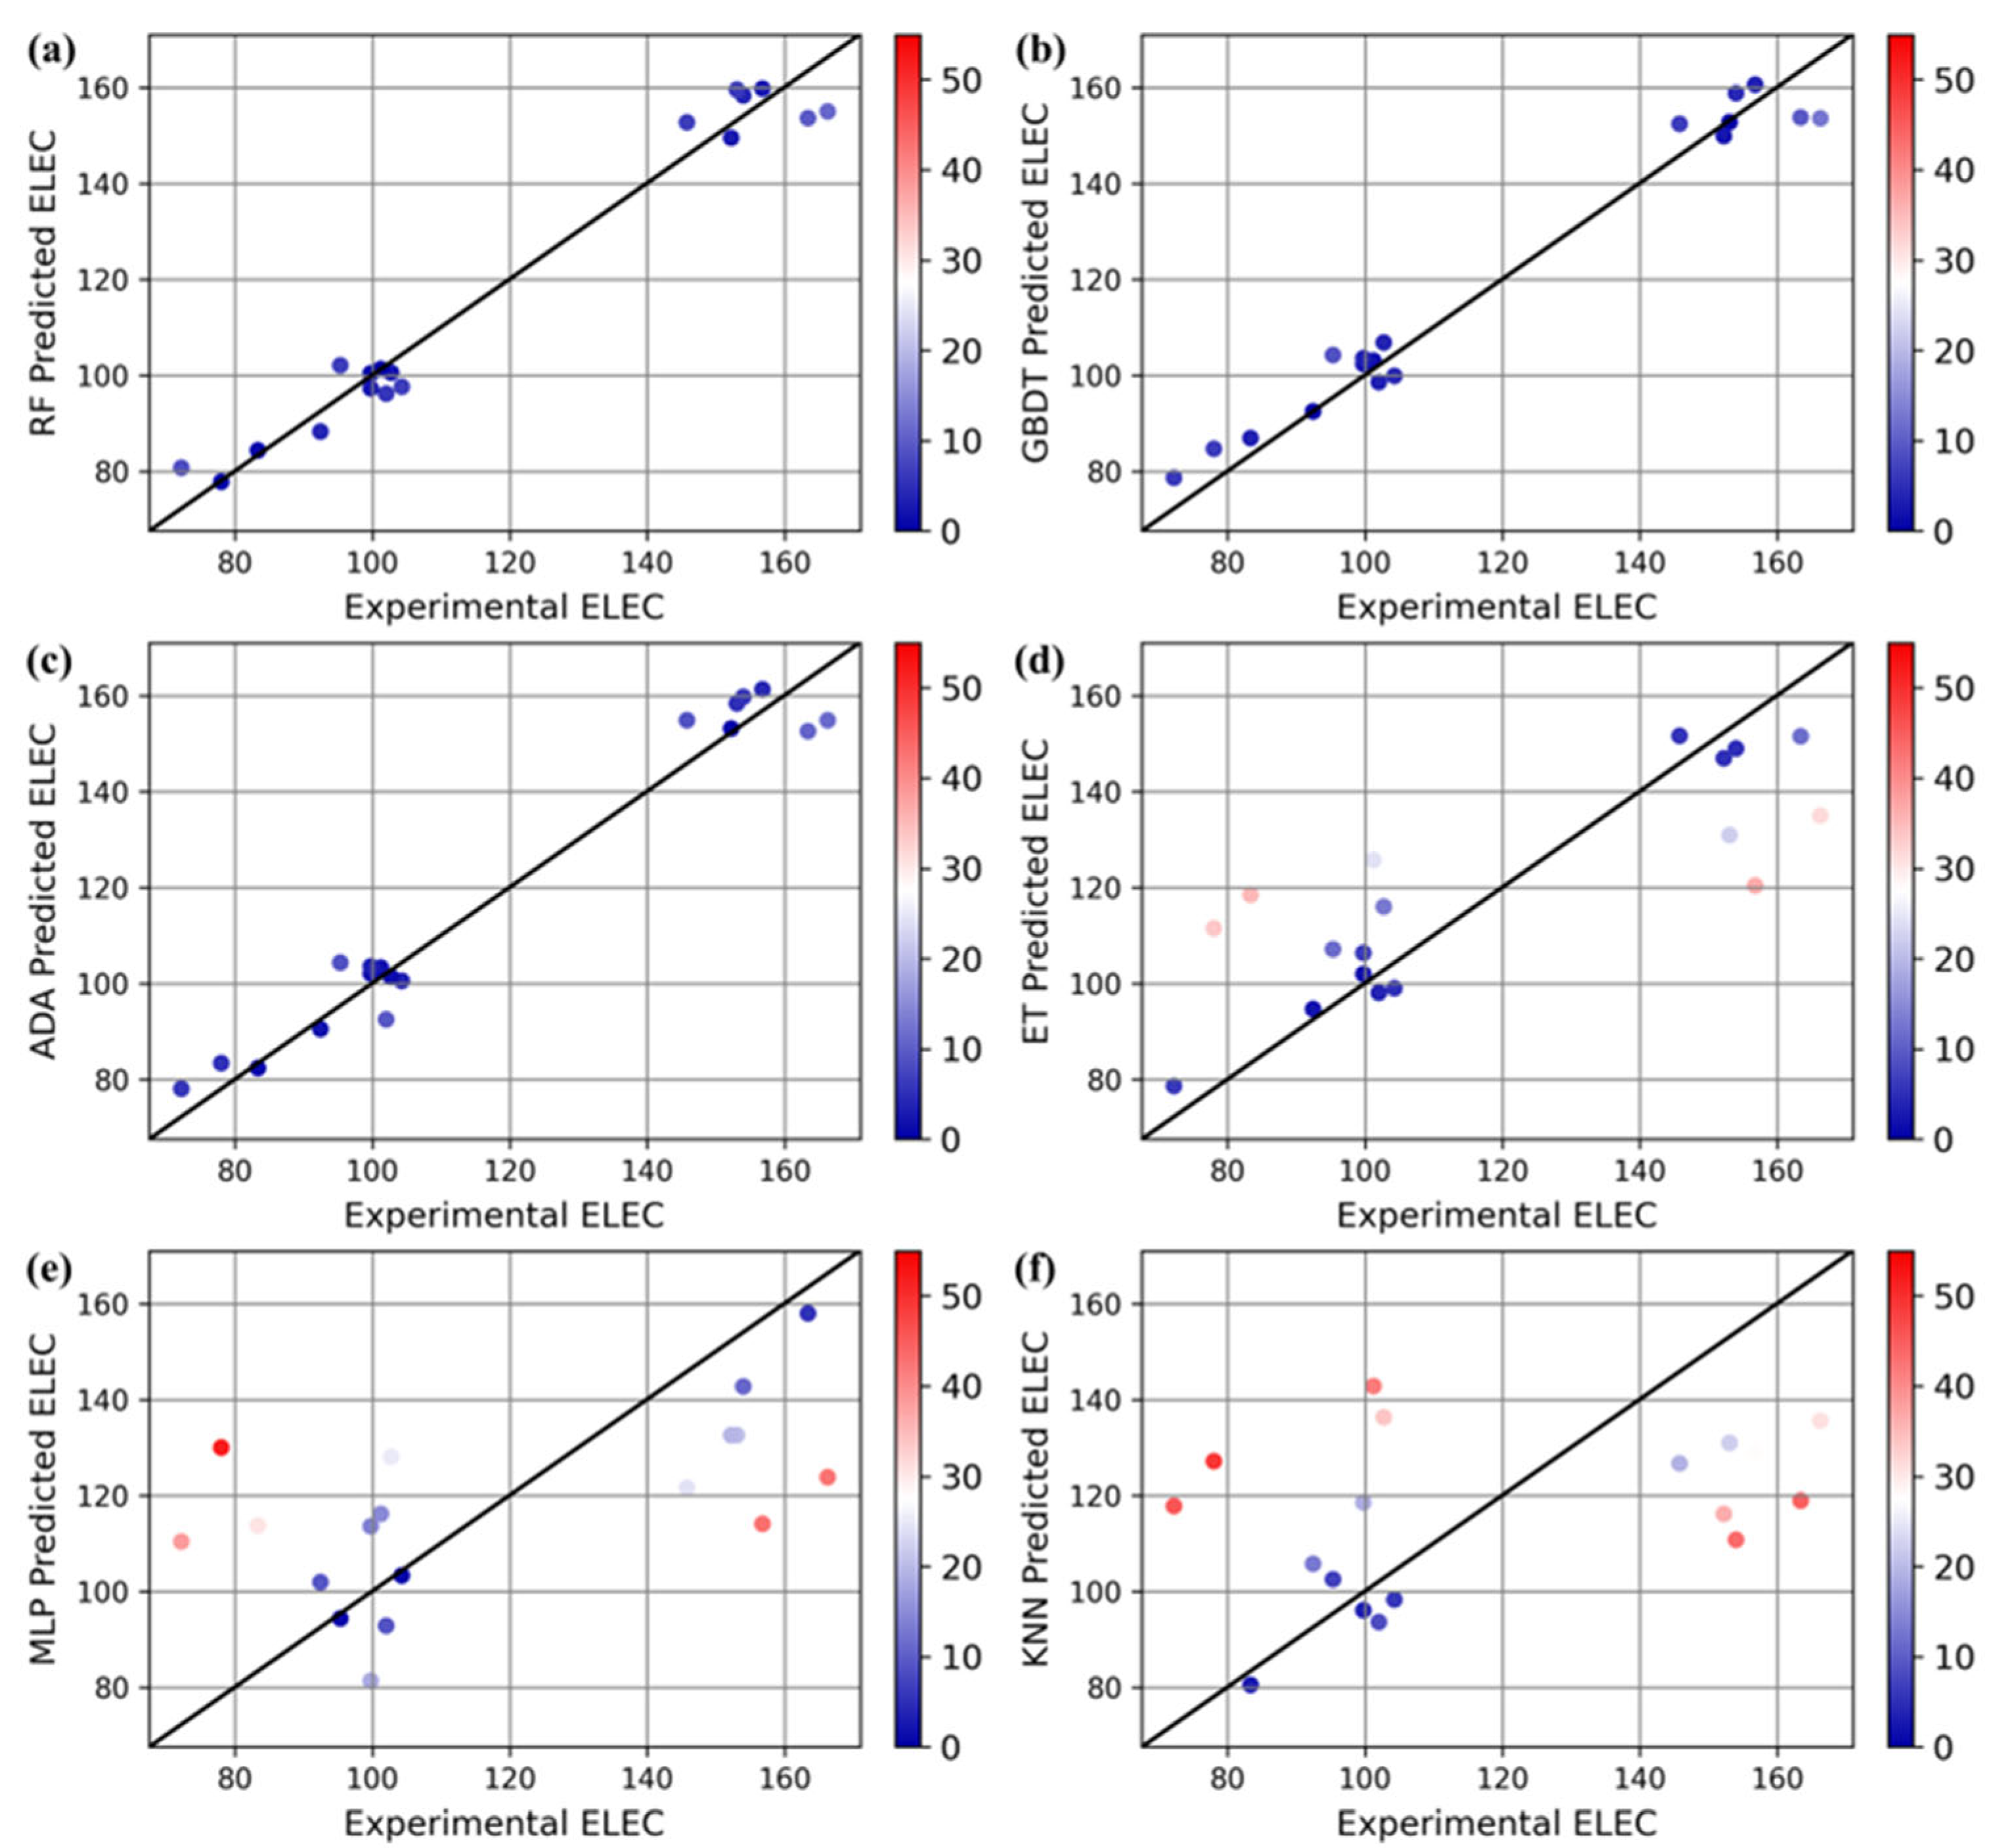
To select the optimal model for predicting the electrostatic sensitivity of HTPB propellant, we employed six different nonlinear machine learning models [31]. These models were trained on 18 samples based on 9 feature inputs, and their generalization capabilities were evaluated using the leave-one-out cross-validation method. By analyzing the predictive results of different models in terms of R2, MAE, RMSE, MAPE, and MRes (Table 3), we found that RF, GBDT, and ADA performed outstandingly in terms of model fitting. Specifically, the R2 values of these three models all exceeded 0.95, indicating their ability to effectively capture the variability in the data and possess strong predictive power. Additionally, the MAE, RMSE, and MAPE of these three models remained within a small range, suggesting low error and high prediction accuracy. In terms of the MRes, the values for RF, GBDT and ADA were 11.36, 12.79 and 11.49, respectively, showing a relatively good performance without extreme error values.
Among them, RF performed the best, with an R2 value of 0.9681, which is significantly higher than that of the other models, demonstrating the strongest fitting capability. Simultaneously, RF exhibited the lowest MAE (4.61), RMSE (5.66), and MAPE (3.92%) across all evaluation metrics, further substantiating its exceptional performance in the prediction task. Therefore, RF is considered of the optimal model. Figure 2 and Figure 3 present a comparison of the predicted and experimental values for each model. By comparing the proximity of the data points to the diagonal line, it can be visually observed that the closer the data points are to the diagonal, the more consistent the model’s predictions are with the experimental values, indicating a stronger predictive ability. This analysis further confirms the advantages of the RF model.

3.3. Model Interpretation

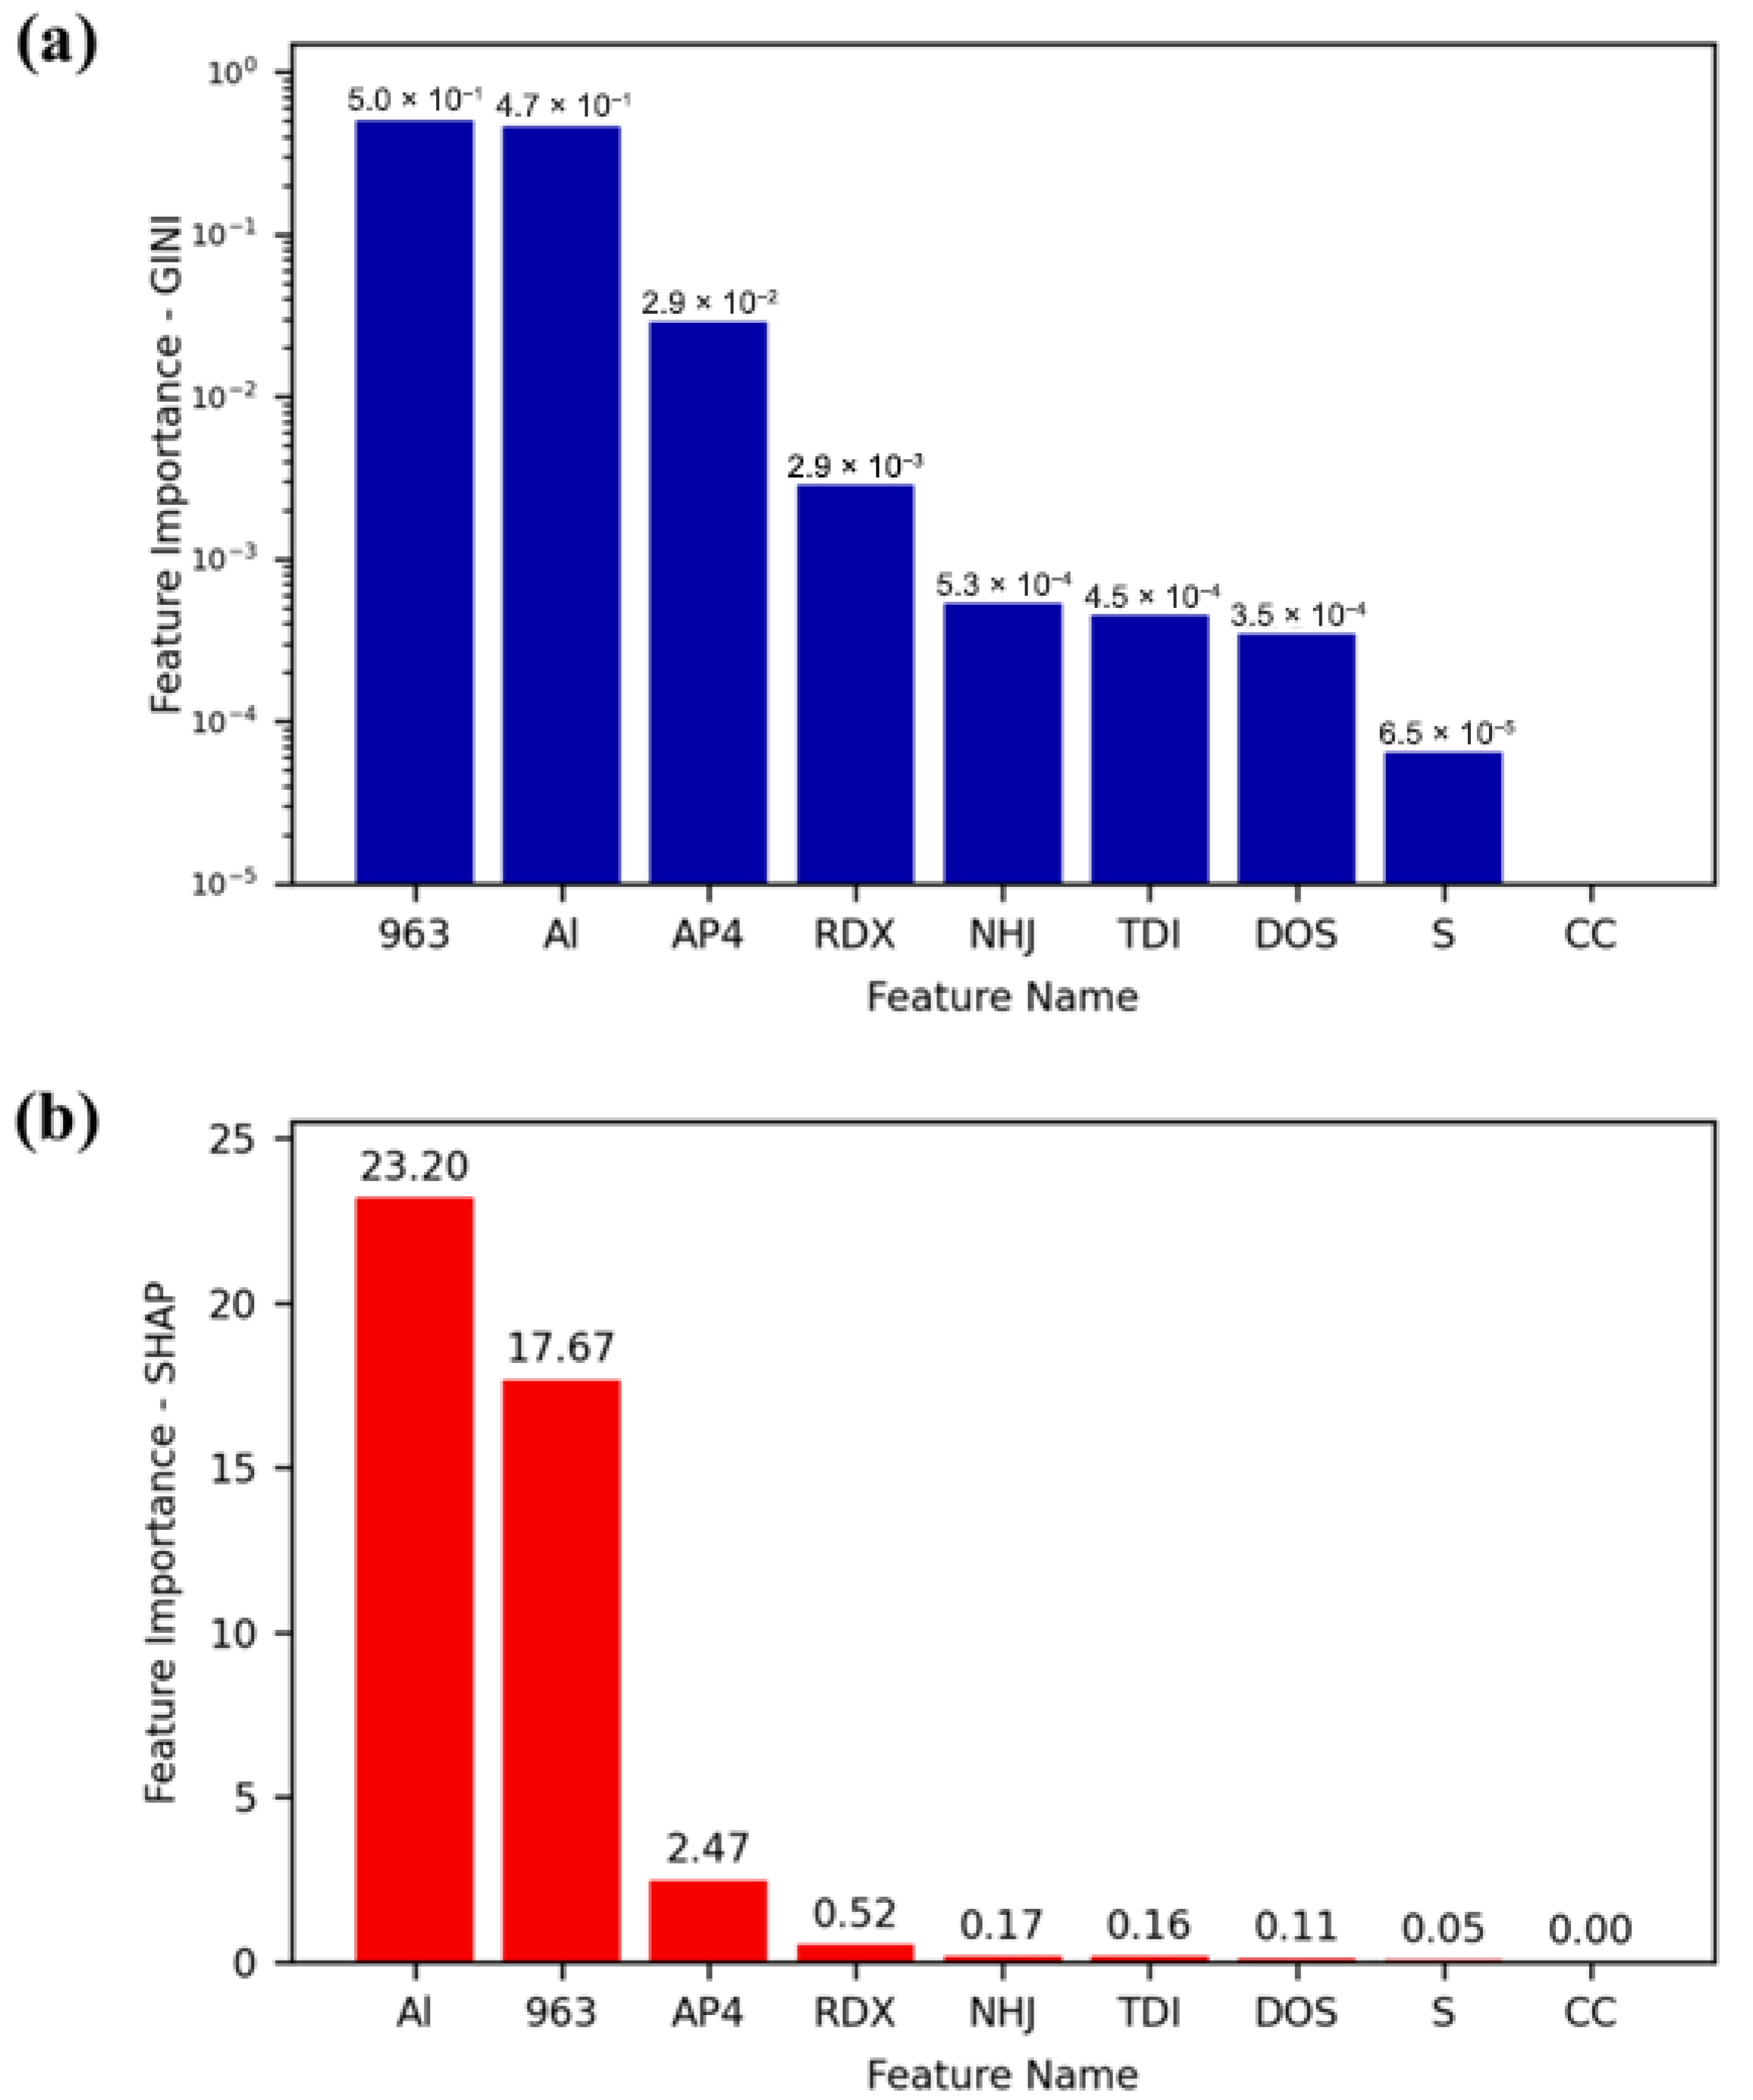
Although we have obtained a high-performance RF model through training, its “black box” nature makes the internal computational mechanism complex and difficult to interpret directly. In the RF, feature importance can be calculated by assessing the impact of each feature on the GINI index across all decision trees, and the SHAP (Shapley value) method can also be used for analysis. Additionally, by visualizing feature importance, we can intuitively identify which features have the greatest impact on the prediction results, which aids in understanding the basis of the model’s decisions and thus improves the model’s interpretability [32,33]. As shown in Figure 4, we used the GINI index [34] and Shapley values to evaluate the ranking of feature importance, respectively. According to the GINI index, the importance of features from highest to lowest is: 963, Al, AP4, RDX, NHJ, TDI, DOS, S, and CC; while the ranking calculated by the SHAP method is: Al, 963, AP4, RDX, NHJ, TDI, DOS, S, and CC. The feature importance rankings obtained by the two methods are highly similar, especially for 963, Al, and AP4, which are all ranked in the top three in both methods. It indicates that these three solid components exhibit a high correlation or marginal contribution to the electrostatic spark sensitivity of HTPB solid propellants. In other words, altering the mass percentages of these three solid components may significantly impact the electrostatic spark sensitivity of the propellant, thereby aiding in the design of HTPB solid propellant formulations.
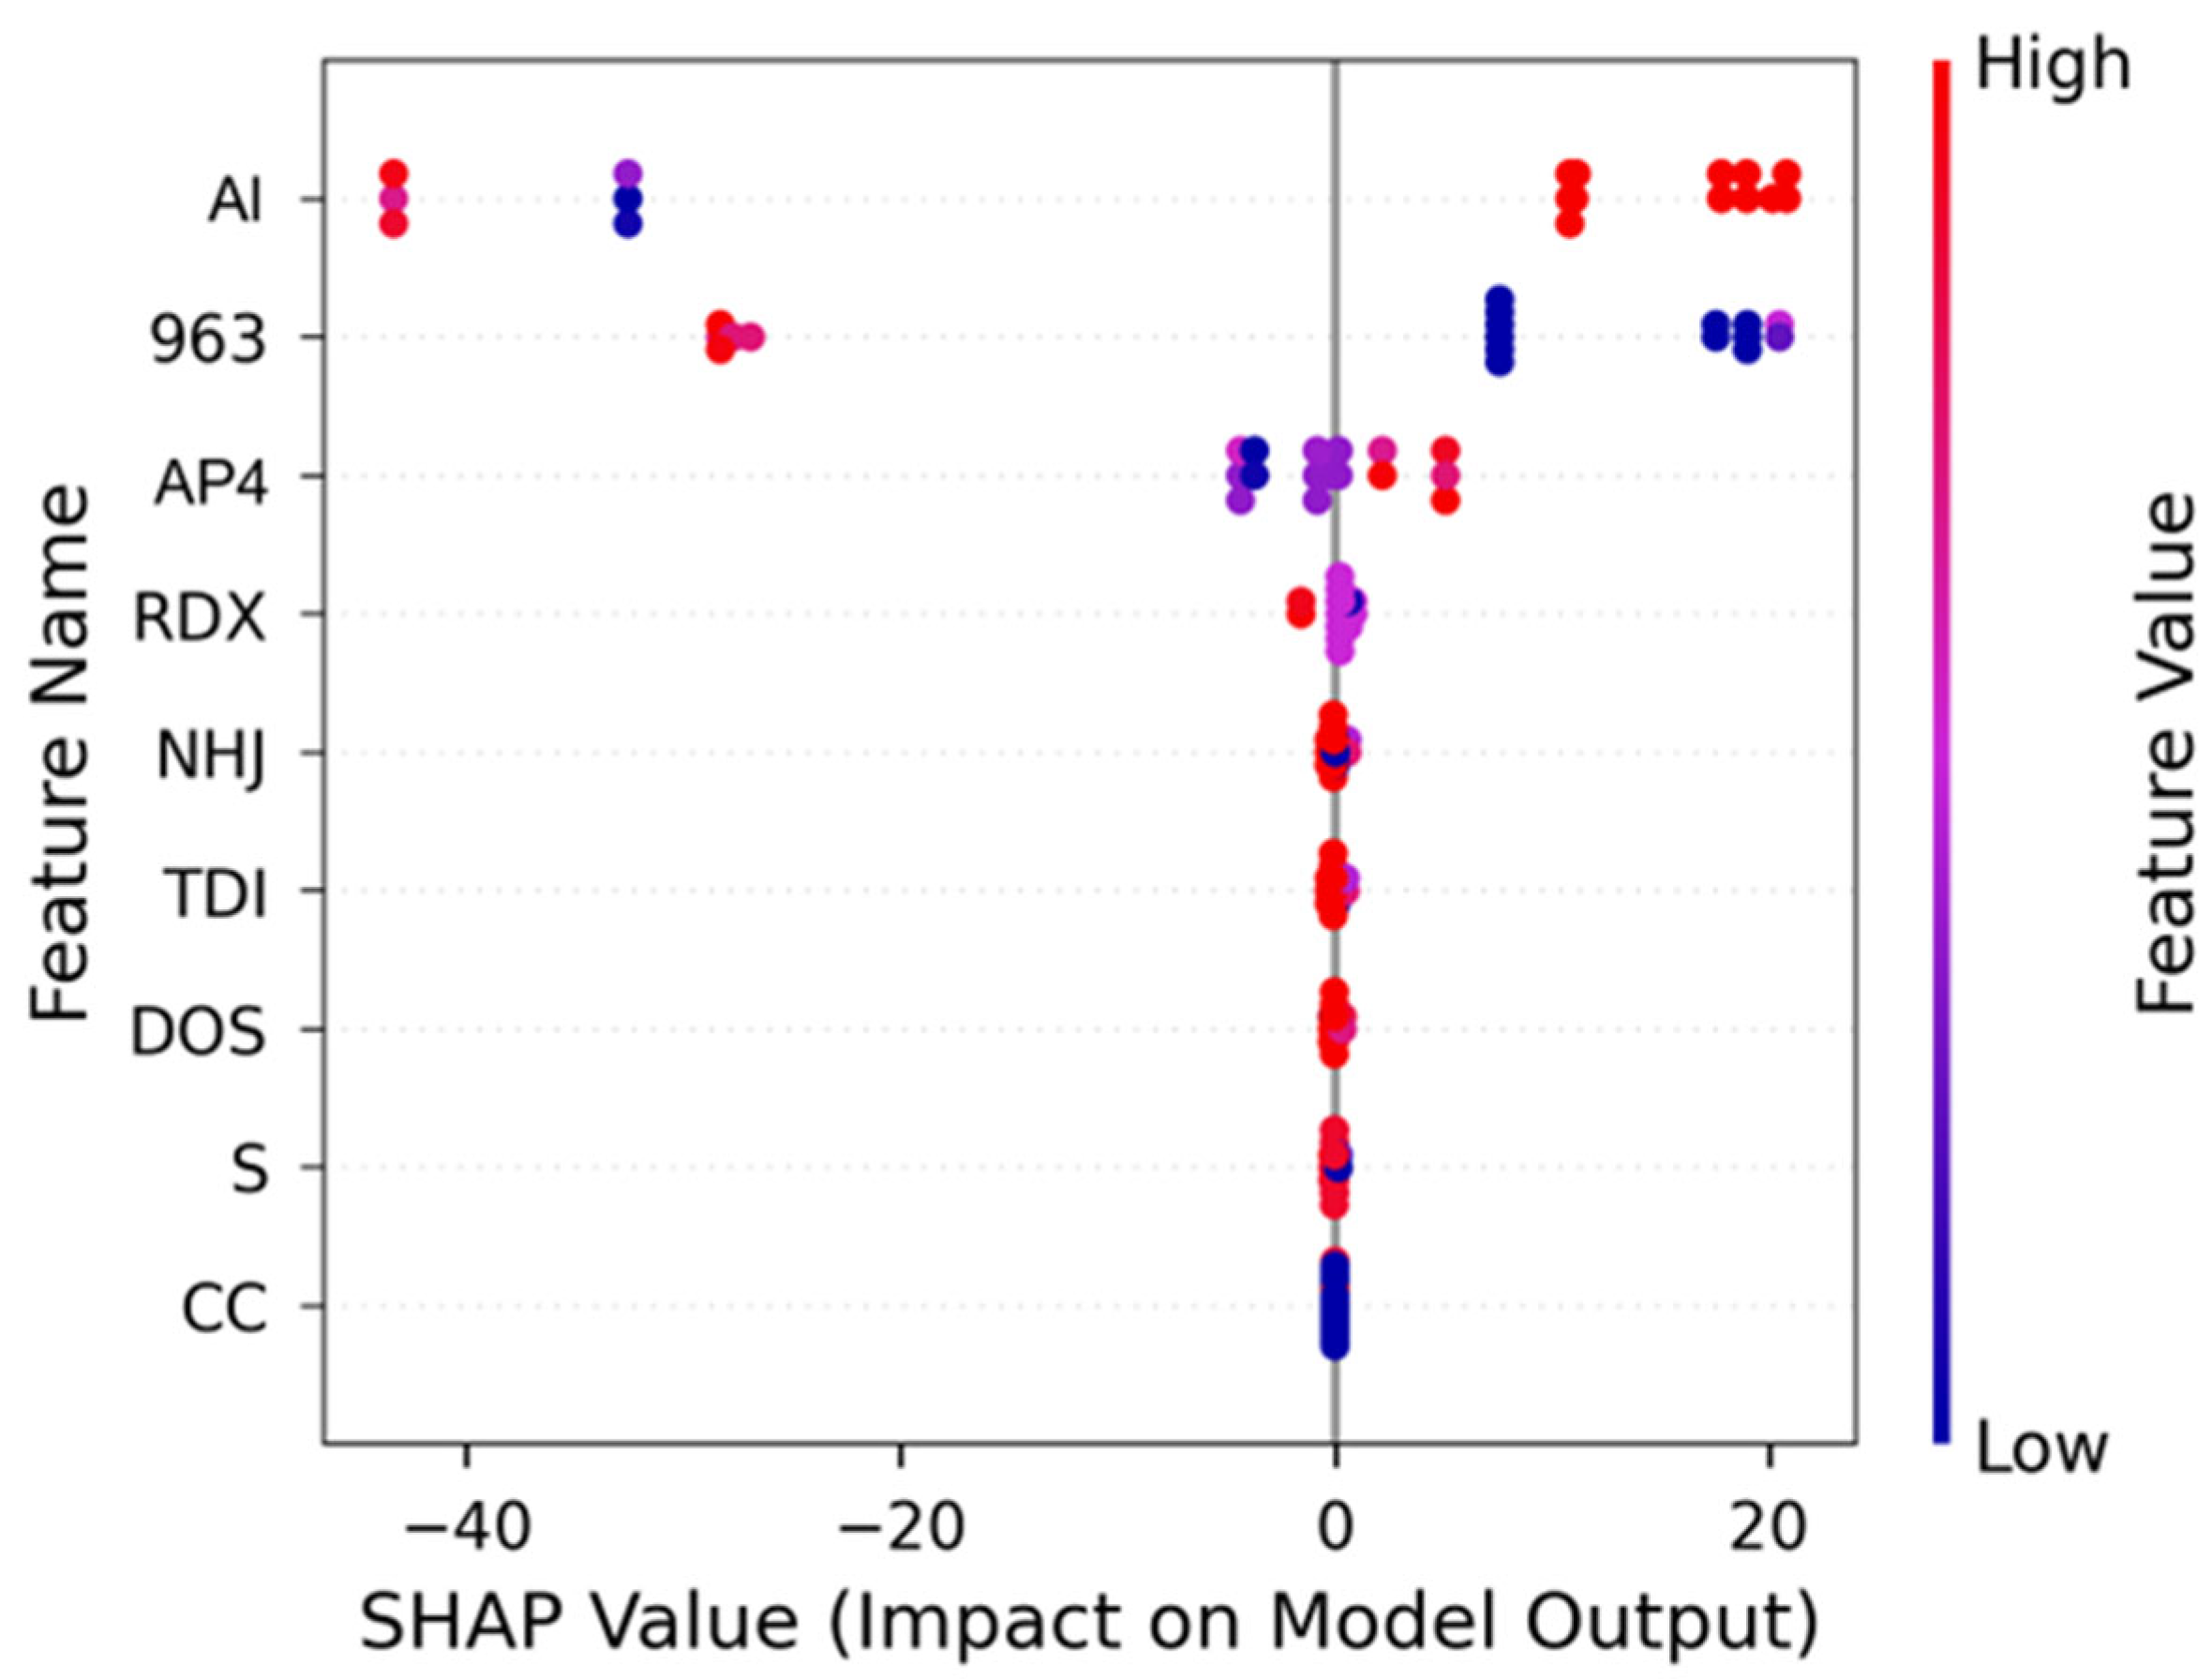
Furthermore, we used the SHAP method to analyze the influence trends of all input features on the electrostatic sensitivity of HTPB propellant. As shown in Figure 5, Al has a significant impact on the model’s electrostatic sensitivity prediction output. Particularly, higher values of Al significantly increase the model’s prediction results, while lower values drastically decrease the predictions. Al is highly conductive, and a higher Al content can increase the electrostatic discharge threshold, thereby facilitate charge dissipation and reduce the accumulation of static electricity. Here, 963 and AP4 also have a noticeable impact on the model, but their influence is smaller or more concentrated compared to Al. For 963, the higher its value, the lower its SHAP value; whereas for AP4, the higher its value, the higher its SHAP value. For other features such as RDX, NHJ, CC, S, and DOS, their SHAP values are close to zero, indicating that these features have a relatively weak impact on the electrostatic sensitivity of the propellant.

4. Conclusions

We successfully constructed machine learning models for predicting the electrostatic sensitivity of HTPB propellant. Among them, the RF, GBDT, and ADA machine learning models exhibited an excellent fitting performance, with R2 values all exceeding 0.95, and maximum residuals all less than 13, indicating high prediction accuracy and robustness. Meanwhile, the RF model performed the best, with R2 value reaching 0.9681, significantly outperforming the other models. Furthermore, the RF model excelled in all evaluation metrics, having the lowest MAE (4.61), RMSE (5.66), and MAPE (3.92%), demonstrating the strongest fitting capability and prediction accuracy. Based on the RF model, we identified the key features affecting the model’s predictive performance using the GINI index and SHAP interpretability method. The top three influential features were Al, 963, and AP4. The trends of their impact on electrostatic sensitivity are as follows: increasing the content of Al and AP4 will increase the electrostatic sensitivity, while increasing 963 will decrease it; changes in the content of other substances have a relatively minor impact on electrostatic sensitivity. The research findings provide theoretical support for a deeper understanding of the internal mechanisms of the model and the optimization of feature selection.

Supplementary Materials

The following supporting information can be downloaded at: https://www.mdpi.com/article/10.3390/aerospace12070622/s1, Table S1: Material composition and electrostatic sensitivity of different HTPB formulations.

Author Contributions

Conceptualization, T.W.; Methodology, F.W. and W.Z.; Validation, K.C., W.H. and W.Z.; Investigation, F.W. and K.C.; Resources, F.W.; Data curation, F.W. and J.L.; Writing—original draft, F.W. and K.C.; Supervision, Q.Z., W.Z. and T.W.; Project administration, T.W. All authors have read and agreed to the published version of the manuscript.

Funding

Shaanxi Provincial Science and Technology Association Youth Talent Support Program (Project Number: 20230101), The Fundamental Research Funds for the Central Universities (Project Number: D5000250204).

Data Availability Statement

The original contributions presented in this study are included in the article/Supplementary Material. Further inquiries can be directed to the corresponding authors.

Conflicts of Interest

Authors Fei Wang, Jinxiang Liu, Wenhai He and Weihai Zhang were employed by the company Xi’an North Huian Chemical Industry Co., Ltd. The remaining authors declare that the research was conducted in the absence of any commercial or financial relationships that could be construed as a potential conflict of interest.

References

  1. Jia, Y.; Wu, S.; Yao, N.; Zhou, C.; Zhang, T. Influence Mechanism of AP Gradation and Content on Interface Restriction of HTPB Solid Propellants. J. Solid Rocket Technol. 2023, 46, 886–892. (In Chinese) [Google Scholar]
  2. Liang, Y.; Ren, Q.; He, G.; Gao, J.; Wang, X. Viscoelastic Mechanical Response Analysis of HTPB Propellant Based on Fractional-Order Three-Parameter Model. J. Solid Rocket Technol. 2024, 47, 173–180. (In Chinese) [Google Scholar]
  3. Robinson, A.M.; Ka, D.; Zheng, X.; Xia, Y. Perfluoroalkyl-Functionalized HTPB Improves the Mechanical and Combustion Performance of Boron/HTPB Composites as Solid Fuel. ACS Appl. Polym. Mater. 2024, 6, 12654–12660. [Google Scholar] [CrossRef]
  4. Guo, X.D.; Liang, J.Y.; Li, F.S. Safety Property of FOX-7 and HTPB Propellants with FOX-7. Chin. J. Energ. Mater. 2010, 18, 316–319. (In Chinese) [Google Scholar]
  5. Sun, M.; Wang, Y.; Luo, T.; Rao, Y.; Zhang, T. Analysis and Optimization of Mathematical Statistics Methods for Electrostatic Sensitivity Test of Explosives. Chin. J. Explos. Propellants 2023, 46, 266–274. (In Chinese) [Google Scholar]
  6. He, Z.; Xia, Z.; Hu, J.; Li, Y. Effect of Aluminum Powder on Sensitivity of Perchlorate-Based Electrical Controlling Solid Propellant. Chin. J. Energ. Mater. 2020, 28, 52–55. (In Chinese) [Google Scholar]
  7. Chen, S.; Liu, Y.; Yao, W. Effect of Components on Combustion and Mechanical Properties of HTPB Propellant with High Energy. Chin. J. Explos. Propellants 2007, 30, 62–65. (In Chinese) [Google Scholar]
  8. Xu, H.; Zhao, F.; Pang, W.; Li, Y.; Yang, J. Properties of High Burning Rate HTPB Propellant Containing FOX-12. J. Solid Rocket Technol. 2011, 34, 745–749. (In Chinese) [Google Scholar]
  9. Wang, D.; He, G.; Wang, Z.; Zheng, K. Study on Acceleration-Based Combustion for Low-Burning Rate HTPB Propellant. J. Solid Rocket Technol. 2010, 33, 656–659. (In Chinese) [Google Scholar]
  10. Zeng, L.; Huimin, L.; Zhongqi, W.; Zhang, Q. Explosion Hazard of AP/HTPB in Fire Condition. Combust. Sci. Technol. 2023, 195, 1169–1183. [Google Scholar] [CrossRef]
  11. Sun, N.; Lin, K.; Shen, J.; Wang, X.; Zhang, B. A Machine Learning Fusion Model for Burning Rate Prediction of HTPB Propellant. J. Solid Rocket Technol. 2024, 47, 738–744. (In Chinese) [Google Scholar]
  12. Guo, Y.; Wu, Y.; Xu, S.; Pu, X.; Zhao, F. Accurate Prediction of the Comprehensive Properties for CMDB Propellants Based on Multi-Task Learning. Chem. Res. Appl. 2024, 36, 608–615. (In Chinese) [Google Scholar]
  13. Leem, J.; Jiang, Y.; Robinson, A.; Xia, Y.; Zheng, X. Data-Driven Approach to Tailoring Mechanical Properties of a Soft Material. Adv. Funct. Mater. 2023, 33, 2304451. [Google Scholar] [CrossRef]
  14. Cheng, Y.; Wang, C.; Zhang, K.; Yu, B.; Wang, Z. Mechanical Properties Prediction of HTPB Propellantsbased on Machine Learning Method. J. Solid Rocket Technol. 2024, 47, 54–59. (In Chinese) [Google Scholar]
  15. Guo, Y.; Wu, Y.; Liu, R.; Zhao, Q.; Xu, S. Machine-Learning Prediction for Safety of RDX-CMDB Propellants. J. Sichuan Univ. Nat. Sci. 2025, 62, 228–236. (In Chinese) [Google Scholar] [CrossRef]
  16. Klinger, D.; Casey, A.; Manship, T.; Son, S.; Strachan, A. Prediction of Solid Propellant Burning Rate Characteristics Using Machine Learning Techniques. Propellants Explos. Pyrotech. 2023, 48, e202200267. [Google Scholar] [CrossRef]
  17. Wang, R.; Li, Y.; Pan, L.; Fan, M.; Wang, Y. Machine Learning-Driven Discovery of High-Performance Solid Propellants. ACS Appl. Energy Mater. 2025, 8, 6756–6767. [Google Scholar] [CrossRef]
  18. QJ 20019.5-2018; Test Methods for Safety Performance of Composite Solid Propellants—Part 5 Electrostatic Spark Sensitivity. China Aerospace Standardization Institute: Beijing, China, 2018.
  19. Rigatti, S.J. Random Forest. J. Insur. Med. 2017, 47, 31–39. [Google Scholar] [CrossRef]
  20. Ke, G.; Xu, Z.; Zhang, J.; Bian, J.; Liu, T.-Y. DeepGBM: A Deep Learning Framework Distilled by GBDT for Online Prediction Tasks. In Proceedings of the 25th ACM SIGKDD International Conference on Knowledge Discovery & Data Mining, Association for Computing Machinery, Anchorage, AK, USA, 4–8 August 2019; pp. 384–394. [Google Scholar] [CrossRef]
  21. Schapire, R.E. Explaining AdaBoost. In Empirical Inference: Festschrift in Honor of Vladimir; Vapnik, N., Schölkopf, B., Luo, Z., Vovk, V., Eds.; Springer: Berlin/Heidelberg, Germany, 2013; pp. 37–52. [Google Scholar] [CrossRef]
  22. Baby, D.; Devaraj, S.J.; Hemanth, J.; Raj, A. Leukocyte Classification Based on Feature Selection Using Extra Trees Classifier: A Transfer Learning Approach. Turkish J. Electr. Eng. Comput. Sci. 2021, 29, 2742–2757. [Google Scholar] [CrossRef]
  23. Popescu, M.-C.; Balas, V.E.; Perescu-Popescu, L.; Mastorakis, N. Multilayer Perceptron and Neural Networks. WSEAS Trans. Circuits Syst. 2009, 8, 579–588. Available online: https://dl.acm.org/doi/10.5555/1639537.1639542 (accessed on 6 July 2025).
  24. Daniel, T.L.; Chantal, D.L. k-Nearest Neighbor Algorithm. In Discovering Knowledge in Data: An Introduction to Data Mining; Wiley Press: New York, NY, USA, 2014; pp. 149–164. [Google Scholar] [CrossRef]
  25. Li, K.; Wang, J.; Song, Y.; Wang, Y. Machine Learning-Guided Discovery of Ionic Polymer Electrolytes for Lithium Metal Batteries. Nat. Commun. 2023, 14, 2789. [Google Scholar] [CrossRef] [PubMed]
  26. Lei, Y.-J.; Lu, X.; Yoshikawa, H.; Matsumura, D.; Fan, Y.; Zhao, L.; Li, J.; Wang, S.; Gu, Q.; Liu, H.-K.; et al. Understanding the Charge Transfer Effects of Single Atoms for Boosting the Performance of Na-S Batteries. Nat. Commun. 2024, 15, 3325. [Google Scholar] [CrossRef] [PubMed]
  27. Cui, K.; Wang, T.; Zhang, Q.; Zhang, H. Multi-Functional Descriptor Design of V-Based Double Atomic Catalysts for Room Temperature Sodium-Sulfur Batteries. Small 2025, 21, 2409866. [Google Scholar] [CrossRef]
  28. Wan, Y.; Liu, Y.; Chao, D.; Li, W.; Zhao, D. Recent Advances in Hard Carbon Anodes with High Initial Coulombic Efficiency for Sodium-Ion Batteries. Nano Mater. Sci. 2023, 5, 189–201. [Google Scholar] [CrossRef]
  29. Van den Broeck, G.; Lykov, A.; Schleich, M.; Suciu, D. On the Tractability of SHAP Explanations. J. Artif. Int. Res. 2022, 74, 36. [Google Scholar] [CrossRef]
  30. Han, Z.; Chen, A.; Li, Z.; Zhang, M.; Wang, Z.; Yang, L.; Gao, R.; Jia, Y.; Ji, G.; Lao, Z.; et al. Machine Learning-Based Design of Electrocatalytic Materials towards High-Energy Lithium||Sulfur Batteries Development. Nat. Commun. 2024, 15, 8433. [Google Scholar] [CrossRef]
  31. Han, Z.; Tao, S.; Jia, Y.; Zhang, M.; Ma, R.; Xiao, X.; Zhou, J.; Gao, R.; Cui, K.; Wang, T.; et al. Data-Driven Insight into the Universal Structure-Property Relationship of Catalysts in Lithium-Sulfur Batteries. J. Am. Chem. Soc. 2025, 147, 26. [Google Scholar] [CrossRef]
  32. Takefuji, Y. Beyond XGBoost and SHAP: Unveiling True Feature Importance. J. Hazard. Mater. 2025, 488, 137382. [Google Scholar] [CrossRef]
  33. Lamens, A.; Bajorath, J. Comparing Explanations of Molecular Machine Learning Models Generated with Different Methods for the Calculation of Shapley Values. Mol. Inform. 2025, 44, e202500067. [Google Scholar] [CrossRef]
  34. Menze, B.H.; Kelm, B.M.; Masuch, R.; Himmelreich, U.; Bachert, P.; Petrich, W. A Comparison of Random Forest and its Gini Importance with Standard Chemometric Methods for the Feature Selection and Classification of Spectral Data. BMC Bioinform. 2009, 10, 213. [Google Scholar] [CrossRef]
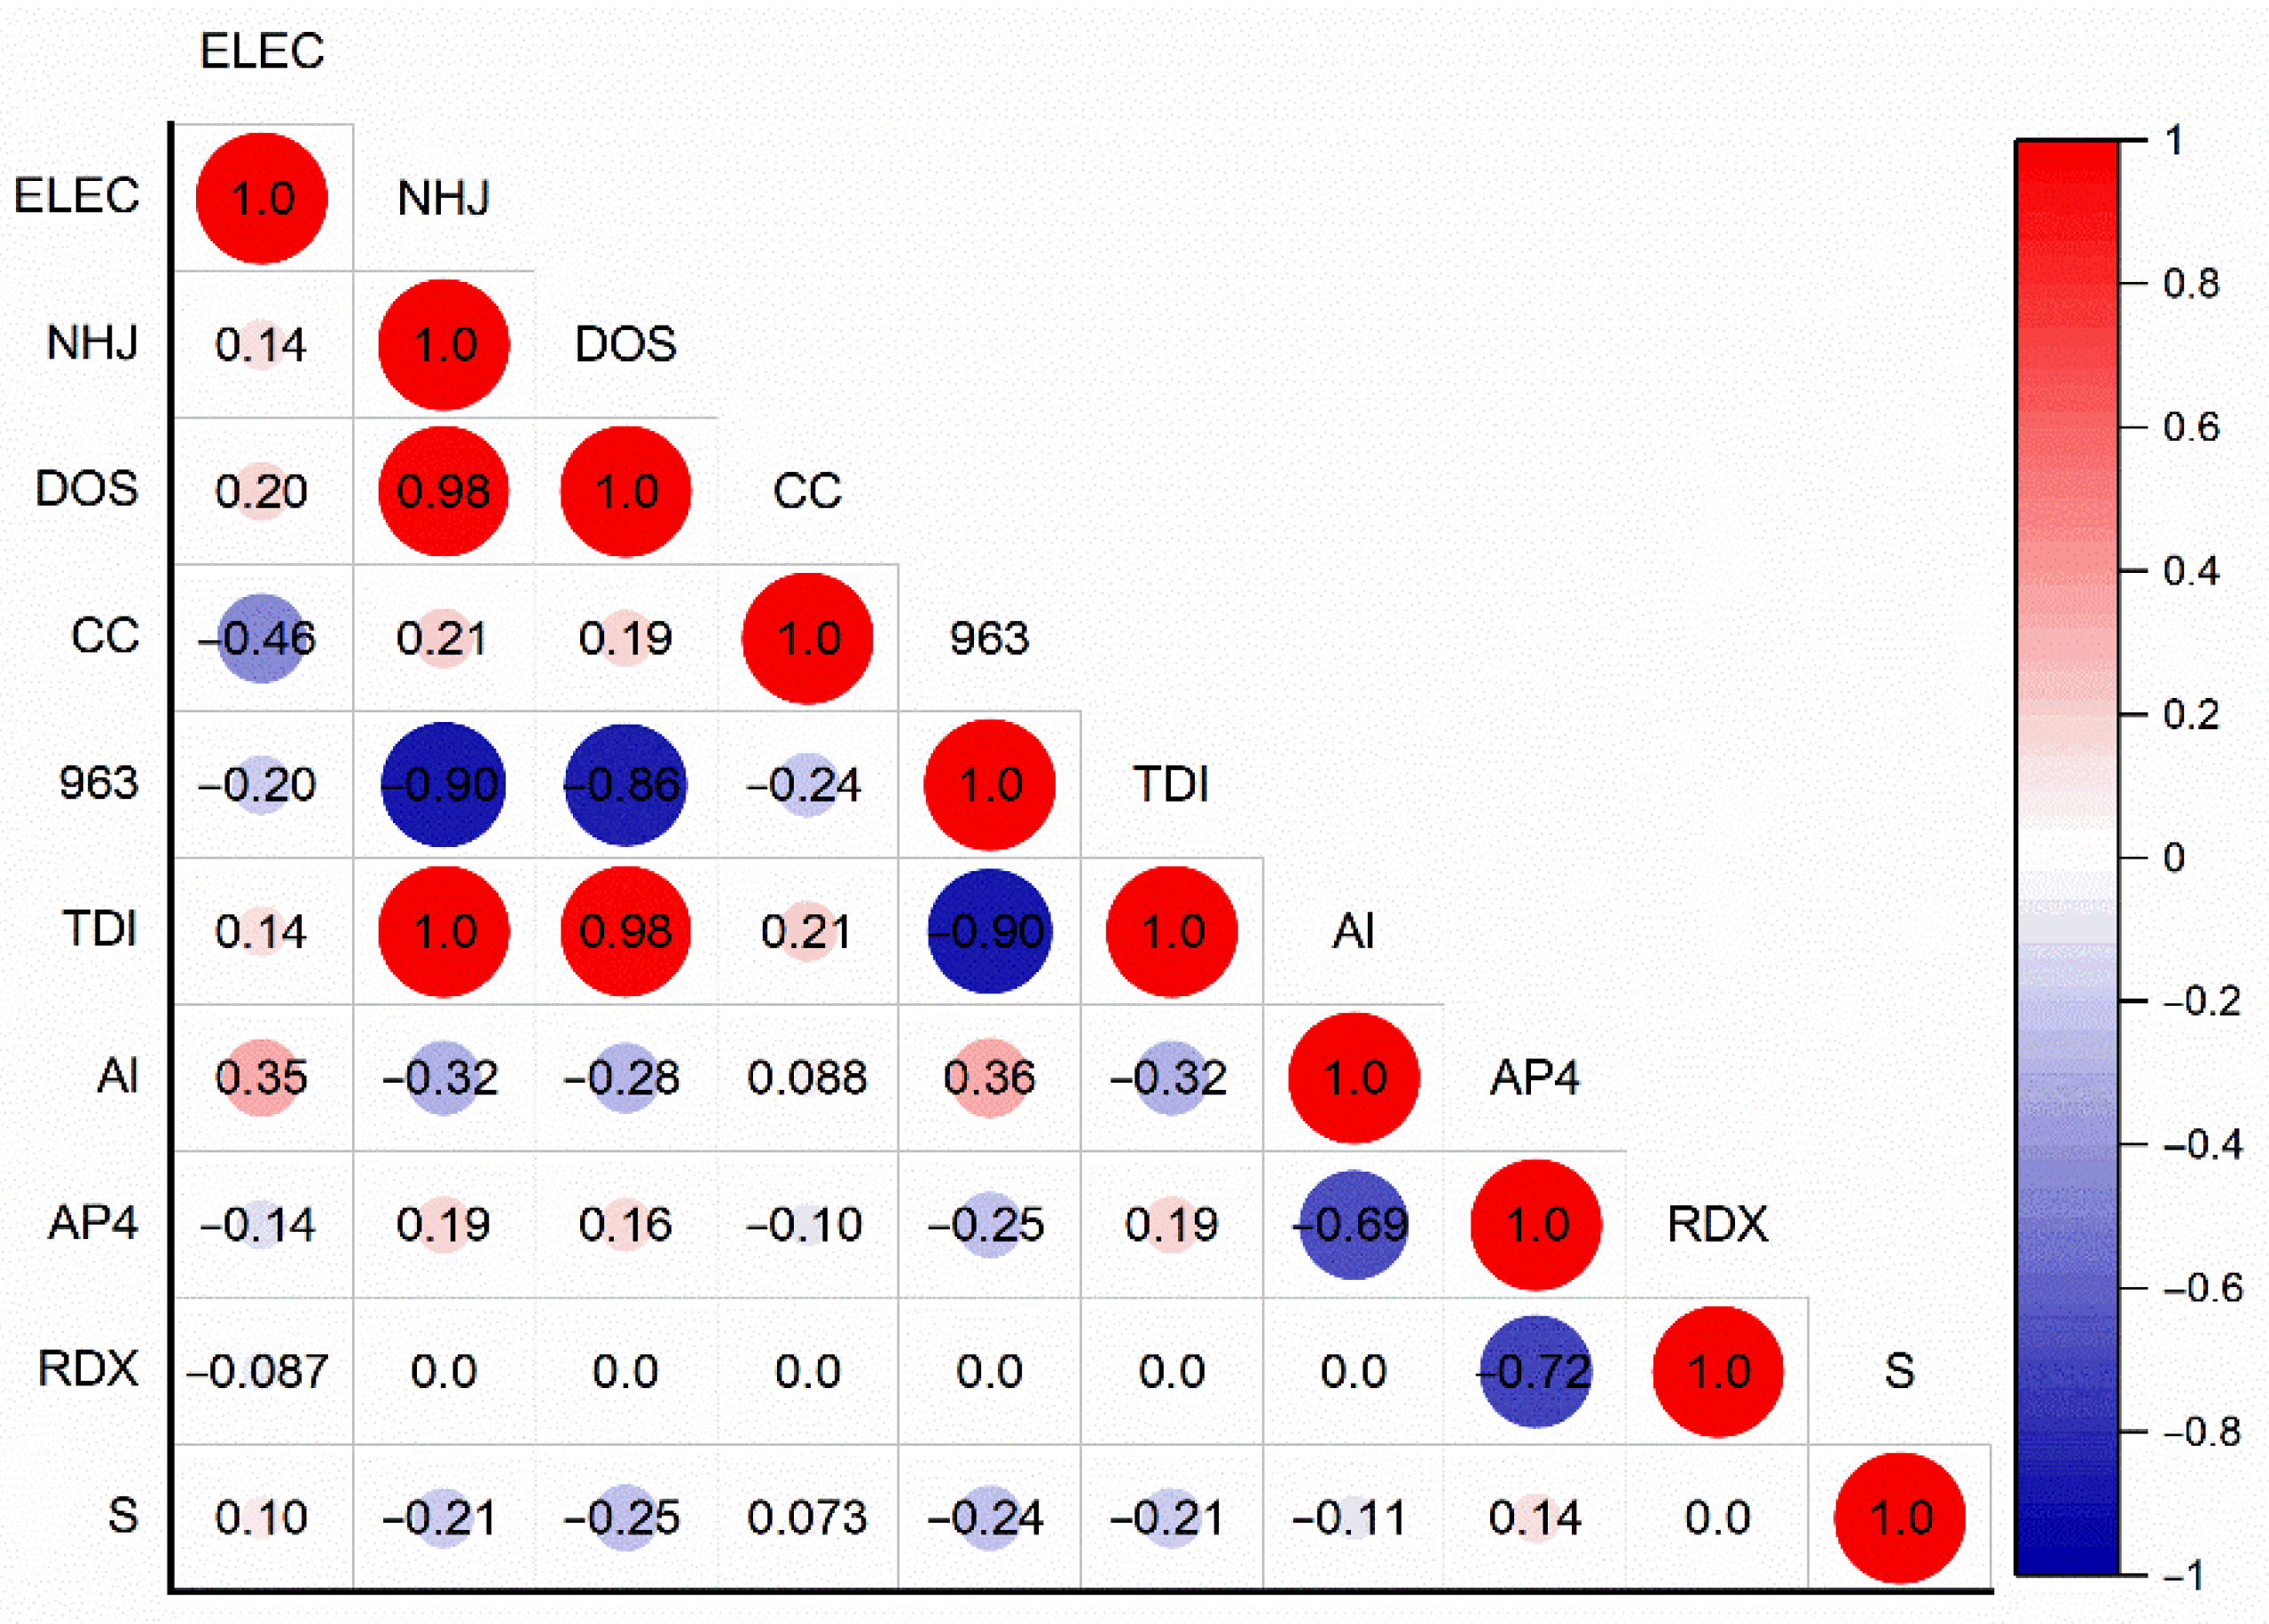
Figure 1. Pearson correlation coefficient graph of the dataset.
Aerospace 12 00622 g001
Figure 2. Comparison of experimental values and machine learning model predicted values for (a) RF model (b) GBDT model (c) ADA model (d) ET model (e) MLP model and (f) KNN model, respectively.
Aerospace 12 00622 g002
Figure 3. Residual of experimental values and machine learning predicted values for (a) RF model (b) GBDT model (c) ADA model (d) ET model (e) MLP model and (f) KNN model, respectively.
Aerospace 12 00622 g003
Figure 4. Feature important ranking of RF model obtained by (a) GINI method and (b) SHAP method.
Aerospace 12 00622 g004
Figure 5. Scatter plot of features with SHAP values of the RF model.
Aerospace 12 00622 g005
Table 1. Selected features and their abbreviations.
IngredientAbbreviation
HTPB adhesiveNHJ
PlasticizerDOS
CatalystCC
963
Curing agentTDI
Aluminum powderAl
RDXRDX
Solid contentS
Ammonium perchlorate 40–60 meshAP4
Table 2. Optimal hyperparameters for different machine learning models.
ModelHyperparametersHyperparameter SpaceBest Hyperparameters
RFmax_depth3, 4, 54
min_samples_leaf1, 22
min_samples_split2, 32
n_estimators50, 100, 200100
bootstrapTrue, FalseFALSE
GBDTlearning_rateuniform (0.01, 0.3)0.108
max_depth3, 4, 54
min_samples_split2, 3, 44
n_estimators50, 100, 20050
subsampleuniform (0.5, 0.4)0.8845
ADAlearning_rateuniform (0.01, 0.3)0.1952
n_estimators50, 100, 200100
ETbootstrapTrue, FalseFALSE
max_depth3, 4, 55
min_samples_leaf1, 21
min_samples_split2, 32
n_estimators50, 100, 200200
MLPactivationrelu, tanh, logisticrelu
hidden_layer_sizes50, 100100
learning_rateconstant, adaptiveconstant
solveradam, sgdadam
alphaloguniform (1 × 10⁻⁷, 1 × 10⁻²)9.6439 × 10⁻⁵
KNNalgorithmauto, ball_tree, kd_tree, brutebrute
n_neighbors3, 5, 73
weightsuniform, distancedistance
Table 3. Prediction accuracy of different machine learning models.
RFGBDTADAETMLPKNN
R20.96810.96730.96180.64380.34460.1257
MAE4.614.765.1914.6021.1225.22
RMSE5.665.736.1918.9025.6429.62
MAPE3.92%4.22%4.46%13.22%19.74%0.22%
MRes11.3612.7911.4936.4651.9449.09
Disclaimer/Publisher’s Note: The statements, opinions and data contained in all publications are solely those of the individual author(s) and contributor(s) and not of MDPI and/or the editor(s). MDPI and/or the editor(s) disclaim responsibility for any injury to people or property resulting from any ideas, methods, instructions or products referred to in the content.