1. Introduction
Since the 1990s, with the continuous updating of transmission mechanisms and material technology, the micro air vehicle has been developed at a high speed. Scholars have designed and optimized various bionic flapping-wing robotic structures by observing the flight modes of birds and insects [
1,
2]. Some scholars have designed a flapping-wing structure imitating dragonfly wings [
3,
4], which can effectively improve the aerodynamic lift and efficiency of bionic flapping wings and flapping rotors. Some scholars have established a three-dimensional flapping-wing asymmetric motion aerodynamic analysis model for the wing-flapping law during bird flight [
5]. Because of its good concealment and low noise, the flapping-wing robot has great prospects in the field of rescue investigation and in the civil field [
6].
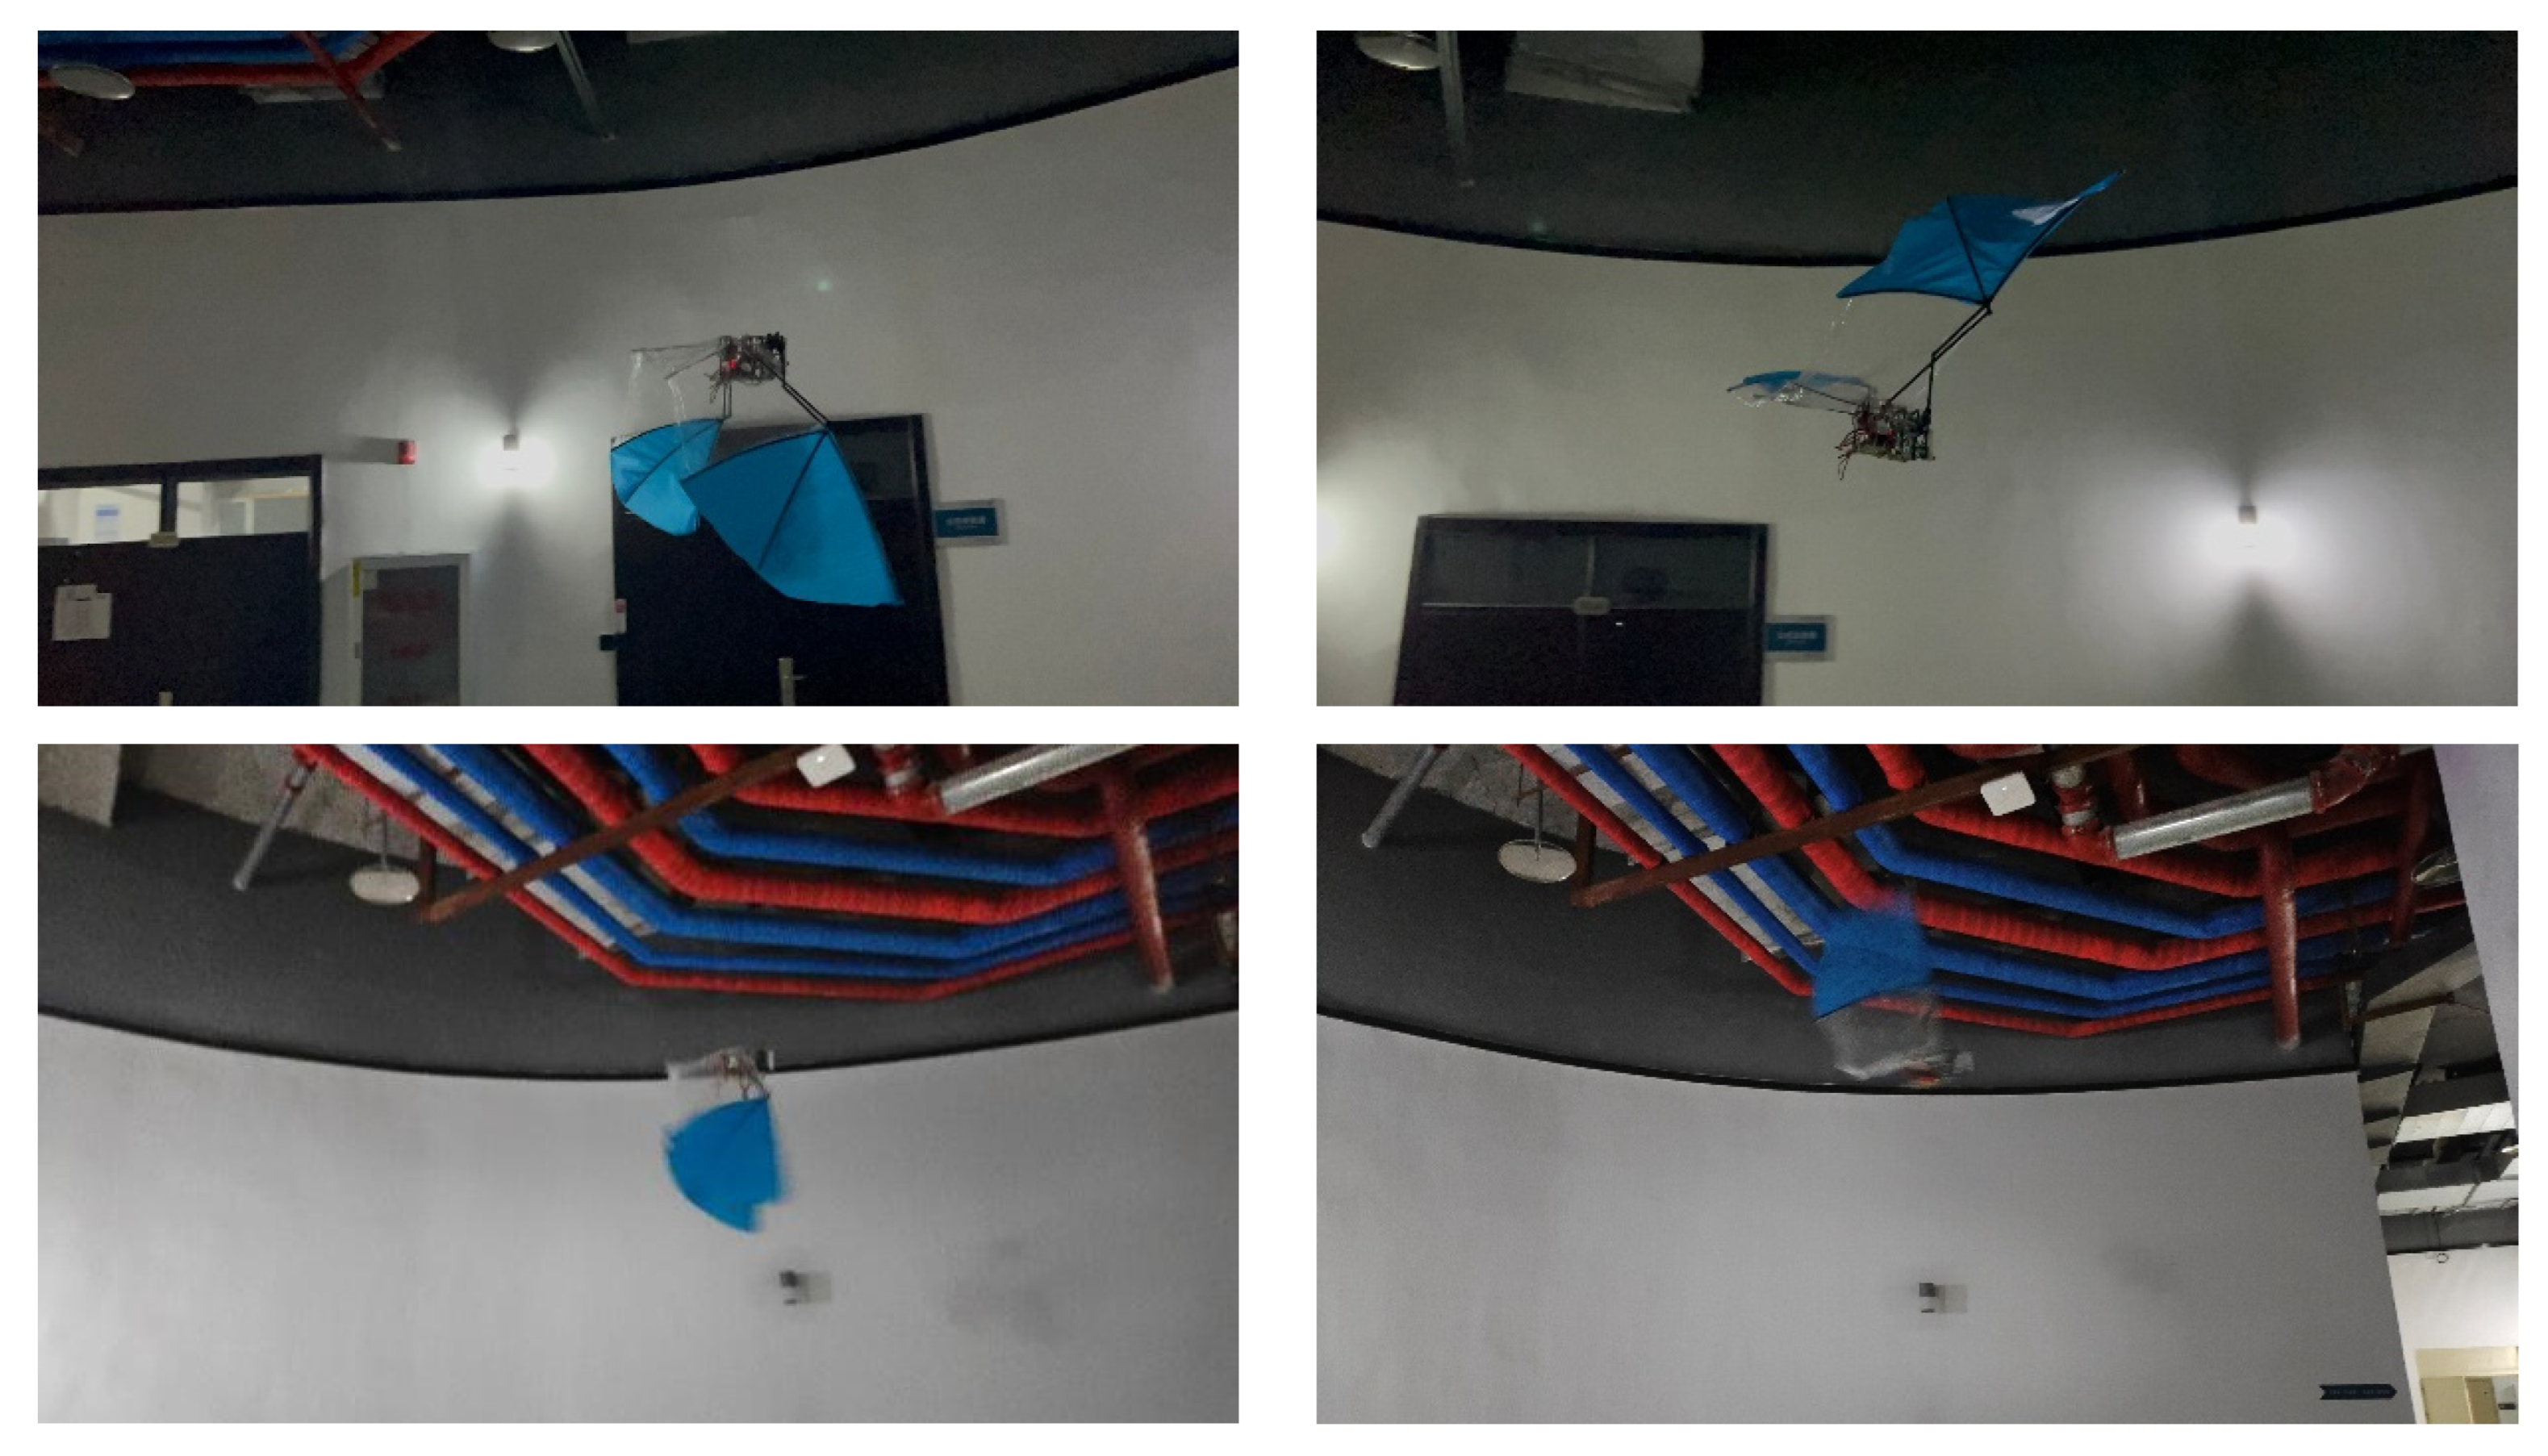
Among the flying creatures of nature, bats are unique ‘flying masters’. Their unique wing membrane curvature design is exquisite. When flapping, the wing membrane is fully stretched to maximize the windward area to obtain sufficient lift. To flap, the wing membrane folds rapidly first, which greatly reduces the wind resistance area [
7]. In low-speed flight, the lift generated by bats through the leading edge vortex is as high as 40% of the total lift, far exceeding other birds [
8]. Its superb flight skills and excellent aerodynamic characteristics have attracted global scholars to devote themselves to related research [
9]. Fan Wang et al. studied the characteristics of bat wing flexibility and established a model based on the bat’s flexible wings and aerodynamic theoretical analysis, which provided theoretical guidance for the study of bat-like design [
10]. Taiwan University has developed a 2-DOF flapping mechanism by studying the aerodynamic effects of wing membrane elasticity demonstrated by bats [
11]. Bat Bot (B2) [
12,
13] was developed by the University of Illinois and California Institute of Technology. The German company Festo publicly demonstrated the seagull flapping-wing aircraft for the first time [
14].
However, the complex and changeable flight modes and unique flexible structure of bats pose great challenges to experimental research. Wind-tunnel experiments play an important role in scientific research and engineering applications by simulating complex environments in real scenes. Nowadays, some researchers analyze the common bionic flapping-wing model through wind tunnel experiments [
15,
16,
17,
18]. In the past, the hollow experiments for flapping-wing robots mostly focused on the basic theoretical verification and performance test of ordinary flapping-wing robots. There are obvious deficiencies in restoring the complex flight scene of bats, and a systematic, comprehensive wind tunnel experiment system that meets the actual flight needs of bat-like robots has not yet been formed.
3. Construction of Flapping-Wing Wind Tunnel Experimental Platform
The wind tunnel experiment needs to have the theoretical basis of the similarity principle, which requires that the wind tunnel flow field and the real flow field meet the similarity criterion, that is, it is necessary to meet the condition that all the physical quantities of the wind tunnel flow field and the real flow field near the prototype maintain a certain proportion at the corresponding point [
21]. Therefore, based on the above standards, in order to ensure that the wind tunnel flow field is similar to the real flight flow field, it is necessary to meet the geometric similarity, motion similarity, and flow similarity at the same time [
22].
In the wind tunnel experiment of the flapping-wing aircraft, geometric similarity and motion similarity are the basis to ensure the similarity of the flow field. The geometric similarity requires the model and the real aircraft to be scaled in a fixed proportion, such as wingspan, chord length, etc., to maintain a certain proportion to ensure that the contour is consistent. Motion similarity requires the model to be proportional to the velocity field and acceleration field at the corresponding point, such that the beat frequency, amplitude, and other parameters are proportionally adjusted. The connection between the two needs to be realized by the Reynolds number and reduced frequency. The Reynolds number is related to geometry and flow velocity, and reduced frequency is related to geometry and beat frequency. Through them, the dynamic characteristics of the flow field of the model in the wind tunnel are similar to the real flight flow field, thus laying a foundation for the accuracy of the experiment.
The reduced frequency can be obtained by the following formula:
where
is the average chord length of wing membrane (m);
is the average beat frequency (Hz).
According to the bionics formula, the average beat frequency
can be obtained as 6.0274 Hz [
23]. Although the Reynolds numbers of different flying organisms are different, they are between 104 and 106 [
24]. According to the structural parameters and motion parameters calculated by the bionic formula, the Reynolds number of the bat-like flapping-wing aircraft is 1.253 × 10
5 and the reduction frequency is about 0.379. Compared with the three-dimensional unsteady lift line theory proposed by Phlips [
25], it is found that when the reduction frequency is less than 0.5 and the flapping amplitude is less than or equal to 70°, the influence of unsteady flow field on the change in lift coefficient is less than 2%. At this time, the unsteady flow can be regarded as a quasi-steady flow.
For the flapping-wing aircraft studied in this paper, geometric similarity and motion similarity are the basis, which is to ensure consistency. It is possible to choose to retain important parameters and ignore some secondary parameters. For example, the flight speed of the flapping-wing aircraft studied in this paper is 5 m/s, and the compressibility of the gas is completely negligible. Therefore, the influence of the Mach number can also be ignored; the flapping-wing aircraft designed in this paper has a mass of 250 g and a gravity of about 2.5 N, so the influence of gravity is also very small. Therefore, the influence of the Froude number can be ignored. The Prandtl number of the air in the wind tunnel is similar to the Prandtl number in the atmosphere, so the influence of the Prandtl number can also be ignored for conventional low-speed wind tunnel tests. However, for low-speed moving objects such as the flapping-wing aircraft, the influence of viscous force is greater than that of inertial force, so the influence of the Reynolds number cannot be ignored. We control the Reynolds number Re at [5 × 10⁴, 5 × 10⁵] and the Strouhal number St at [0.2, 0.6] by controlling the flow velocity and the beat frequency. Due to the reciprocating flapping of the wings, the flow field of the flapping-wing aircraft is generally an unsteady flow field, so the influence of the Strouhal number cannot be ignored. In summary, we ensures the validity of the wind tunnel by ensuring the flow similarity of the geometric similarity and motion similarity of the prototype.
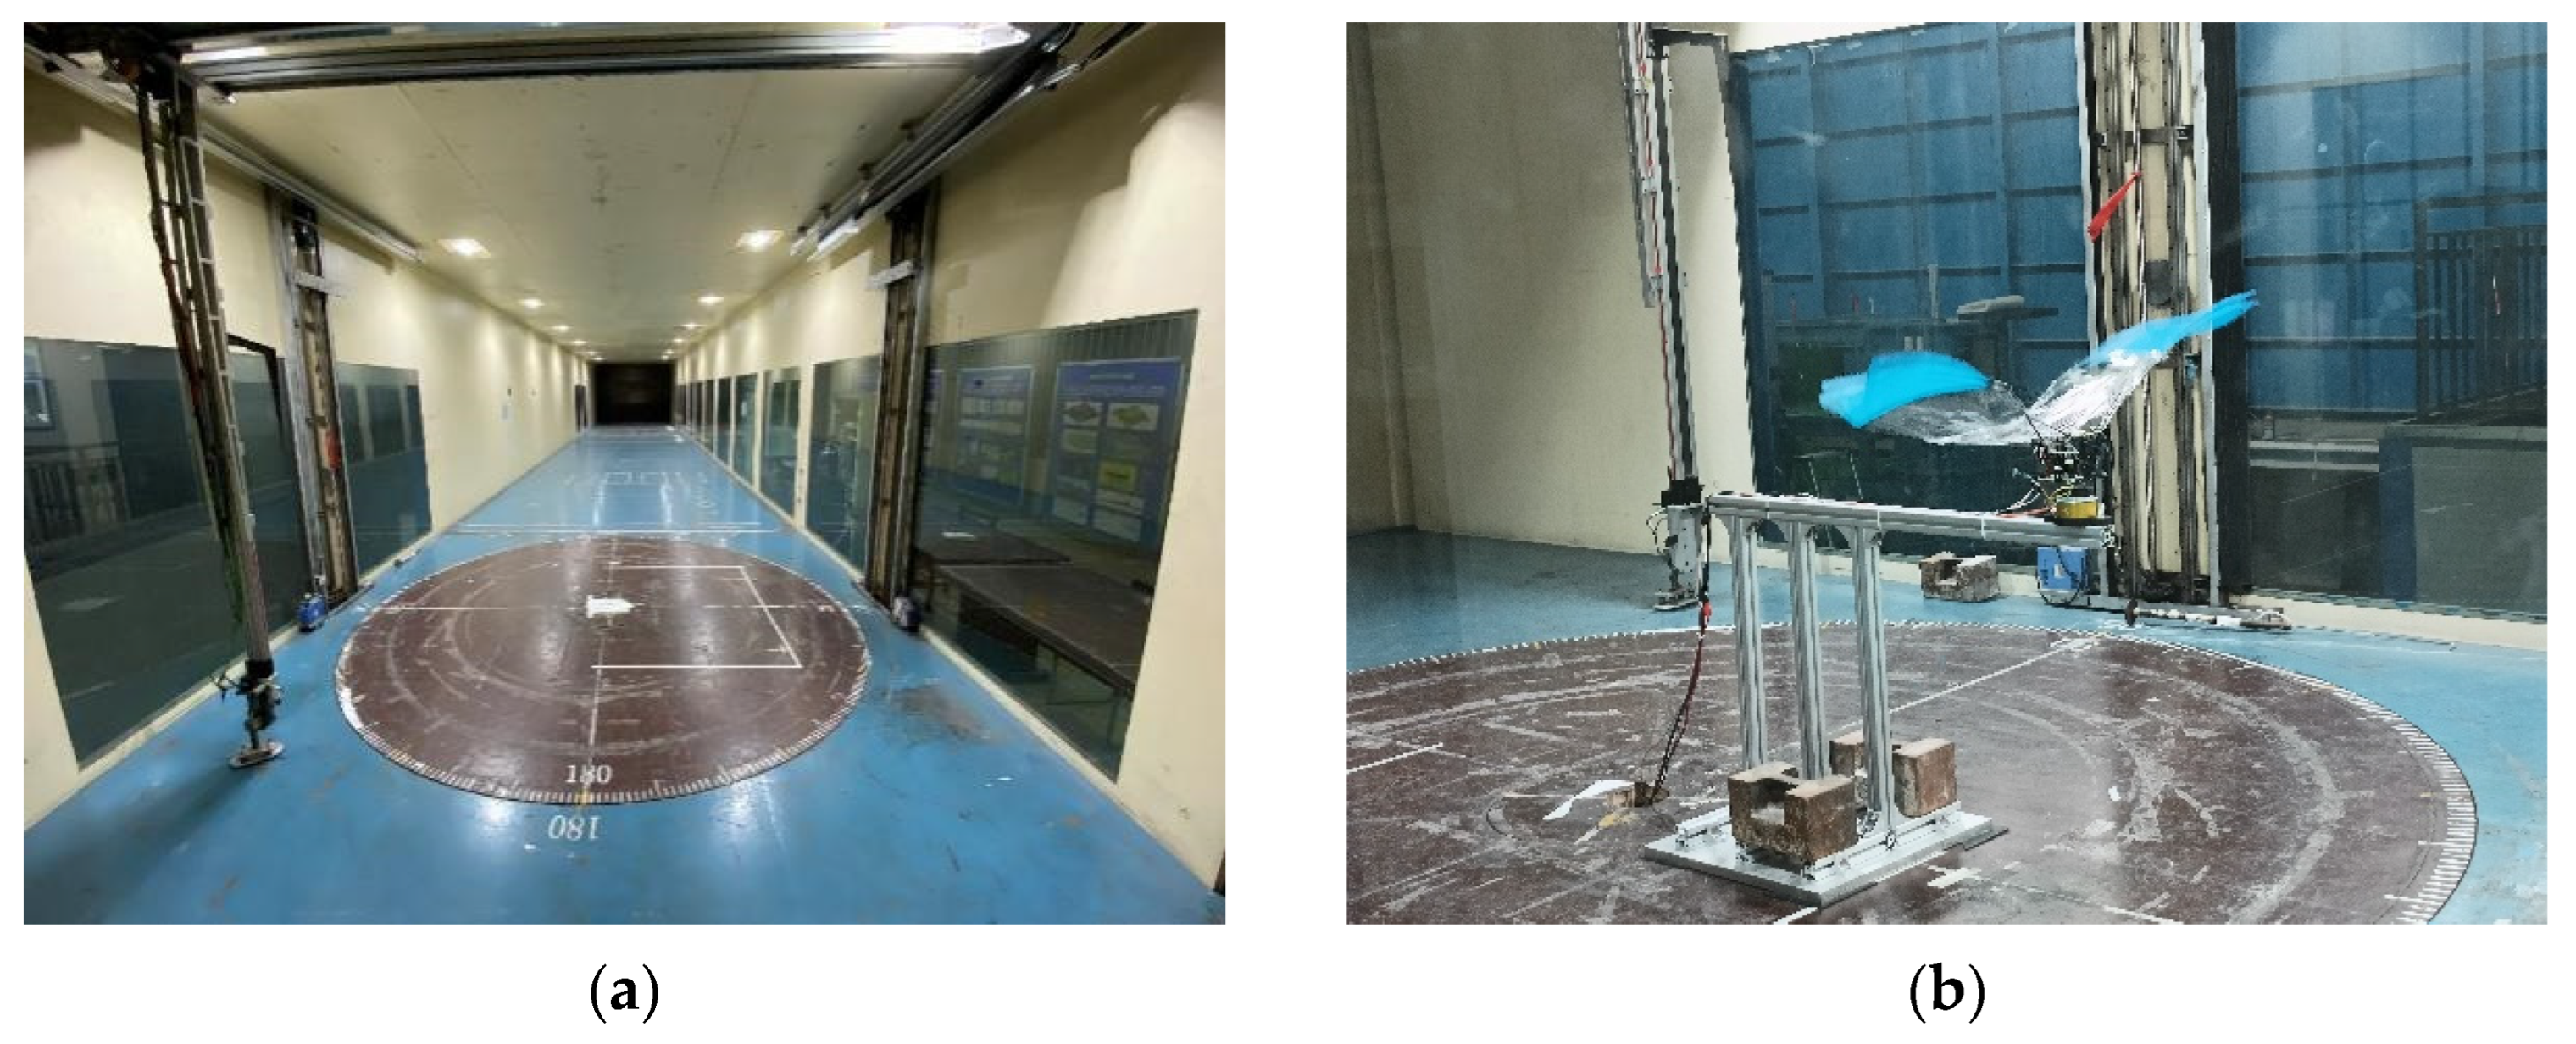
The wind tunnel equipment used in this paper is a single reflux closed double experimental section wind tunnel (turbulence degree is 1%, velocity range is 2–6 m/s, blockage ratio is 0.7%, and blockage effect can be ignored), as shown in
Figure 4a. The size of the test section is 4 m × 3 m × 25 m. The device for the experiment in the wind tunnel includes the following: prototype model, six-component force sensor, and fixed bracket. The top of the sensor is connected to the bottom of the prototype, and the bottom is fixed at the front end of the fixed bracket, as shown in
Figure 4b.
Among them, compared with the traditional aircraft, the aerodynamic force of the flapping-wing aircraft is several orders of magnitude smaller. Therefore, the sensor is required to have a fast response speed, high precision, and high sensitivity and test resolution. In this paper, the six-component force sensor of FC6D72 (Shanghai Naichuang Testing, Shanghai, China) is finally selected. The sensor has a range of 100 N in the direction of lift (the prototype is subjected to aerodynamic force to generate vertical upward force), a range of 50 N in the direction of thrust (the prototype is subjected to aerodynamic force to generate horizontal forward force), and a torsional moment in the spanwise direction (here it is used to measure the pitching moment; the pitching moment is the torsional moment along the wing direction) of 2.5 Nm. The resolution is between 0.01–0.03 N, and the nominal accuracy is 1% FS, which meets the measurement standard.
The bracket is used to ensure the stability of the prototype in the wind tunnel, so that it can maintain a fixed angle of attack, and can also avoid the shaking of the bracket caused by the prototype’s flapping. Therefore, the bracket shown in the above diagram is designed. The bracket adopts a 4040 aluminum profile and is fixed by an angle code connection, which can ensure the stability of the overall structure. At the same time, in order to avoid the influence of the fixed bracket on the wind field, the windward area of the bracket is reduced and the prototype is fixed in the front of the bracket.
4. Wind Tunnel Test Results and Analysis
Considering the influence of factors such as the unstable power supply voltage of the sensor, the static working point of the sensor is changed, and the zero drift experiment of the sensor is carried out. It is found that the sensor is almost stable after being energized for more than 1 h, and the zero drift of force and torque is less than 0.1% of the range. Therefore, in order to ensure the accuracy of the experimental results, at least 1 h after the sensor is energized, the measurement experiment is started [
Appendix A.2].
4.1. Repeatability and Stability Analysis Experiments
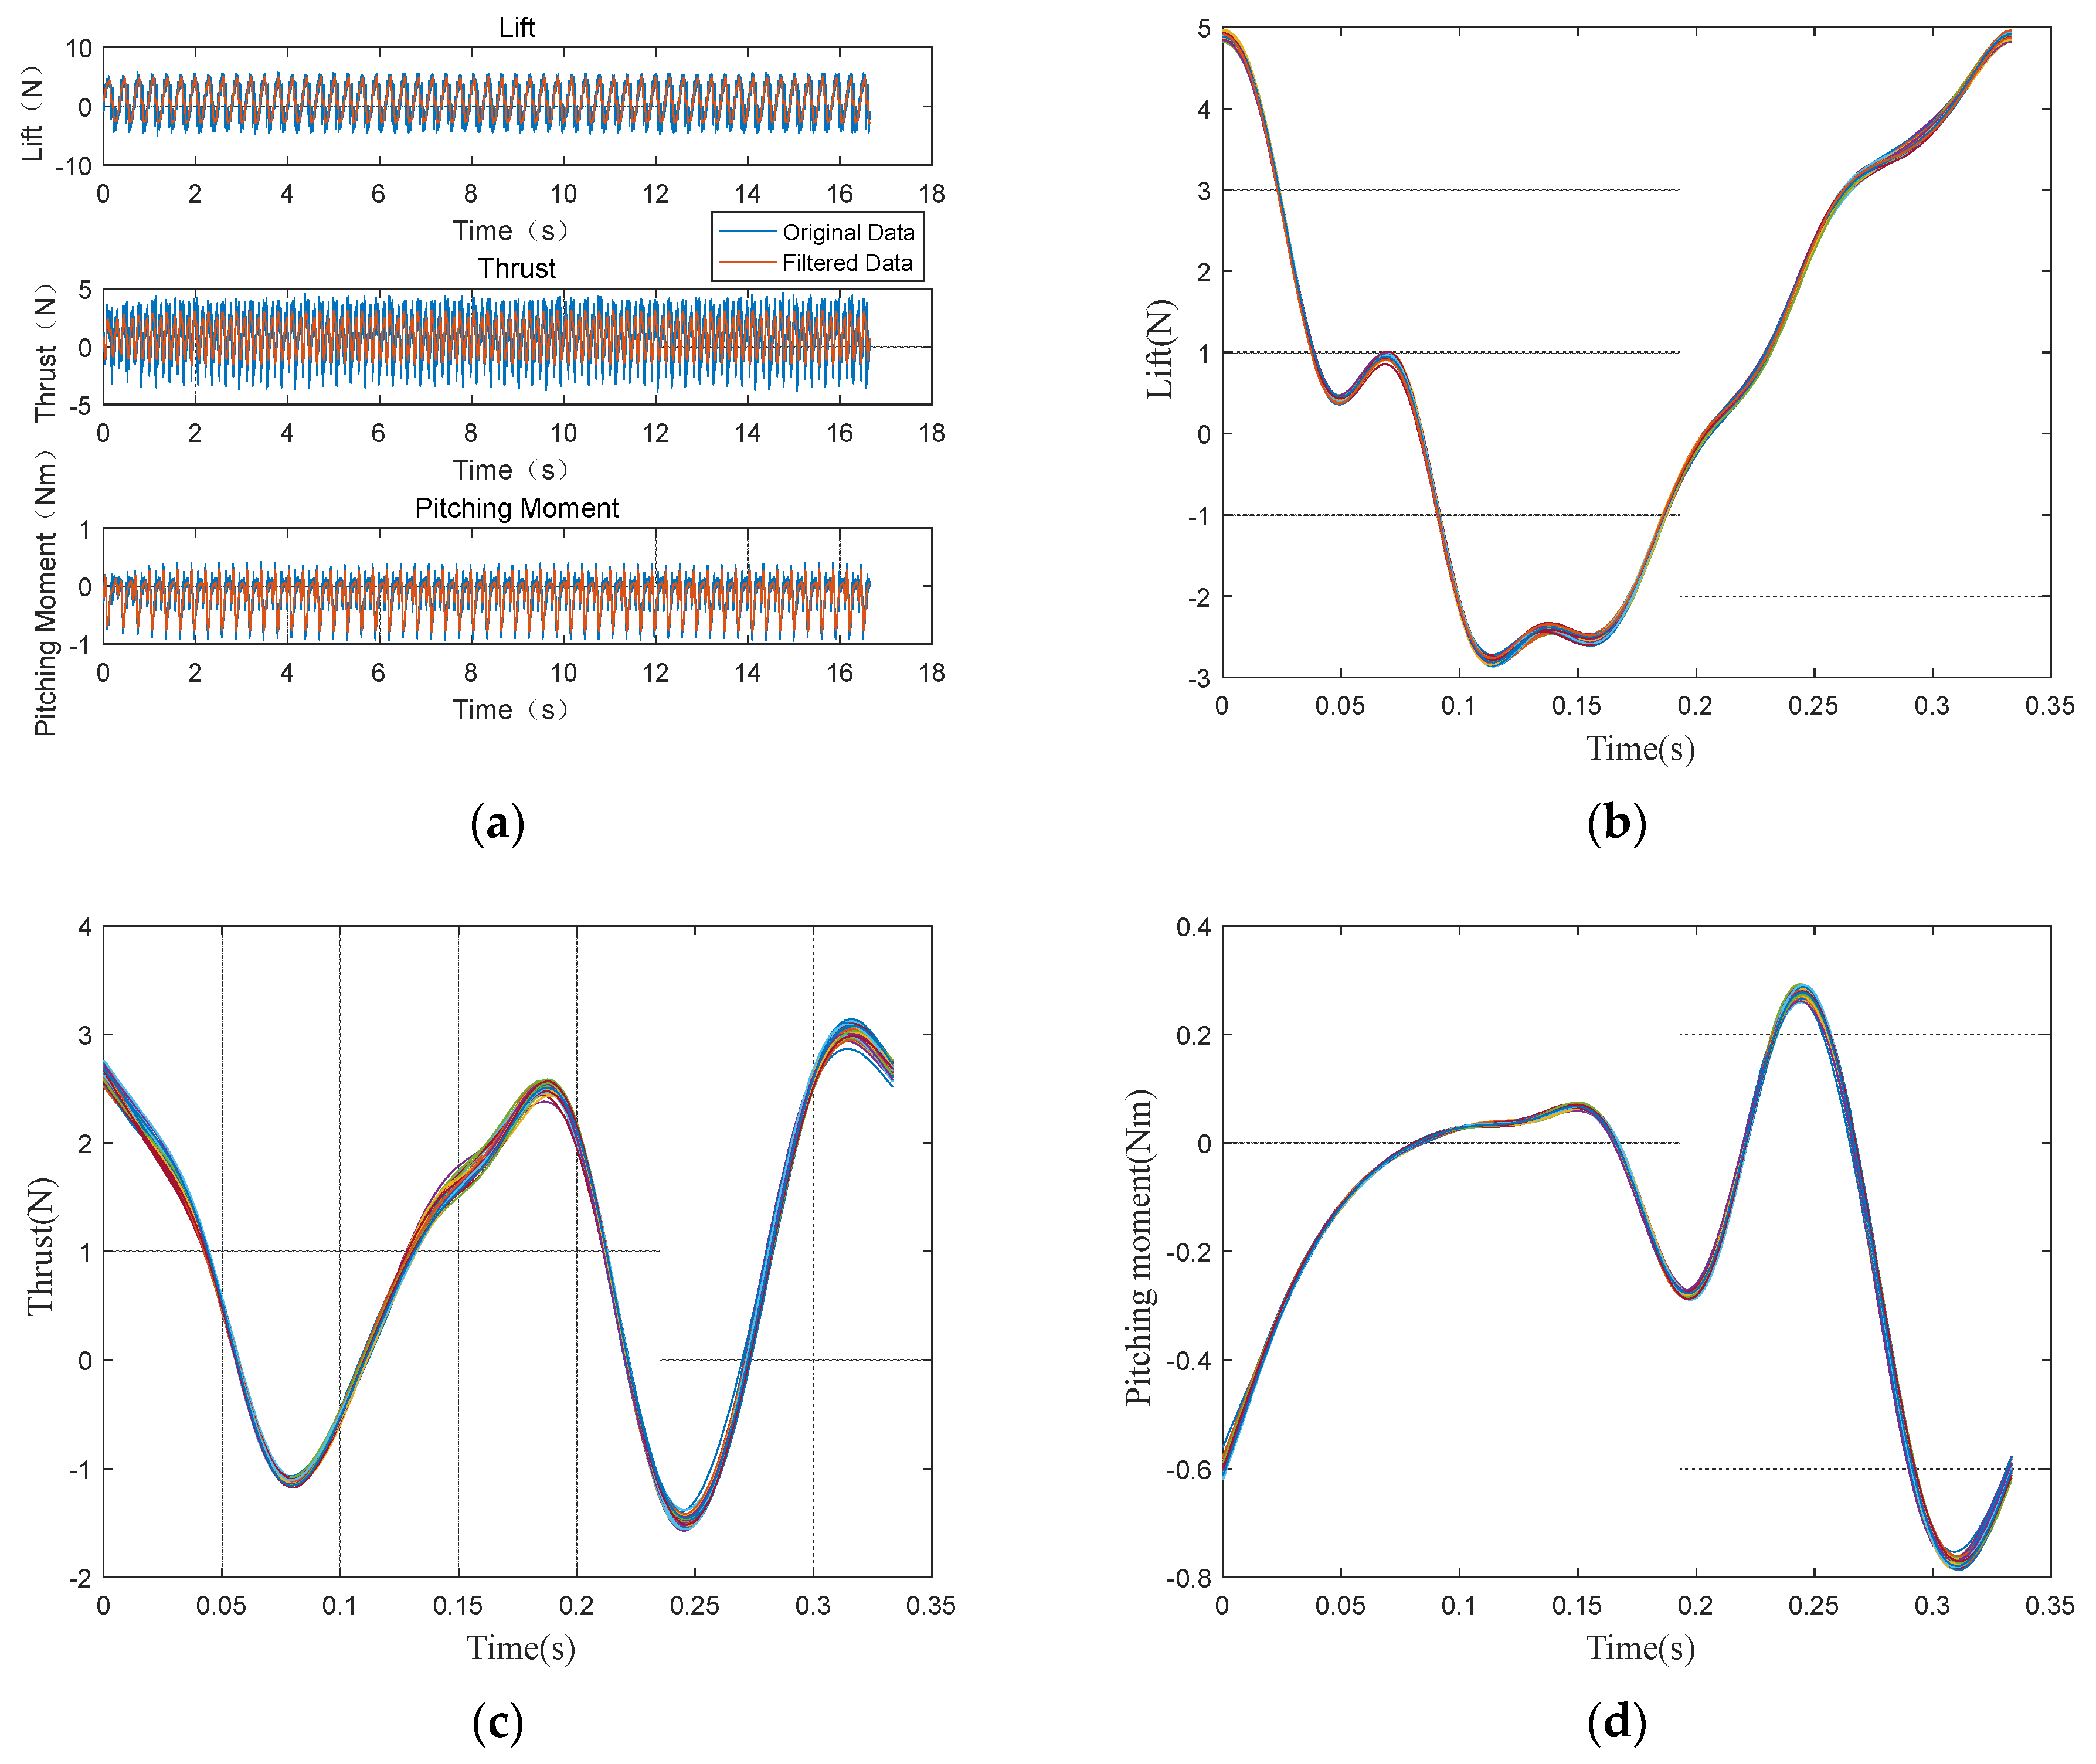
In order to verify whether the wing hand and the wing membrane can maintain a continuous and stable motion state and produce a constant aerodynamic force in a continuous number of motion cycles, it is necessary to analyze the repeatability and stability of the motion.
The specific measurement experiment scheme is as follows: the prototype is connected to the sensor and fixed on the fixed platform, the angle of attack of the prototype is adjusted to 0°, the prototype is placed in the wind tunnel, the zero point of the sensor is reset, the motor is energized, and the wind speed is set to 5 m/s. After the wind speed is stable, the flapping frequency of the wing hand is controlled to be 3 Hz, and the sensor data of 56 motion cycles are continuously collected to ensure the accuracy of the results. The data of 3 cycles at the beginning and end stages are removed, and the data changes of 50 cycles in the middle are analyzed, as shown in
Figure 5. It can be clearly seen from the figure that the difference in aerodynamic curves in multiple consecutive cycles is small, and the variance of the curves is within 2%, which proves that the repeatability and stability of the experiment are good.
4.2. Analysis of Measurement Deviation Under Different Parameters of Wingless Model
In the actual measurement process, due to the vibration of the fuselage and the influence of the flow field on the fuselage, there will be a certain deviation in the measurement results of the aerodynamic force. When the deviation accumulation is large, it will affect the accuracy of the measurement and the analysis of the aerodynamic law. Therefore, it is necessary to analyze the influence of fuselage factors on the experimental results.
The measurement deviation of the fuselage under different working conditions is studied. In order to match the measurement results of the actual prototype, the same experiment is carried out on the fuselage and the complete prototype. The aerodynamic data of the complete prototype and the aerodynamic data of the fuselage under the same working conditions are obtained. The difference between the two is the actual aerodynamic data of the wing membrane.
4.2.1. Measurement Deviation Experiments of Fuselage Under Different Beat Frequencies
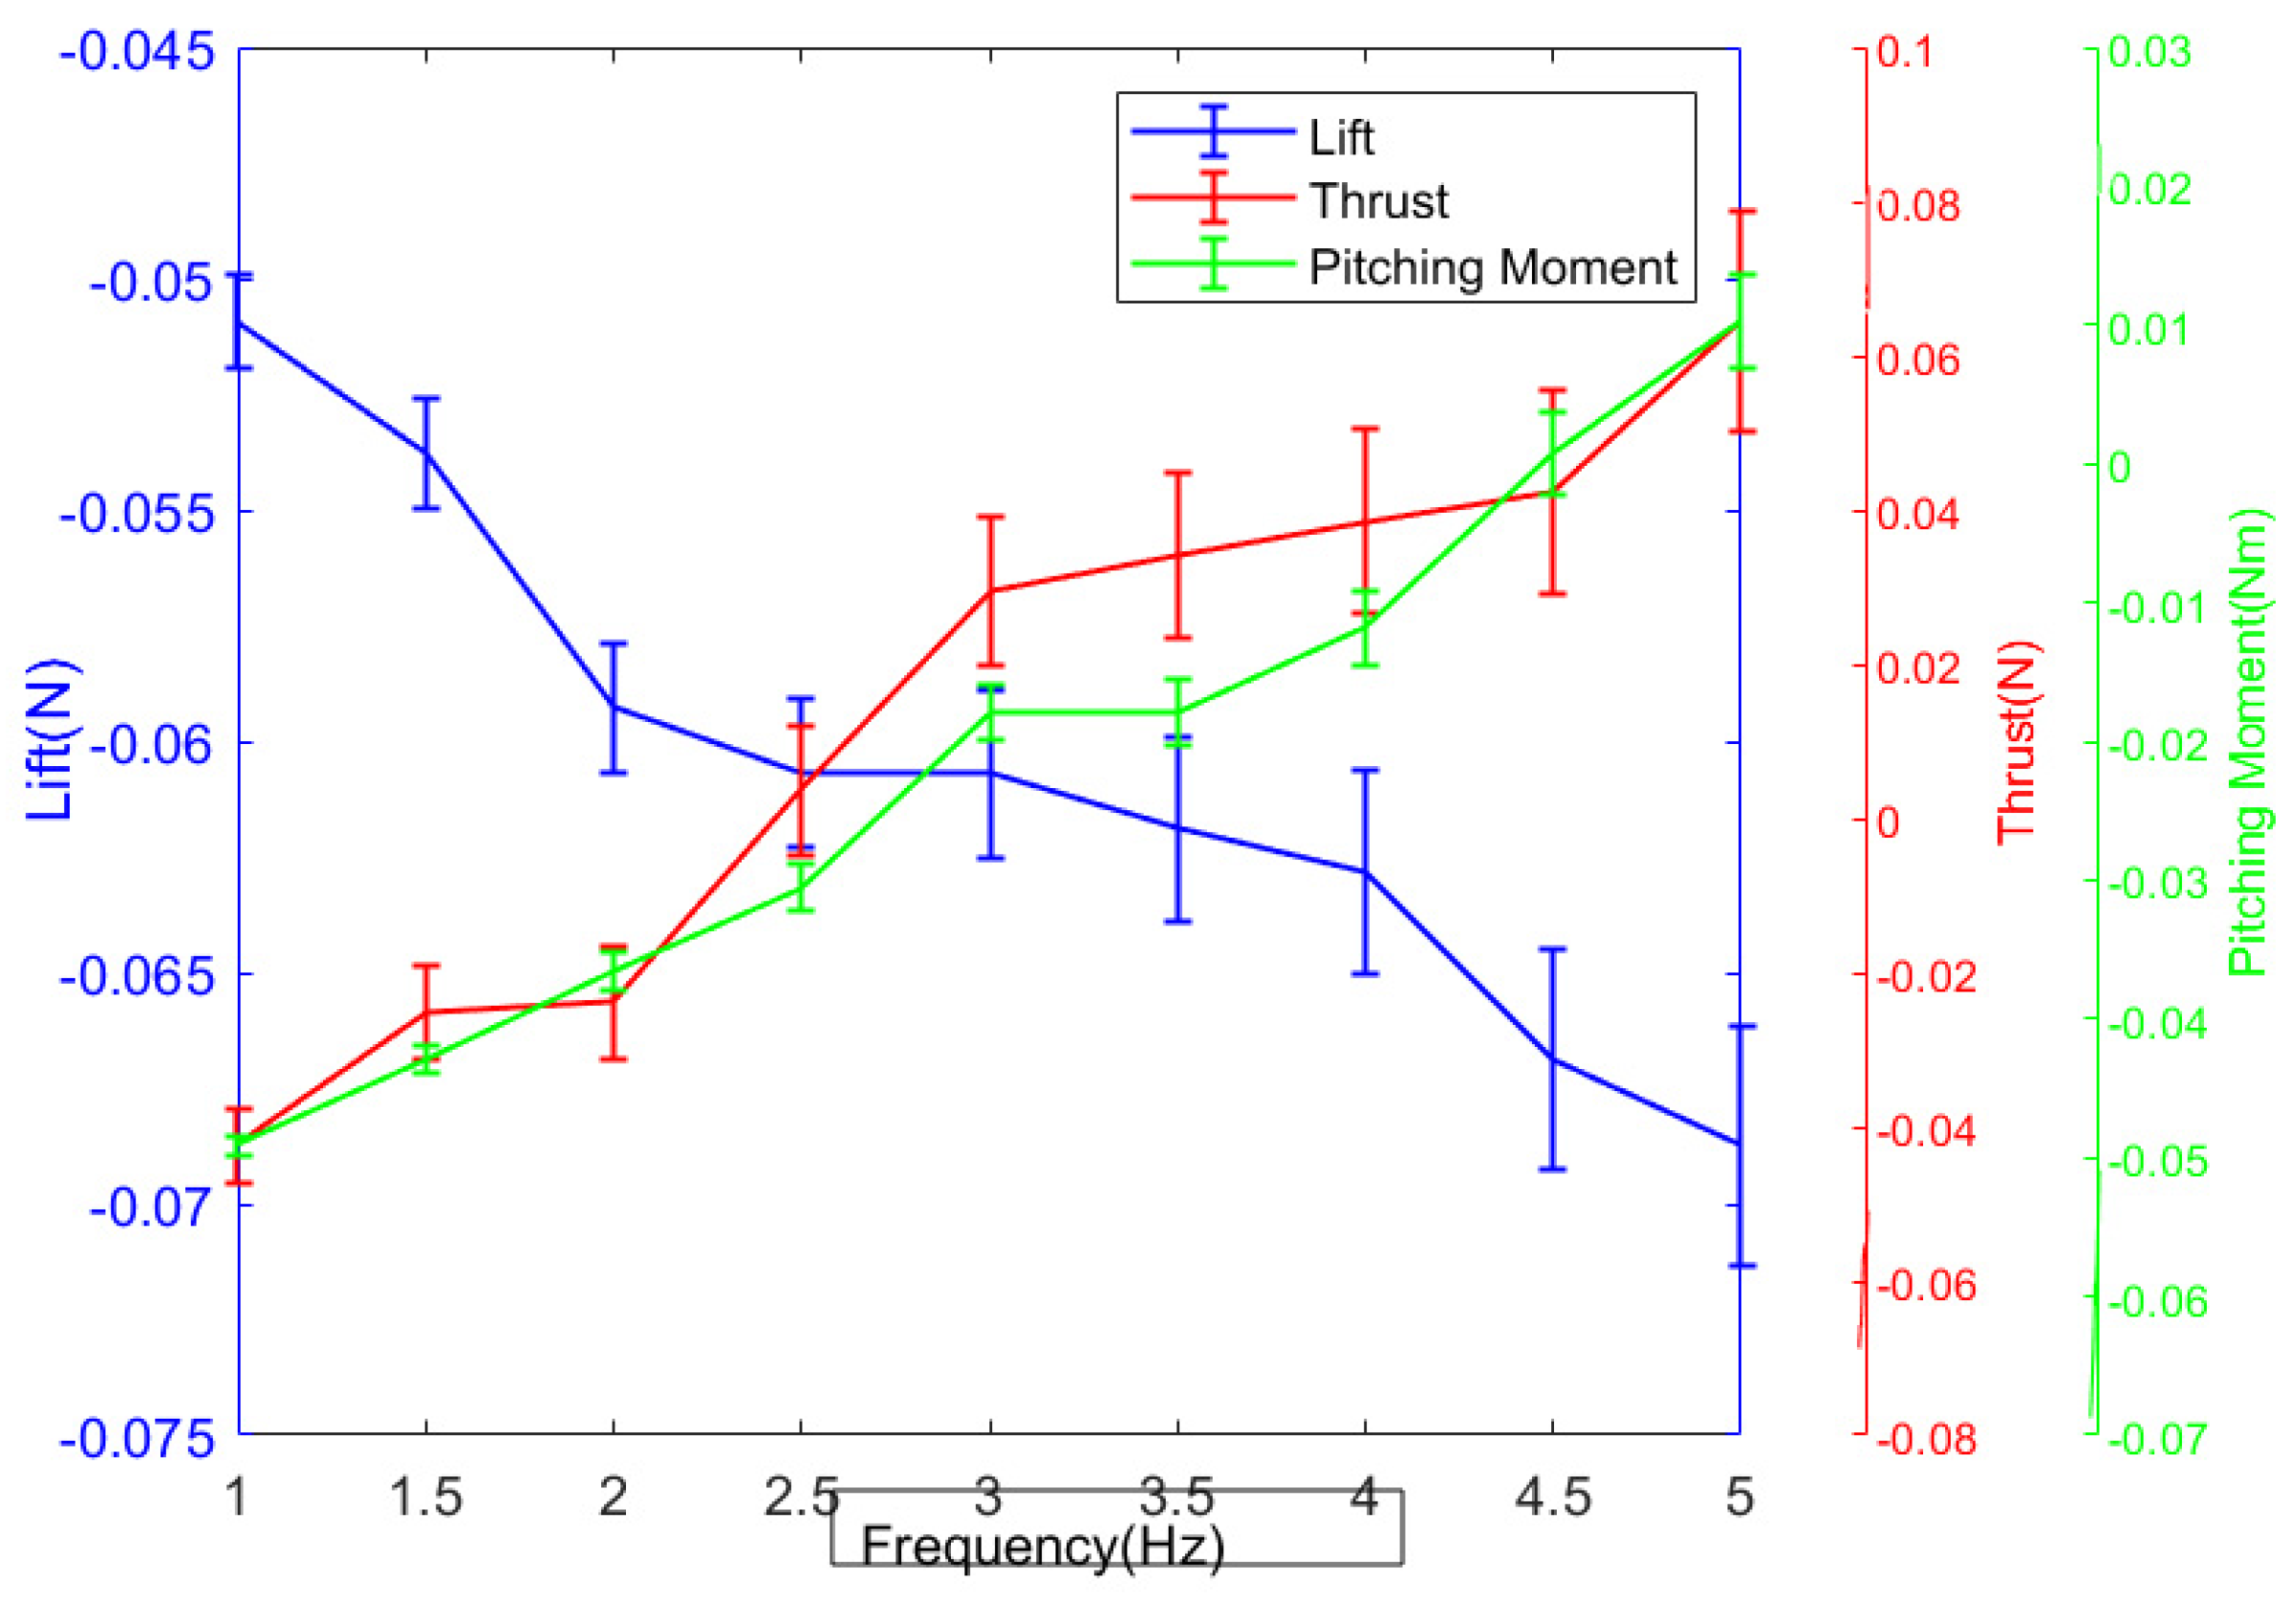
Firstly, the measurement deviation experiment of the fuselage under different flapping frequencies is studied. The wingless fuselage is connected to the sensor and fixed on the platform, so that the angle of attack of the prototype is 0°, and it is placed in the wind tunnel. The zero point of the sensor is reset, the output frequency of the gearbox is controlled to be 0 Hz, and the wind speed is set to 5 m/s. After the wind speed is stable, the output frequency of the gearbox is controlled to be 1 Hz, 1.5 Hz, 2 Hz, 2.5 Hz, 3 Hz, 3.5 Hz, 4 Hz, 4.5 Hz, 5 Hz; the data of the sensor are recorded, and low-pass filtering on the data is performed, as shown in
Figure 6.
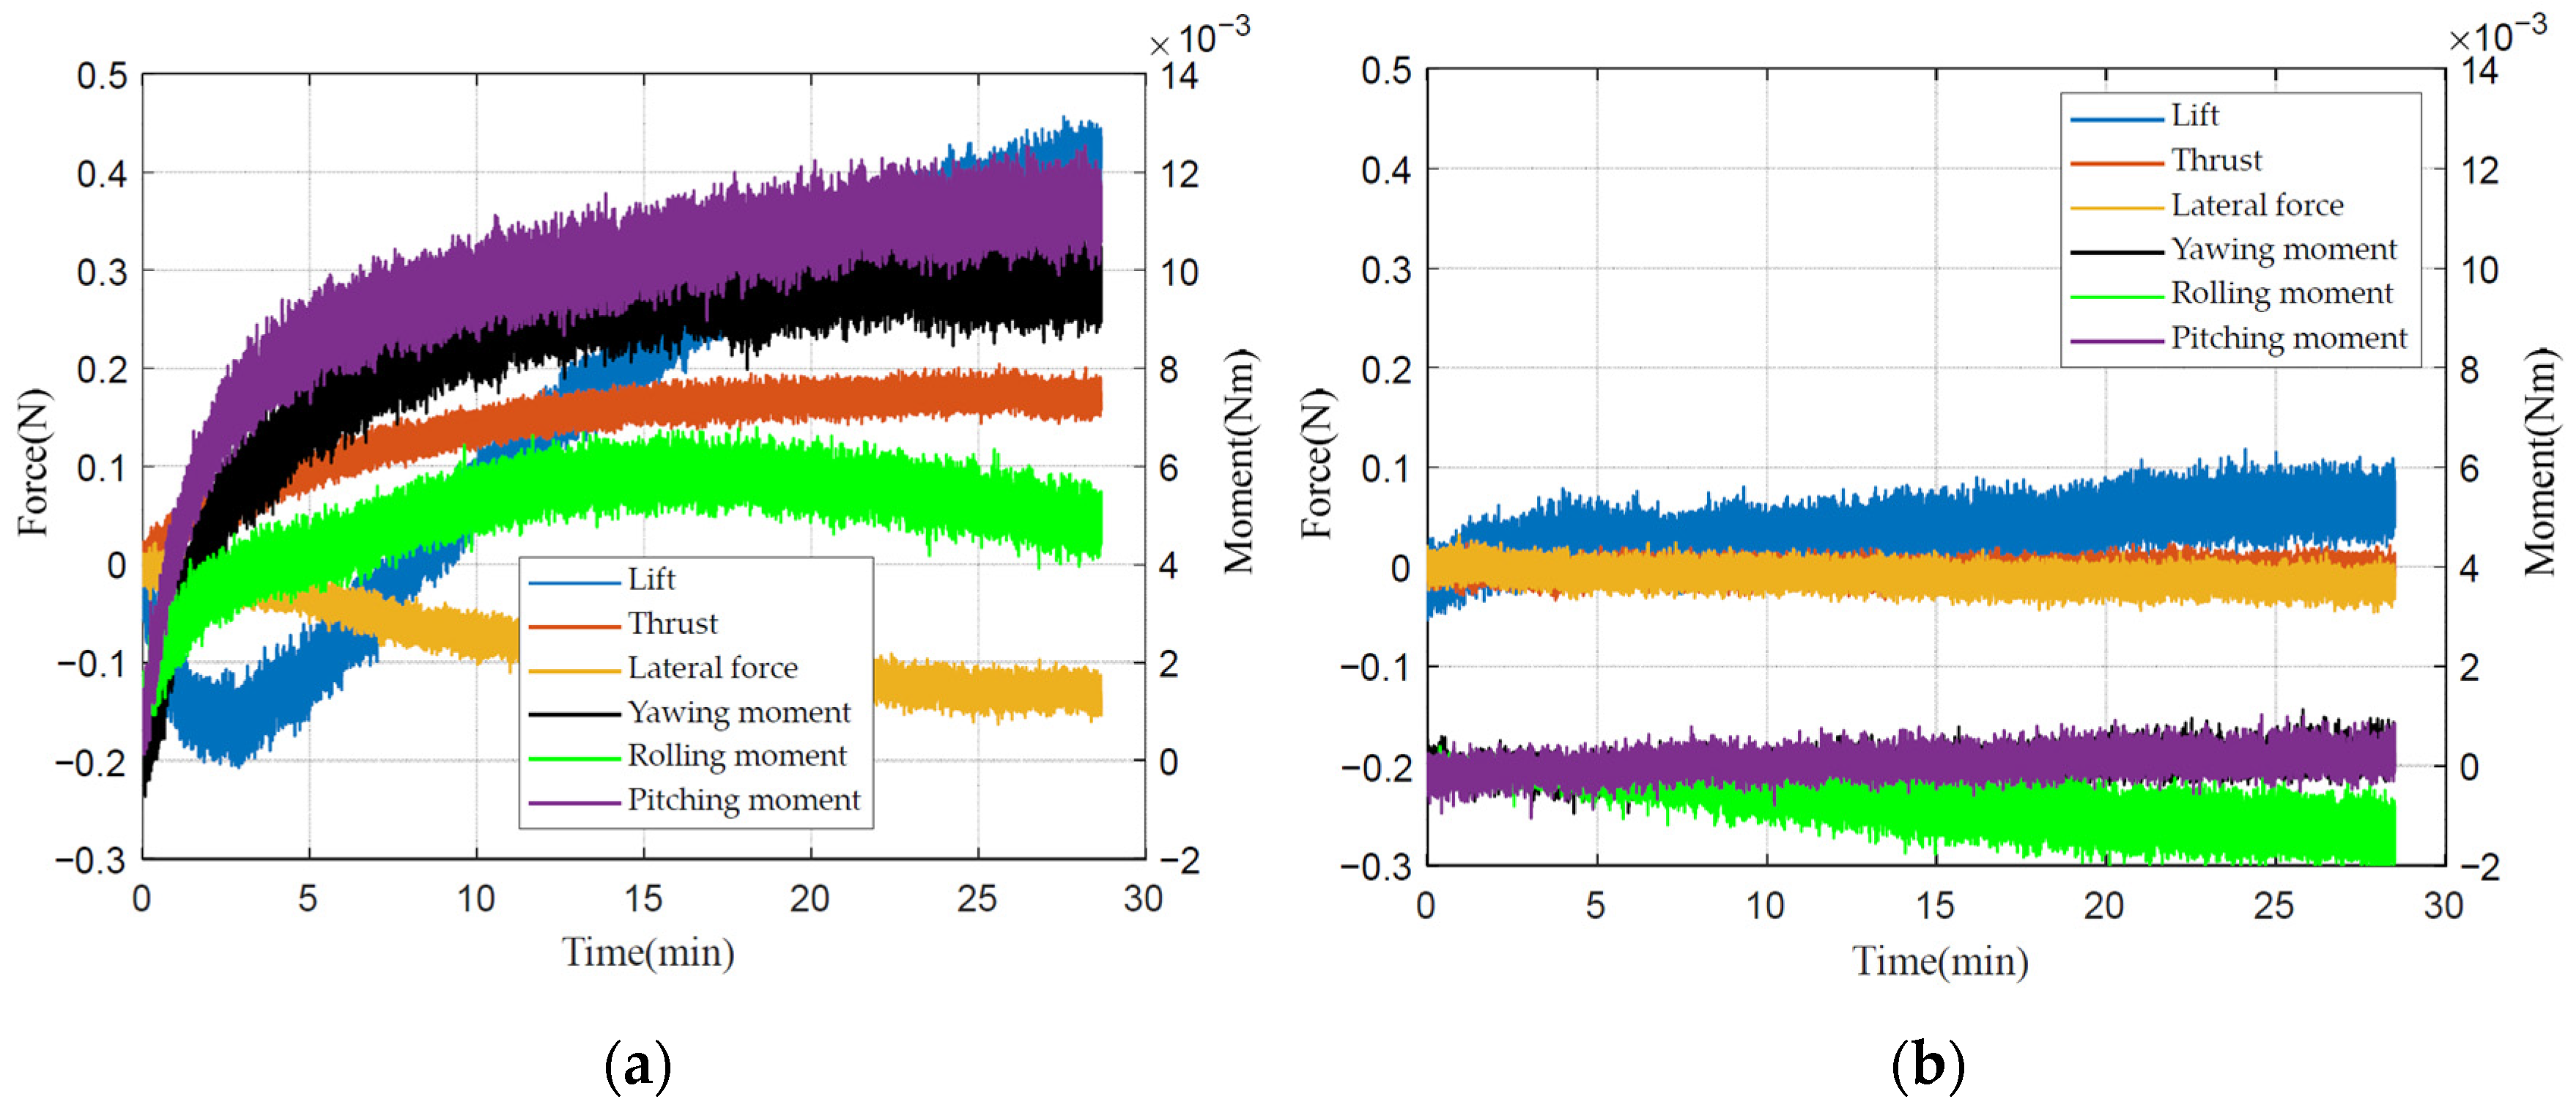
It can be clearly seen from the figure that the mean value of the lift decreases with the increase in the beat frequency, and the thrust and the pitch moment increase with the increase in the beat frequency. However, a more abnormal phenomenon is found from the curve, that is, the thrust is positive. The reasons for this abnormal phenomenon are as follows: First, the wind speed below the prototype is greater than the wind speed above, so the fuselage is subjected to the downward force of the vertical fuselage, which also explains the reason why the lift is negative. At the same time, due to the fixed position of the prototype, it will cause a large pitching moment, which will cause the tail of the fuselage to tilt downward, resulting in forward thrust; secondly, the machining error may also lead to a certain angle of attack of the prototype itself, resulting in forward thrust; finally, the zero drift and crosstalk of the sensor may also cause the thrust to be positive. From the numerical analysis, the deviation lift generated by the fuselage can reach −0.0687 N (about 7 g mass), the deviation thrust can reach 0.078 N, and the deviation pitch moment can reach 0.0217 Nm. These deviations are large, which will have a non-negligible impact on the final measurement results. Therefore, it also shows the necessity of measuring the aerodynamic deviation generated by the fuselage.
4.2.2. Measurement Deviation Experiment of Fuselage Under Different Wind Speeds
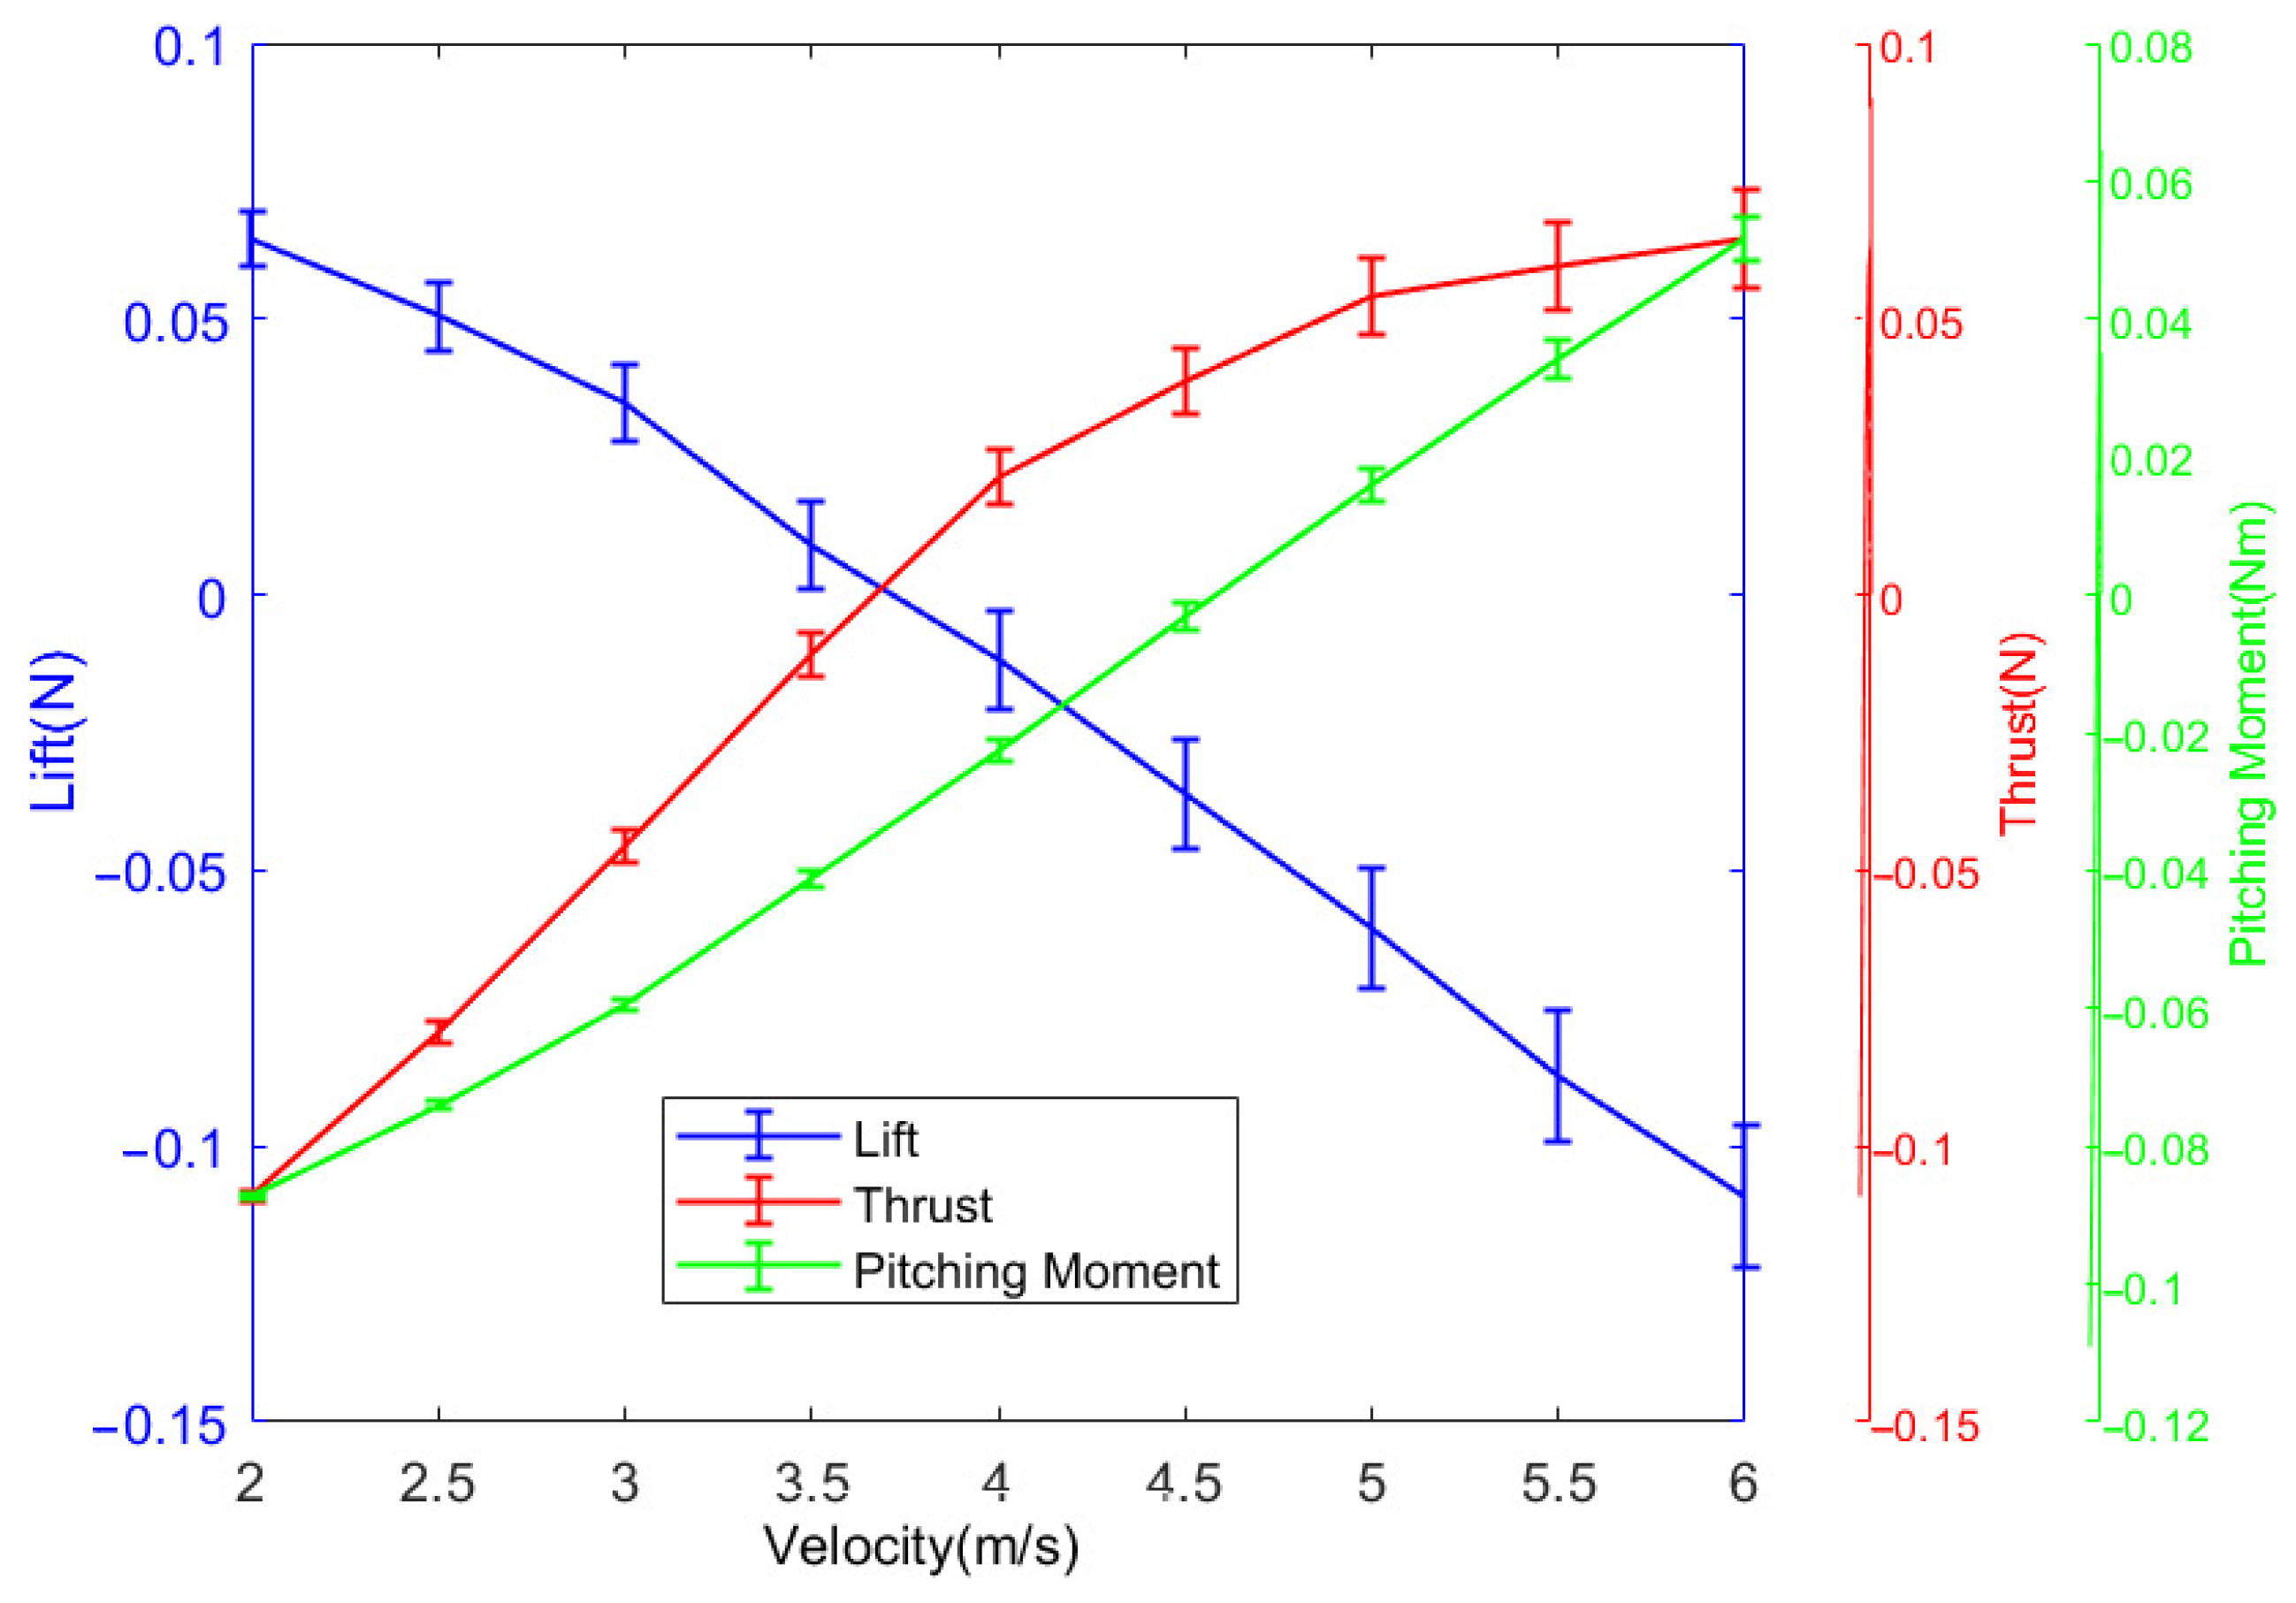
The fuselage without a wing membrane is connected to the sensor and fixed on the fixed platform, so that the angle of attack of the fuselage is 0°; it is placed in the wind tunnel, and the zero point of the sensor is reset. The motor is energized, and the output frequency of the gearbox is controlled to be 0 Hz. The wind speeds are set to be 2 m/s, 3 m/s, 4 m/s, 5 m/s, and 6 m/s, respectively. After each wind speed is stabilized, the output frequency of the gearbox is controlled to be 3 Hz. The data of the sensor under different wind speeds are recorded, and the data are processed by low-pass filtering, as shown in
Figure 7.
From the diagram, it can be clearly seen that the mean value of lift decreases with the increase in wind speed, and the thrust and the pitching moment increase with the increase in wind speed. The variation law obtained by the wind speed experiment is almost the same as that obtained by the flapping frequency experiment. However, from the numerical analysis, the deviation lift force generated by the fuselage can reach −0.1088 N (about 10 g mass), the deviation thrust can reach 0.079 N, and the deviation pitch moment can reach 0.0276 Nm. These deviation values are larger than the data of the beat frequency experiment, indicating that the measurement deviation caused by the wind speed will also have a non-negligible impact on the final measurement results. Therefore, this also shows the necessity of measuring the aerodynamic deviation of the fuselage.
4.2.3. Measurement Deviation Experiment of Fuselage Under Different Angles of Attack
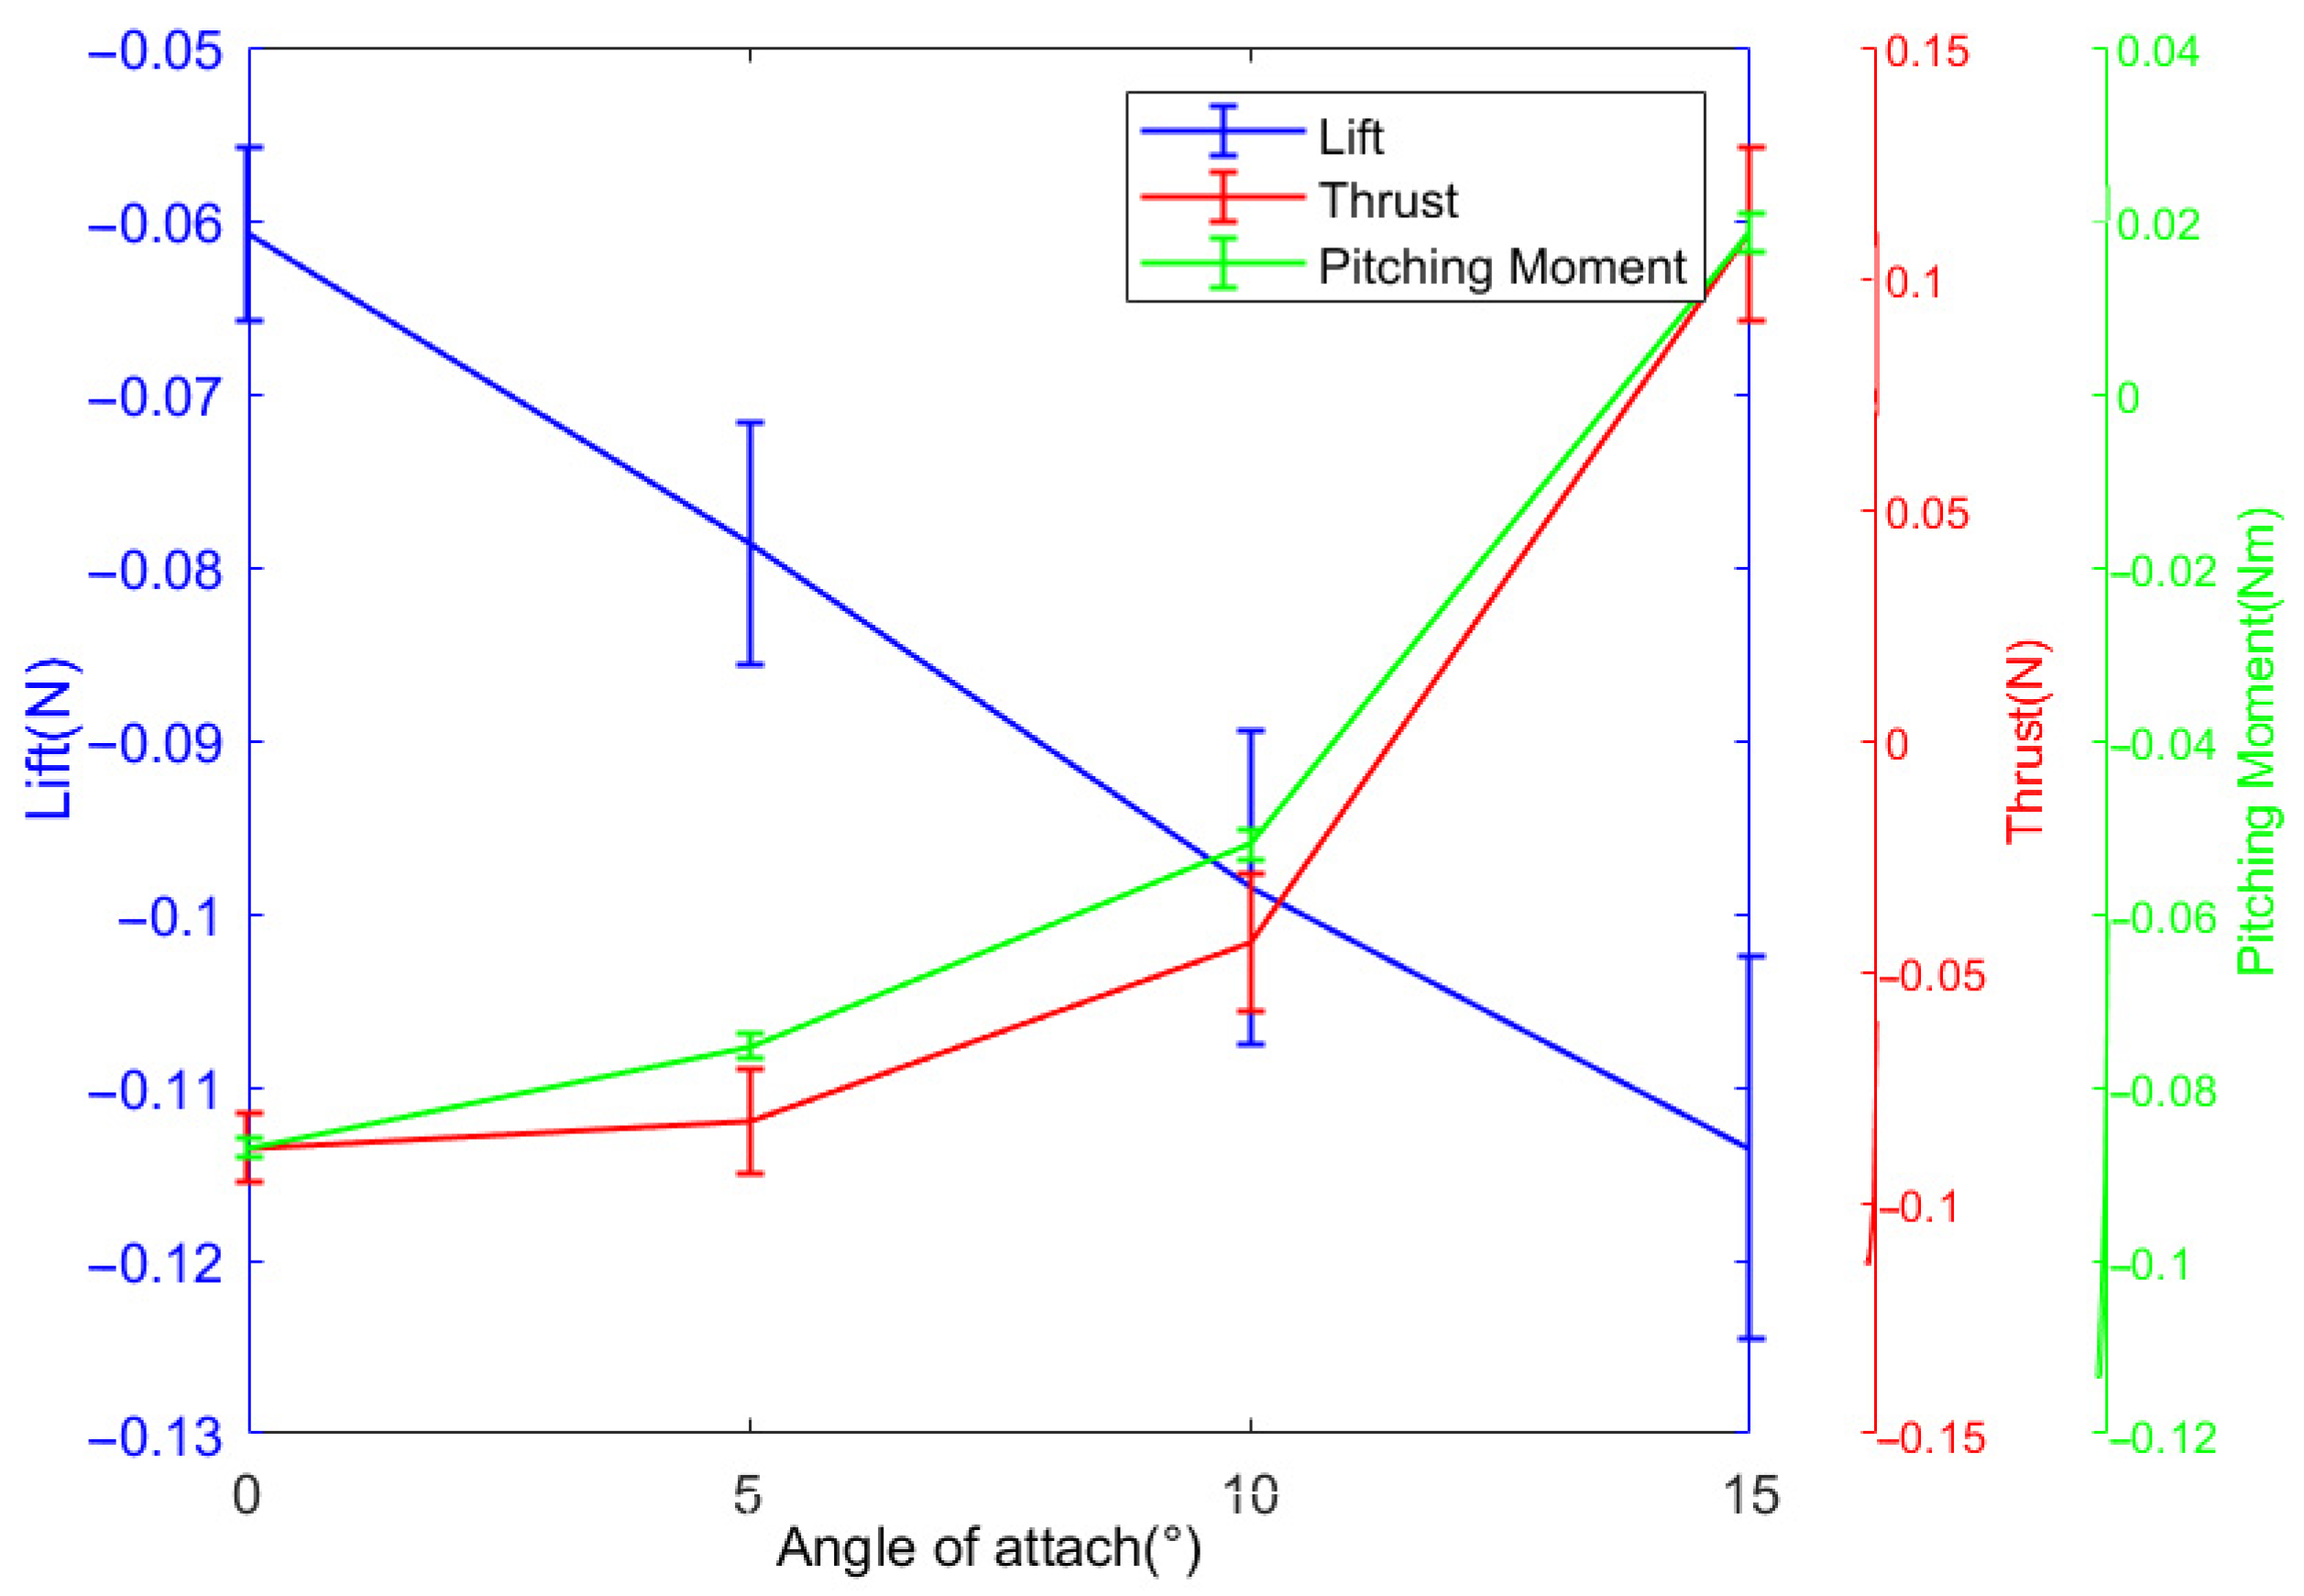
In the actual measurement process, in addition to changing the beat frequency and wind speed, it is still necessary to adjust different angles of attack to obtain different aerodynamic characteristics. The specific measurement experiment scheme is as follows: after the sensor is powered up for at least one hour, the prototype without a wing membrane is connected to the sensor and fixed on the fixed platform, so that the angle of attack of the prototype is 0°. It is placed in the wind tunnel, the zero point of the sensor is reset, the motor is energized, the output frequency of the gearbox is controlled to be 0 Hz, and the wind speed is set to 5 m/s, respectively. After the wind speed is stable, the output frequency of the gearbox is controlled to be 3 Hz, the data of the sensor at a 0° angle of attack are recorded, and so on; the angle of attack of the prototype is changed to to 5°, 10°, 15°, respectively, the data of the sensor are recorded, and low-pass filtering is performed on the data, as shown in
Figure 8.
From the diagram, it can be clearly seen that the mean value of lift decreases with the increase in angle of attack, and the thrust and the pitching moment increase with the increase in wind speed. From the numerical analysis, the deviation lift generated by the fuselage can reach −0.1132 N (11 g mass), the deviation thrust can reach 0.1013 N, and the deviation pitching moment can reach 0.0226 Nm. These deviation values are larger than the data of the beat frequency deviation measurement experiment and the wind speed deviation measurement experiment, indicating that the measurement deviation caused by the angle of attack will have the most serious impact on the final measurement results. Therefore, the influence of deviation factors must be considered in the final measurement data of the actual prototype, which also shows the necessity of measuring the aerodynamic deviation experiment generated by the fuselage.
4.3. Aerodynamic Analysis and Measurement Experiments of Different Parameters
The specific measurement experiment scheme is as follows: the prototype is connected with the sensor and fixed on a fixed platform, and the parameters such as flapping frequency, flight speed, and angle of attack will be adjusted according to the flight needs during the flight of the prototype bat. Therefore, it is necessary to analyze the influence of different motions on the lift and thrust to adapt to different flight environments. Considering the flight data of bats and the performance of the prototype, the motion parameters shown in
Table 2 are selected for the wind tunnel experiments. The default initial parameters are as follows: frequency 3 Hz, angle of attack 0°, and wind speed 5 m/s.
4.3.1. Aerodynamic Measurement Experiments at Different Flapping Frequencies
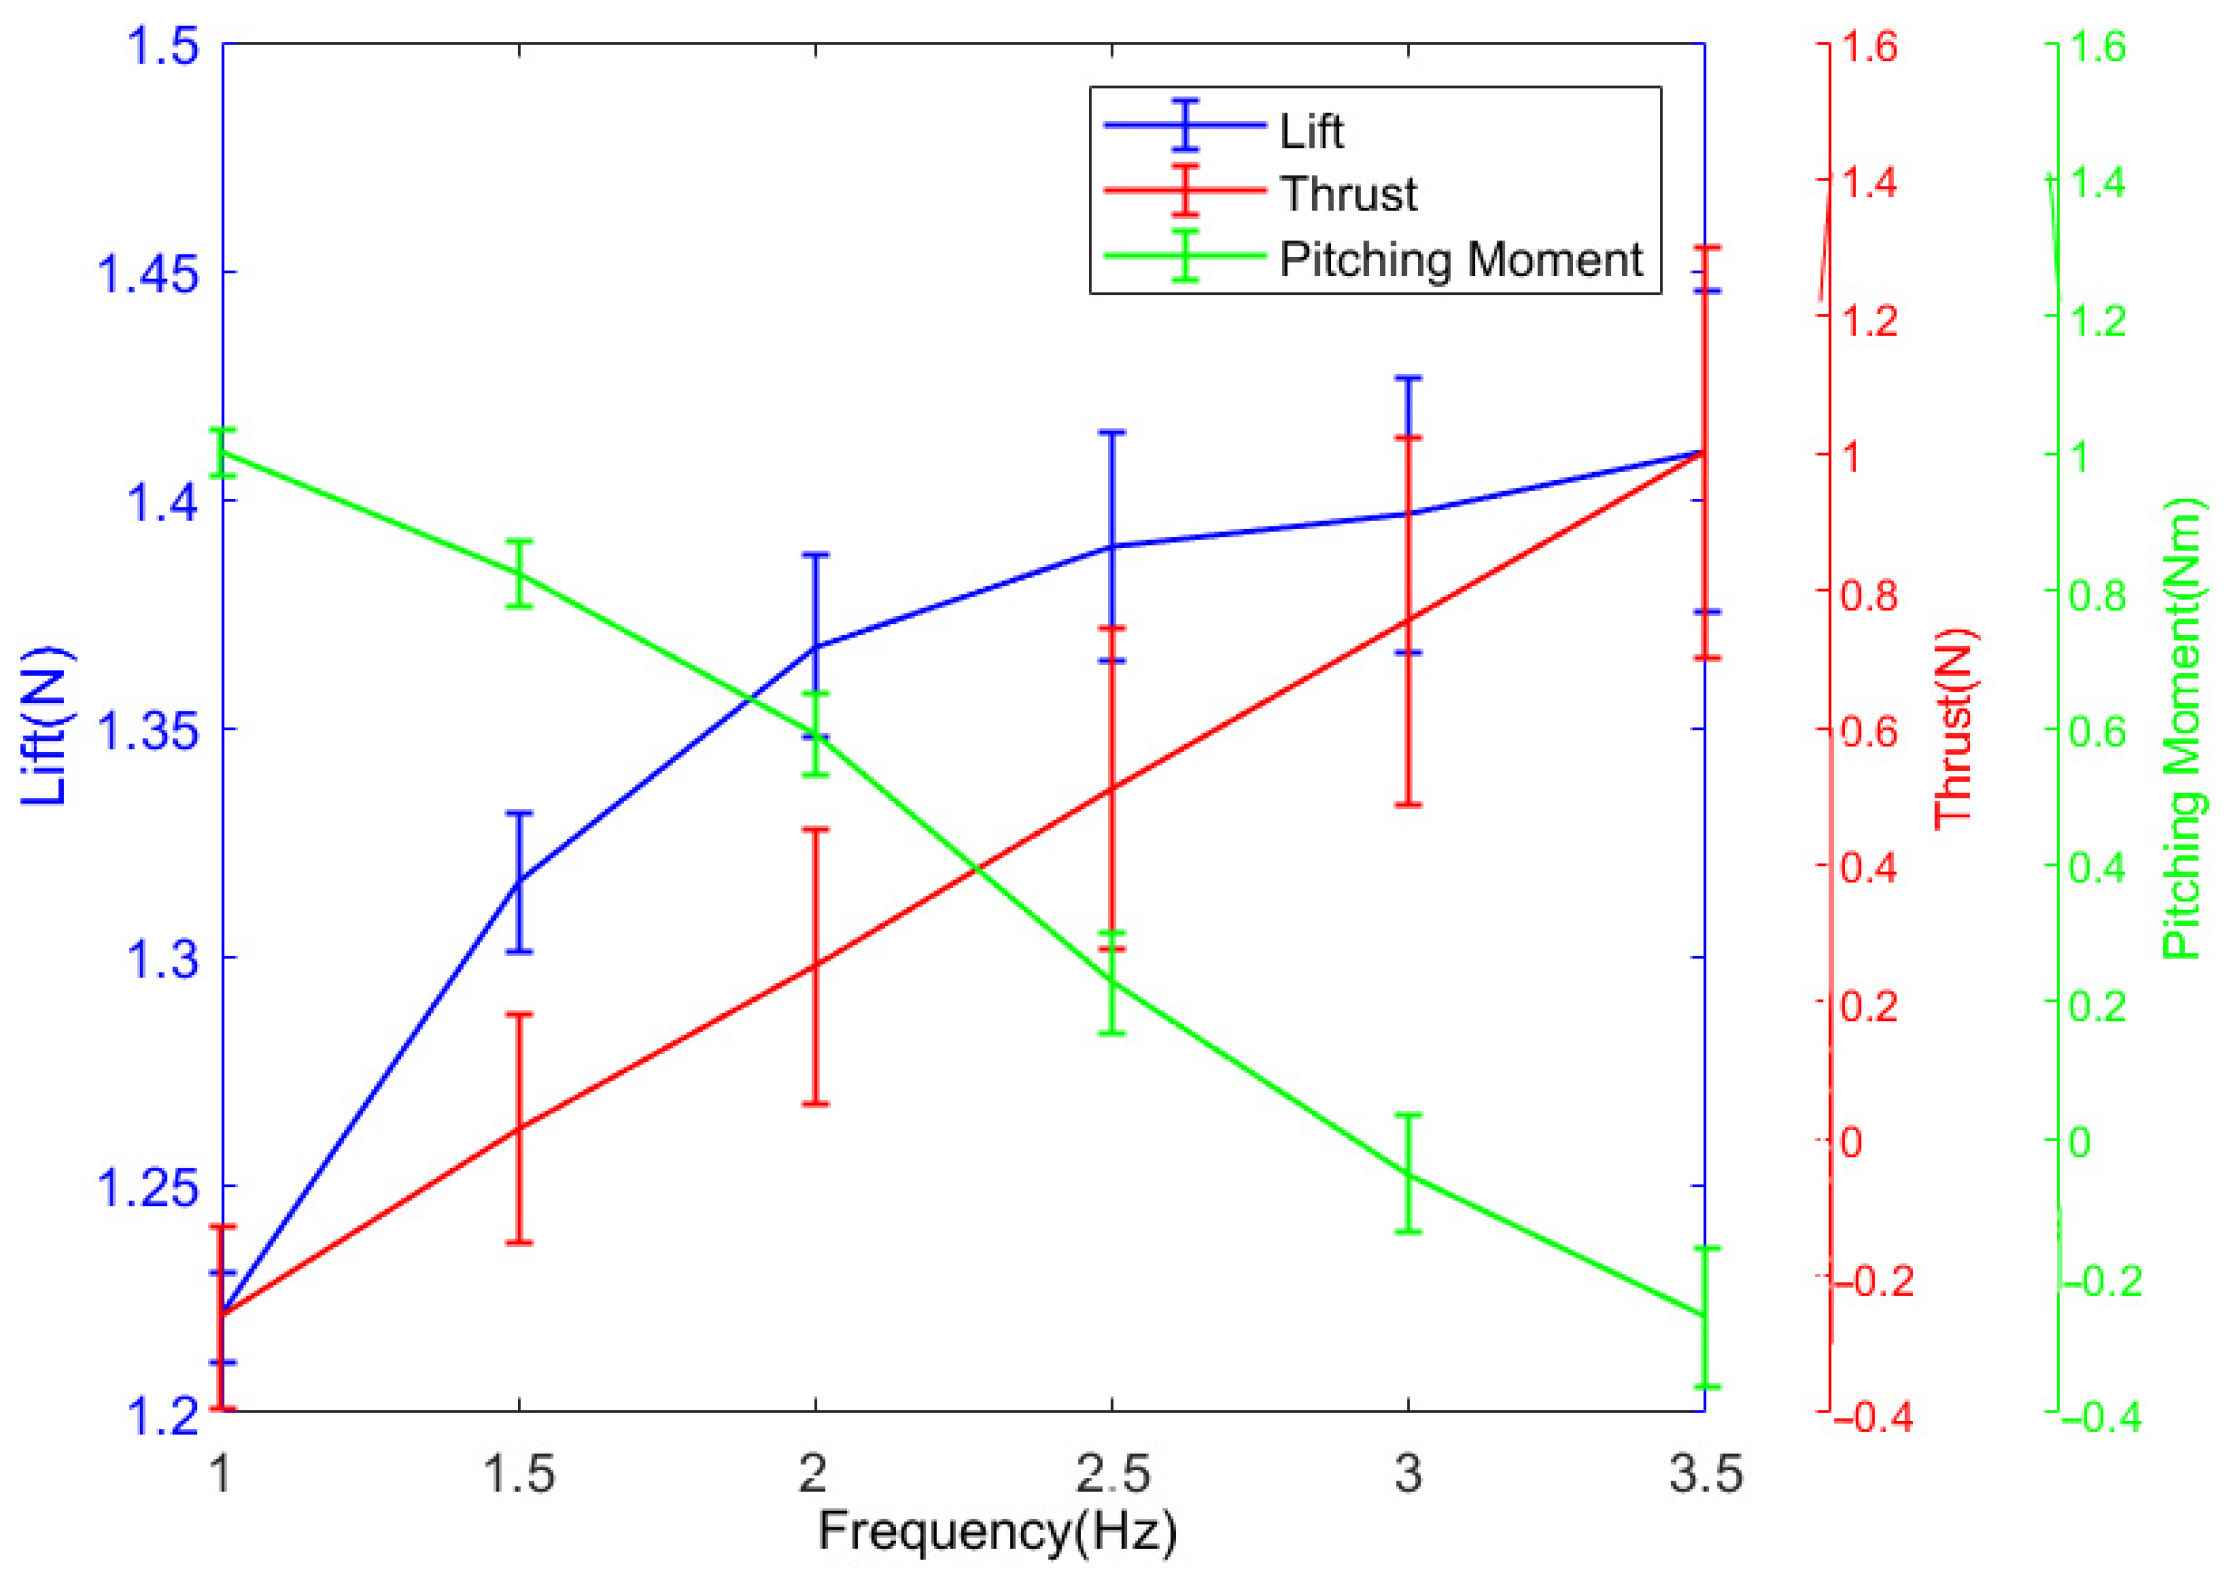
Firstly, the influence of different flapping frequencies on aerodynamic force is explored. The specific measurement experiment scheme is as follows: the prototype is connected to the sensor and fixed on the fixed platform, so that the angle of attack of the prototype is 0° and it is placed in the wind tunnel. Reset the zero point of the sensor, control the output frequency of the gearbox to be 0 Hz, and set the wind speed to be 5 m/s. After the wind speed is stable, the flapping frequency of the control wing hand is 1 Hz, 1.5 Hz, 2 Hz, 2.5 Hz, 3 Hz, 3.5 Hz; record the data of the sensor, and calculate the average aerodynamic force at each flapping frequency, as shown in
Figure 9.
It can be seen from the figure that the lift, thrust, and pitch moment (absolute value) all increase with the increase in the flapping frequency. This is mainly due to the increase in the flapping frequency, which accelerates the relative flow velocity on both sides of the wing membrane and increases the pressure difference between the front and back sides of the wing membrane during the reciprocating flapping process, thus increasing the aerodynamic force. Among them, the change rate of lift decreases first and then increases with the increase in flapping frequency. The pitching moment increases with the increase in the flapping frequency. As the frequency increases, the thrust gradually increases from negative thrust to positive thrust. This is because when the frequency is low, the forward thrust generated by the frequency is not enough to offset the resistance caused by the wind speed, so the total thrust is negative. At this time, the prototype does not have the ability to fly forward. When the frequency increases, the forward thrust generated by the frequency is sufficient to counteract the resistance caused by the wind speed, so the total thrust is positive, indicating that the prototype has the ability to fly forward.
4.3.2. Aerodynamic Measurement Experiments at Different Wind Speeds
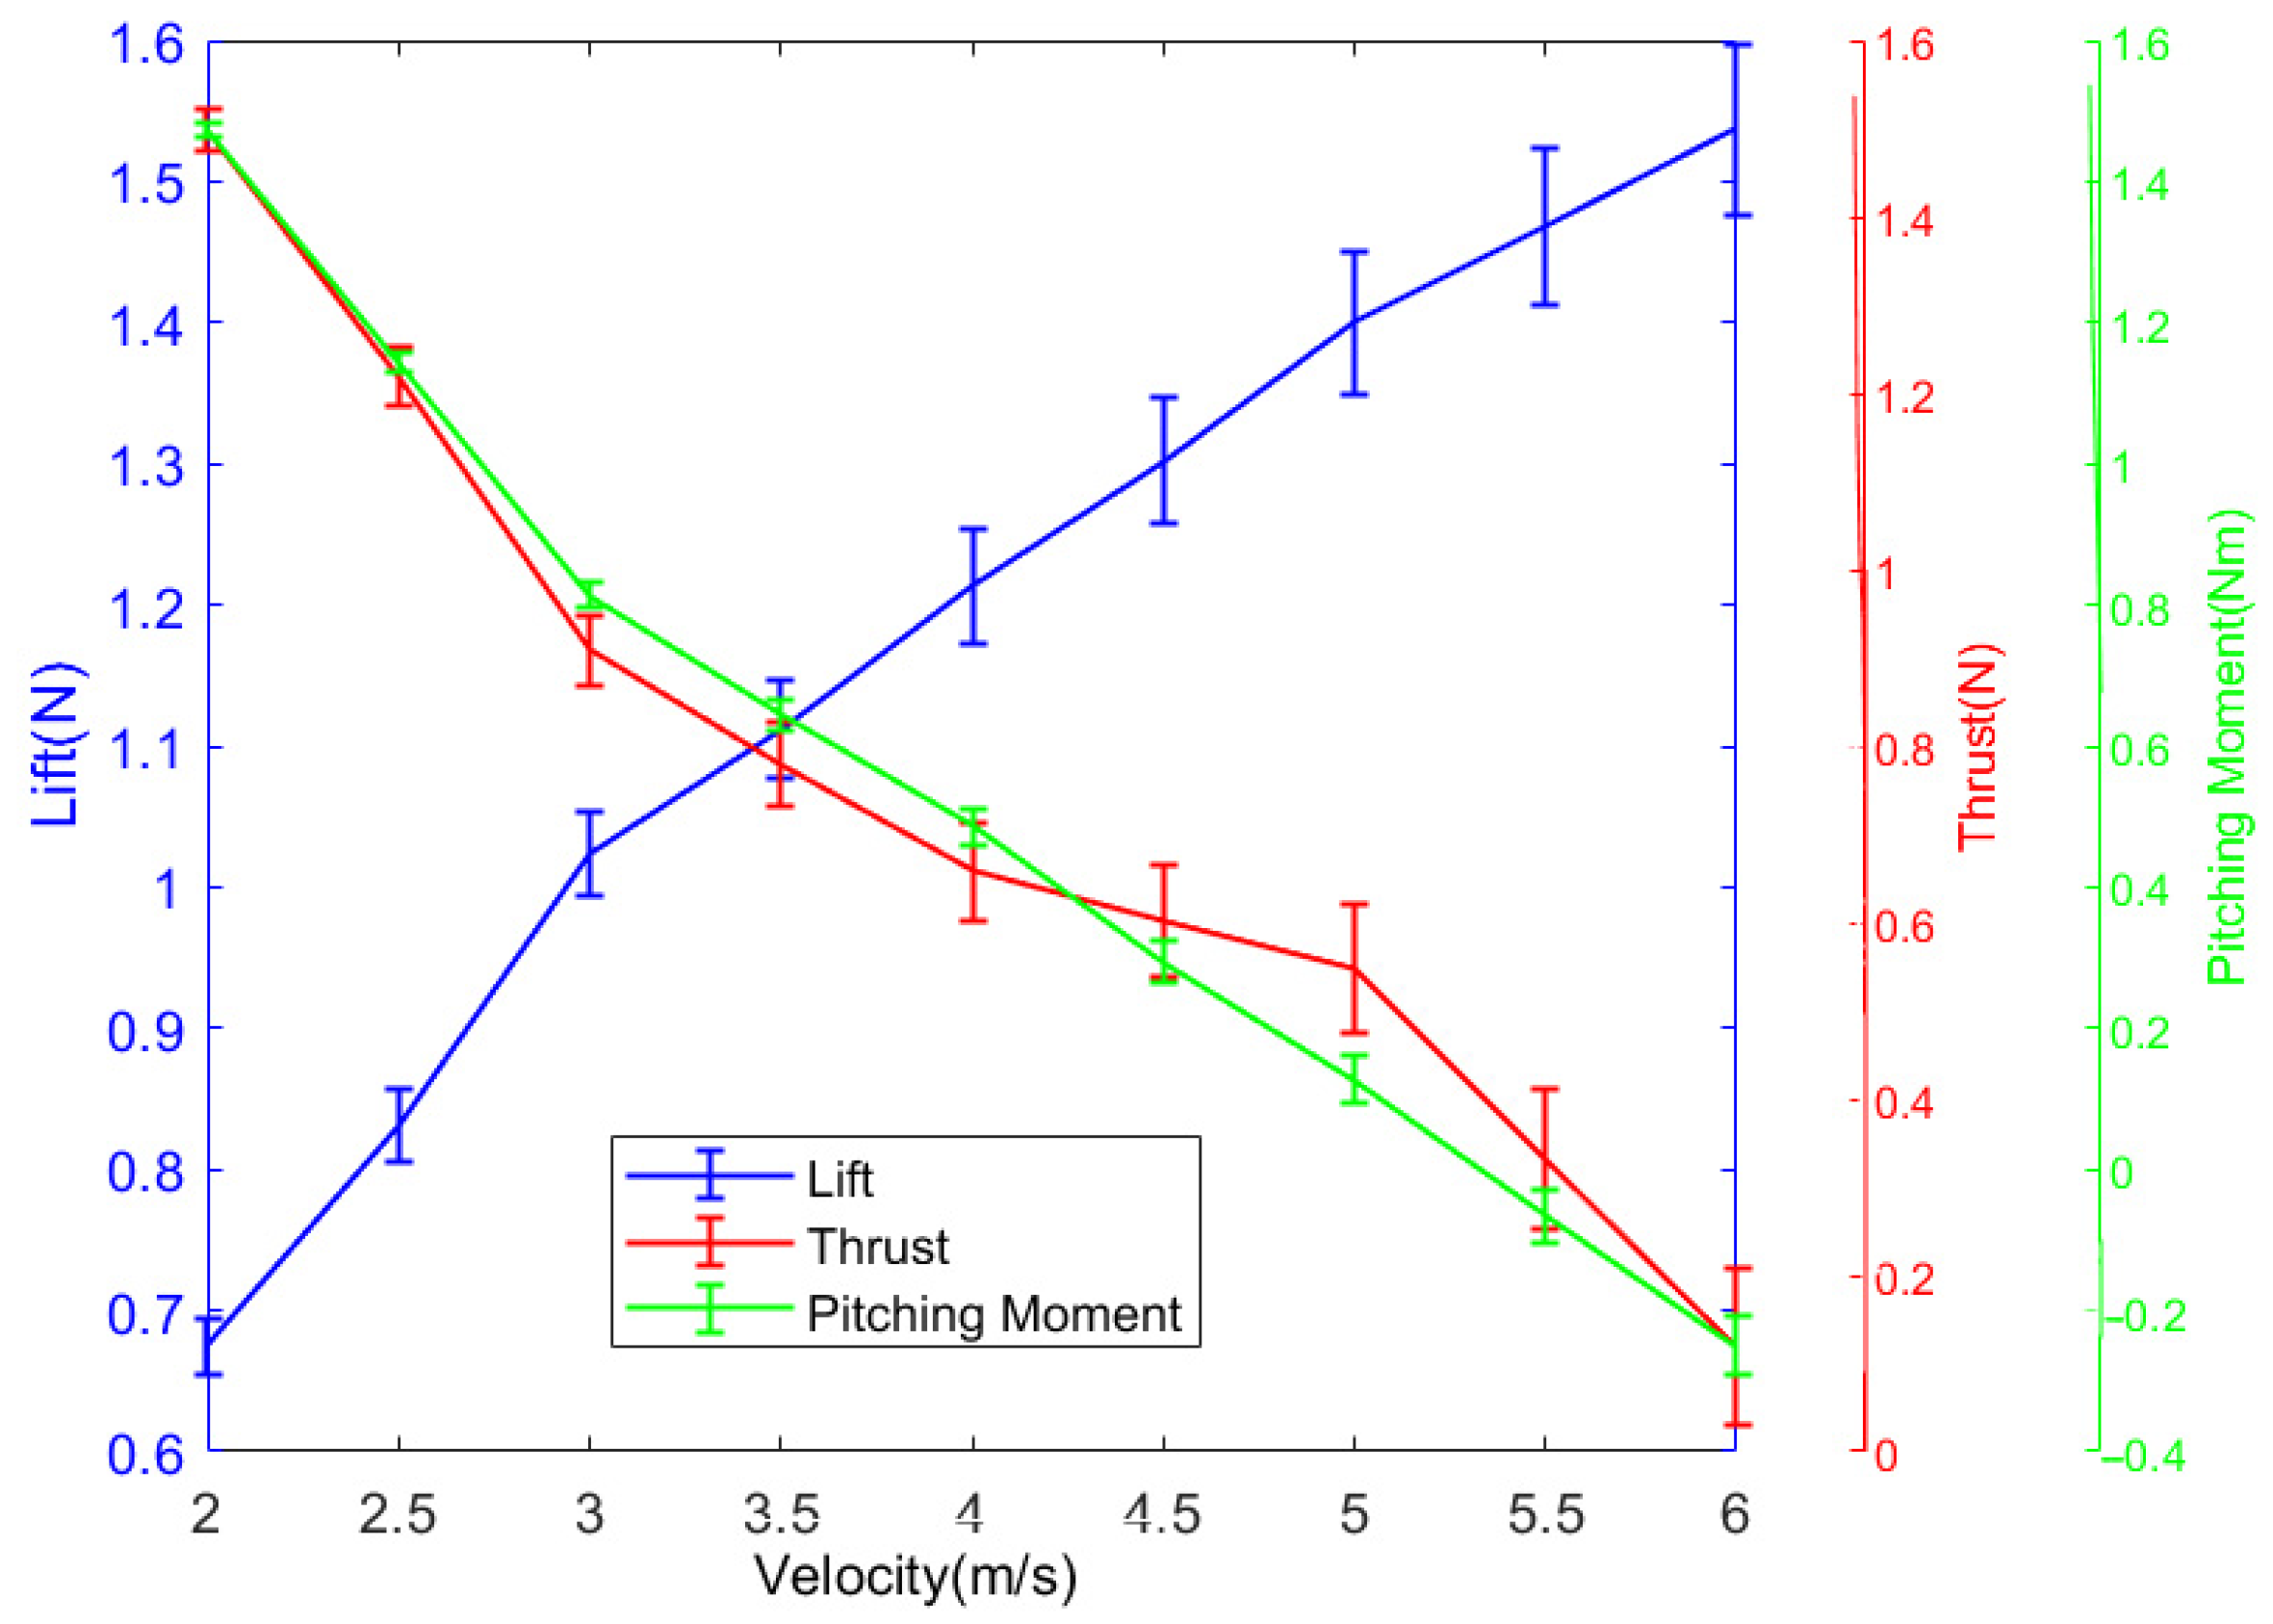
Then, the influence of different wind speeds on aerodynamic force is explored. The specific measurement experiment scheme is as follows: the prototype is connected with the sensor and fixed on a fixed platform, so that the angle of attack of the prototype is 0°; it is placed in the wind tunnel, and the zero point of the sensor is reset. The motor is energized, and the output frequency of the gearbox is controlled to be 0 Hz. The wind speeds are set to be 2 m/s, 3 m/s, 4 m/s, 5 m/s, and 6 m/s, respectively. After each wind speed is stabilized, the output frequency of the gearbox is controlled to be 3 Hz. The data of the sensor under the different wind speeds are recorded, and the average aerodynamic force at each wind speed is calculated, as shown in
Figure 10.
It can be seen from the diagram that the lift and pitch moment (absolute value) increase with the increase in wind speed, and the thrust decreases with the increase in wind speed. This is mainly because as the wind speed increases, the surface pressure of the wing membrane increases, resulting in an increase in lift, forward thrust, resistance, and pitch moment. However, since the increase in resistance is greater than the increase in forward thrust, the thrust will gradually decrease.
Birds generally use the method of increasing the initial velocity to obtain the lift of take-off, which can explain why birds must find a way to obtain a certain initial velocity when they take off. For example, some small- and medium-sized birds such as sparrows need to push their feet hard to obtain a certain initial speed when taking off; some large birds such as the eagle have a large weight, and it is not enough to obtain the initial speed of take-off by kicking the ground alone. Therefore, it is necessary to run a distance, or to obtain the initial speed of take-off by diving from a cliff or other highlands.
4.3.3. Aerodynamic Measurement Experiments at Different Angles of Attack
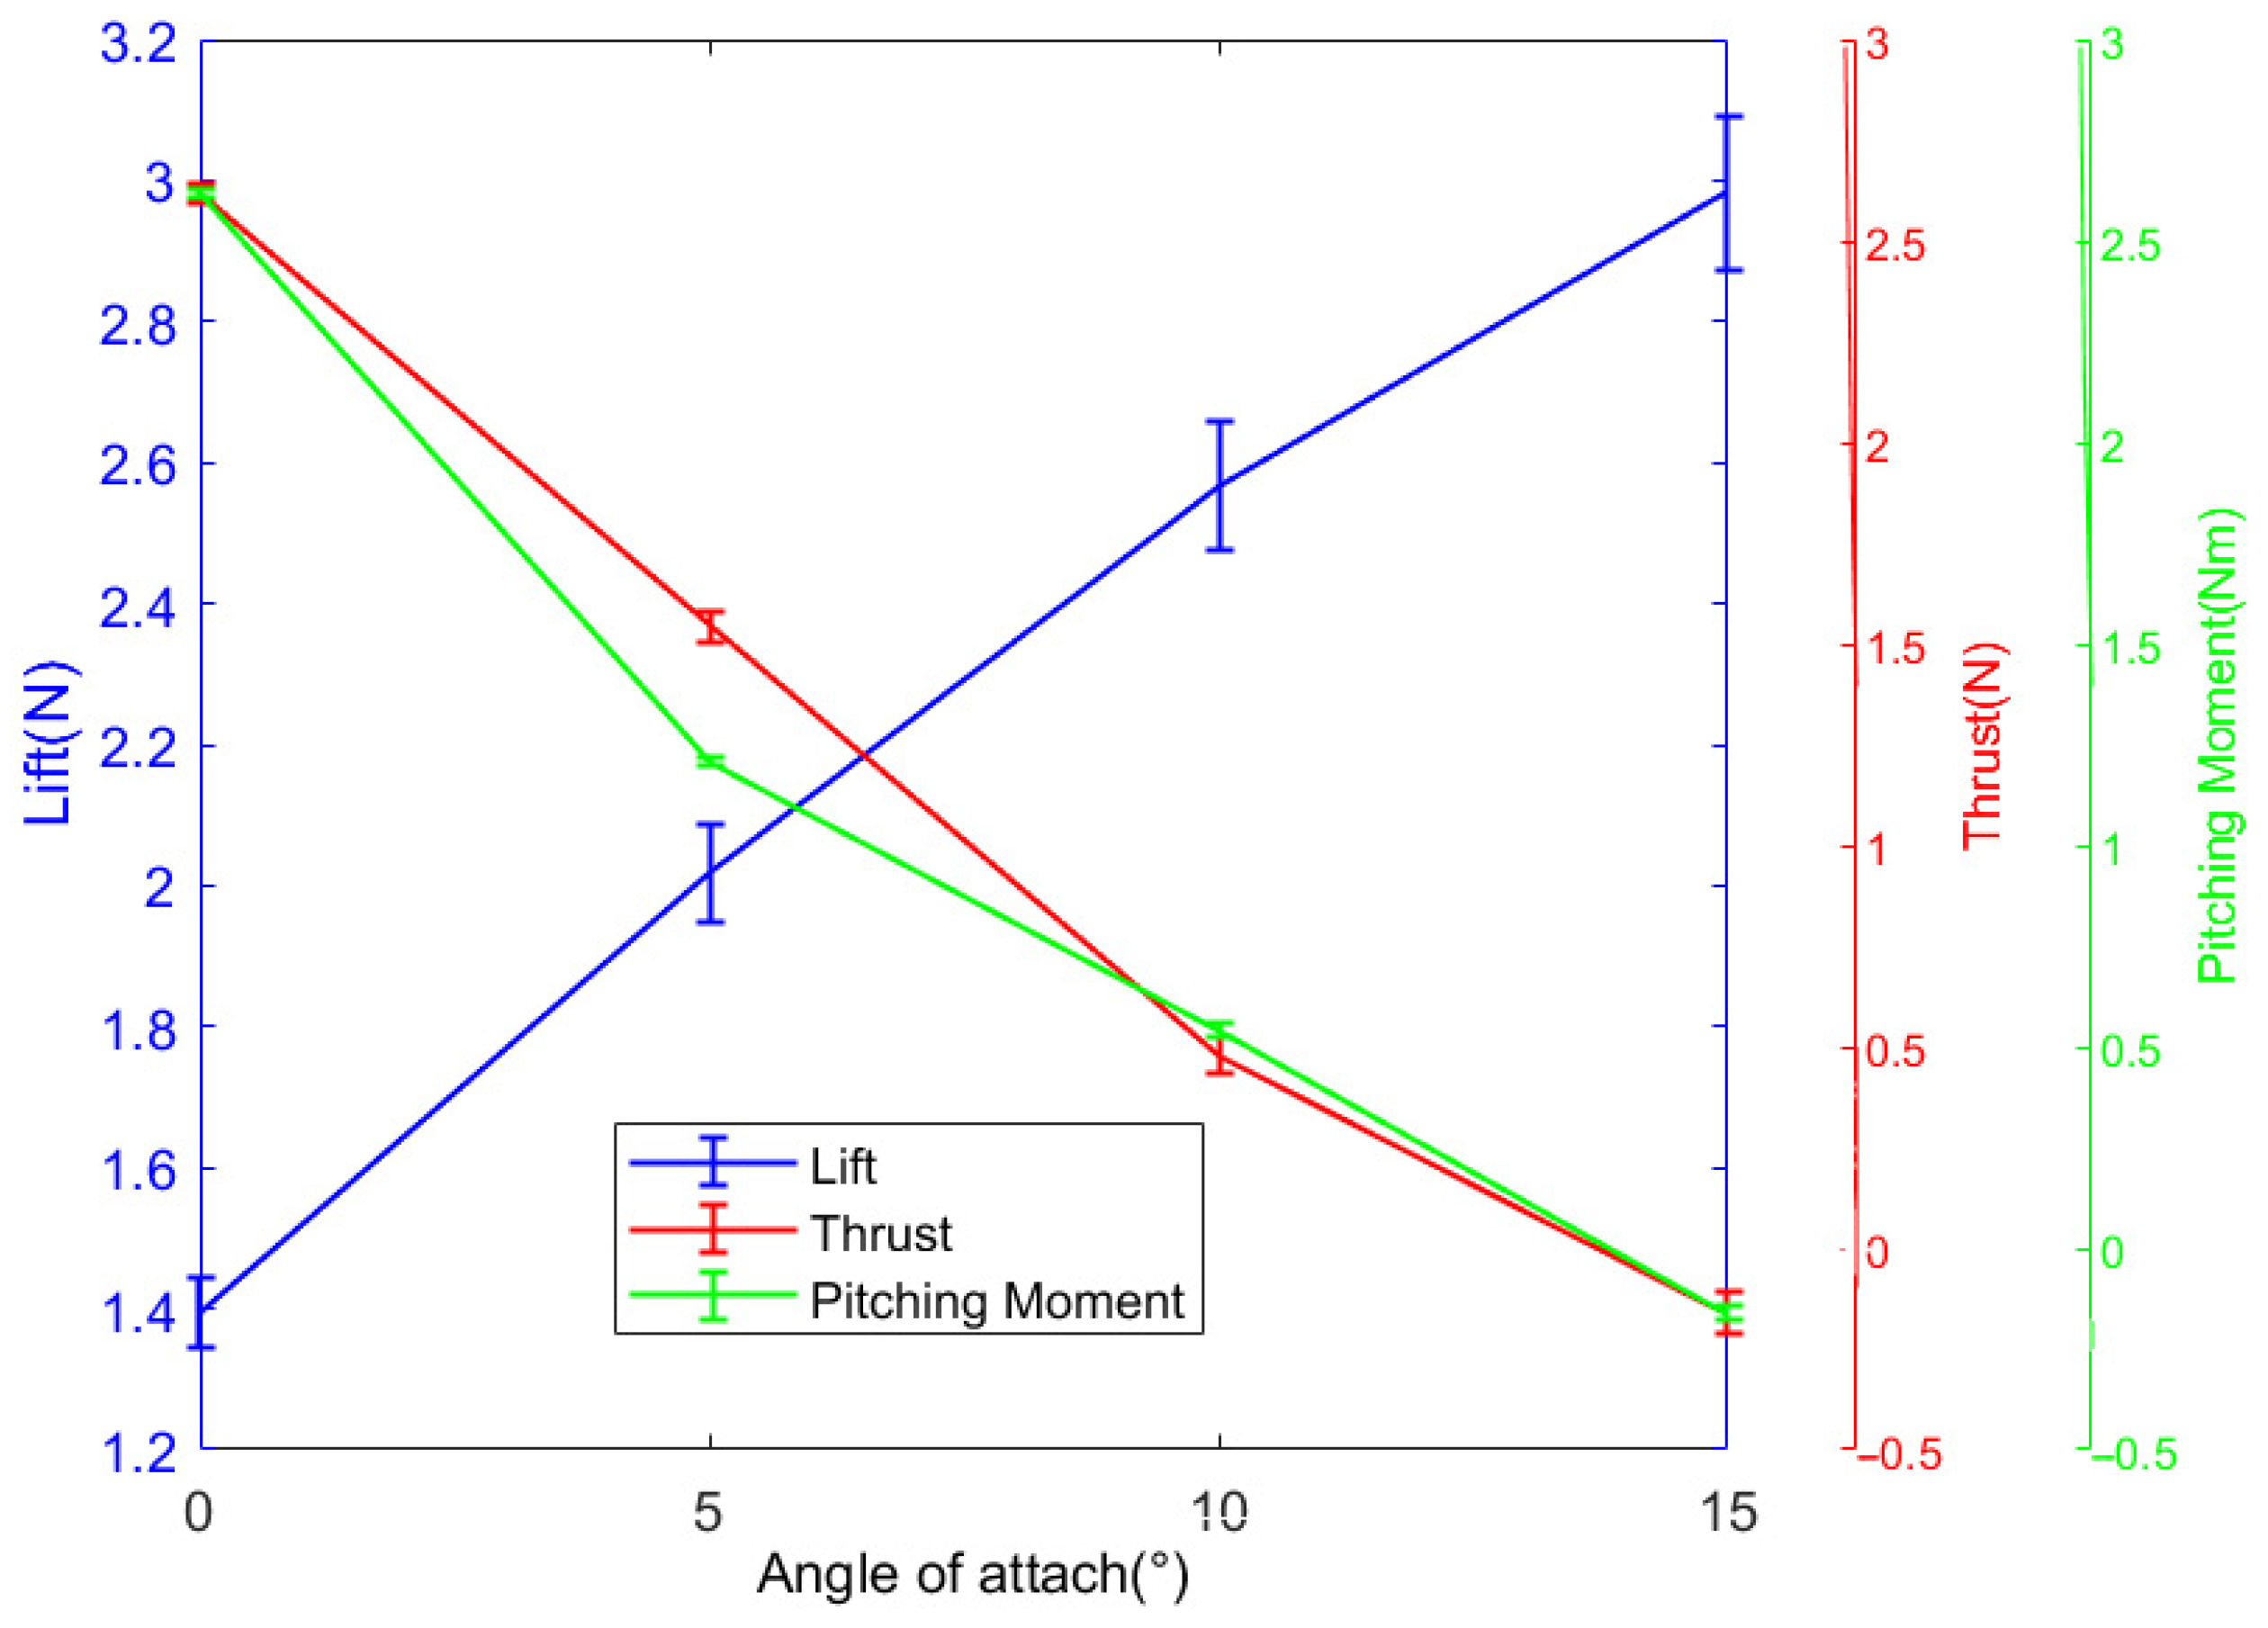
Then, the influence of different angles of attack on aerodynamic force is explored. The specific measurement experiment scheme is as follows: the prototype is connected to the sensor and fixed on the fixed platform, so that the angle of attack of the prototype is 0°; it is placed in the wind tunnel, the zero point of the sensor is reset, the motor is energized, the output frequency of the control gearbox is 0 Hz, and the wind speed is set to 5 m/s. After the wind speed is stable, the output frequency of the control gearbox is 3 Hz, and the data of the sensor at the angle of attack of 0° are recorded. By analogy, the angle of attack of the prototype is changed to 5°, 10°, and 15°, respectively. The data of the sensors at different angles of attack are recorded, respectively, and the mean value of aerodynamic force at each angle of attack is calculated, as shown in
Figure 11.
It can be seen from the diagram that the influence of the angle of attack on the aerodynamic force is similar to the influence of the wind speed on the aerodynamic force, that is, the lift and the pitch moment (absolute value) increase with the increase in the angle of attack, and the thrust decreases with the increase in the angle of attack. This is mainly because with the increase in the angle of attack, the windward area of the wing film is larger, which leads to the increase in lift, forward thrust, drag, and pitching moment. However, because the increase in drag is greater than the increase in forward thrust, the thrust will gradually decrease until the negative thrust is generated, which indicates that the prototype does not have the ability to fly forward.
According to the above analysis results, the observation results of Tobalske [
26] can be well explained: the bird needs enough lift when taking off, so it needs a larger angle of attack; when flying at low speed, it needs enough lift and a small thrust, so it needs a slightly larger angle of attack. However, with the increase in velocity, only a small lift is needed to ensure the balance of force in the vertical direction and even the average lift can be slightly lower than gravity; but a large thrust is needed, and too large an angle of attack will increase the resistance, so a small angle of attack is needed at this time. When the bird lands, it requires greater resistance to reduce the flight speed, so it will require a larger angle of attack at this time.
4.4. Research on the Flight Feasibility of the Prototype’s Motion Parameters
Through the previous analysis, the influence of motion parameters such as flapping frequency, wind speed, and angle of attack on aerodynamic force is obtained, and the aerodynamic data under various working conditions are also known. However, whether these motion parameters can support the prototype flight is still unknown. Therefore, this section analyzes the flight feasibility of the aerodynamic data under various working conditions shown in
Figure 11.
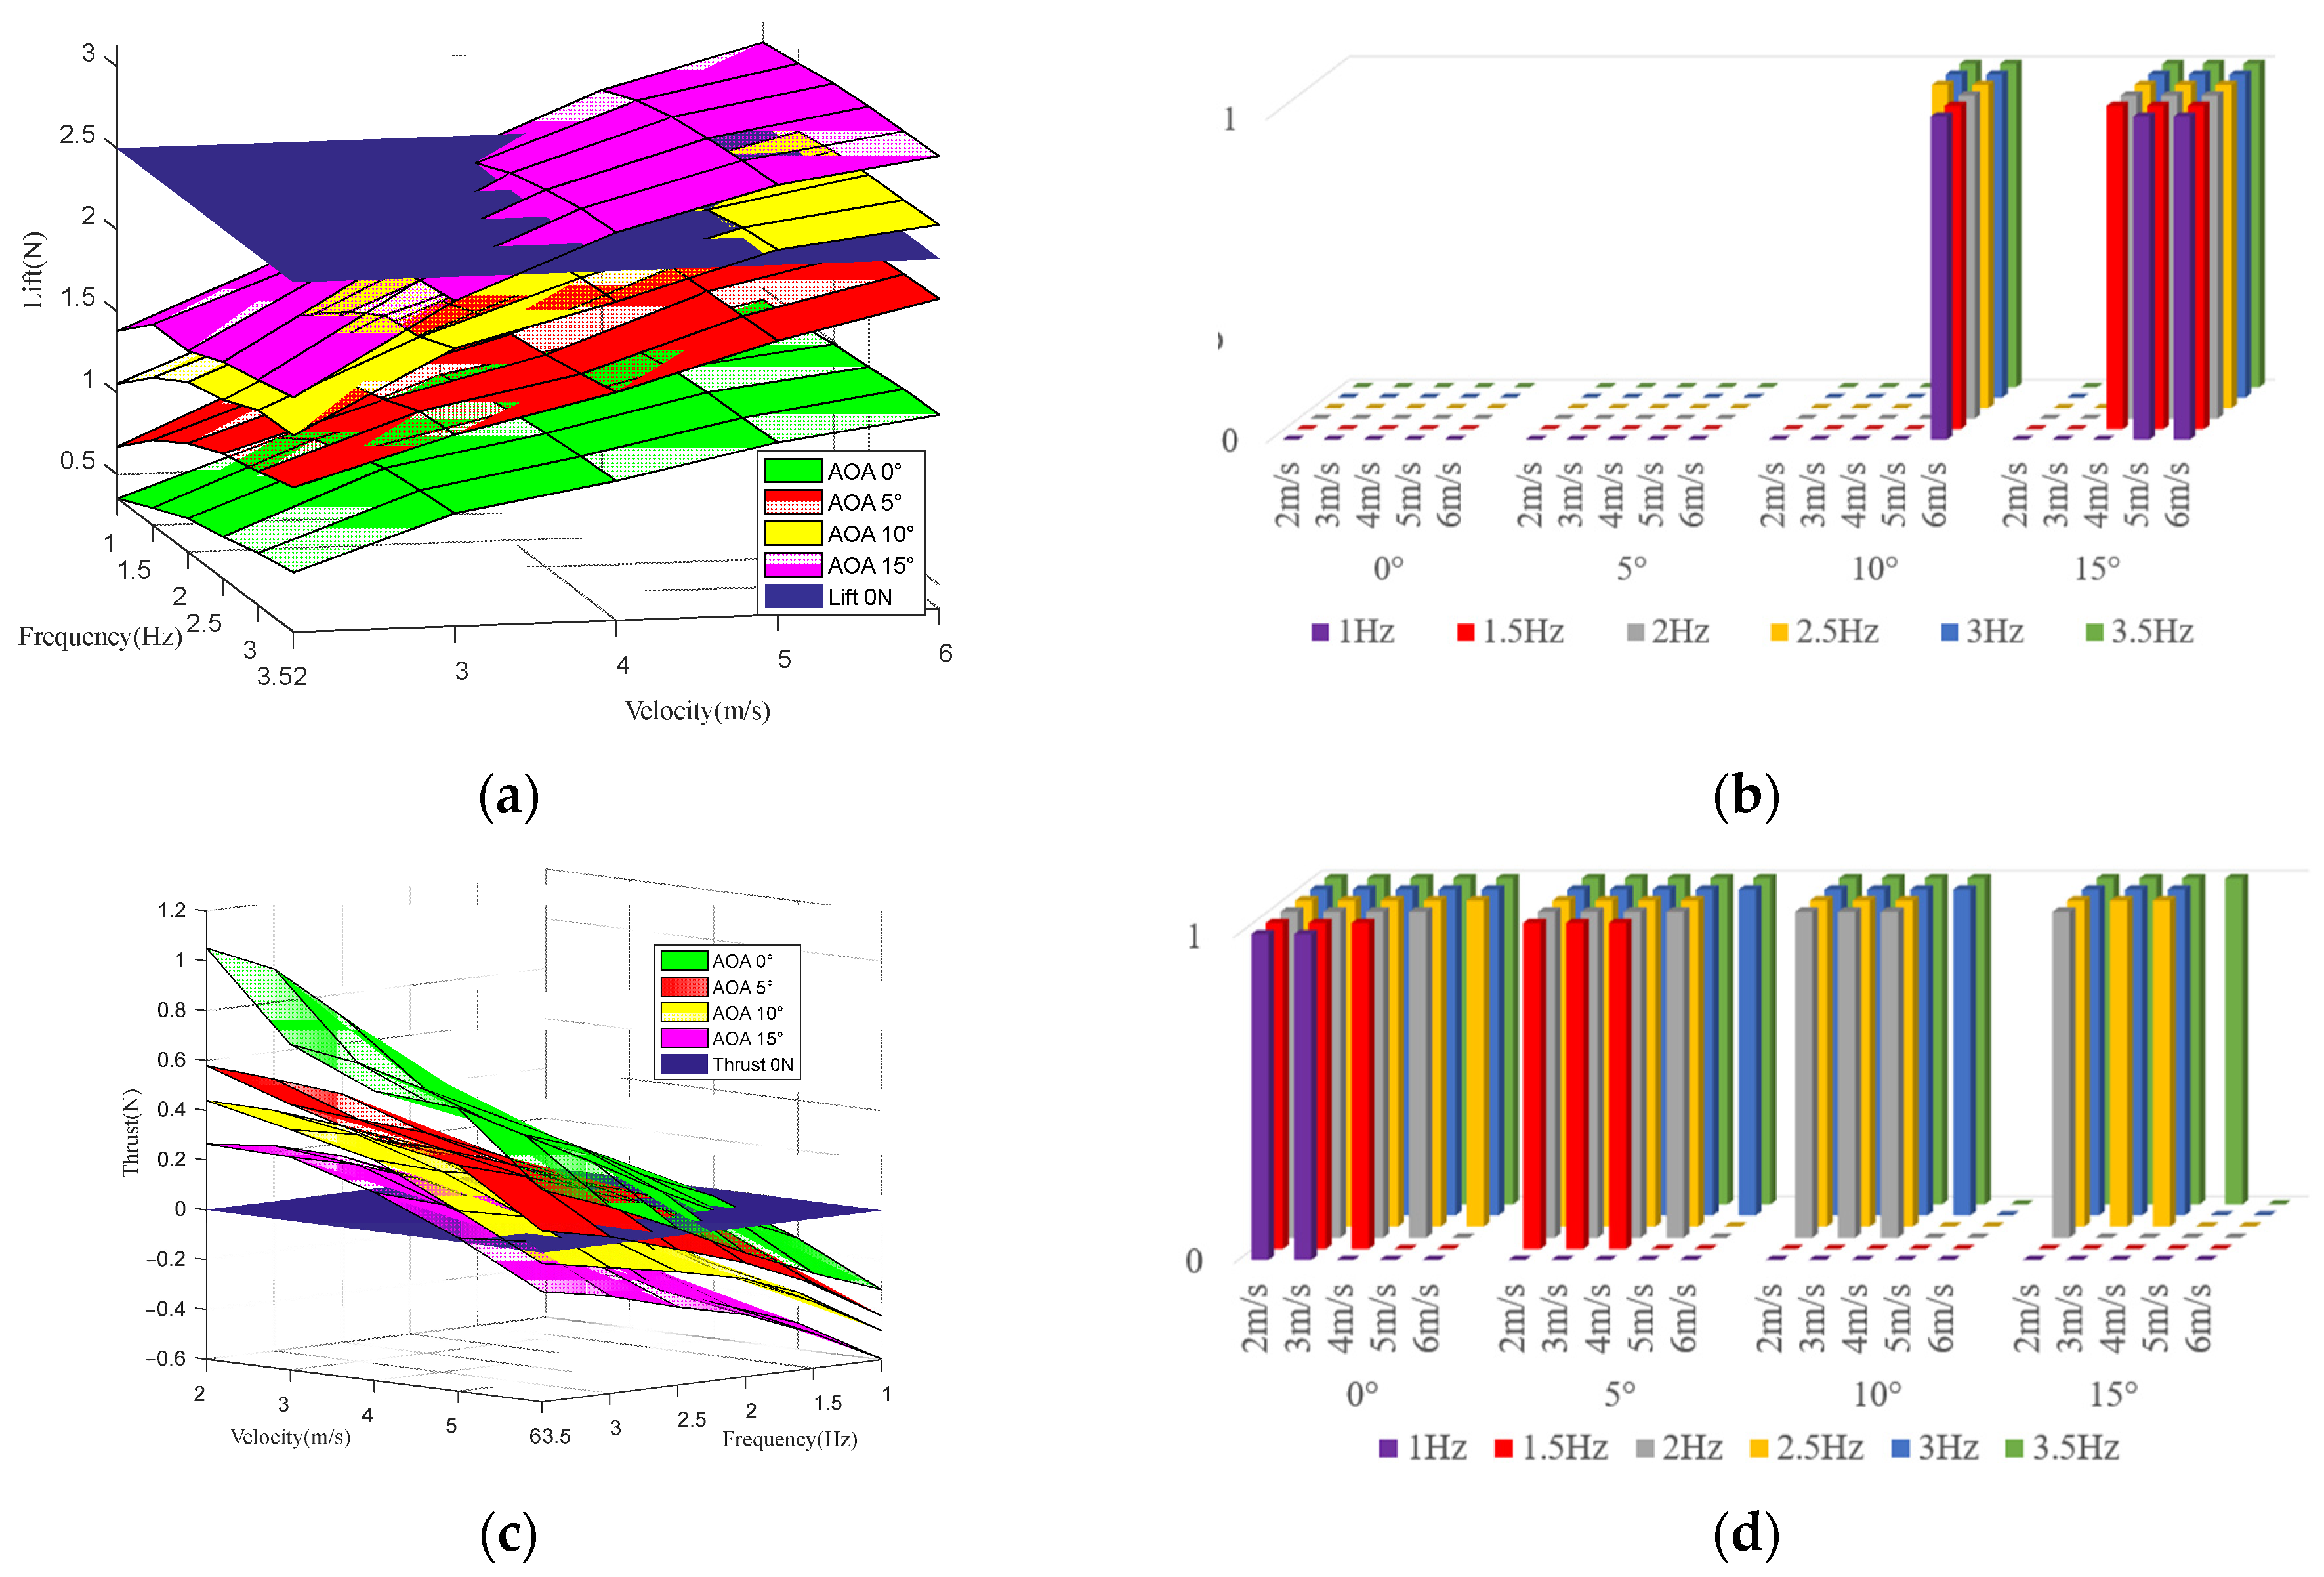
For the flapping-wing robot studied, the lift determines whether the prototype can fly up, and the thrust determines whether the prototype can fly forward. The two work together to determine whether the prototype can fly, and the pitch moment determines whether the prototype can fly smoothly. Therefore, to explore the flight feasibility of the parameters, only the effects of lift and thrust need to be considered. In order to clearly explore whether the motion parameters under the above working conditions have flight feasibility, it is necessary to carry out three-dimensional visualization of the data in
Figure 5, as shown in
Figure 12. Among them are the following: (a) The lift data under various working conditions are shown in the figure (shown in pink, yellow, red, and green surfaces in the figure), as is the plane with equal lift and gravity (shown in the dark blue plane in the figure), which can be described as follows: the parameters above the ‘lift 2.5 N’ plane indicate that the lift is greater than the gravity, meets the take-off standard, and has take-off ability. The parameters below the ‘lift 2.5 N’ plane indicate that the lift is less than the gravity, does not meet the take-off standard, and does not have take-off ability. (b) We have made a visual display of whether the parameters under each working condition have take-off ability. The ordinate 0 indicates that the parameters under this working condition do not meet the take-off standard, and 1 indicates that the parameters under this working condition meet the take-off standard. (c) The thrust data under various working conditions are shown in the figure (shown in pink, yellow, red, and green surfaces in the figure), as is the plane with a thrust of 0 (shown in the dark blue plane in the figure), which can be described as follows: the parameters above the ‘thrust 0 N’ plane indicate that the thrust is positive, meets the forward-flight standard, and has forward-flight ability. The parameters below the ‘thrust 0 N’ plane indicate that the thrust is negative, does not meet the forward-flight standard, and does not have forward-flight ability. (d) The chart makes a visual display of whether the parameters under each working condition have the ability to fly forward. The ordinate 0 indicates that the parameters under this condition do not meet the forward-flight standard, and 1 indicates that the parameters under this condition meet the forward-flight standard.
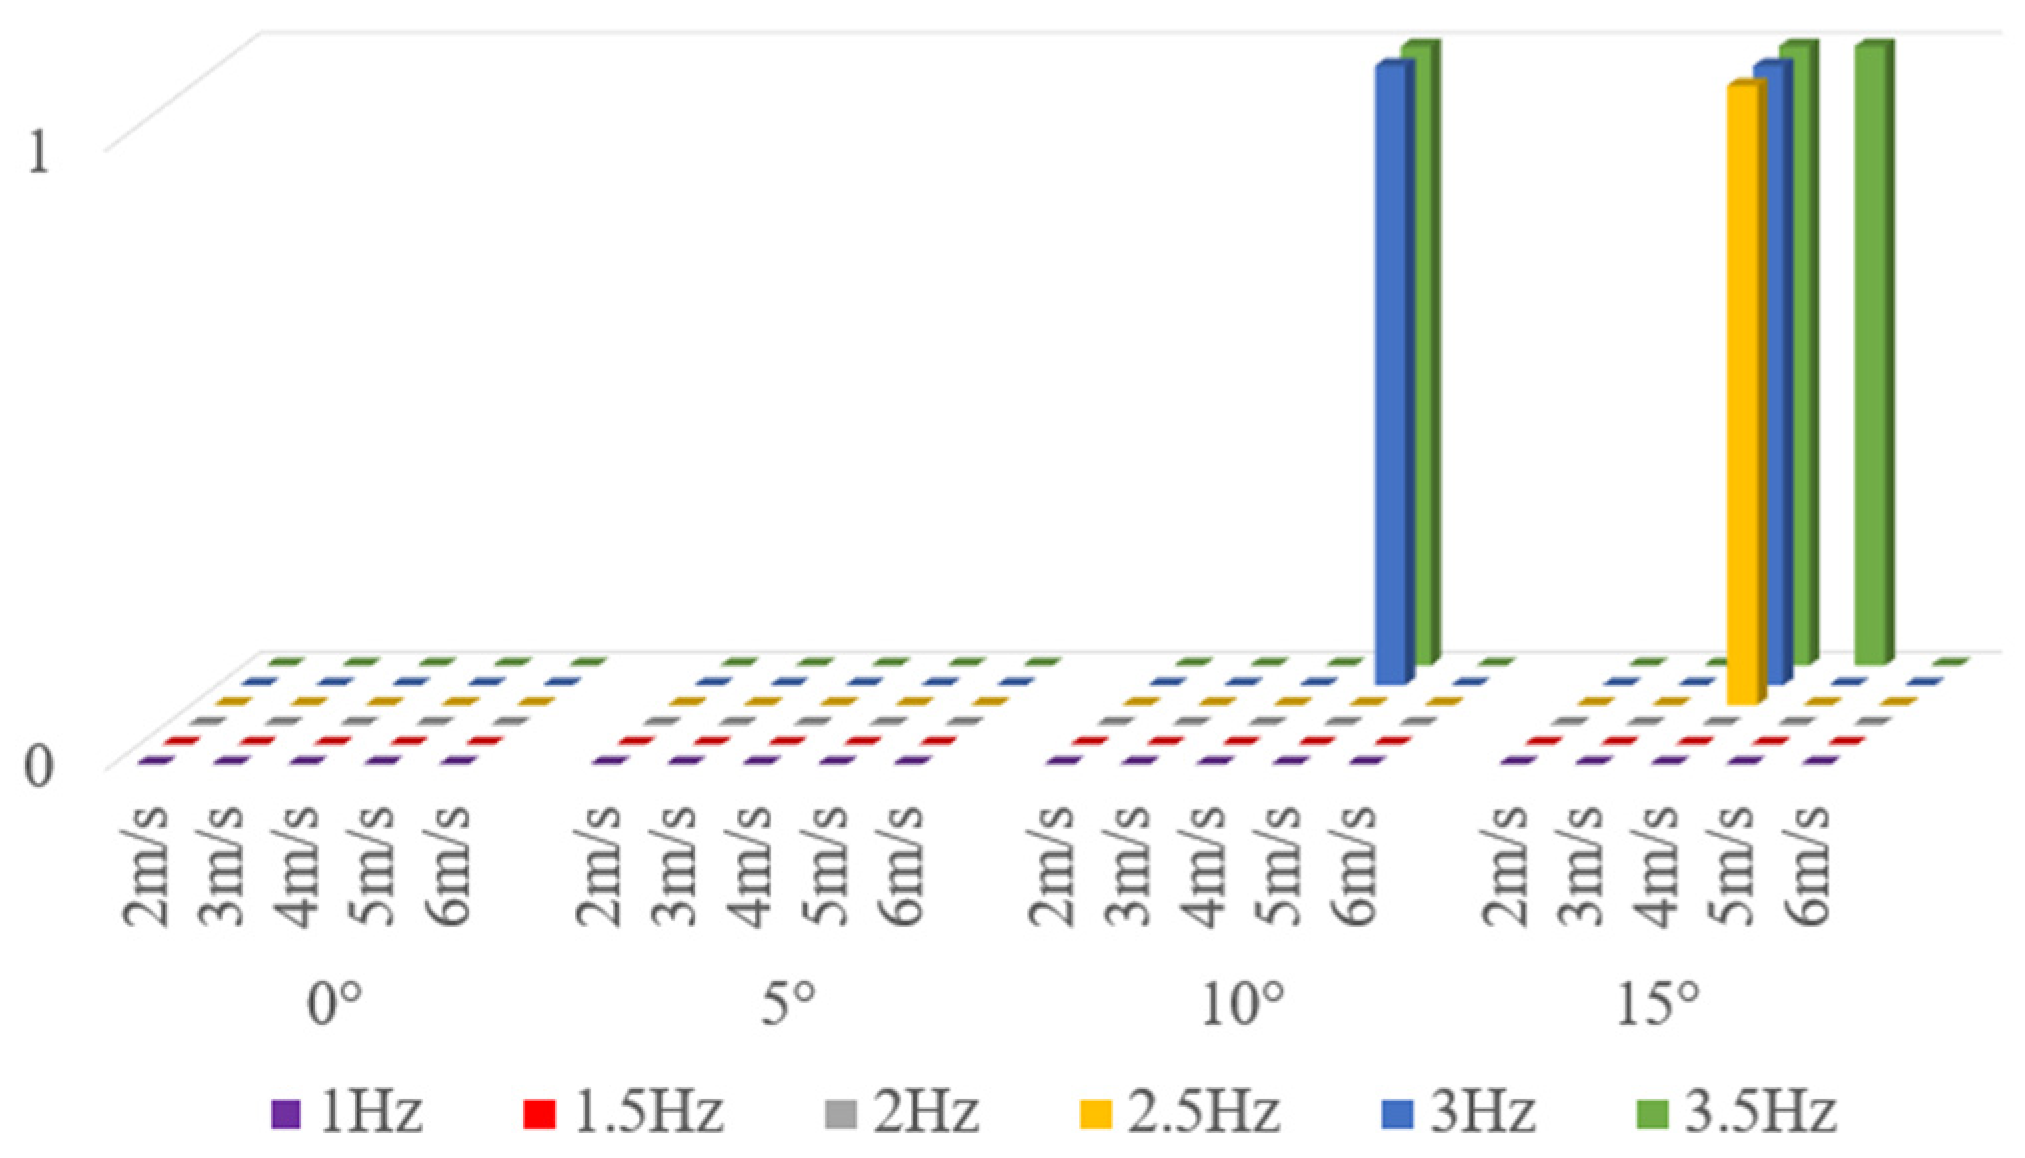
It can be seen from
Figure 12 that there are many parameter combinations with up-flight ability and forward-flight ability alone, but in fact, the prototype flight needs to have both up-flight ability and forward-flight ability, so it is necessary to comprehensively analyze the two.
Figure 13 shows the parameters that meet both the take-off standard and the forward-flight standard, that is, the parameters with flight capability.
It can be seen from the figure that there are only six sets of parameters that meet the flight standards. At an angle of attack of 10°, the wind speed reaches 5 m/s, the frequency reaches 3 Hz and 3.5 Hz, and the prototypes have flight capability. At an angle of attack of 15°, the prototype with wind speed of 5 m/s and frequencies of 2.5 Hz, 3 Hz, and 3.5 Hz, and the prototype with wind speed of 6 m/s and frequency of 3.5 Hz have the ability to fly. This also reflects the harshness of the flapping-wing prototype flight. This harshness is mainly reflected in the take-off stage. If the prototype is already in the flight stage, it indicates that its motion parameters have met the flight standards and have certain parameter stability, which can maintain the prototype flight. However, the motion parameters of the take-off stage are uncertain, so it is difficult to meet the parameters of the flight standard. Therefore, it is a challenge to control the initial throwing speed, throwing angle, and flapping frequency of the flapping-wing aircraft in the throwing stage.


