Article

Inter-Laboratory Characterisation of a Low-Power Channel-Less Hall-Effect Thruster: Performance Comparisons and Lessons Learnt

by
Thomas F. Munro-O’Brien
1,*,
Mohamed Ahmed
2,
Andrea Lucca Fabris
2 and
Charles N. Ryan
1
1
University of Southampton, Highfield Campus, Southampton SO17 1BJ, UK
2
University of Surrey, Stag Hill, University Campus, Guildford GU2 7XH, UK
*
Author to whom correspondence should be addressed.
Aerospace 2025, 12(7), 601; https://doi.org/10.3390/aerospace12070601
Submission received: 14 May 2025 / Revised: 13 June 2025 / Accepted: 19 June 2025 / Published: 1 July 2025
(This article belongs to the Section Astronautics & Space Science)

Abstract

A collaborative inter-laboratory study was conducted to characterise the performance of the novel 250 W External Discharge Plasma Thruster (XPT) with a channel-less Hall effect-type thruster designed to address lifetime limitations and lower-power efficiency challenges in conventional Hall effect thrusters. This study aimed to validate performance measurements across different facilities and thrust stands, investigating potential facility effects on thrust characterisation. Performance testing was conducted both at the University of Surrey using a torsional thrust balance and at the University of Southampton with a double inverted pendulum thrust stand, providing independent verification of the thrust and efficiency metrics. The comparison highlighted the importance of cross-facility testing with differing background pressures, calibration methods, and thrust balance types. These differences provide valuable insights, ensuring more robust and reliable low-power thruster characterisation. The XPT thruster demonstrated consistent performance across both the University of Surrey and University of Southampton facilities, with thrust levels ranging from 1.60 mN to 11.8 mN, specific impulses from 327 s to 1067 s, and anode efficiencies up to 11%. Higher anode voltages and mass fluxes at Southampton enabled extended operational envelopes, revealing performance plateaus at elevated powers, particularly for flow rates above 8 sccm. Cross-facility testing highlighted facility-dependent influences, with Southampton achieving a higher thrust and specific impulse at lower flow rates (5–6 sccm) due to increased anode currents, while discrepancies between test sites of up to 25% were observed at higher flow rates (8–10 sccm) and powers above 200 W. Characterisation identified an optimal operating range at 200 W of anode power with a mass flux below 8 sccm. This work underscores the importance of inter-laboratory validation in electric propulsion testing and provides insights into the best practices for assessing next-generation Hall effect-type thrusters.

1. Introduction

Hall-effect thrusters (HETs) are a mature and heavily adopted propulsion technology utilised in space today by a wide number of active spacecrafts [1]. This is due to several factors, including their simple design, higher thrust density, high thrust-to-power ratio, and robust capabilities compared with other electric propulsion systems.
However, HETs are less dominant in low-power applications, as scaling down Hall-effect thrusters leads to a sharp reduction in performance and lifespan [2,3]. This results from several phenomena but is primarily due to the increased interactions between the thrust-producing plasma and the thruster discharge channel. This increased rate of erosion results from the higher surface-area-to-volume ratio of the plasma in smaller, low-power HETs, as the surface area is approximately proportional to wall losses, while the plasma volume is approximately proportional to thrust production [2,4,5].
Research interest in “erosion free” Hall-effect thruster operation has motivated the implementation of several techniques to increase their lifespan, such as optimising the magnetic field to increase the plasma–wall sheath potential, reducing plasma–wall interactions, or increasing the width of the discharge channel. Magnetic shielding (MS) is one of these mechanisms for eliminating erosion; MS utilises a magnetic field orthogonal to the electric field at the mid-channel location but parallel at the edges of the channel width, which results in a plasma–wall sheath at the anode potential at the channel walls which reduces the energy of impinging ions, limiting erosion.
Magnetic shielding is harder to implement into low-power HETs because of the smaller dimensions. This is because of the fraction of the plasma lost to the plasma–wall sheath being too great for efficient operation in smaller, low-power thrusters. As a result, low power range alternative configurations have been considered.
An alternative approach to MS topologies for mitigating ion losses to channel walls is proposed, known as the wall-less or external plasma discharge strategy. This approach requires relocating the anode external to the body, eliminating the channel entirely in favour of an entirely external plasma discharge [6,7,8,9,10,11,12,13,14].
This work focusses on the development of a miniaturised external discharge plasma thruster (XPT) proposed to mitigate ion losses to the channel wall by sustaining the plasma discharge completely in the open space outside the thruster body. The XPT may also have some advantages over conventional Hall thrusters, such as a reduced mass due to less ferromagnetic components and no ceramic channel, which is often the most expensive component. A schematic comparison between a conventional Hall-effect thruster and the XPT is shown in Figure 1.
The magnetic circuit of such thrusters is formed by two regions—the closed magnetic mirror field (magnetic mirror region) and the open magnetic mirror field (cusped magnetic region)—and this results in a peak magnetic flux density that is much closer to the anode than in traditional annular Hall-effect thrusters. The magnetic field of the XPT tested here is illustrated in Figure 2. The anode is outside the thruster body and positioned downstream of the magnetic field peak. This configuration confines electrons from the hollow cathode in the E × B azimuthal direction. Furthermore, in the region on either side of the anode, where the electrical potential is low, the electrons will precess along the magnetic field lines, where they will be magnetically mirrored back into the bulk plasma, potentially enhancing electron confinement. Neutral atoms injected into the discharge region from the anode encounter the rotating electron cloud and are primarily ionised via electron-neutral collisions. Electron motion along the axis is limited by the radial magnetic field, enabling the quasi-neutral plasma to sustain a strong axial electric field.

The Role of the Ground-Testing Facility

At higher chamber pressures, increased collisions between electrons and background neutrals enhance electron cross-field transport, shifting the ionisation and acceleration regions upstream. In conventional Hall-effect thrusters (HETs), this results in higher velocities within the discharge channel [15]. As the background pressure increases due to reduced pumping capacity, ionisation efficiency is artificially enhanced, potentially leading to improved thruster performance. This effect is attributed to the ingestion of background neutrals.
Additionally, plasma plume properties are affected by interactions between the background neutral flow and the thruster plume, increasing collisions between plasma and neutral particles. This leads to more pronounced charge-exchange (CEX) collisions, particularly at high angles with respect to the thruster axis. Facilities with lower pumping capacities also exhibit higher beam current densities due to the elevated chamber pressure compared with lower-pressure environments [16].
Several studies have attempted to characterise the influence of ground-testing facilities on HET operation [17,18,19]. However, this research has primarily focused on high-power thrusters (>1 kW), which require large propellant flow rates, placing greater demands on vacuum system pumping capabilities. In contrast, low-power electric propulsion systems can typically be tested at consistent pressures within large vacuum chambers. This poses challenges when access to large facilities is not available. Therefore, a better understanding of facility limitations and the effects on EP testing, especially concerning flow rate constraints in smaller vacuum chambers, is needed.

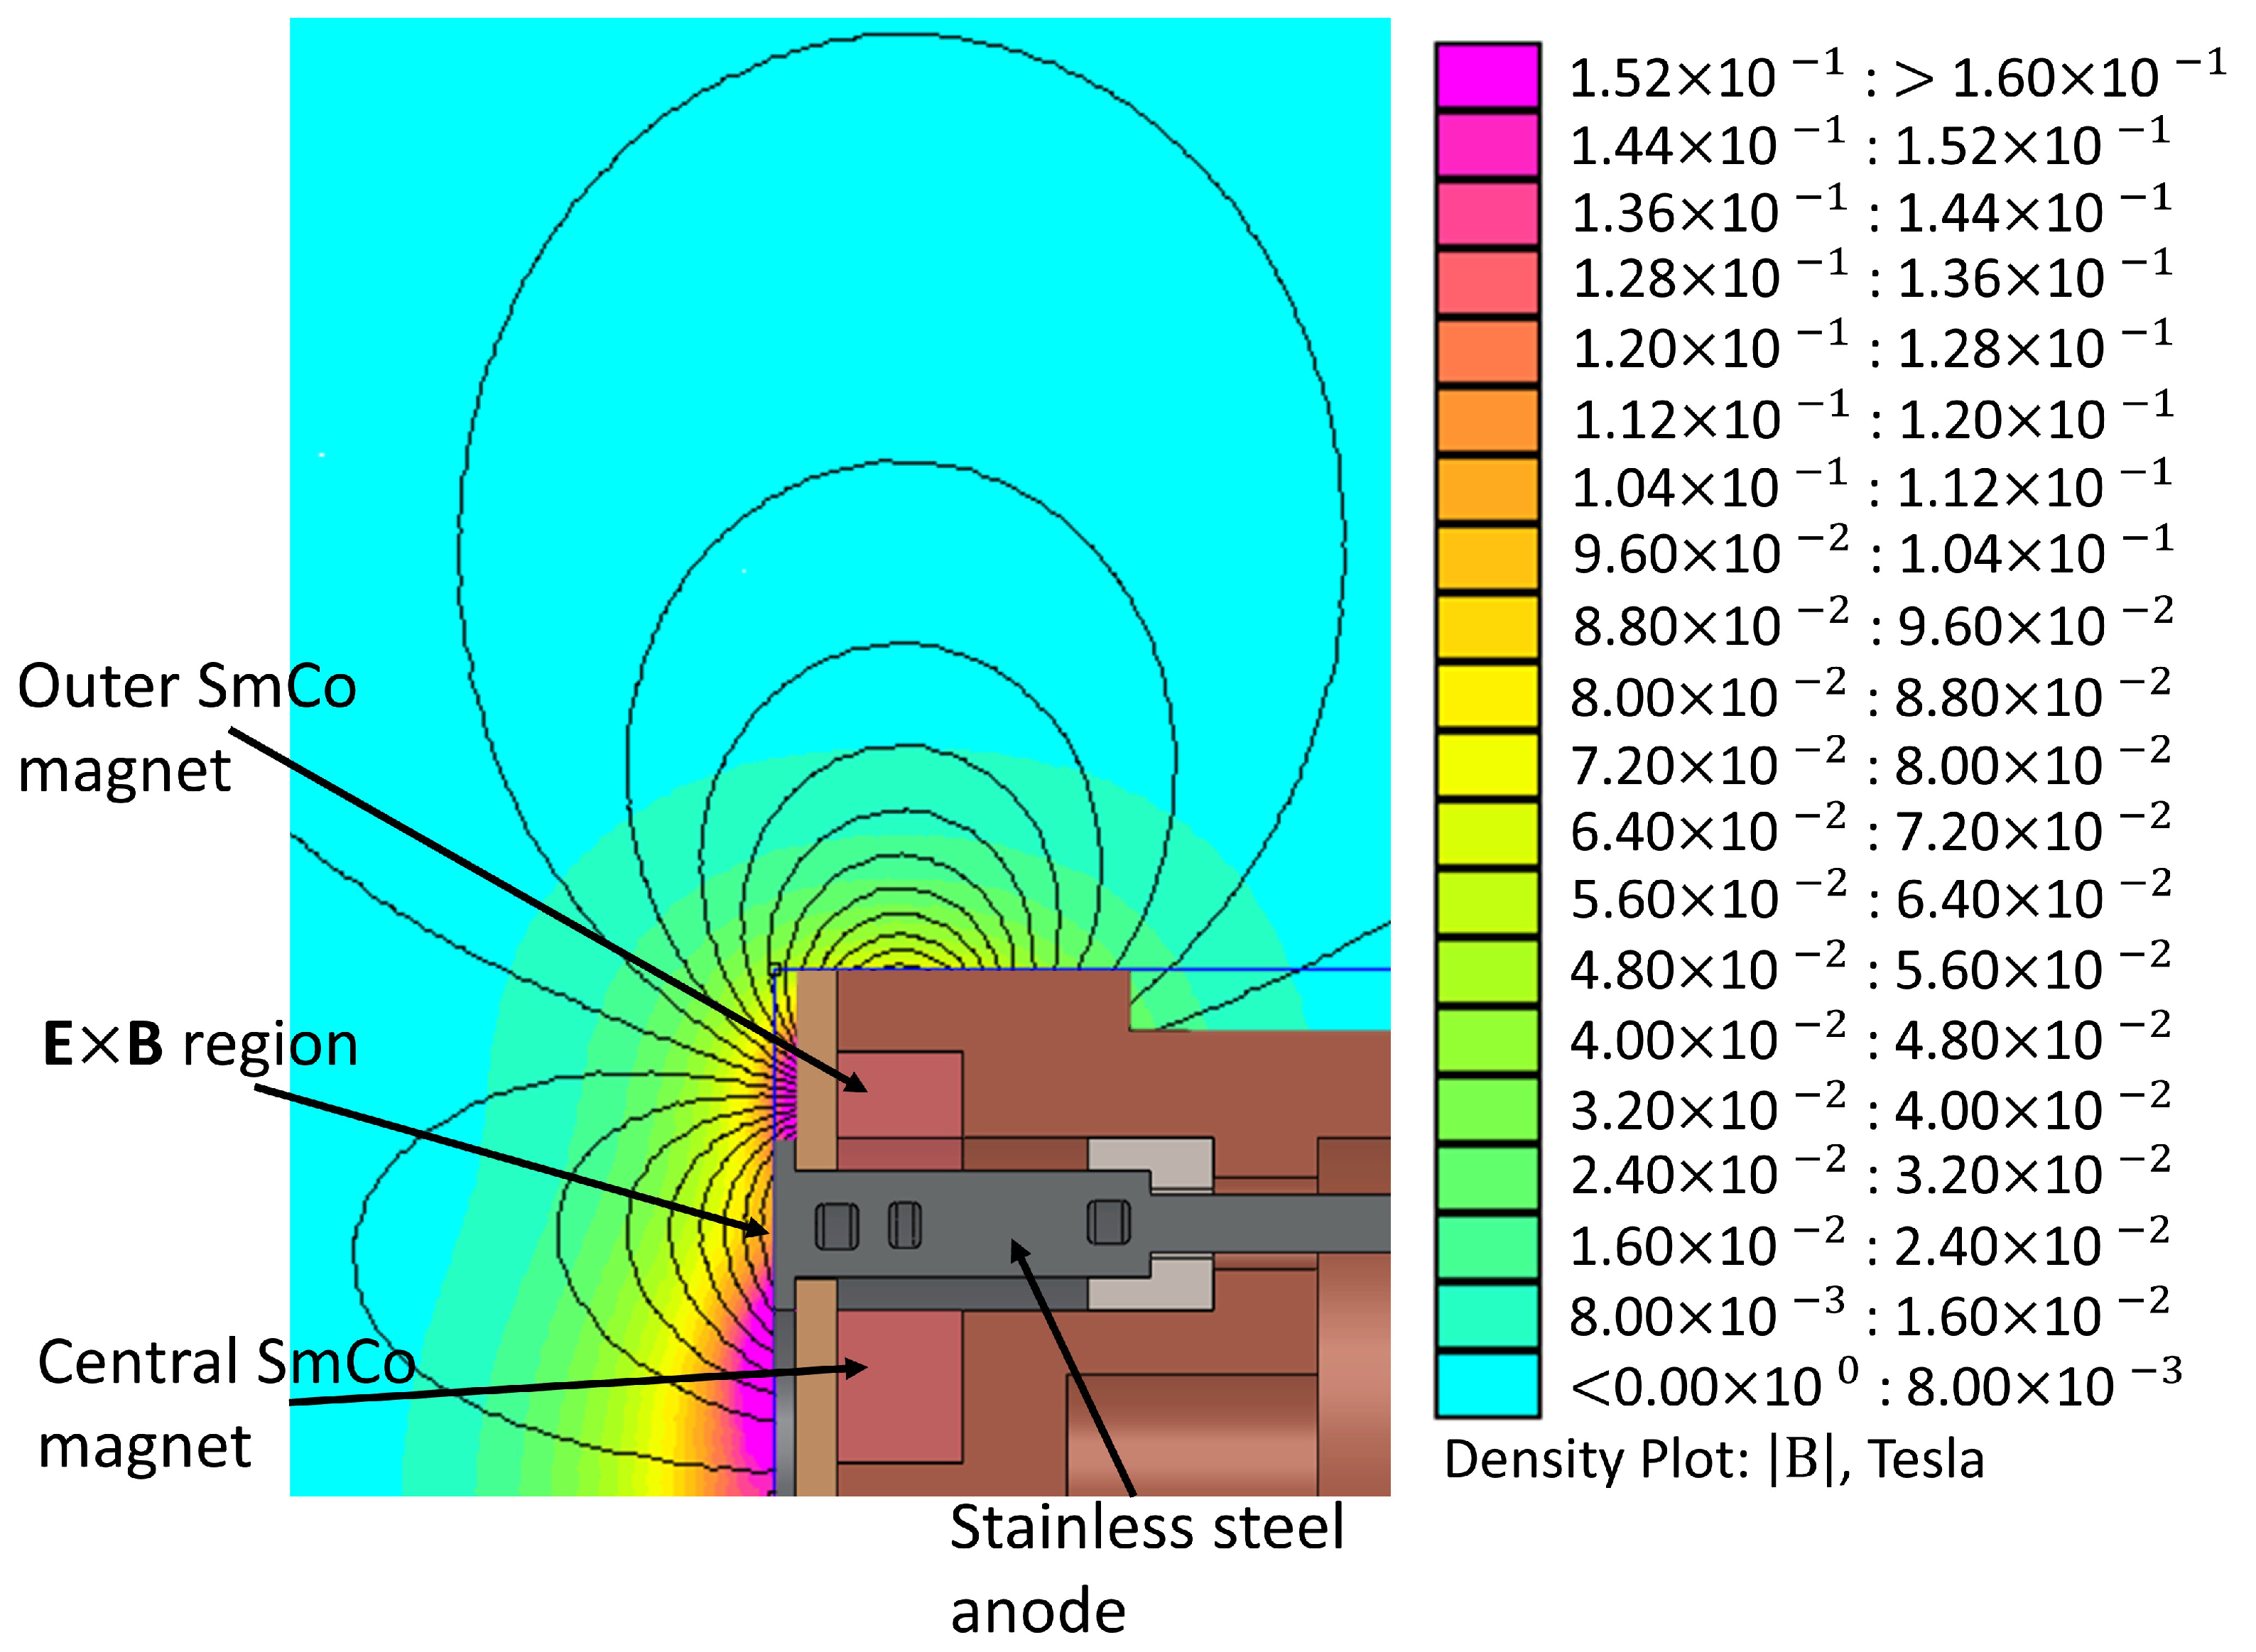
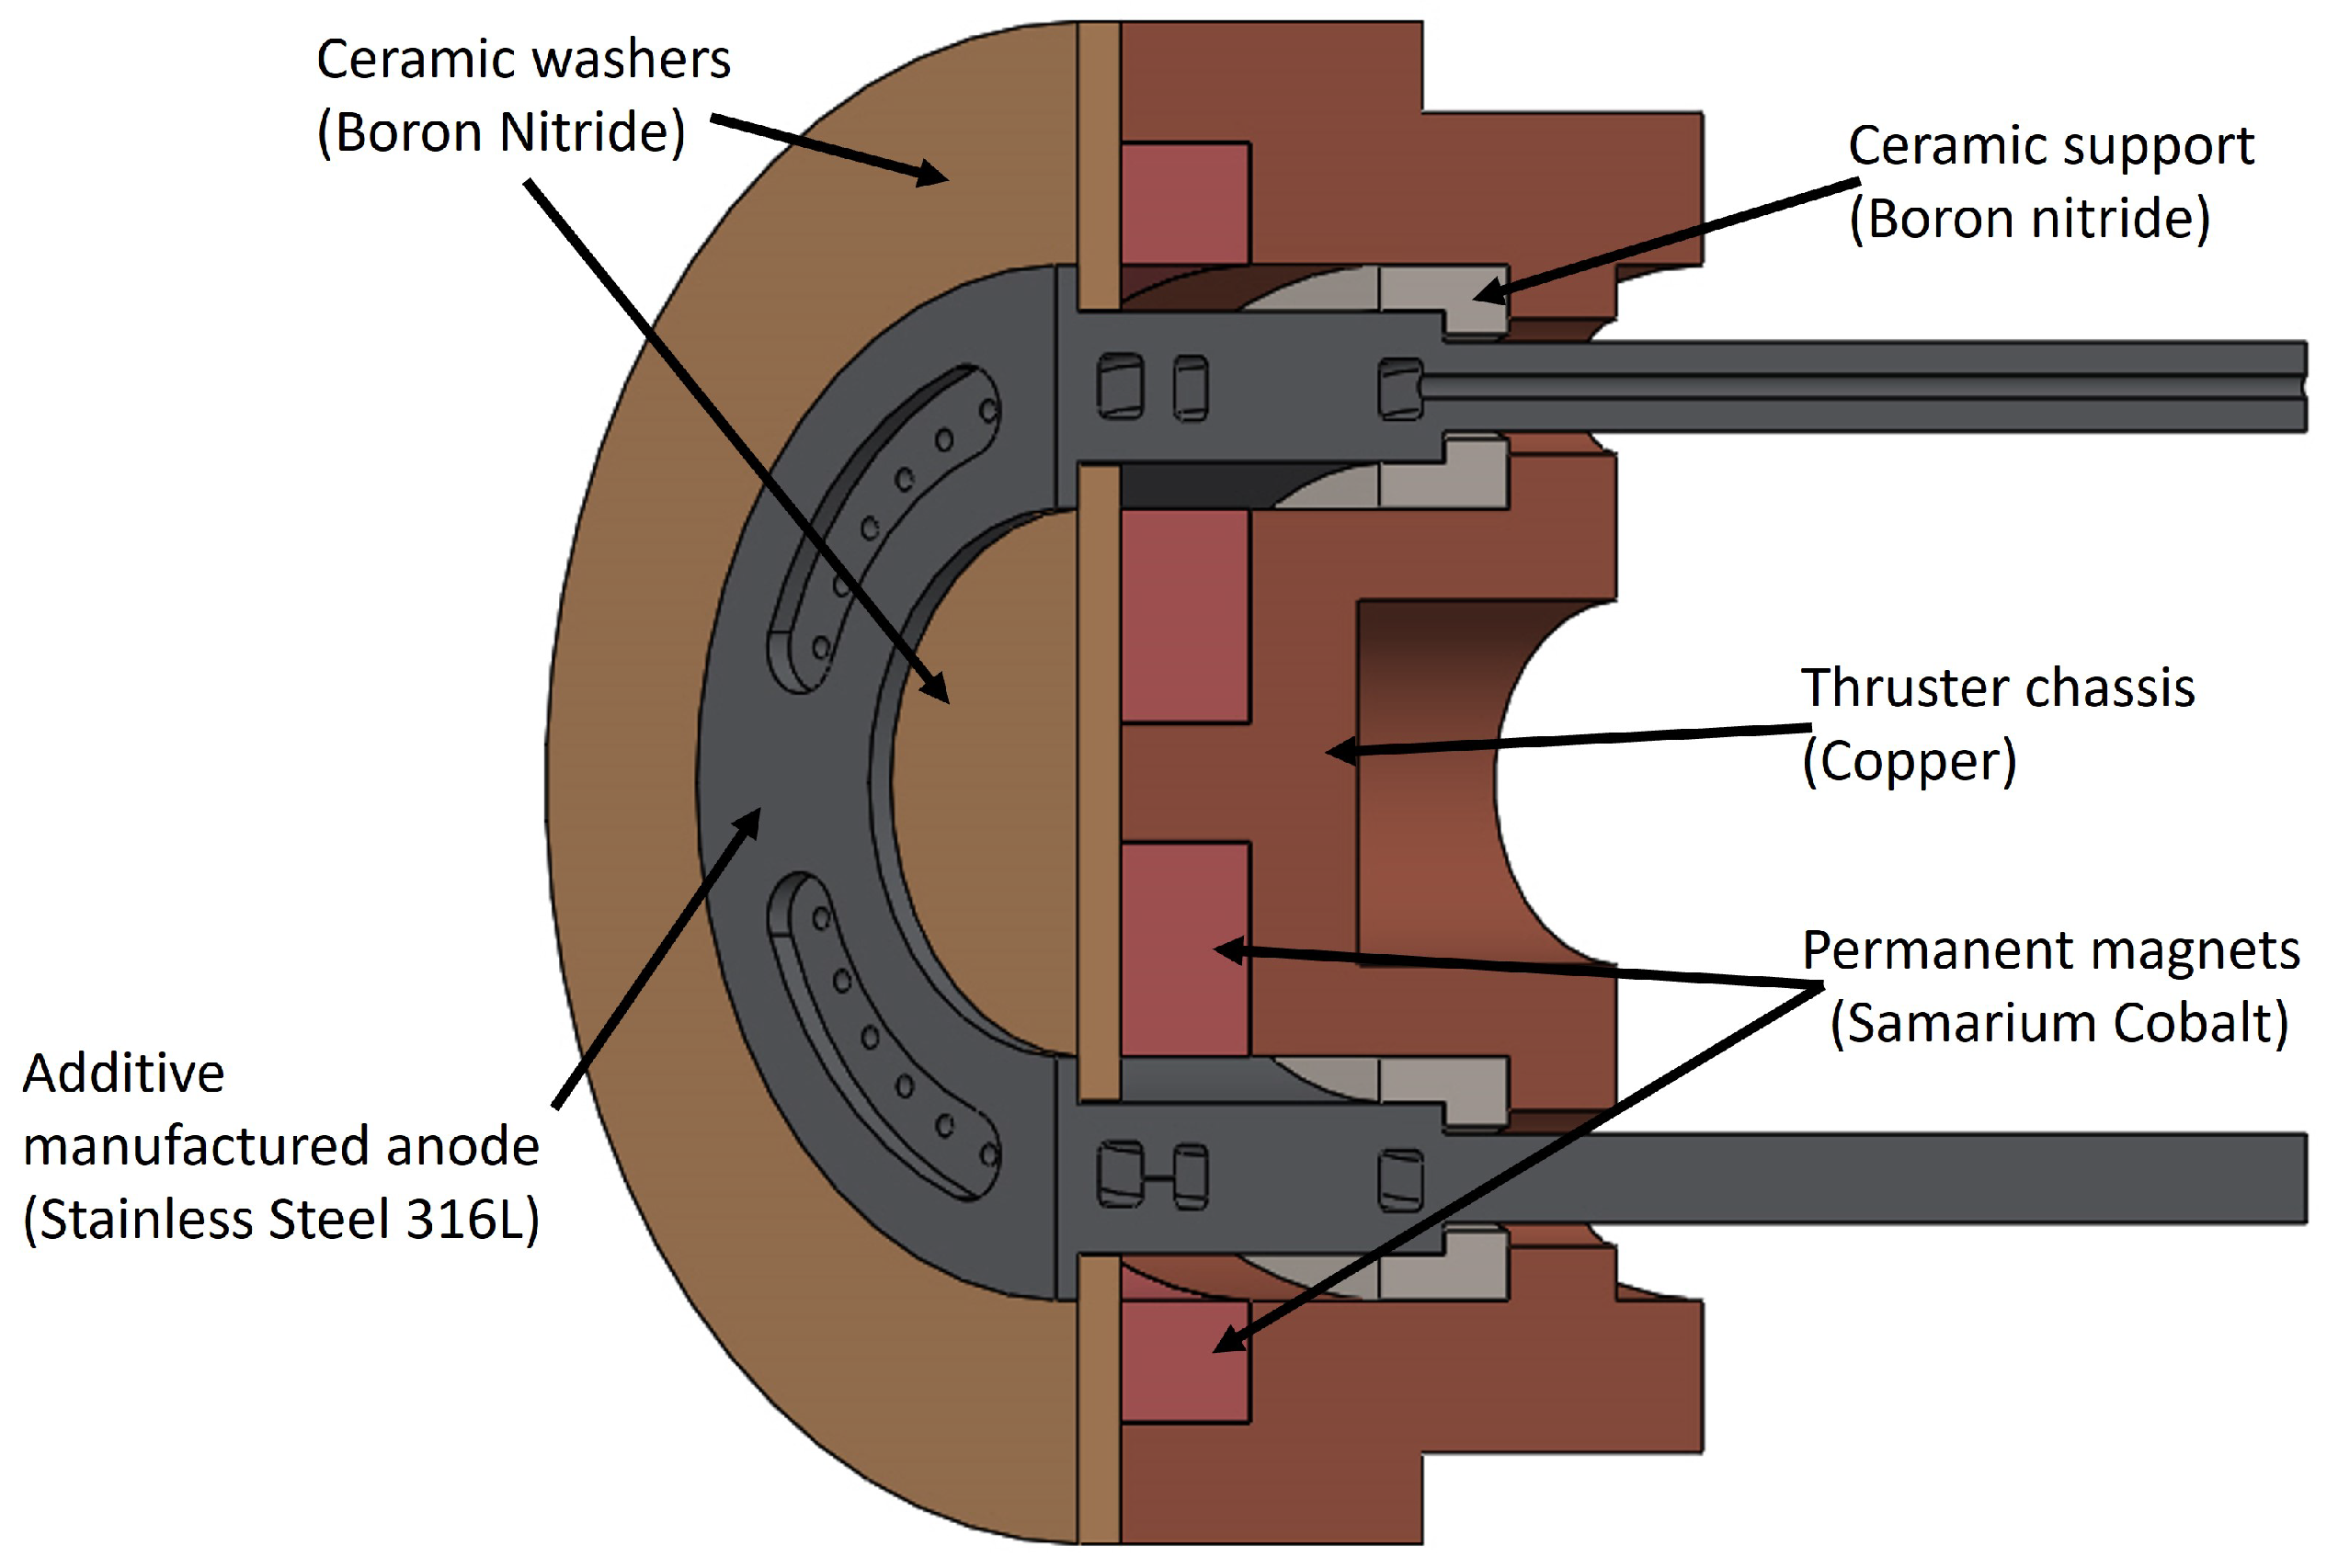
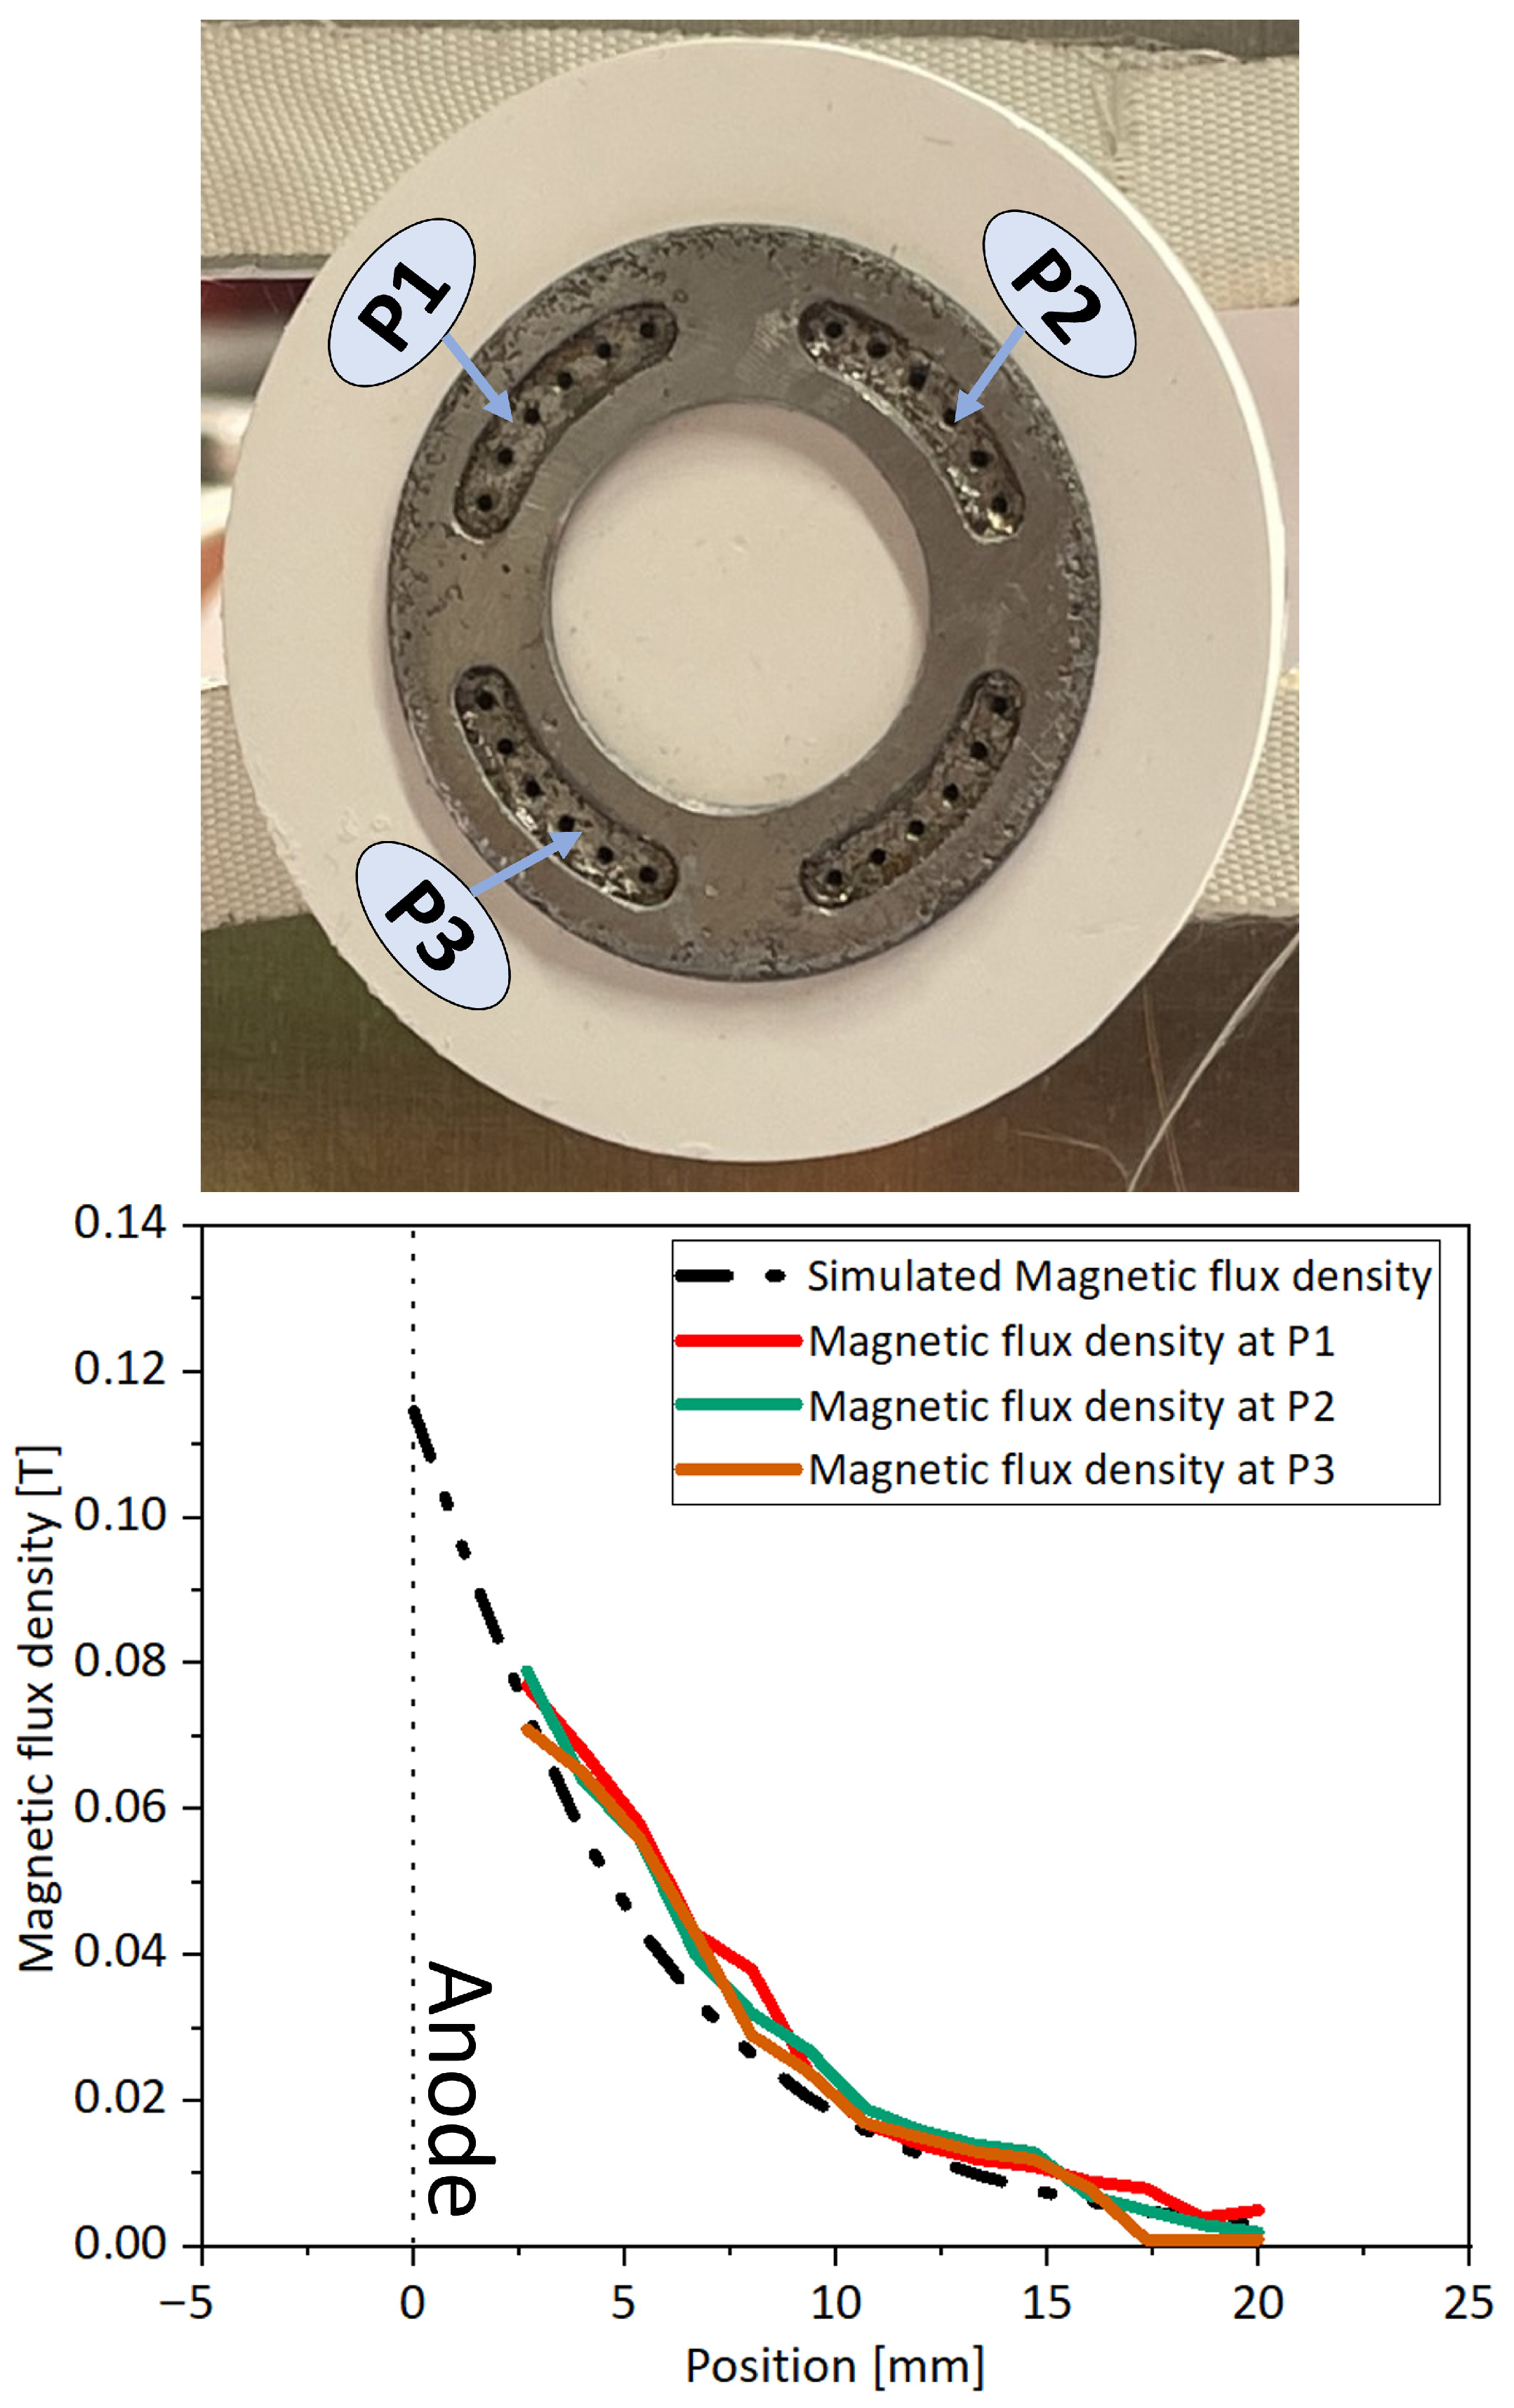
2. Development of the External Discharge Plasma Thruster

The XPT utilises a similar physical phenomenon as that of a standard HET but forgoes the use of a discharge channel and moves the entire magnetic circuit behind the anode. This is shown Figure 3, where the anode can be seen to extend past the thruster body. The magnetic circuit comprises of a pair of hollow cylindrical permanent samarium cobalt (SmCo) magnets positioned behind the anode. The thruster developed and investigated in this work is similar to the XPT studied by B. Karadag et al. in [10] in terms of critical design parameters, e.g., magnetic circuit geometry and anode front geometry. According to recommendations by B. Karadag in [20], the anode here is redesigned to extend its rear surface within the thruster, enhancing the thickness and heat conduction. Moreover, the anode’s design enables additive manufacturing and allows direct propellant injection. The thruster diameter was reduced to 50 mm in comparison to the previous design, which had a diameter of 76 mm [21].
The anode ring is located at the front face of the thruster, with the anode extending partially beyond the propellant injection plane as seen in Figure 3. The assembly consists of a ring-shaped anode with a 34 mm outer diameter and an 18 mm inner diameter additively manufactured from stainless steel. The propellant passes through an internal buffer chamber and is injected in the discharge region through holes 0.7 mm in diameter and located on a circumference 26 mm in diameter The anode includes four slots with six holes each and a slot width of 3 mm. The total number of supply holes is 24, distributed across the four anode slots.
The magnetic flux density and topology, like traditional HETs, is important for the XPT’s design, and they were simulated and measured during the design and testing phases. The results of these simulations and measurements, illustrated in Figure 4, were obtained through both computational modelling and direct measurements of the manufactured thruster. Finite element method magnetics (FEMM) was used to model the magnetic circuit, presented in Figure 2. The magnetic flux density of the manufactured thruster was measured at the injection point of the anode using a Gauss probe. The field strength was measured axially away from the anode starting at 3 mm, as illustrated in Figure 4.

3. Experimental Set-Up

The primary goal of this collaboration was to validate the performance of the XPT thruster across two facilities with differing pumping capacities and test set-ups, providing critical insights into thruster operation and performance under varying environmental conditions. At the University of Surrey, the XPT was investigated by sweeping the anode voltage from 100 V to 250 V at different mass fluxes of xenon to the anode. The cathode operation remained constant across both test sites, and this will be discussed further in Section 3.1. The anode xenon mass flux was varied from 5 sccm to 10 sccm. This was due to the relatively smaller size and lower pumping capacity of the facility at the University of Surrey. At University of Southampton, the XPT was investigated by sweeping the anode voltage from 100 V to 400 V for multiple anode xenon mass flux values from 5 sccm to 14 sccm.

3.1. Modular Hollow Cathode Neutraliser

The modular hollow cathode neutraliser (HCN) from Surrey Space Centre is designed for thruster coupling at anode currents of 0.5–4 A and a cathode volume flow rate between 1 and 3 sccm using xenon or krypton [22]. The modular HCN consists of interchangeable parts connected by mechanical fasteners. The cathode includes a keeper disk, an orifice disk, tungsten impregnated with barium oxide emitter, and a heating element. The heating element consists of three boron nitride hollow cylinders and a refractory metal wire. The keeper disk has a 23 mm outer diameter, a central hole 2 mm in diameter, and a 2 mm thickness. Additionally, the cathode’s length (from the keeper disk to the ceramic base) is 50 mm. The ceramic cylinders are in concentric alignment with two rows of holes aligned azimuthally. Figure 5 illustrates the modular HCN, featuring two 50 mm molybdenum studs for biasing the keeper and heater, adapting the design from [22].
Igniting the cathode requires 130 W of heating power, while a 250 V voltage is applied to the keeper with a 3 sccm mass flux. During ignition, the keeper current is restricted to 2.5 A to prevent excessive current. Once ignited, the mass flux, keeper current, keeper voltage, and heater currents are maintained to be consistent between test sites and these campaigns. The values used in the experimental campaign are reported in Section 4.

3.2. Experimental Facilities

Background pressure is known to affect plasma thruster performance measurements through neutral gas ingestion into the discharge channel and increased neutral gas density within the plume region [23,24]. This results in a higher probability of collisions between neutral particles and charged particles, which in turn influences the ionisation processes and plume characteristics [25].
A thruster’s sensitivity to background pressure depends on multiple independent parameters, including the input power level, magnetic flux density, and specific design or operational features. Cross-validation of a thruster across different vacuum facilities—with varying pumping capacities and configurations—provides preliminary insights into how facility-dependent conditions affect performance. This approach helps quantify the influence of facility characteristics, such as the pumping speed, chamber volume, and pump placement, on measured performance metrics. The key parameters of both facilities are summarised in Table 1.
Furthermore, the plasma structure in channel-less thruster designs differs significantly from that in conventional thrusters with a discharge channel, primarily due to the reduced plasma–wall interaction. Since the discharge occurs in “free space”, background pressure effects may play an even more pronounced role. Therefore, this work aims to offer an initial assessment of how ground testing facility characteristics—such as the chamber size, pumping capacity, and pump location—affect the performance of a channel-less thruster configuration by examining its discharge envelope and thrust-related metrics.

3.2.1. University of Surrey’s Facility

The Daedalus vacuum chamber, which was used for the Surrey component of the testing campaign, measures 1.5 m in diameter and 3 m in length, with a three-stage pumping system incorporating a two-stage roughing pump, one cryogenic pump (1325 L/s of Xe) in parallel with a cryopanel in 660 mm diameter and with a 250 MD Coolpower cold head (Leybold, Cologne, Germany) (16,800 L/s of xenon). This pumping set-up results in a nominal pumping capacity of 18,000 L/s of xenon and allows base pressures in the 6 × 10⁻⁶ mbar range without mass flux. The pressure is measured using a miniature dual filament ion gauge (KJLC 354 Series, Kurt J. Lesker Company, Columbus, OH, USA) with a built-in controller and display, with a typical accuracy of ±15% of the reading. The ion gauge is positioned at the end of the vacuum chamber approximately 120 cm away from the thruster set-up.

3.2.2. University of Southampton’s Facility

The Southampton campaign of the testing was carried out in the large vacuum chamber facilities at the University of Southampton. The 4.5 m-long chamber 2.0 m in diameter is equipped with one Oerlikon Leybold LV140C (Oerlikon Leybold Vacuum GmbH, Cologne, Germany) roughing pump capable of pumping 145 m3/h, two Coolpower 140T cryo compressors, two Coolpack 6000H 20K cold heads (Leybold, Cologne, Germany), which together can pump at 21,800 L/s nominal of xenon, and two MAG W 2200 iP (Leybold, Cologne, Germany) magnetically levitated turbopumps which combined results at a nominal turbo pumping speed of 4200 L/s. Together, these pumps give the large vacuum chamber at the University of Southampton a total maximum achievable vacuum of <9 × 10⁻⁸ mbar and an operational pressure of <5 × 10⁻⁵ mbar with 28 sccm of xenon injected [26]. The pressure was measured using the same ion gauge as the Surrey test, with the gauge positioned at the end of the vacuum chamber approximately 80 cm away from the thruster set-up.

3.3. Thrust Balances

Accurate thrust measurement is essential for the development of propulsion systems capable of delivering nano-, micro-, and milli-Newton thrust levels. Precise thrust control is critical for satellite operations including positioning, attitude control, de-orbiting, and formation flying manoeuvres. Direct thrust measurements provide a noninvasive metric to evaluate electric propulsion device performance.
Alongside thrust, controlled parameters such as the anode mass flux and discharge power were recorded, enabling the calculation of key performance metrics like specific impulse and efficiency. The specific impulse I s p can be calculated from the measured thrust as follows:
I s p = v c g 0 = T m ˙ a g 0
where v c is the average axial velocity of the propellant in the plume, m ˙ a is the neutral mass flux, T is the thrust, and g 0 is the standard gravitational acceleration.
The anode efficiency η a , defined as the ratio of the plume kinetic power to the input anode power P a , is given by
η a = P K E P a = 1 2 m ˙ a v c 2 P a = T 2 2 m ˙ a P a
Here, P K E is the kinetic power of the plume, and P a is the anode power.
It is important to note that when calculating error bars, the uncertainties in anode efficiency reflect the compounded effect of the squared thrust term. Given a thrust measurement with a small error δ T which could be positive or negative, we have
T = T real + δ T
and the corresponding effect on the anode efficiency is
η a = ( T real + δ T ) 2 2 m ˙ a P a = T real 2 2 m ˙ a P a + 2 T real δ T + δ T 2 2 m ˙ a P a
highlighting that even small thrust measurement errors can produce amplified uncertainty in calculated efficiency values.
It was expected that additional sources of error not fully accounted for by the calibration process might be present, such as thermal drift. Thermal drift in thrust measurements arises from the thermal load of the thruster, which can cause heating of nearby components, including propellant lines, electrical connections, and the thrust balance structure itself. This thermal input can lead to minor expansion of cables or changes in the spring constants of the balance, potentially introducing bias in the measured thrust.
However, these effects are significantly mitigated at low power operation, as thermal heating scales with the discharge power. In both test campaigns, the temperature of the thrust balance near the thruster mount was monitored, and no meaningful increase in temperature was observed. As such, thermal drift was considered negligible under the conditions tested.

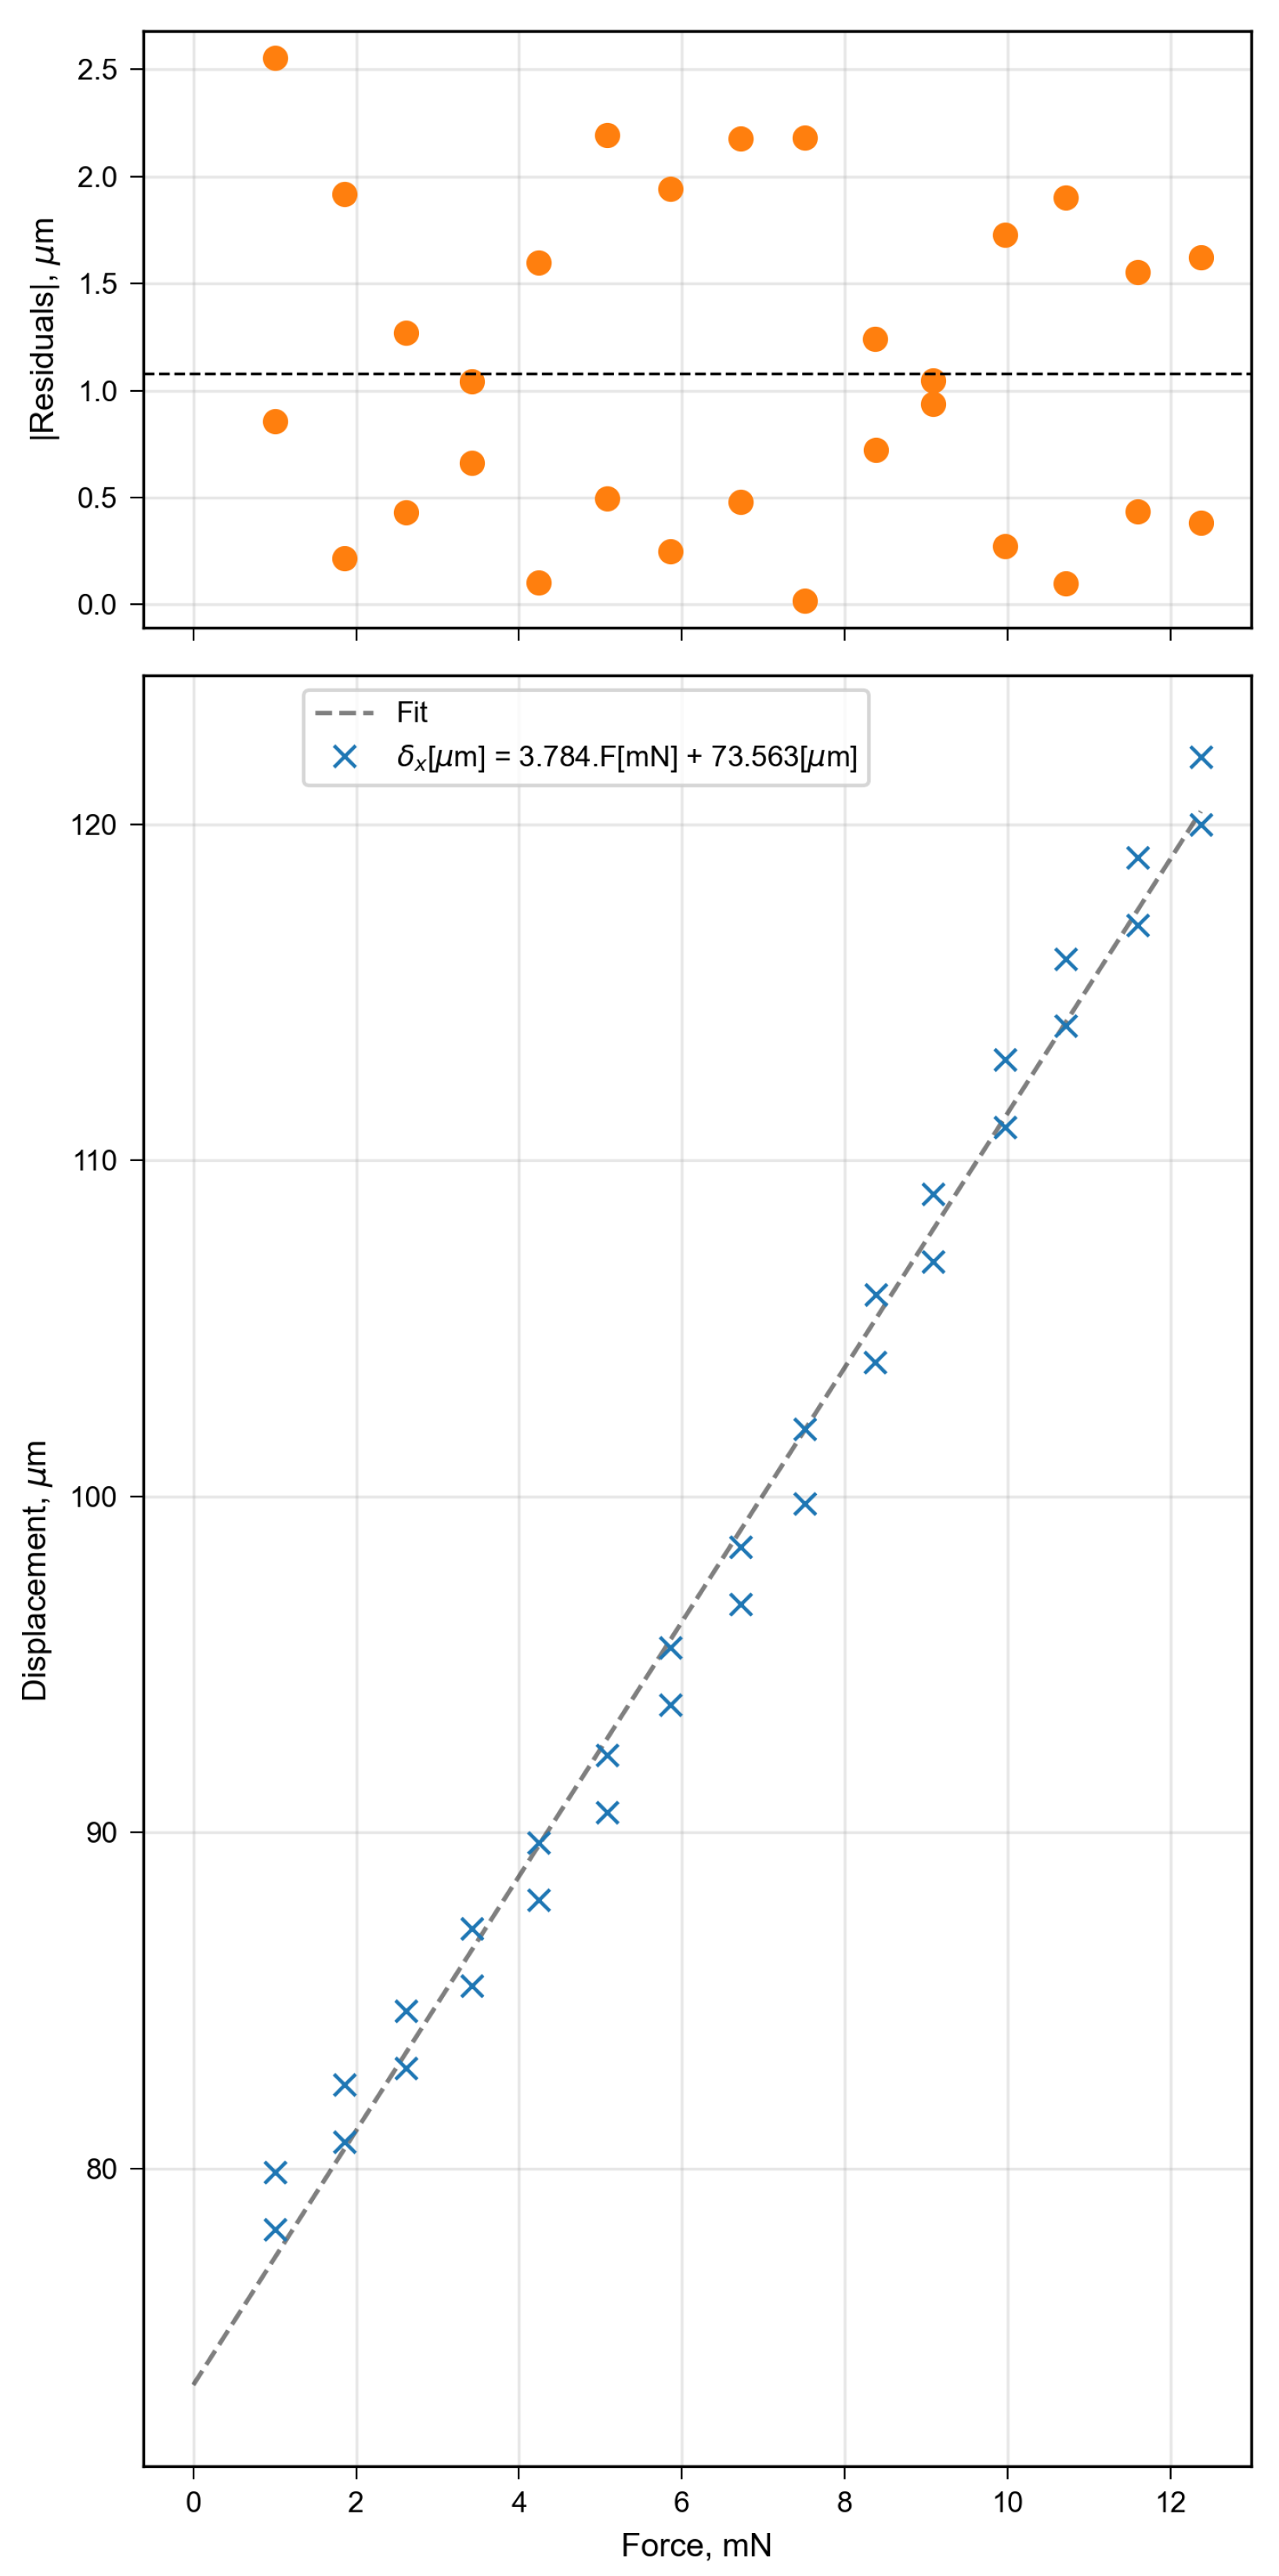
3.3.1. Calibration Coefficients

The University of Southampton’s thrust balance’s displacement in response to a calibration force is illustrated in Figure 6 to provide an example of the data processing method. The response of the stand can be seen clearly with the signal filter applied with the step response.

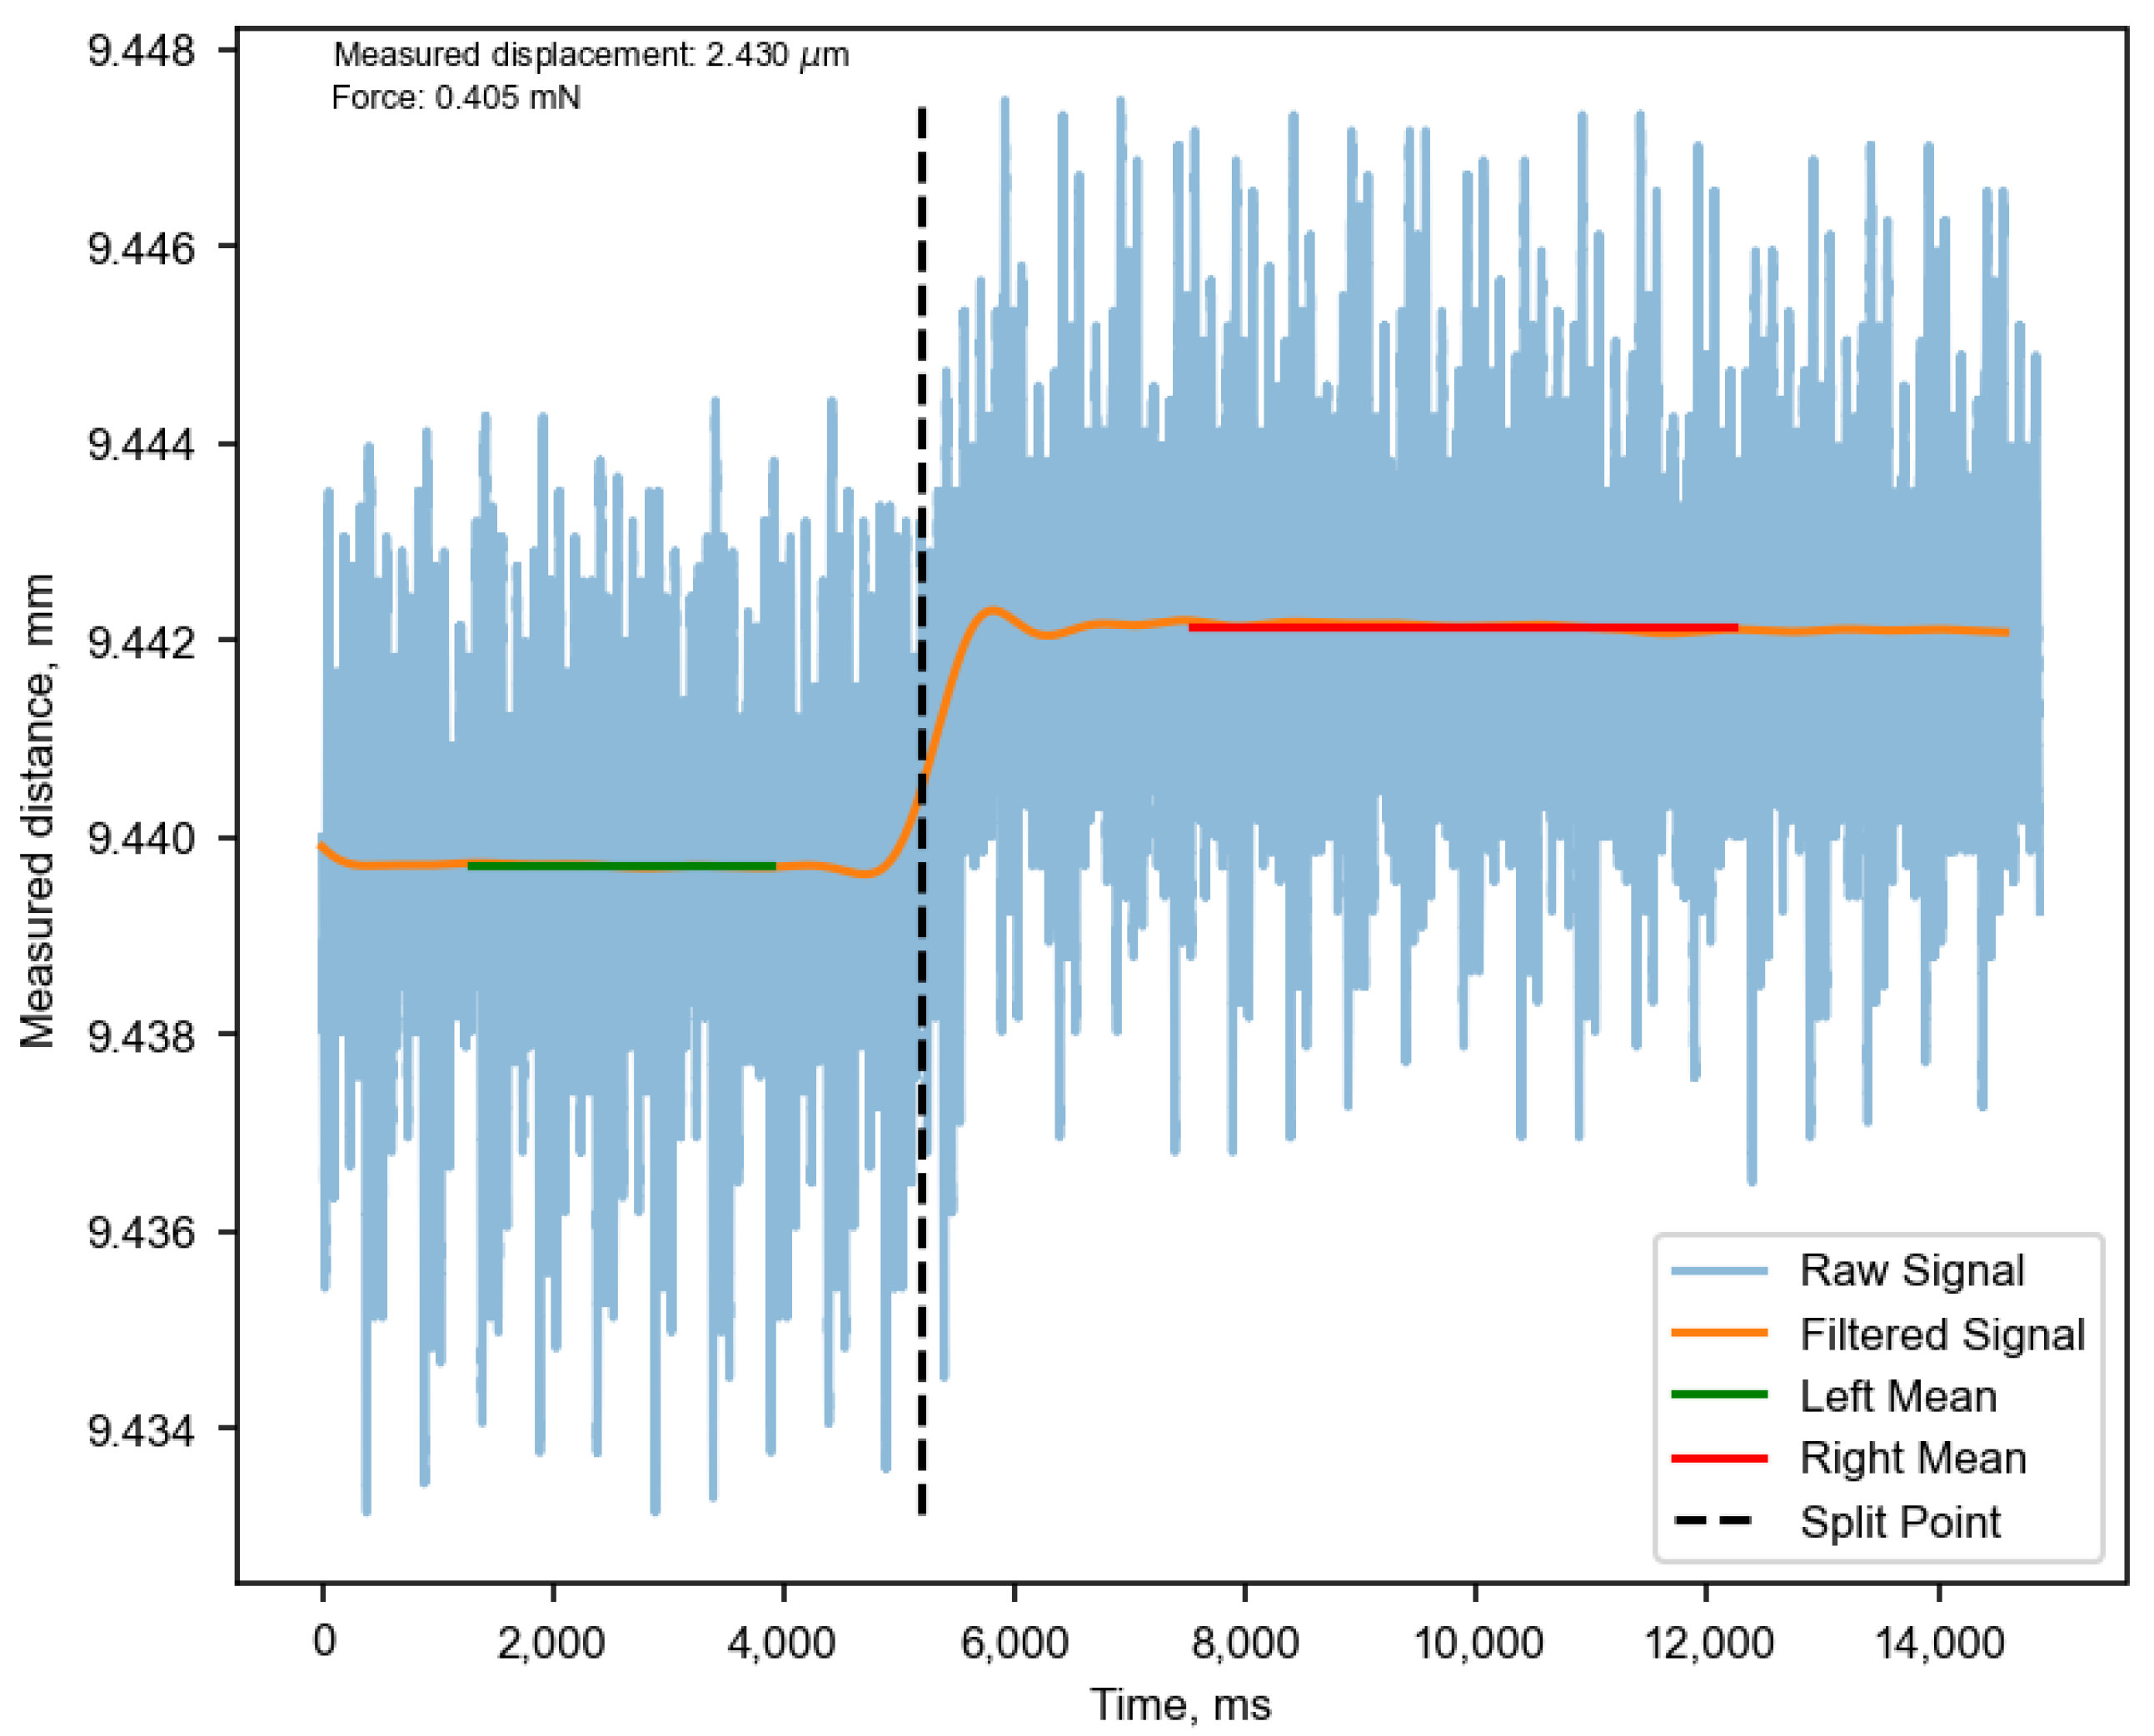
3.3.2. Quantification of Calibration Coefficients

To accurately quantify the errors and the calibration of both Southampton’s and Surrey’s system, the method outlined by Polk et al. was employed, and it will be repeated here using notation consistent with this body of work for completeness [27].
Firstly, during calibration, the displacement δ i of the thrust stand is measured with the laser triangulation sensor for the known force F i being applied. From these data, using a least-squares difference approximation, it can be seen that the expected displacement δ ^ i for the applied force is
δ ^ i = S c a l F i + b c a l
where S c a l and b c a l are the calibration coefficient and calibration offset, respectively. Here, the calibration coefficient has the unit of meters per Newton, and the calibration offset has the unit of meters.
For N number calibration points taken, an estimate of the variance of the random noise and error within the measurement can be seen:
s δ 2 = i N c a l ( δ i b c a l S c a l F i ) 2 N c a l 2
This approximation is assumed close to the actual variance of the balance for sufficiently high values of N c a l where it can be assumed that σ δ 2 s δ 2 , and taking the square root of this will provide the standard deviation of the thrust balance in meters. A more intuitive form would be to understand the deviation of the balance in force units, which can be accomplished via the standard deviation as defined by
σ F s F = s δ S c a l
Whilst this value provides information on the variances in the force value being measured, it is also important to know the deviation of the calibration coefficient itself. The deviation of the sensitivity s c a l can be estimated in the same manner shown below:
s c a l = s δ i N c a l ( F i F ¯ c a l ) 2
where F ¯ c a l is the average of each F i . Again, the same assumption is made that this measured value of the deviation is approximately the standard deviation for sufficiently large values of N that s c a l σ c a l can be stated.
The total uncertainty for a given thrust measurement is the aggregate of the displacement measurement uncertainty and the uncertainty of the thrust balance calibration coefficient (or the sensitivity). Firstly, the calibration error is simply defined as
c a l e r r o r = σ S c a l S c a l
With this, for the total error for a measured displacement δ and the thrust measurement T, the uncertainty can be calculated as follows:
σ F T = σ δ δ 2 + σ c a l S c a l 2

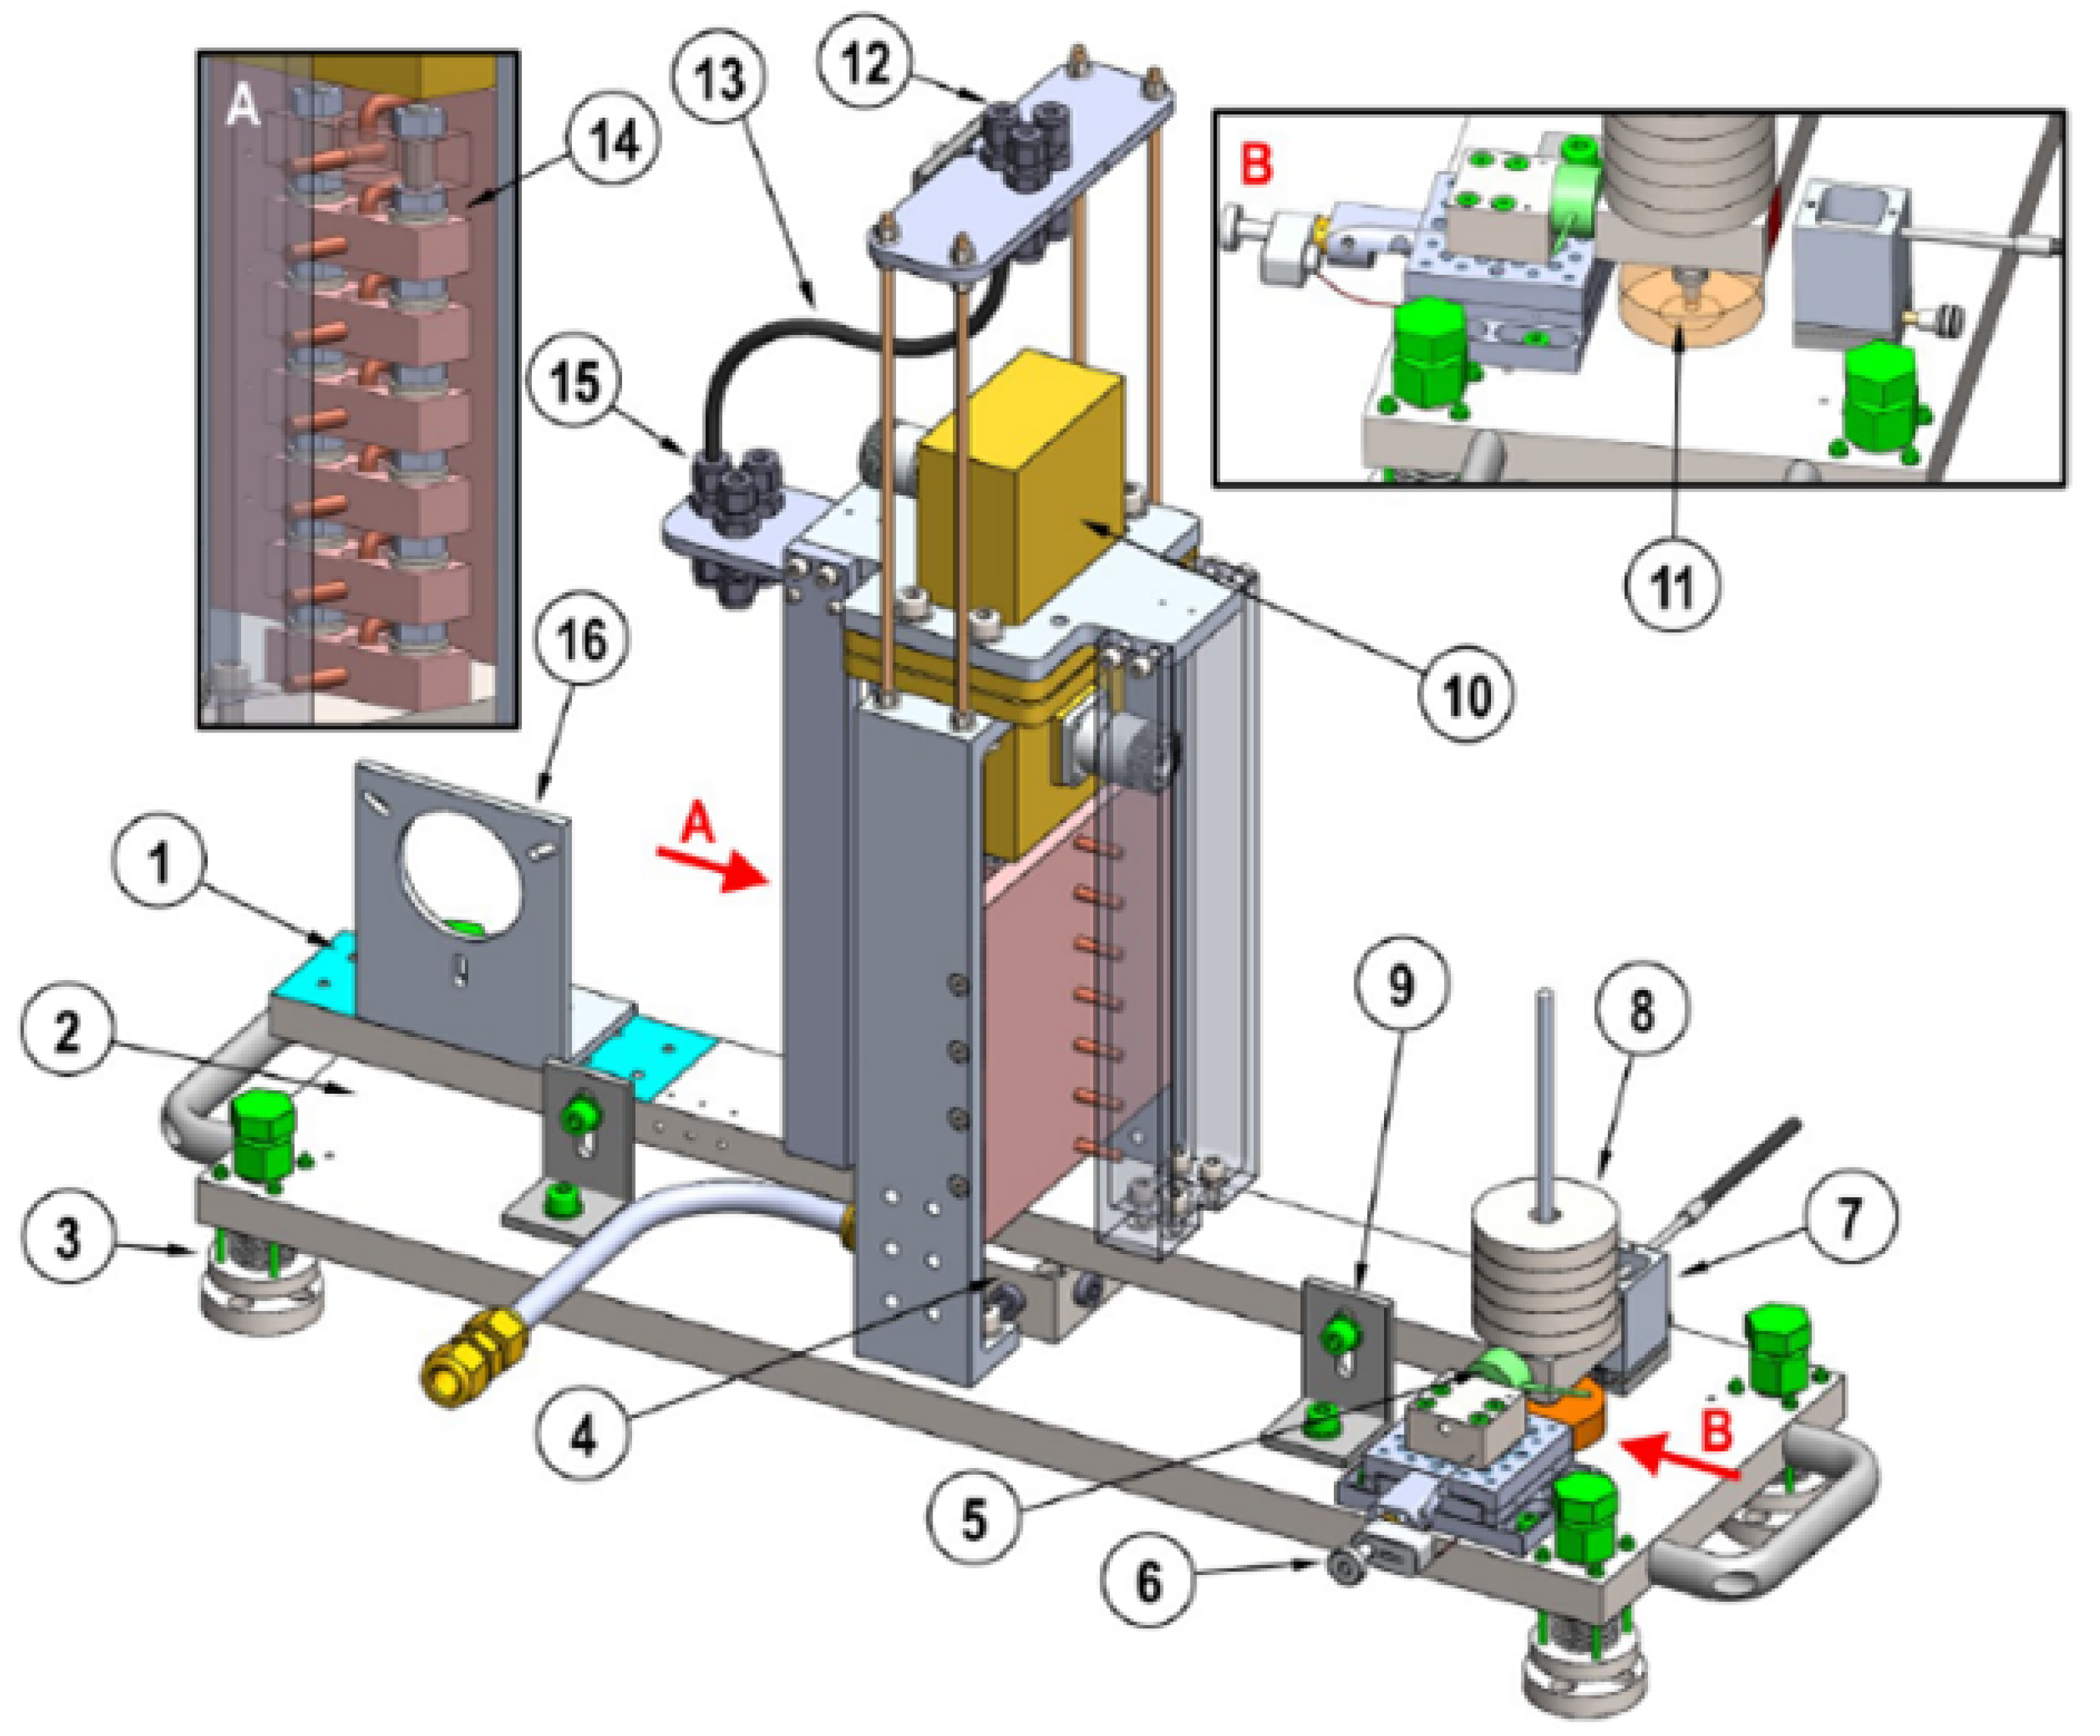
3.3.3. University of Surrey: Torsional Thrust Stand

Torsional pendulum thrust balances are unique when compared with the other pendulum types, as the gravity component of the thruster mass is out of plane for the measurement. This makes these types of stands largely independent on the thruster mass, particularly for smaller systems. Torsional balances have shown high sensitivity, making them incredibly well suited for electric propulsion applications. Torsional thrust stands are inherently more stable than inverted pendulum thrust stands due to the rotational axis and the gravitational axis being parallel [27].
At the University of Surrey, the thrust produced by the XPT is directly assessed through the torsional thrust balance, providing data for calculating performance metrics such as the thruster anode efficiency η a and specific impulse I s p , as discussed previously in Equations (1) and (2). In a general form, a torsional thrust balance consists of a long arm that is connected to a flexural pivot with the thruster mounted on the far end and some counterweight applied on the opposite end. The displacement can either be measured at the thruster end or at the far end of the arm after passing beyond the pivot. There is an extensive range of measurable thrust with a torsional stand, with some systems capable of being resolved to hundreds of nN [27,28].
The torsional thrust balance at the University of Surrey consists of a titanium beam with a torsional spring at its pivot. The thruster and cathode are mounted on one side, with counterweights on the other side for balance, as can be seen in Figure 7. The balance is aligned horizontally with vibration isolated. The mounting ensures that the thruster assembly’s centre of mass aligns with the beam’s midpoint to prevent imbalance. Torsional thrust balances make use of a rotational axis parallel to the gravity vector, resulting in the stand’s sensitivity being largely independent of the thruster mass [29]. These features make this stand ideal for applications where an extensive range of thruster masses is being tested [27].
The thrust generated causes a slight rotation of the balance beam, measured by an optical fibre displacement sensor (OFDS) beneath the counterweights. Calibration is completed through an automated process involving a Novatech load cell measuring a known force whilst the beam displacement is measured via MuDMS125 OFDS from PHILTEC (Annapolis, MD, USA) [29]. The OFDS measurements, typically in micrometres, are calibrated to determine the thrust values as explained in a later section. The stiffness of the torsional spring enables the creation of a linear calibration curve relating thrust to beam displacement. This linear association is valid for small rotation angles such that
x c a l L b e a m , c a l θ c a l
where x c a l is the measured linear displacement, L b e a m , c a l is the beam length between the pivot and the calibration load point (coinciding with where the OFDS measurement is taken), and θ c a l is the small rotation angle. Due to the small magnitude of θ c a l , the sine of the beam rotation is approximately equal to the rotation angle. The beam is rotated using a load cell driven by a stepper motor, which can be precisely controlled remotely for adjustment in micro-level steps applied to the balance beam. This method creates a torsional moment comparable to that produced by the thruster, which is located at an approximately equivalent lever distance on the opposite side of the beam. As a result, the calibration process for this balance is as follows:
S c a l = Δ x c a l F c a l
where F c a l is the applied calibration force measured by the load cell. A thrust T, produced at a location L T from the pivot, will produce a displacement of x T such that
T = Δ X T S c a l L c a l L T
The torsional thrust balance incorporates several liquid conducting reservoirs to avoid the stiffness of the DC cables influencing the thrust measurement, as well as a wireless microwave power transmission element in case of testing microwave thrusters (not in these tests). The thruster chassis is electrically isolated from the grounded chamber and thrust balance.
The torsional thrust balance calibration process involves applying known forces to the balance using the Novatech load cell. Starting from a stable state where the load cell is in contact with the balance and the output load being approximately 0 mN, a piezo-motor is remotely operated to translate the load cell towards the rotating beam. This applies a force to the balance, which is measured by the load cell as the compressive reaction force. The process of displacing the balance via the piezo-motor for a small distance and recording the reaction force via the load cell is repeated until a predetermined maximum force is measured. For this application, 12 mN was the target, as this is the expected maximum thrust the thruster can produce. Subsequently, the load cell is withdrawn by the motor, and the balance is returned to its original position. Utilising the initial and extreme positions as reference points, the linear actuator shifts the load cell across this range, introducing a set of evenly spaced calibration force values. Concurrently, the OFDS records the motion of the rotating beam.
The calibration process was conducted within a thrust range of approximately 0.2–12 mN, employing 15 load values with a 30 s dwell time for each. The calibration’s linear fit, depicted in Figure 8, used data from 30 observations of the thrust stand’s response to comparable input forces. These observations were derived from two repetitions of the calibration process conducted across the target thrust range. Raw data from the OFDS (beam displacement) and load cell (input force) were processed using a MATLAB R2022a code, which applies a fifth-order low-pass Butterworth filter with a cut-off frequency of 0.5 Hz. The load and displacement values were computed as the differences between consecutive steps, and their mean values were evaluated for each step. The MATLAB code interpolates the load cell output with OFDS readouts and, via least-squares interpolation, statistically estimates the calibration fit. For the case shown in Figure 8, which was acquired for the XPT experimental set-up, the balance exhibited a stiffness of 0.269 mN/μm, and the square of the correlation coefficient R2 was 0.995. More information on the accuracy and resolution of the thrust measurements and the thrust balance can be found in [29]. The error associated with the calibration was computed via the equations described in Section 3.3.2, with the statistical parameters listed in Table 2.

3.3.4. University of Southampton: Inverted Thrust Stand

The University of Southampton developed a high-thruster-mass double inverted pendulum thrust stand capable of measuring thrust with high precision and repeatability. This design differs from conventional pendulum thrust balances in how it resolves gravitational forces. In an inverted pendulum configuration, any gravitational component from the thruster mass destabilises the system rather than acting as a restoring force. As a result, the primary restoring forces are provided by the spring loads from the pivots or a dedicated load spring. This design enables high sensitivity, effectively decoupling the balance’s response from the thruster mass. However, due to the dominant role of the spring forces, the system may be more susceptible to thermal drift than other configurations.
The inverted pendulum design can be further refined into a double pendulum configuration, where a secondary pure pendulum section extends below the pivot point. This refinement offers two key advantages. First, for high-mass thrusters where excessive instability may arise, a counterweight can be incorporated to fine-tune the system’s sensitivity without increasing stiffness. Second, by measuring the displacement between the thruster mounting plate and the counterweight mounting plate, the system achieves a twofold mechanical amplification of the thrust signal. This amplification enhances sensitivity while maintaining system stability, making it well suited for precision thrust measurements in electric propulsion testing.
A key feature of this thrust stand is its adjustable sensitivity, which is achieved through the use of counterweights. By modifying the mass of these counterweights, shown in Figure 9, the sensitivity could be precisely tuned to meet the specific requirements of each experiment. This capability is especially beneficial when testing thrusters that generate low thrust levels, such as those in the sub-mN range, ensuring that even the smallest thrust variations are accurately captured.
Beyond counterweight adjustments, the thrust stand’s sensitivity can also be refined by varying the length of the flexure. This approach allows for precise control over the system’s mechanical response, further enhancing its ability to detect small thrust forces. By optimising the flexure length, the thrust stand can be tailored to the specific characteristics of the thruster under evaluation, improving both measurement accuracy and reliability.
The thrust balance stands at 715 mm tall from the base to the thruster mounting plate and 1460 mm from the base to the highest point. The frame is 570 mm × 450 mm × 665 mm, and these dimensions were chosen to accommodate a broad range of uses and enable potential future chemical propulsion tests in a vacuum. The final design can be seen in Figure 10. The waterfall cable management crossbeam can be seen, and the cathode and diagnostic mounting points can be seen at the top.
For the calibration process at the University of Southampton, a known mass is suspended from the thruster mounting plate by a plumb line of fine wire with a diameter of approximately 70 μm. This mass is also attached via another wire to a linear displacement motion stage. To apply a calibration force that is parallel to the thrust axis, the mass is displaced tens of millimetres by the motion stage such that the horizontal component of the tension in the line applies a force to the thrust stand that is known via the following equation:
F c a l = δ M c a l g 0 P y 2 δ 2
where F c a l is the resulting known calibration force, δ is the small distance the mass is displaced, P y is the distance that the mass is hung from, M c a l is the calibration mass, and g 0 is the gravitation acceleration, assumed here to be 9.807 m/s2.
The displacement is measured with a laser triangulation sensor, specifically an ILD1750 sensor with a resolution of 0.1 μm and a sample frequency of 5 kHz. An example of the calibration reading can be seen in Figure 6. The raw signal is processed first with the use of a Butterworth signal filter, and then a low-value ( 0.1 < N / f s a m p l e ) moving mean is applied. This filtered signal is subsequently differentiated to find the point of peak rate of change, assumed to be the midpoint of the step. The signal is then split about this point. Both segments of the remaining signal are then averaged to find the steady state values before and after the step with the dynamic transition omitted.
However, there are several other sources of error that can be introduced into the system that were not directly accounted for. For example, thermal dissipation to the balance could affect the spring coefficient of the balance as well as the electrical connection. These effects are practically impossible to take into account in the system, but in operation and re-calibrations after test firing, it seems that the effects were negligible when compared with the initial resistance of the balance.
As can be seen in Figure 11 and Table 3, the thrust stand had a sensitivity of 5.484 μm/mN. Moreover, the ability of this balance to be calibrated in situ with low error was established here, with a calibration error <1% being achieved.

3.3.5. Comparison of Calibration Results

Comparing the calibration results of each balance provides insight into their relative sensitivities and measurement limits. Each calibration run consisted of 30 individual measurements. For the University of Surrey calibration, this comprised 15 unique force values, each repeated twice. In contrast, the University of Southampton calibration used five unique force values, each repeated six times.
However, as shown in Table 4, the University of Southampton calibration ultimately included 28 data points, as two measurements were excluded due to being deemed erroneous. These exclusions can be attributed to several possible sources of noise in the laboratory environment, such as slamming doors, dropped tools, or work being carried out on the vacuum chamber hatch. Given the high sensitivity of the sensor, vibrations from a wide range of external sources could introduce significant noise, potentially leading to the rejection of calibration steps.
It can also be seen in Table 4 that the University of Surrey calibration had a large offset value. This was not due to any error but rather the absolute distance from the sensor being recorded instead of a relative location.
The data from Table 4 can be used to create the error bar magnitude for a measurement taken with either of the balances. To compare the results of the calibrations without needing a force measurement, the aggregate error as a percentage of the measured force can be quantified using Equation (10). At low force measurements, the error percentage grew exponentially, but the value of the force approached zero at the same rate such that at low values of measured force, the error would approach the resolution σ F .

3.4. Mapping the Ion Flux Using a Faraday Probe

In the Daedalus chamber at the University of Surrey, a rotating arm holds a planar Faraday probe for mapping the ion current’s angular distribution, as shown in [30]. A molybdenum disk 20 mm in diameter serves as the collector, which is encased in a boron nitride (BN) housing. It includes a guard ring with a 30 mm outer diameter and is biased at −30 V to saturate the ion current using a TTi CPX200D DC power supply (180 W) grounded to the facility’s vacuum chamber. This probe design is akin to the one used in [31] to evaluate ion beam current for determining both the current and mass utilisation efficiencies of a comparable XPT. The collector and guard ring are made of high-purity molybdenum to minimise sputtering and ion-induced secondary electron emission (SEE). They are isolated by a BN insulator designed in two parts for easier production, with vent holes in the ceramic base.
In hemispherical, axisymmetric coordinates centred on the anode plane, the ion beam current was calculated. Measurements took place at a 25 mm offset with a 200 mm constant arm radius from the centre of the thruster’s frontal plane, a sweep velocity of 1°/s, and an effective sweep angle ranging from 0 to 83°. Errors in estimating the beam current can occur due to variations in the distance between the thruster and probe caused by the offset during rotation. To prevent overestimation, the beam current calculation uses a minimum effective radius of 200 mm. The Faraday probe rotates from 0 to 83° before using the thruster, with the cathode at a keeper current of 2.5 A and a mass flux of 1 sccm. The picoammeter records a probe current of 4.5 × 10⁻⁷ A at the thruster’s edge and 9 × 10⁻⁷ A at the centreline, both three orders of magnitude lower than during thruster operation. The ion current from the thruster discharge, hitting the Faraday probe’s collector, was measured with a picoammeter and divided by the collector area to determine the ion current density ( J i ). The beam current ( I b ) was then derived by integrating the ion current density ( J i ) as described by [32]:
I b = 2 π H m i n 2 0 φ m a x J i s i n ( φ ) d φ
where I b is the beam current, H m i n is the minimum arm radius, and φ is the effective sweep angle.
Corrections were then made to the beam current calculation to account for additional current caused by the gap between the collector and guard ring, SEE from the collector surface, and the thruster’s non-point source nature [32,33]. The current utilisation efficiency η b and propellant utilisation efficiency η m were calculated using
η b = I b I d = I b I b + I e
where I d is the discharge current and I e is the electron current I e = I d I b , while
η m = m ˙ b m ˙ a = I b M i q ¯ m ˙ a
where Mi is the ion mass and q ¯ is the average charge of the ions in the plume. However, as no measurements taken were able to evaluate the charge species population of higher ionisation stages, here it was assumed that q ¯ = e , where e is the electron charge.
The plume divergence was assessed by evaluating the ratio of the axial beam current to the total beam current [32]. The half-angle of plume divergence was determined using
λ D i v = cos 1 I a x i a l I b
where I a x i a l is the axial beam current.

4. Experimental Characterisation

There were two distinct experimental campaigns within this research project. Firstly, the XPT was operated at the University of Surrey initially within the Daedalus vacuum chamber. Once this initial testing was completed to verify the operation of the XPT, the XPT was then moved to the University of Southampton. The thruster was operated at both institutions with the same cathode: the modular hollow cathode neutraliser developed at the Surrey Space Centre [22]. The thruster and the cathode can be seen operating in the large vacuum chamber facility at the University of Southampton in Figure 12. The modular hollow cathode was externally mounted at an angle of 90° with respect to the symmetry axis of the thruster. The cathode orifice was positioned at a radius of 70 mm and an axial distance of 35 mm from the centre of the thruster front plane.
Before conducting thrust measurements, the thruster was placed in a vacuum for 24 h to outgas impurities from the thruster and cathode surfaces. Following this, the cathode was ignited and run for 15 min before igniting the thruster, which was then operated for 20 min. The thruster was monitored throughout this process and reignited if necessary. Prior to each thrust measurement, the thruster ran continuously for 20 min to ensure thermal equilibrium.
The anode and cathode for all tests were operated using xenon propellant. The thruster used permanent magnets to produce the magnetic field required for electron confinement. As a result, there was no additional power required for the thruster operated than the anode discharge power and the cathode power. The keeper current was set to 2.5 A, the heater current was set to 6.5 A, and the cathode mass flux was set to 3 sccm. The keeper voltage varied between 11.3 V and 13.4 V, and the cathode-to-ground voltage varied between −7 V and −10 V as a function of the anode operating conditions. Whilst being investigated at the University of Surrey, the keeper voltage varied between 11.3 V and 38.3 V, and the cathode-to-ground voltage varied between −9 V and −14 V. The keeper voltage and cathode-to-ground voltage presented temporal magnitude fluctuations over time, while the data were acquired at a 6 sccm anode flow rate. The fluctuation in the keeper voltage magnitude could be due to changes in the plasma properties of the cathode plume region. This behaviour has been noted in the literature [22].

4.1. University of Surrey Testing

The cathode heater is powered by a Sorensen DLM 40–15 supply (40 V, 15 A), and the keeper is controlled by a Sorensen 1.2 kW programmable DC power supply (300 V, 4 A). The anode voltage is supplied by a Sorensen SGA unit (1000 V, 5 A) (AMETEK Programmable Power, Inc., Columbus, OH, USA). The thruster-cathode system is electrically floating, with the cathode-to-ground voltage monitored via an ISO-TECH 93N multimeter (ISO-TECH, Beijing, China). Testing was conducted in three separate 2 h intervals per day. Thermocouples were strategically positioned, including one on the thruster chassis near the outer magnet, to monitor the thermal behaviour during operation.
Thruster performance was directly measured using a torsional thrust balance across various anode discharge powers and mass fluxes. The corresponding thrust and voltage-current characteristics are shown in Figure 13 and Figure 14, respectively. The thruster was operated up to a maximum power of 300 W, exhibiting a generally linear increase in thrust with rising discharge power.

4.2. University of Southampton Testing

The thruster initially underwent testing at the University of Surrey before being relocated to the University of Southampton for further experimental characterisation. The experimental set-up remained largely consistent across both sites, utilising the same cathode, thrust stand mounting configuration, and permanent magnet arrangement. Prior to the cross-validation campaign, the magnetic flux density was remeasured at the anode’s propellant injection pointusing a Gauss probe. The results indicated a maximum reduction of approximately 8% compared with the initial measurements at Surrey, potentially due to thermal degradation of the permanent magnets during extended operation.
The cathode heater was powered by an Adaptive Power Systems supply (Columbus, OH, USA) (60 V, 40 A), while a Sorensen 1.6 kW programmable DC supply (300 V, 5.6 A) regulated the keeper. The anode voltage was controlled using a Magna Power 2000-2 supply (Magna-Power Electronics, Inc., Flemington, NJ, USA) (2000 V, 2 A). The entire thruster-cathode system was electrically floating, with the cathode-to-ground potential monitored via an ISO-TECH 93N multimeter. The direct thrust measurements and discharge characteristics are shown in Figure 15 and Figure 16, respectively.
The larger vacuum chamber at Southampton, with its superior pumping capacity (Table 1), enabled higher anode mass fluxes without causing substantial increases in background pressure. The corrected background pressure for xenon ranged from 2.0 × 10⁻⁵ to 5.9 × 10⁻⁵ mbar. Higher maximum discharge powers were achieved (up to 587.4 W), allowing exploration of an extended voltage envelope to assess its impact on thruster performance. Chassis temperatures during operation ranged from 55 °C to 200 °C. Notably, beyond a 250 V anode voltage, the anode current plateaued across all tested mass fluxes.
In contrast to the testing conducted at the University of Surrey, a plateau in performance was observed at higher power levels for several of the tested mass fluxes. In Figure 15, for anode mass fluxes of 6 sccm, 8 sccm, 10 sccm, 12 sccm, a clear reduction in the thrust verse power gradient can be observed at higher anode mass fluxes. This suggests that the majority of the ionisable propellant was being accelerated. This plateauing effect was not observed in the University of Surrey data, likely because the corresponding anode voltages where this phenomenon appeared were not explored, potentially missing the plateau observed at Southampton. As the anode voltage increased, the specific impulse plateaued beyond 250 V, while the thrust-to-power ratio decreased. The increased anode voltage also raised power deposition, leading to higher joule heating at the anode. This increased power input can introduce thermal limitations within the thruster. Excessive heating may cause material degradation or failure, which can restrict performance enhancements.
In the final test configuration, the thruster was operated at a 330 V anode voltage with an anode xenon mass flux of 12 sccm, resulting in 11.8 mN of thrust and an anode efficiency of 9.9%. The anode power was 550 W, with a specific impulse of 1003 s and a thrust-to-power ratio of 20 mN/kW. At this point, the anode began to sputter into the plasma, leading to a current spike and glowing, which indicated potential deformation in the top left anode region. The anode, made from additive manufactured stainless steel, was observed to glow red during testing, suggesting a temperature of approximately 1300 °C. This heat caused deformation and melting on that side of the anode. This is shown in Figure 17.
The thrust was expected to decrease with the rising anode temperature, resulting in faster axial neutral particles that reduced the propellant utilisation efficiency. The neutral gas temperature was taken to be the same as the anode temperature, and the average velocity of neutral particles followed a Maxwellian distribution [34]. The ionisation mean free path was proportional to the axial neutral particle velocity. Thus, we associated the anode temperature to the ionisation mean free path as shown in Equation (19):
λ i v z n n e σ i v e 1 4 n e σ i v e 8 k B T A π M i
where v z n is the axial neutral velocity component, n e is the electron density, σ i v e is the ionisation reaction rate, T A is the anode temperature, k B is the Boltzmann constant, and M i is the ion mass [26].

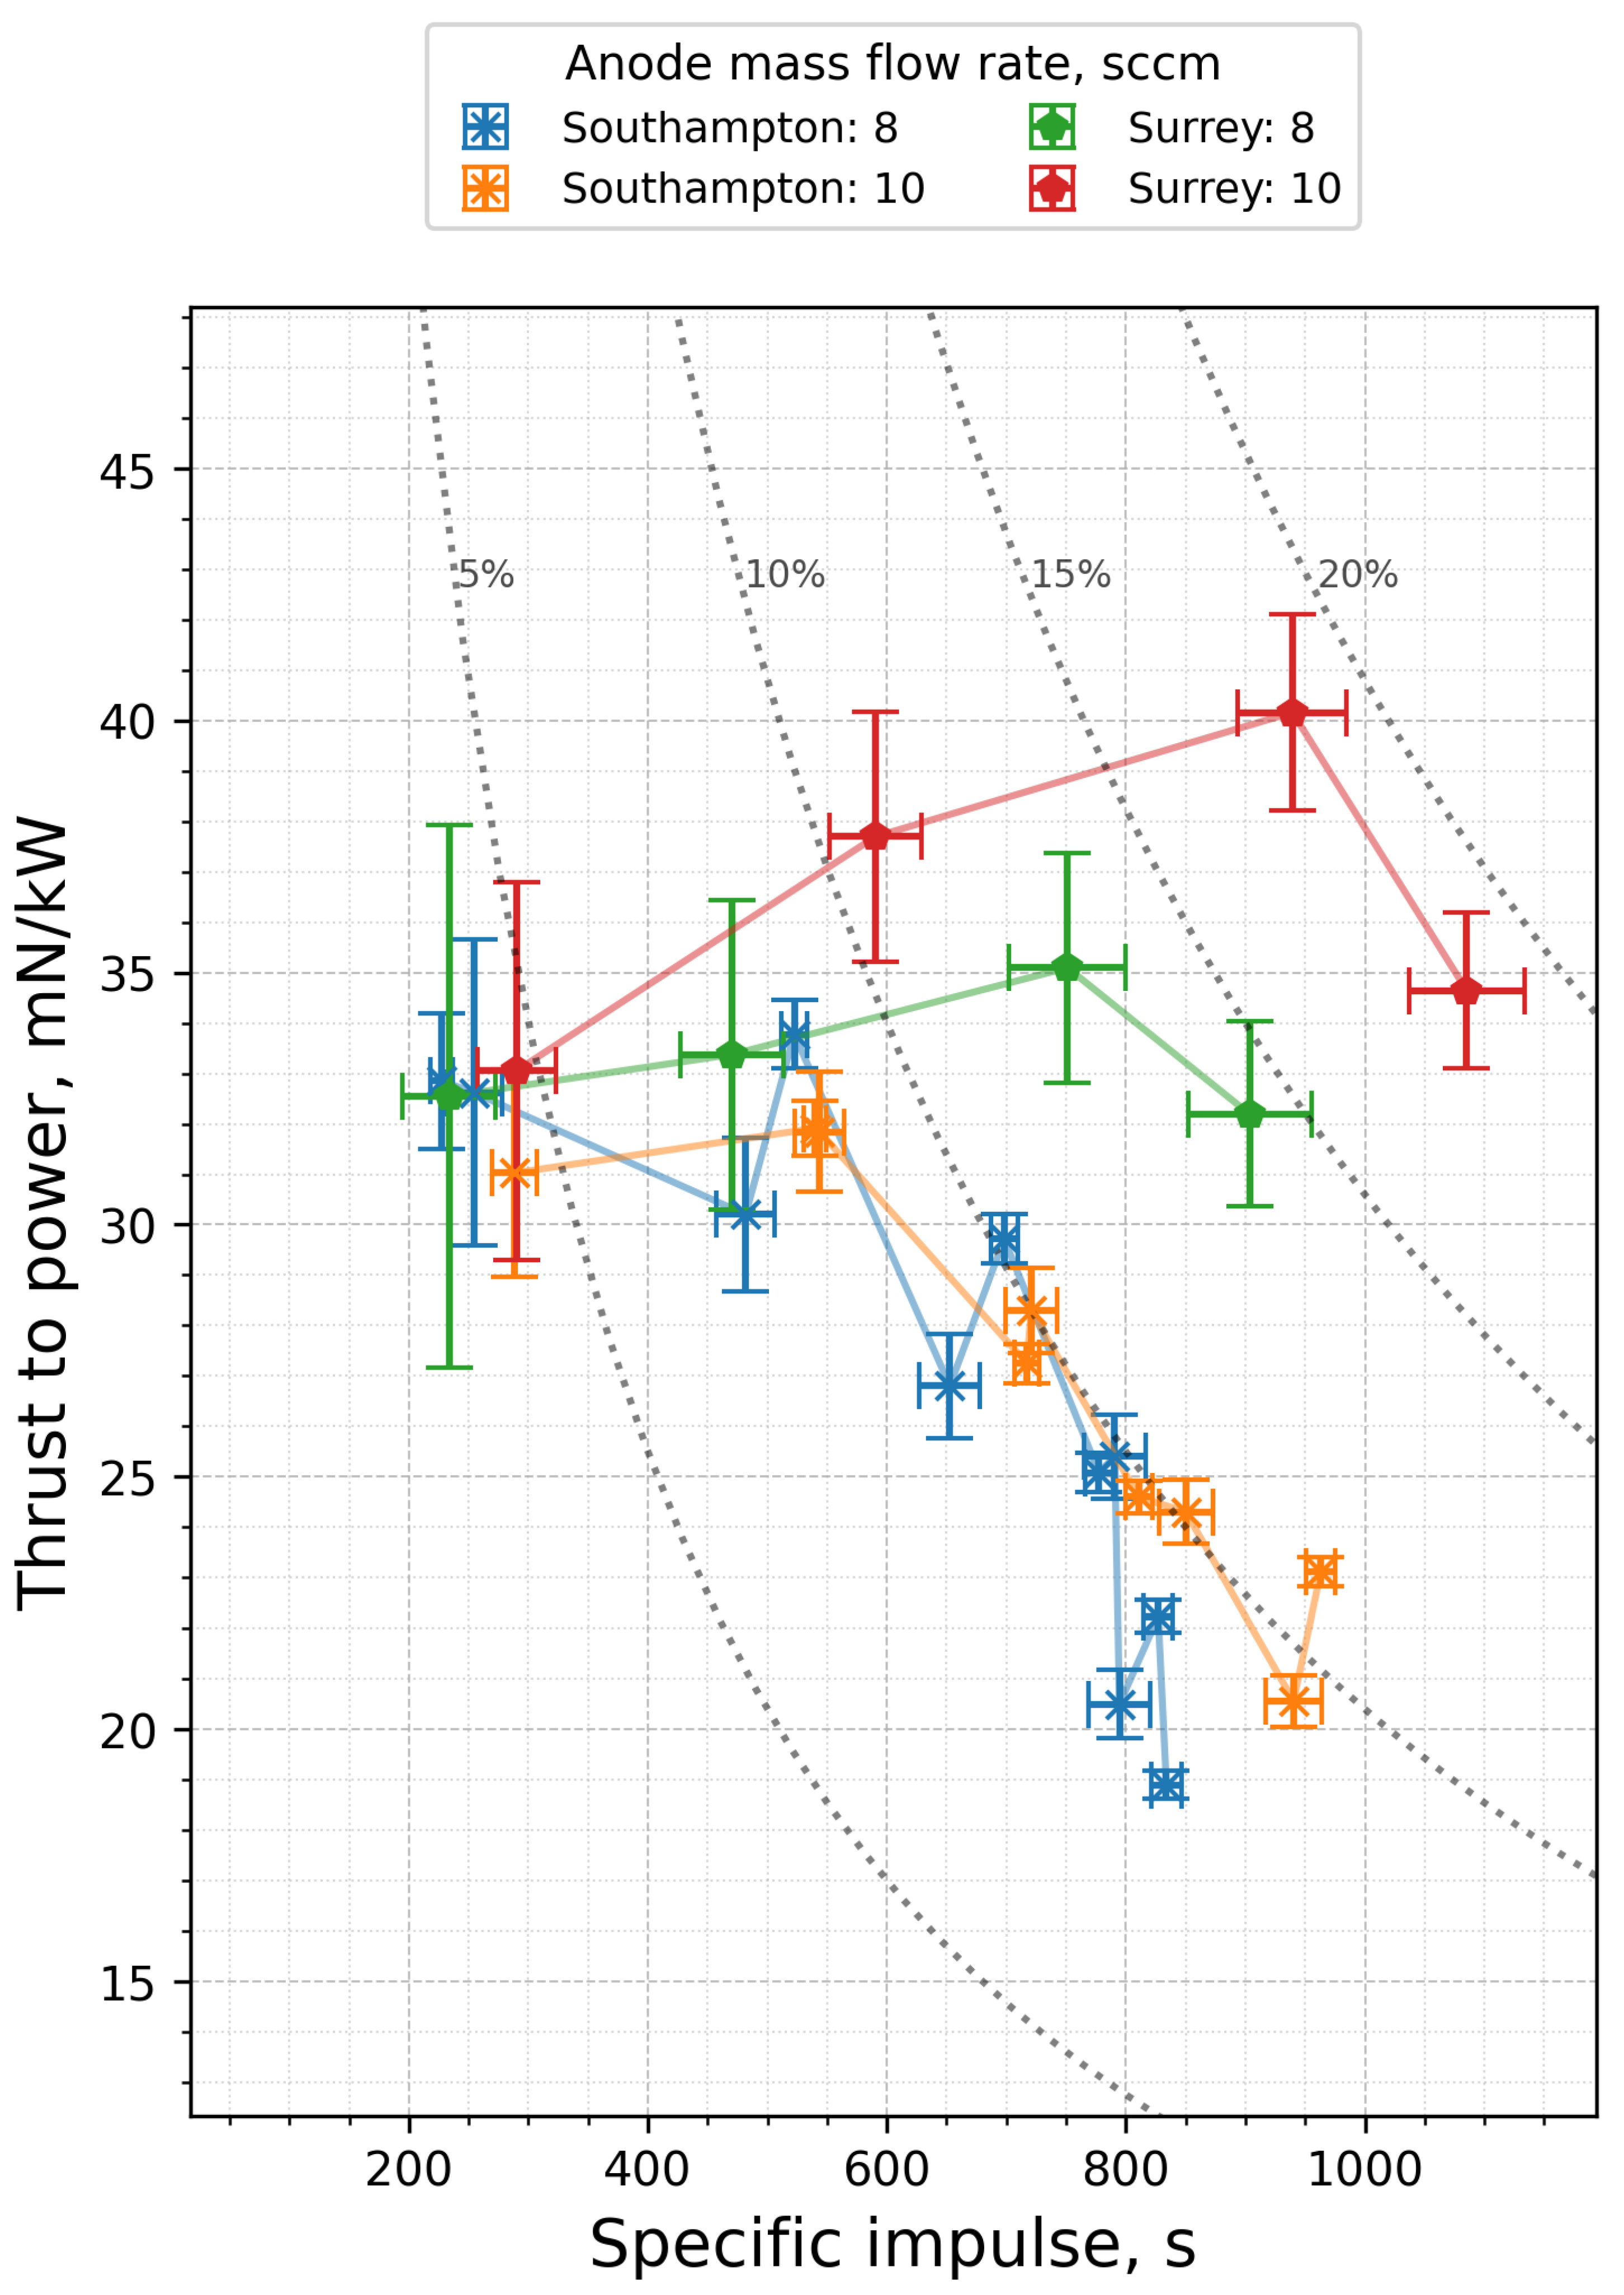
4.3. Direct Cross-Facility Comparison

To directly compare the performance of the XPT at both the University of Surrey and University of Southampton facilities, thrust measurements with error bars are presented, grouped by anode mass flux and anode discharge power in Figure 18 and Figure 19, respectively. Furthermore, the evaluated thrust-to-power from the thruster against the specific impulse is shown in Figure 20, where a constant anode efficiency for increasing the voltage, also increasing the specific impulse, can be seen for the Southampton tests whilst, an increasing anode efficiency was seen at Surrey.
A consistent trend was observed where the anode discharge current was higher at Southampton across all tested mass fluxes. For example, at 5 sccm and a 250 V anode voltage, Surrey recorded a thrust of 2 mN at 102 W, whereas Southampton recorded 3 mN at 121 W. This higher thrust at 5 and 6 sccm is attributable to the increased anode power, with a roughly 15% increase in anode current resulting in up to a 20% improvement in thrust.
However, this trend did not hold at higher flow rates of 8 and 10 sccm. Despite Southampton recording higher anode power in these cases, the measured thrust was comparatively lower, particularly at 10 sccm. At lower anode voltages (100 V and 150 V), performance from both facilities overlapped. Yet, as the anode voltage rose to 200 V and 250 V, discrepancies of up to 25% emerged.
The increased anode current at Southampton may be linked to the observed reduction in magnetic flux density. Notably, performance disparities between the facilities became significant for mass fluxes above 8 sccm and anode powers exceeding 200 W, indicating that facility-specific parameters influenced thruster behaviour under these operating conditions.

4.4. Discussion

The experimental results showed strong agreement in the low-power regime when characterising the miniaturised external discharge plasma thruster across facilities with differing pumping capacities. However, at higher power levels, clear disparities in thrust measurements emerged. These differences may have arisen from multiple contributing factors, such as thermal effects on magnetic components and the impact of background pressure on thruster performance. To better understand these discrepancies, two key questions are posed:
  • How do ground-testing facility parameters—such as chamber size, pumping capacity, and pump configuration—influence the performance of a channel-less thruster?
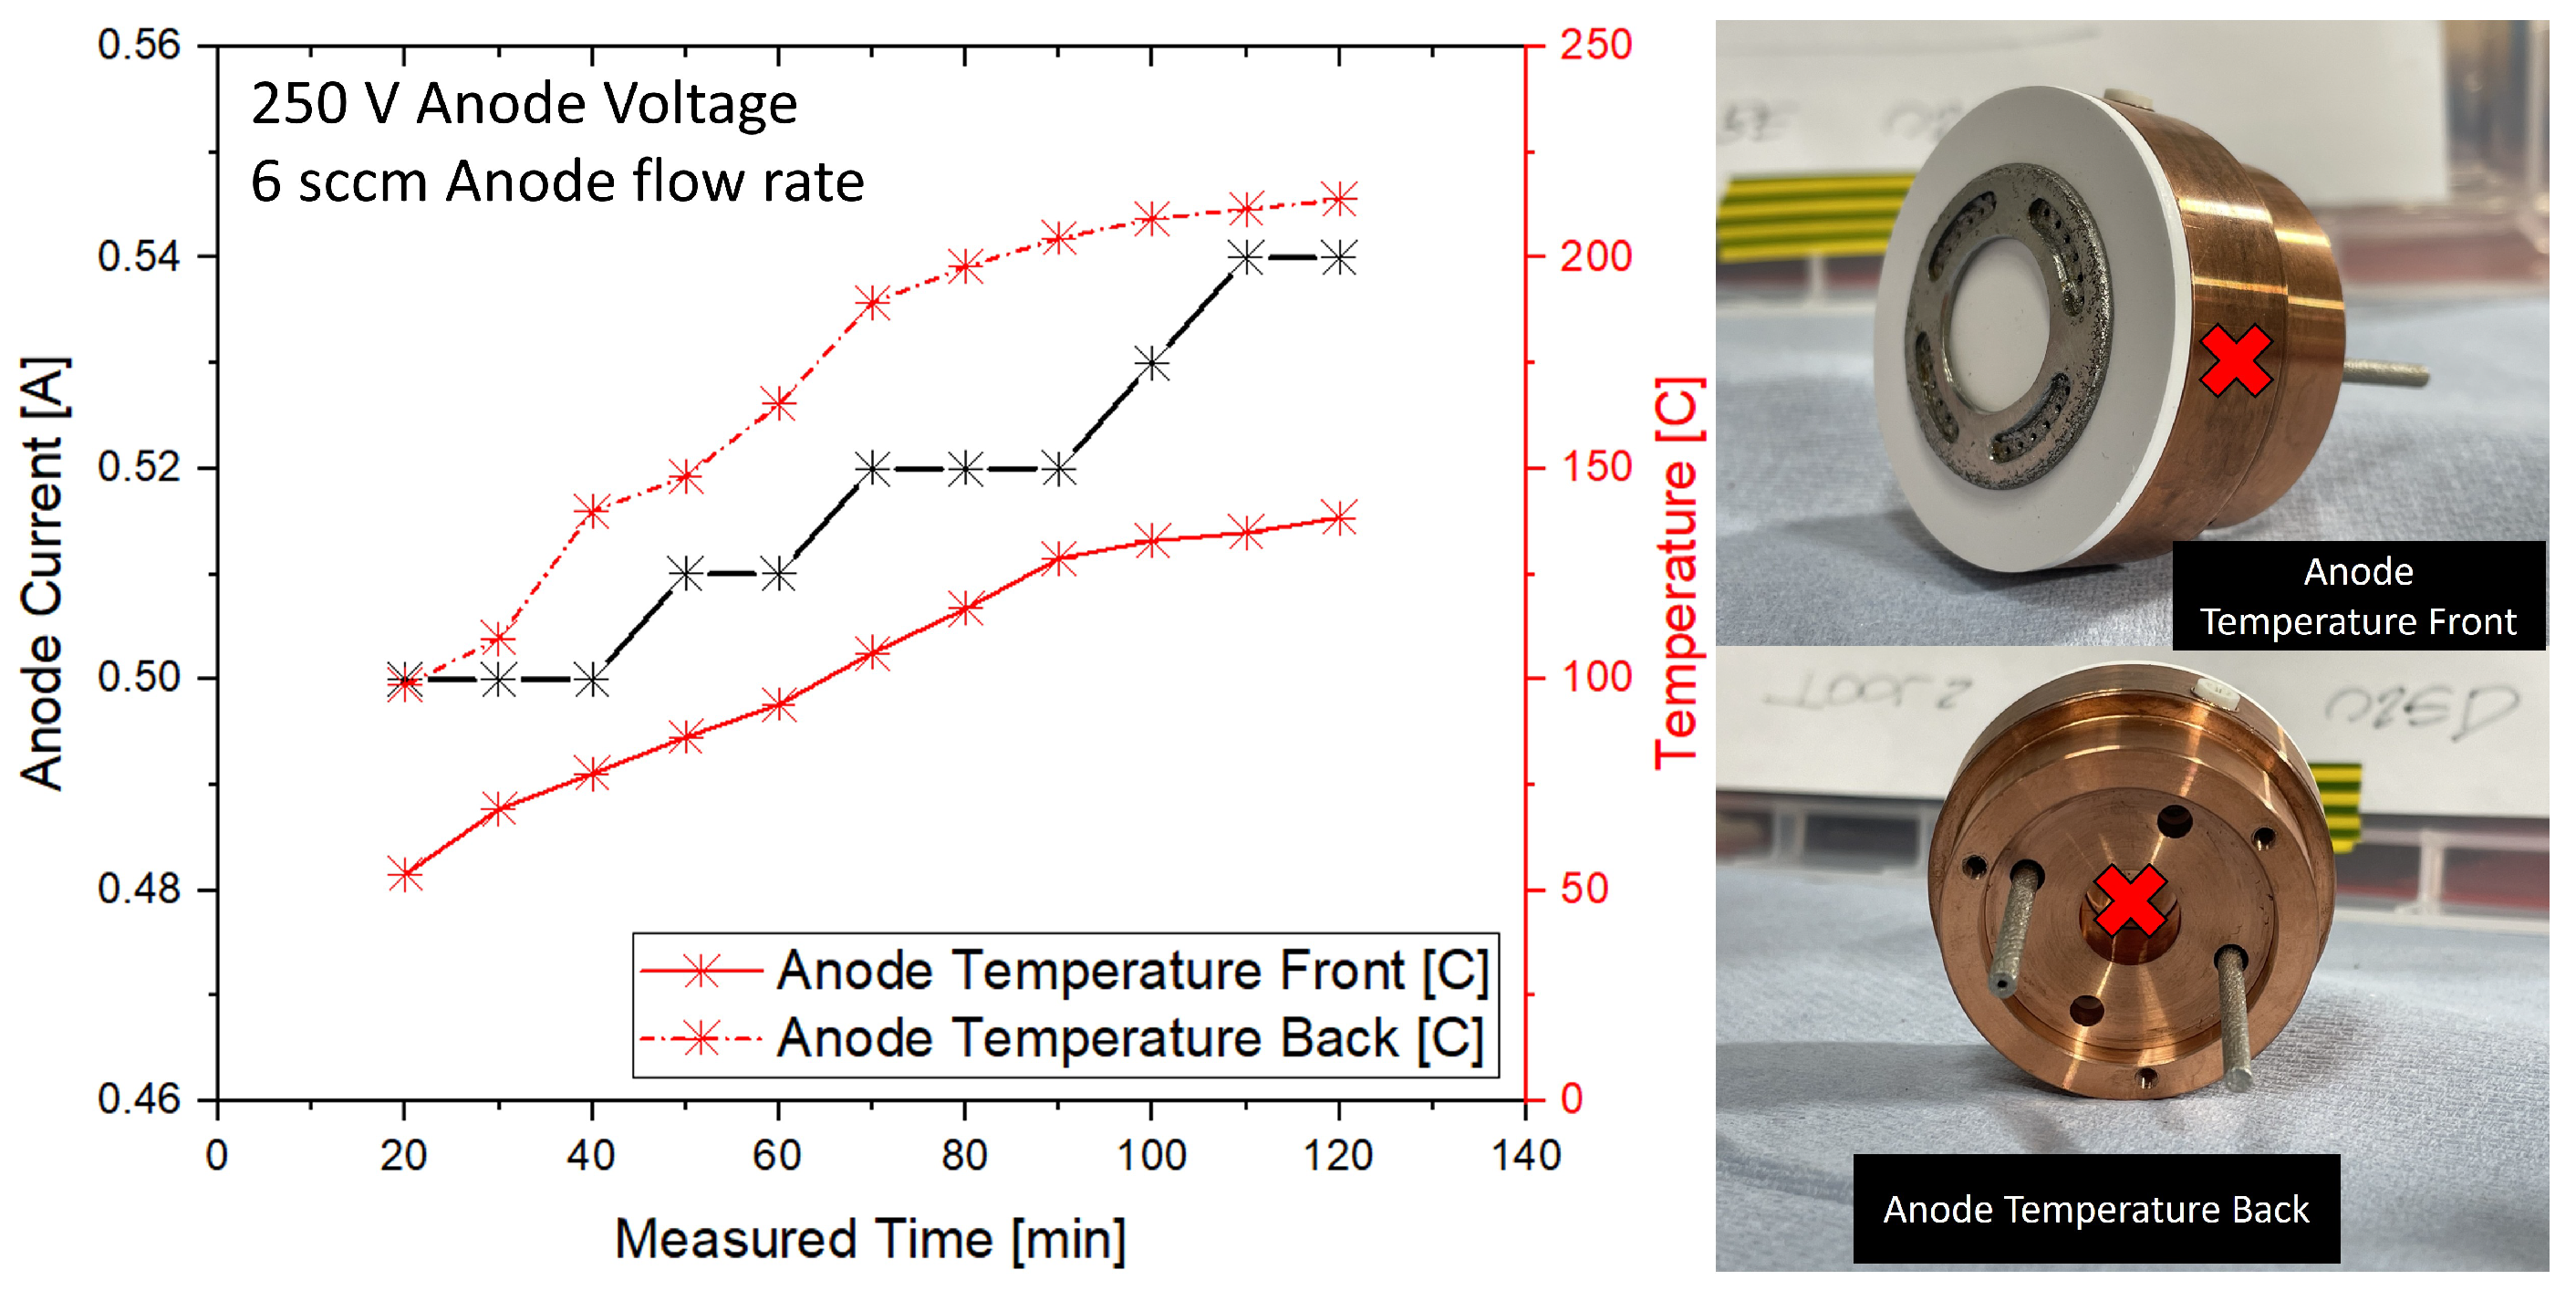
  • What role do thermal effects play in the operation of a miniaturised channel-less plasma thruster?
Performance divergence becomes more pronounced at increased anode mass fluxes and elevated power conditions. As illustrated in Figure 20, the thrust-to-power ratio at the Southampton facility decreased with an increasing specific impulse, a trend consistent with established Hall thruster behaviour. In contrast, this trend was not observed in the Surrey dataset. This discrepancy suggests that enhanced performance in the smaller vacuum chamber may be attributed to increased neutral gas ingestion at higher background pressures, which artificially boosts ionisation efficiency.
These results underscore the critical importance of cross-facility testing, even for low-power electric propulsion systems. The observed sensitivity of performance metrics to facility conditions highlights the need for consistent and carefully controlled test environments in the validation of novel thruster architectures such as channel-less designs.
Nevertheless, this study introduces a novel dataset that enables the first inter-laboratory validation of a channel-less (or wall-less) plasma thruster. These results provide valuable insight into how ground-testing environments influence thruster operation. The observed differences in performance and discharge characteristics suggest that prolonged operation under higher-power conditions leads to elevated thermal loading on the anode. This effect appears particularly relevant in the Southampton tests, where an extended runtime may have contributed to shifts in thruster behaviour.

The Effects Caused by the Extended Operation on the Magnetic Circuit

One significant difference between the two testing locations is the duration and scheduling of the experiments. At Surrey, the thruster was tested in three separate 2 h intervals per day, while at Southampton, it was evaluated in two 4 h sessions per day. Since the thruster was operated for a longer duration in Southampton, the magnets might have been affected by the heat dissipated from the anode. Throughout most of the campaign, the chassis temperatures in Southampton exceeded those in Surrey, potentially affecting the magnetic flux density and thruster performance. Moreover, a weaker magnetic field increased the anode current, thus elevating the anode power and leading to higher thermal deposition, which became a clear limitation at higher flow rates and anode powers. Furthermore, the thruster performance was highly sensitive to the propellant temperature [34]. As the anode temperature increases, the neutral density can be expected to decrease, which reduces the propellant utilisation efficiency and eventually diminishes the thruster performance. At 8 sccm of anode mass flux and a 250 V anode voltage, the thrust recorded at Surrey was 6.99 mN for 210 W of anode power, and the chassis temperature was 120 °C, while at Southampton, the thrust recorded was 6.00 mN at 234 W of anode power, and the chassis temperature was 129 °C. At Surrey, with a 250 V anode voltage and 10 sccm flow rate, the thrust was 10.47 mN at 300 W of anode power, and the chassis temperature was 150 °C. At Southampton, the thrust was 7.95 mN at 325 W of anode power, and the chassis temperature was 150 °C. The magnetic flux density was measured after the inter-laboratory campaign at two locations, P1 and P2, one of which was where the anode was seen to deform and melt on that top left side of the anode, as shown in Figure 21. A 36% decrease in the magnetic flux density was recorded at P1, whereas at P2, the strength decreased by up to 25%. The decrease in the magnetic flux density was non-uniform. This is particularly problematic for the miniaturised XPT due to its channel-less design. Inefficient thermal dissipation can weaken the magnetic flux density, increase the ionisation mean free path, and hinder performance due to inadequate electron confinement.
The samarium cobalt 2:17 (SmCo) magnets used for this thruster have a maximum curie temperature of 300 °C [35]. If the magnets exceed this temperature, then they experience irrecoverable losses in magnetism, potentially leading to large axial electron currents that decrease thrust efficiency due to weaker confinement. Additionally, the coupling of propellant injection and anode biasing increases the thermal fluxes on the anode, which can potentially elevate the anode temperature further. This is particularly concerning when miniaturising thrusters, as continuous operation exacerbates the issue. The smaller thruster diameter and the close proximity of the magnets to the anode raise additional concerns regarding the thermal dissipation of the thruster geometry.
Following the measurement of the reduced magnetic flux density, we replaced the thruster magnets and returned the thruster back to Surrey to assess thermal effects and pinpoint the engineering limitations of the design. To investigate this, the Faraday probe described in Section 3.4 and two K-type thermocouples were utilised. The cathode ran at 1 sccm of mass flux with a steady keeper current of 2.5 A, while the heater remained off. The corrected background pressure for this experiment ranged from 1.7 × 10⁻⁵ to 2.1 × 10⁻⁵ mbar. The thermocouples used in this study were placed to monitor the thermal behaviour of the thruster. One thermocouple was positioned at the back of the thruster chassis directly behind the central magnet. The second thermocouple was located on the side of the thruster chassis adjacent to the outer magnet. While the thermocouples were not directly measuring the temperature of the magnets, they were positioned as close as possible to capture accurate temperature readings in the respective vicinity, as shown in Figure 22. The discharge envelope and chassis temperatures are presented as a function of the operation time at constant thruster operation (see Figure 22). The anode voltage was set to 250 V, and the anode mass flux was 6 sccm on xenon.
The initial measurement was taken after 20 min of continuous operation. Over time, the anode current exhibited a gradual increase, suggesting evolving discharge conditions. Simultaneously, temperatures measured at the front and rear of the thruster chassis increased significantly, with the rear consistently reaching higher values. After approximately 100 min, both temperature profiles began to plateau, indicating the onset of thermal equilibrium. The observed correlation between the rising anode current and chassis temperatures highlights the thermal coupling within the system.
Faraday probe measurements at 20 and 120 min for an anode voltage of 250 V and mass fluxes of 6 sccm and 8 sccm revealed a reduction of up to 30% in the peak current density along the thruster centreline. The electron current, estimated by subtracting the measured beam current from the anode current, increased with the operation time. This elevated electron current, contributing to ionisation and excitation, negatively impacted the current utilisation efficiency.
At 250 V and 8 sccm, the current utilisation efficiency decreased by approximately 25%, dropping from 0.66 at 20 min to 0.49 at 120 min. During this period, the electron current fraction ( I e / I d ) rose from 0.33 to 0.50. Concurrently, the propellant utilisation decreased from 0.95 to 0.72, while the plume divergence half-angle remained effectively constant (46.3° at 20 min versus 45.9° at 120 min), as shown in Figure 23.
The observed temperature rise likely reduced the magnetic flux density, thereby facilitating increased electron mobility towards the anode. This effect became pronounced after approximately 70 min of operation, when the temperature behind the central magnet exceeded 180 °C. This temperature threshold, evident in Figure 22, marked a reduction in the rate of temperature increase and indicated the beginning of thermal degradation in performance.
The elevated chassis and anode temperatures may lead to increased neutral atom velocities and reduced confinement efficiency. As the permanent magnets approach their demagnetisation temperature, a further decline in magnetic flux density is expected, which would compromise electron confinement. The combined effects manifest as increased electron current, reduced current and propellant utilisation, and ultimately a decline in overall thruster efficiency.

5. Conclusions

This study presents an inter-laboratory characterisation of the External Discharge Plasma Thruster (XPT), a novel, low-power, channel-less Hall-effect thruster. The primary objective was to investigate how different test facilities influenced the performance measurements, considering facility-dependent factors such as background pressure, chamber size, and calibration methods. The XPT was tested independently at the University of Surrey and the University of Southampton, employing distinct thrust balances and diagnostics to compare performance metrics. The study also applied design modifications recommended in the literature to optimise the performance of this miniaturised thruster, including extending the anode’s rear surface to improve the thickness and heat conduction, as well as direct propellant injection through the anode. Nevertheless, the investigation revealed engineering challenges related to plasma heating of the anode, which adversely affects the magnets’ lifetime and overall thruster durability.
The key findings are summarised as follows:
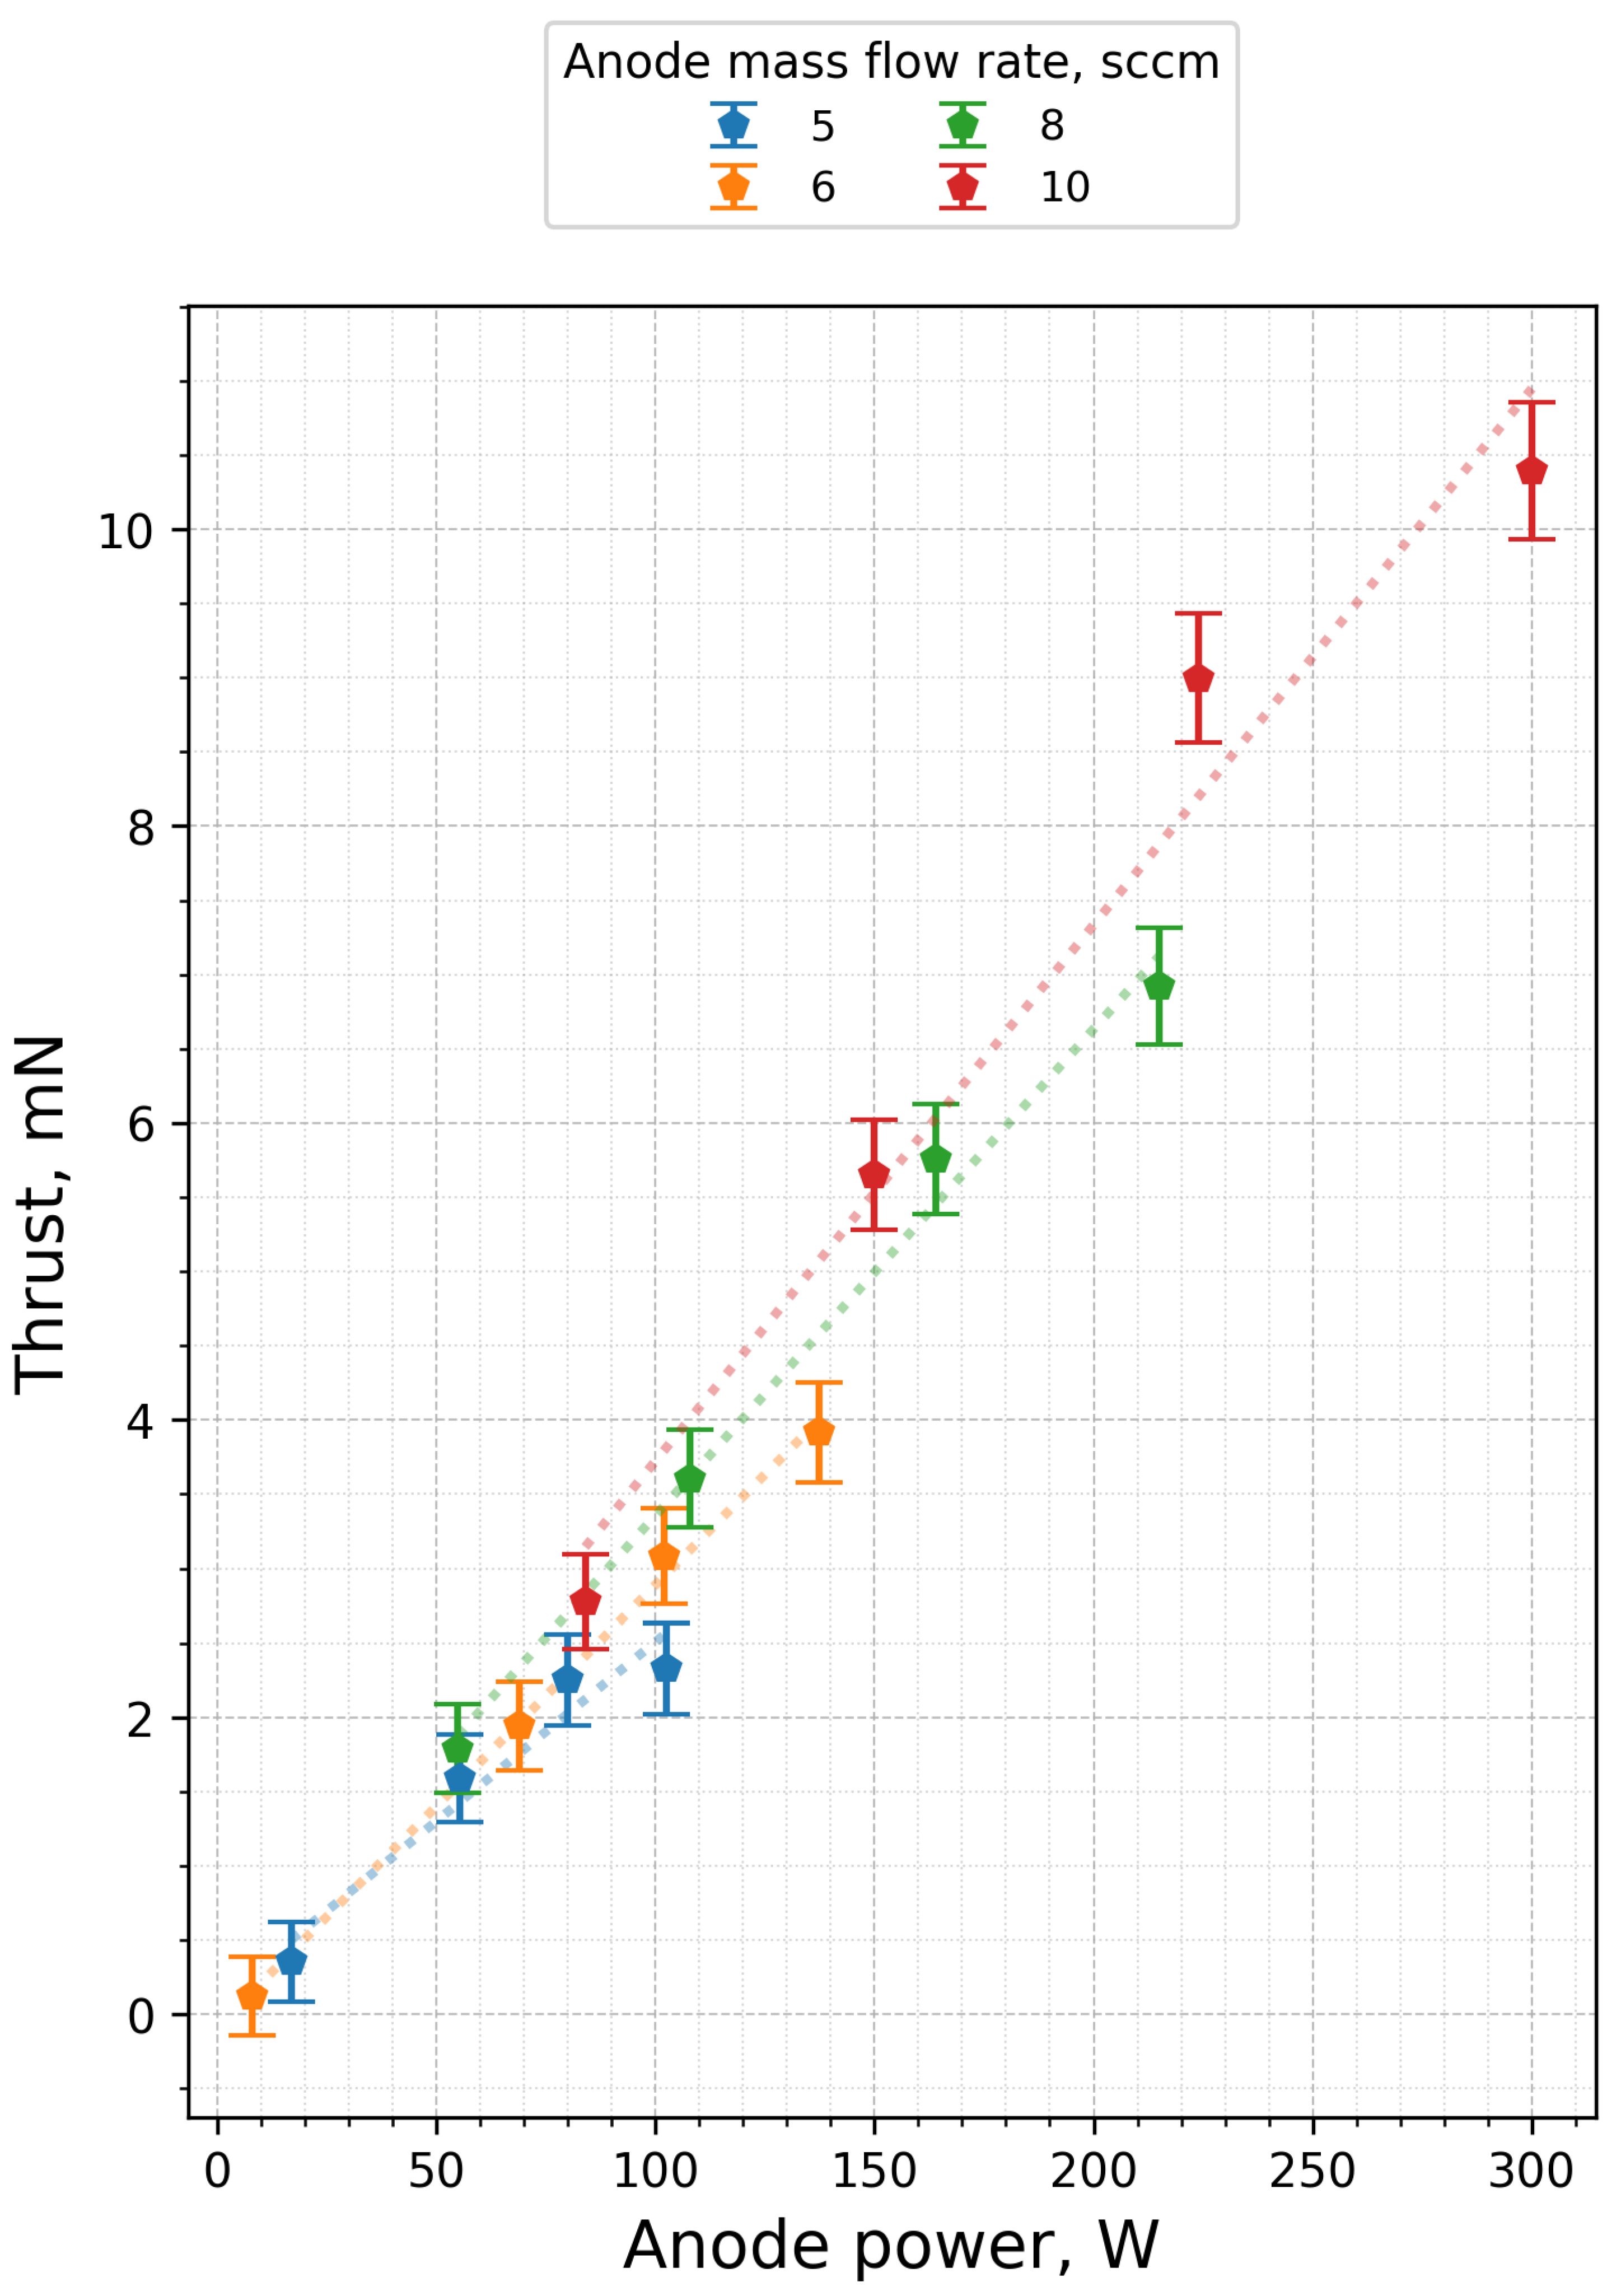
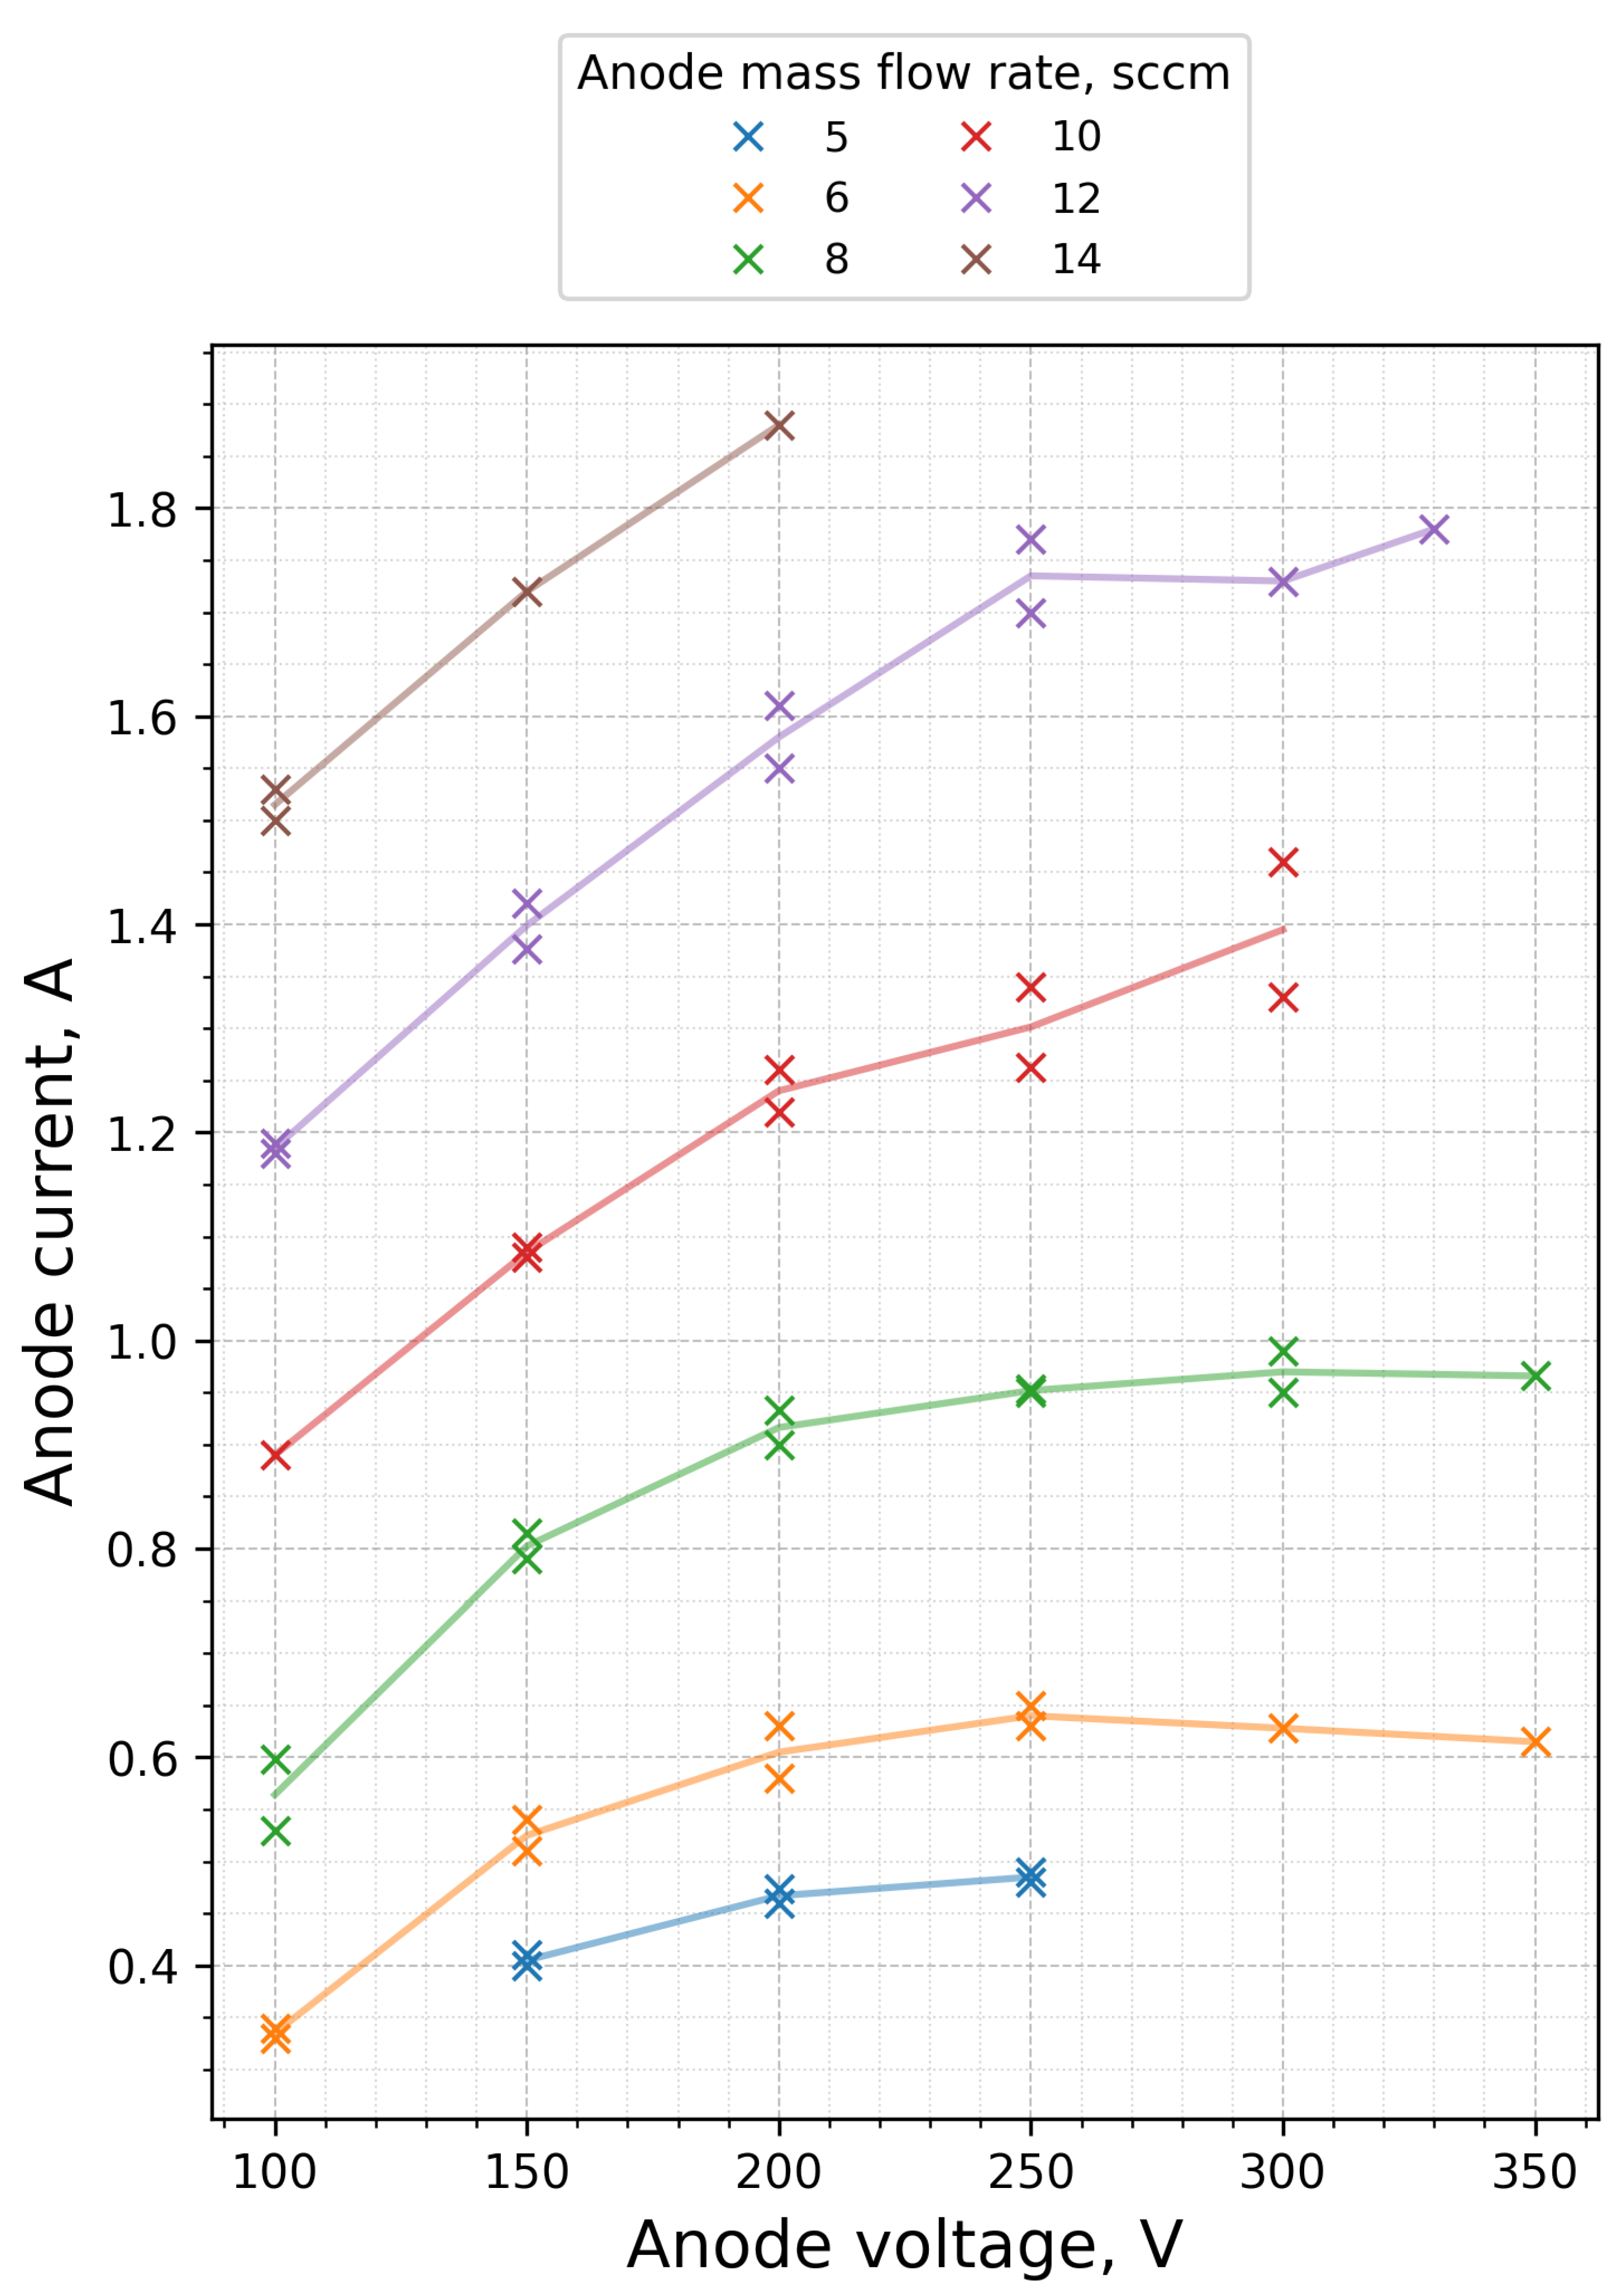
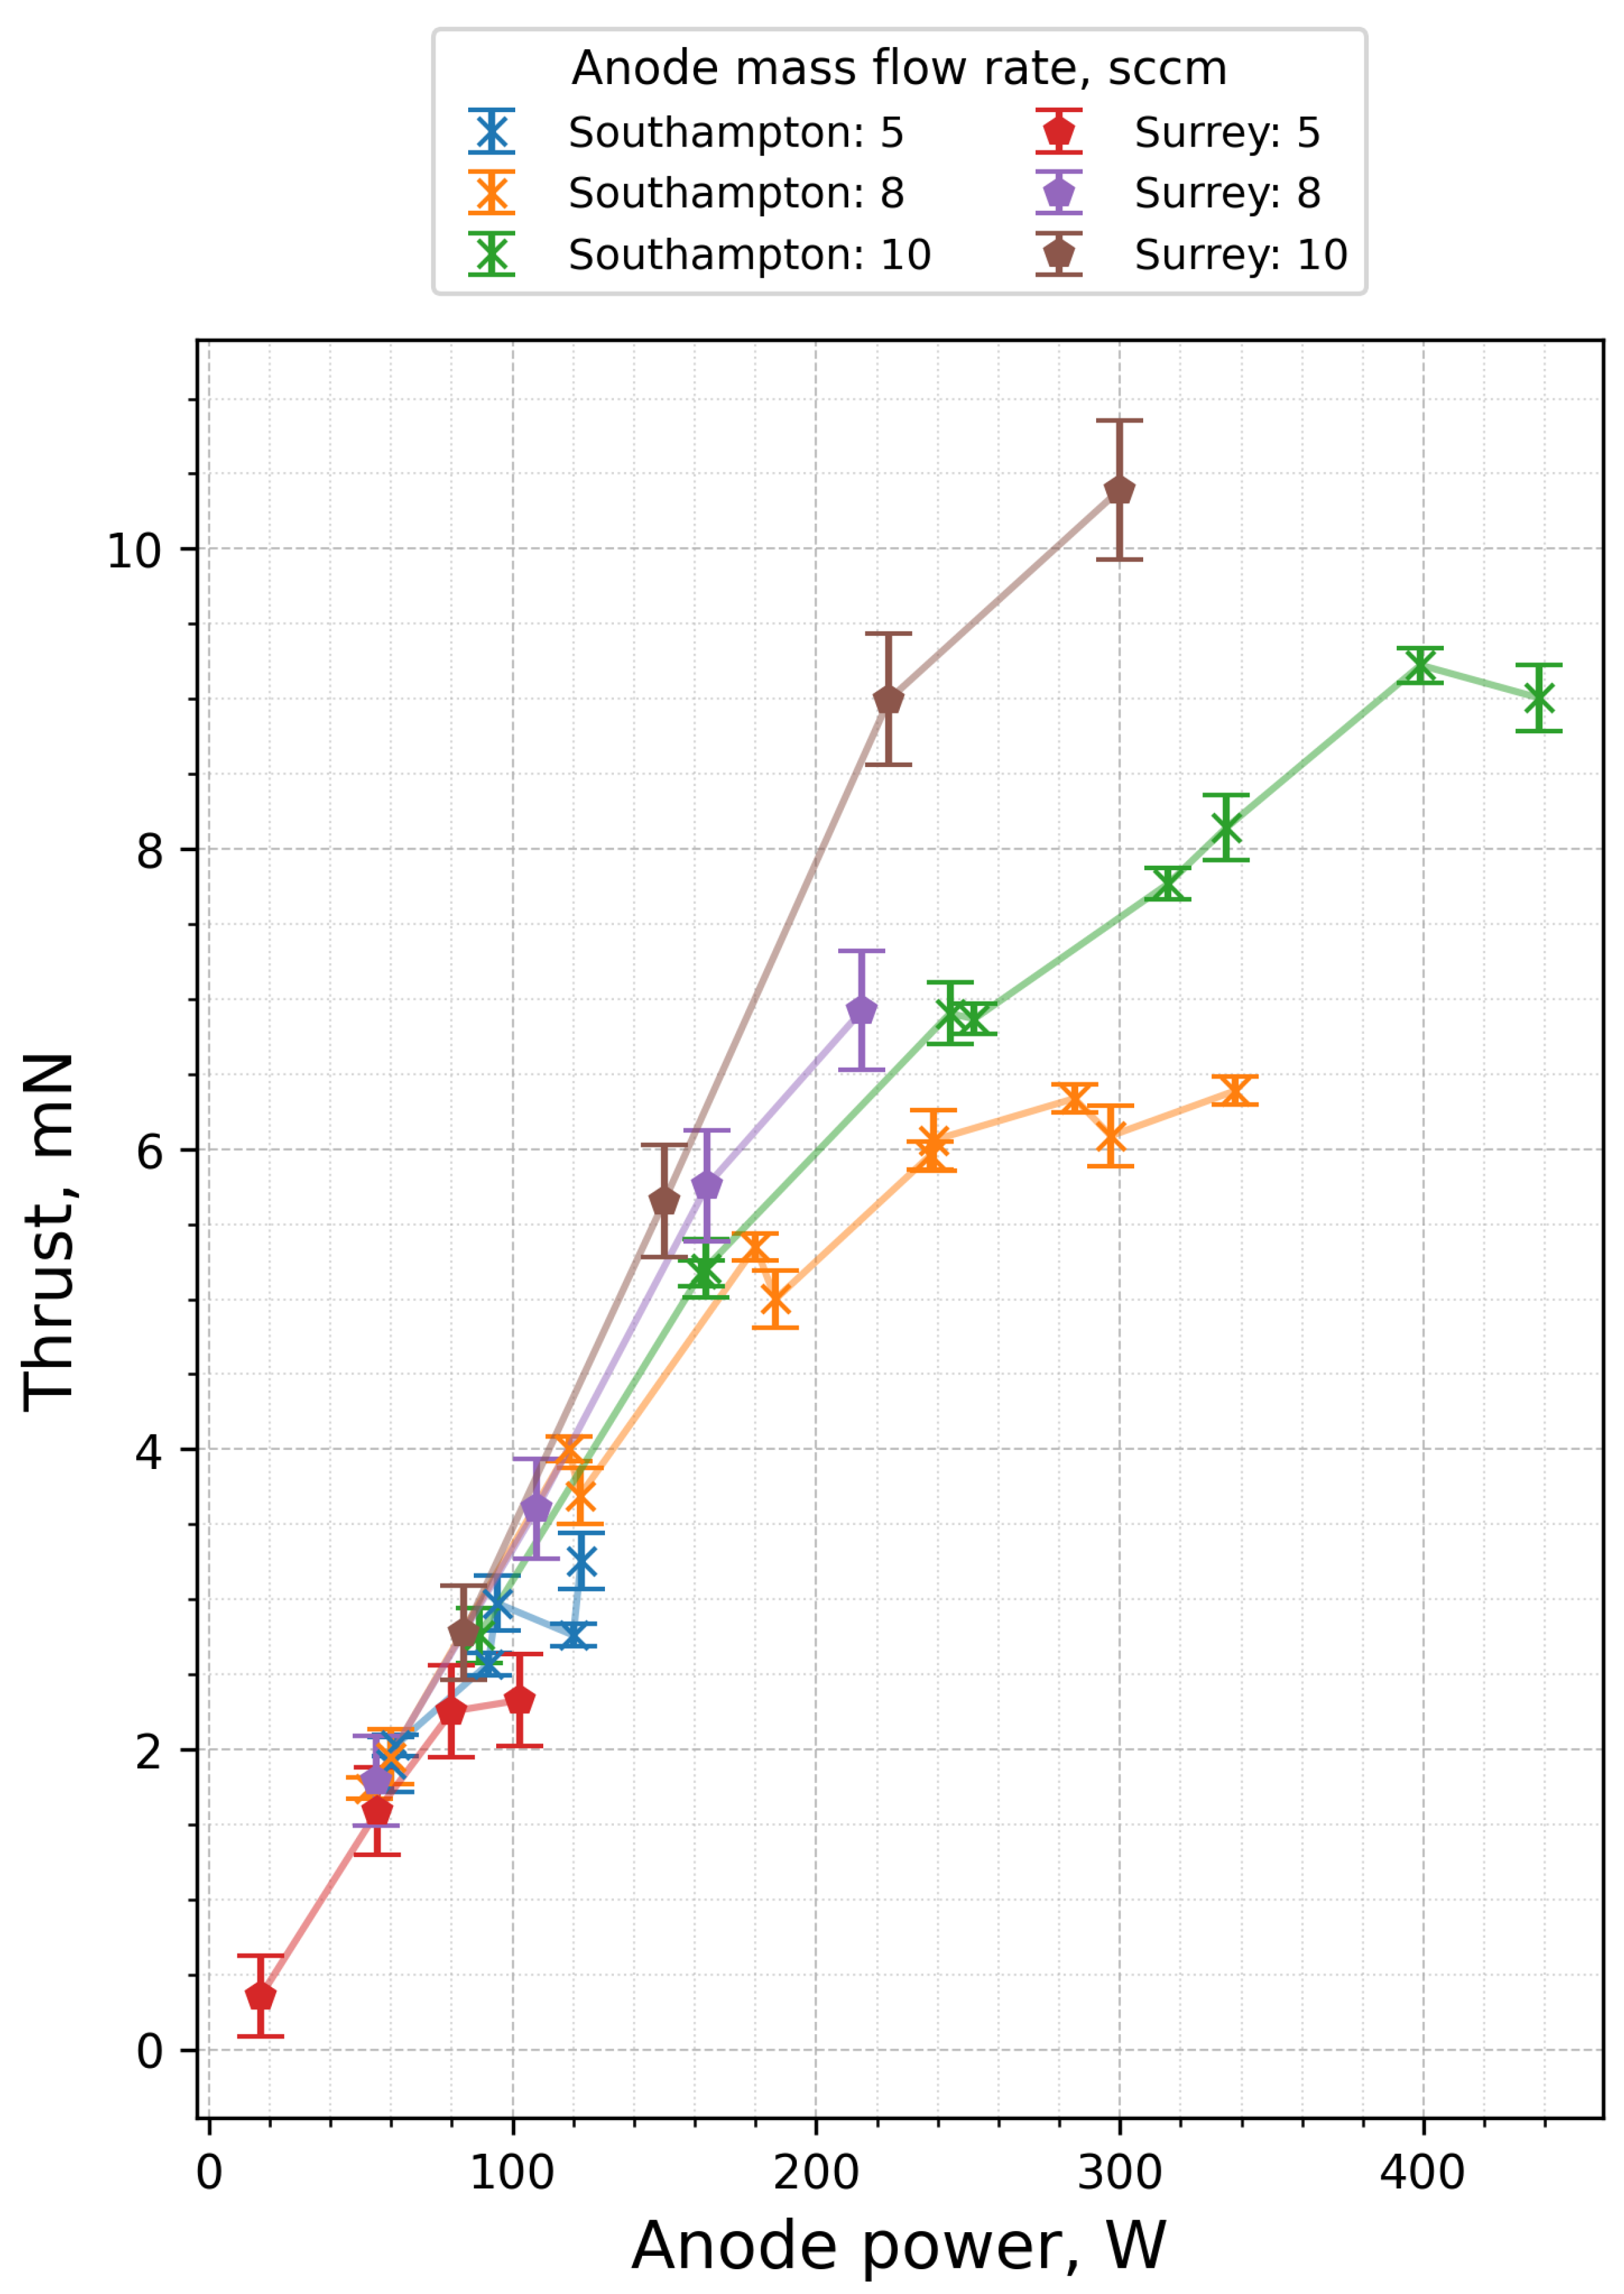
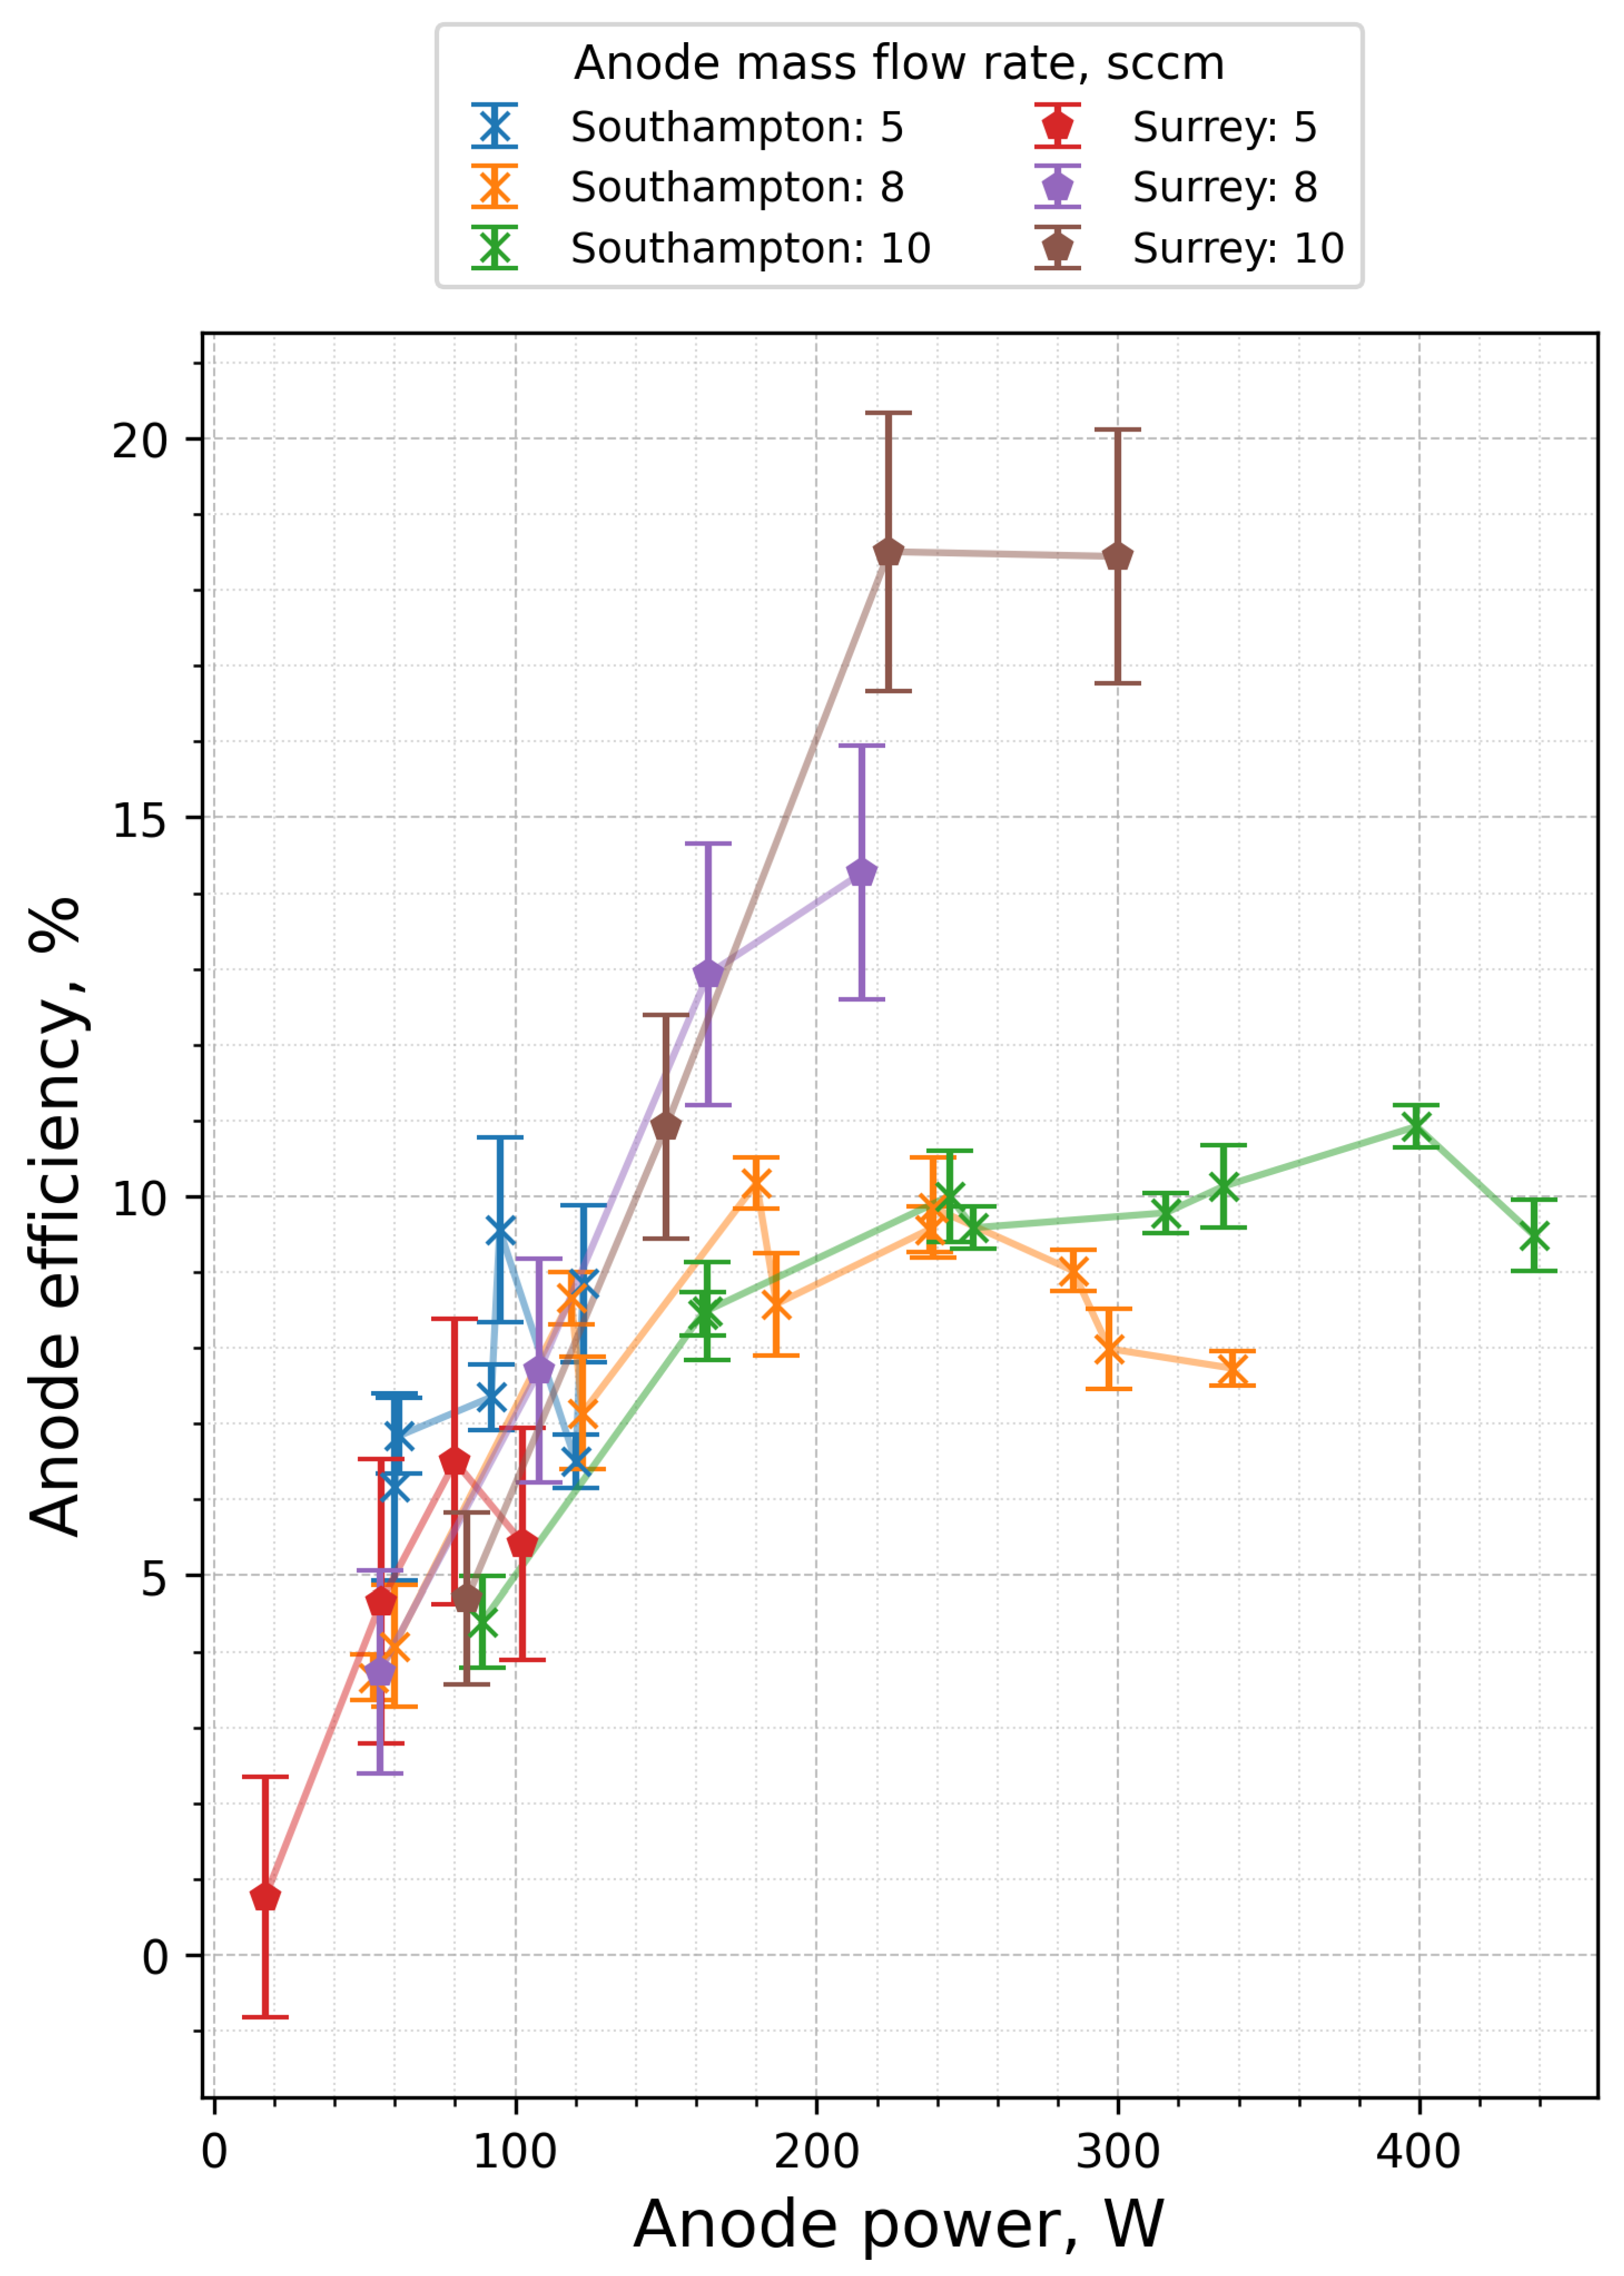
  • At the University of Surrey, the XPT achieved a maximum thrust of 10.47 mN and a peak anode efficiency of 18% at 300 W of anode power. At Southampton, the thruster operated over a higher power range, reaching a peak thrust of 11.8 mN at 550 W, but it exhibited a performance plateau beyond a 250 V anode voltage. This plateau suggests near-complete utilisation of the ionisable propellant, limiting further thrust gains. The experimental results demonstrate that the XPT’s performance is sensitive to test facility conditions, especially at higher anode mass fluxes and discharge powers. While the trends in thrust and efficiency were consistent at lower power levels, discrepancies between the two facilities became pronounced above 200 W and 8 sccm.
  • Anode overheating and deformation were observed at the highest power levels, underscoring the necessity for improved thermal management in future XPT designs. Performance scaled positively with increasing mass flux, indicating that the thruster’s compact size is not a limiting factor for channel-less plasma thrusters. However, material limitations pose a significant challenge; higher mass flux and thrust values caused plasma heating that increased the anode temperature, leading to partial demagnetisation of permanent magnets and deformation of the stainless steel anode due to electron hot spots.
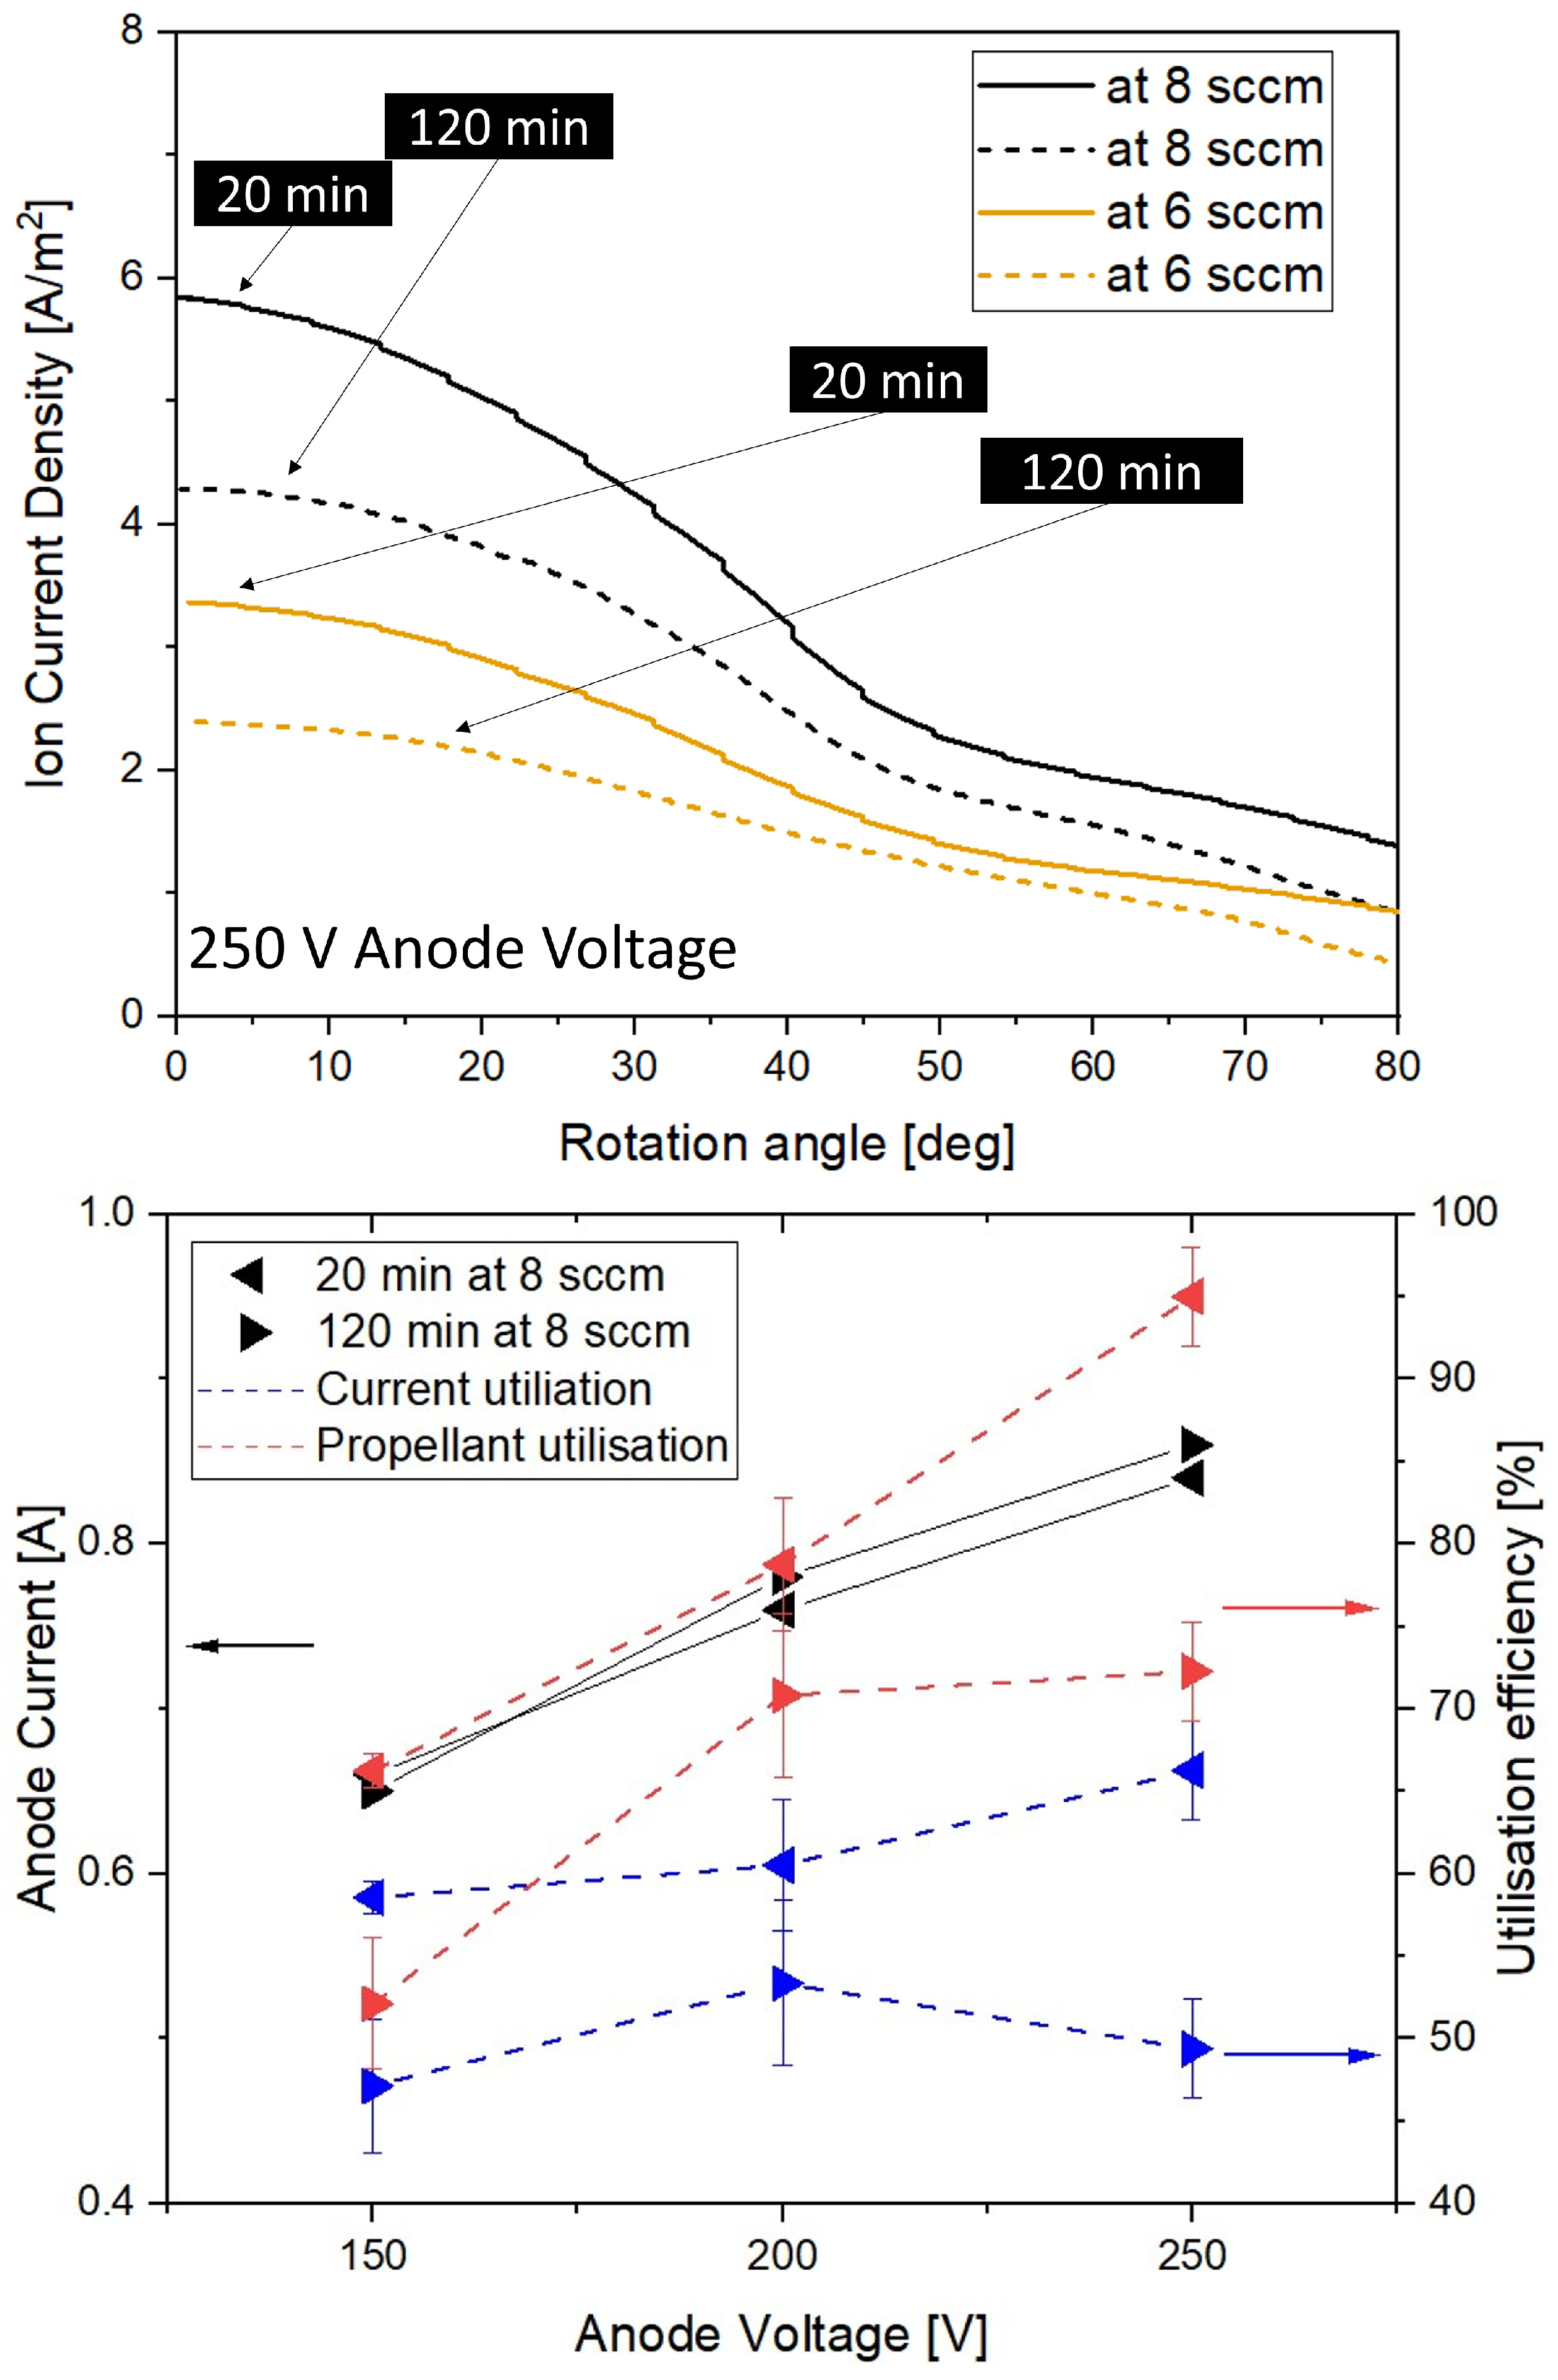
  • A continuous operation study lasting 120 min examined the thermal effects on the thruster’s magnetic circuit. A Faraday probe mapped the ion beam and quantified performance changes over time. The ion current density decreased by up to 30% at the 6 sccm and 8 sccm xenon flow rates during extended operation. Unlike annular Hall thrusters, where coaxial channels shield magnets, the miniaturised XPT utilizes its entire surface area for thrust generation, increasing susceptibility to thermal degradation. The increase in electron current during continuous operation was attributed to thermal weakening of the magnetic field and elevated anode temperatures increasing the neutral velocity. Nonetheless, relatively good propellant utilisation, due to a short ionisation region, suggests that with further development, channel-less plasma thrusters can achieve effective and durable operation.
  • The characterisation indicates an optimal operational range of about 200 W of anode power for this miniaturised XPT. While active cooling is feasible in laboratory settings, it is impractical for spaceflight applications. Therefore, fundamental redesigns are required, such as separating propellant injection from the anode, to reduce thermal stress and extend the thruster life. This inter-facility comparison highlights the importance of accounting for facility effects—including vacuum chamber pumping, measurement methods, and test durations—when evaluating novel electric propulsion devices. It also underscores the critical role of inter-laboratory validation to ensure accurate and reliable performance assessments of emerging propulsion technologies.
The XPT is proposed as method of erosion reduction, but it shows low performance when compared with other small HETs. To make the XPT a legitimate consideration, further work is required to improve the thruster’s performance and thermal characteristics. Some attempts to improve the performance, notably plume divergence, have been attempted with external electrodes and current modulation [36]. Whilst these methods did not yield conclusive improvements, there are still mechanisms that can be used to increase the competitive nature of this novel thruster type, such as high current densities, which have not been implemented in low-power electric propulsion.

Author Contributions

Conceptualization, T.F.M.-O. and M.A.; Methodology, T.F.M.-O. and M.A.; Software, T.F.M.-O. and M.A.; Validation, T.F.M.-O. and M.A.; Formal analysis, T.F.M.-O. and M.A.; Investigation, T.F.M.-O. and M.A.; Resources, A.L.F.; Data curation, T.F.M.-O. and M.A.; Writing—original draft, T.F.M.-O. and M.A.; Writing—review & editing, T.F.M.-O., M.A., A.L.F. and C.N.R.; Visualization, T.F.M.-O. and M.A.; Supervision, A.L.F. and C.N.R.; Project administration, A.L.F. and C.N.R.; Funding acquisition, M.A. All authors have read and agreed to the published version of the manuscript.

Funding

The development of the thrust balance was made possible by funding from a Round 2 fund from Research England SPRINT funding. M. Ahmed thanks the University of Surrey for his PhD scholarship funding.

Data Availability Statement

The raw data supporting the conclusions of this article will be made available by the authors on request.

Acknowledgments

The authors would like to thank the Propulsion Lab Technical Support and Mechanical Engineering Workshop teams at Surrey, particularly Brian Eades and Jonathan Stacey for machining the cathode and thruster. The authors thank Masillo for the guidance on the Faraday probe set-up.

Conflicts of Interest

The authors declare that they have no known competing financial interests or personal relationships that could have appeared to influence the work reported in this paper.

References

  1. Yeo, S.H.; Ogawa, H.; Kahnfeld, D.; Schneider, R. Miniaturization perspectives of electrostatic propulsion for small spacecraft platforms. Prog. Aerosp. Sci. 2021, 126, 100742. [Google Scholar] [CrossRef]
  2. Dannenmayer, K.; Mazouffre, S. Elementary Scaling Relations for Hall Effect Thrusters. J. Propuls. Power 2011, 27, 236–245. [Google Scholar] [CrossRef]
  3. Marianacci, A.; Mazouffre, S. Supervised machine learning-based Hall thruster scaling. J. Electr. Propuls. 2024, 3, 14. [Google Scholar] [CrossRef]
  4. Ahedo, E.; Gallardo, J.M.; Martinez-Sanchez, M. Effects of the radial plasma-wall interaction on the Hall thruster discharge. Phys. Plasmas 2003, 10, 3397–3409. [Google Scholar] [CrossRef]
  5. Mazouffre, S.; Dannenmayer, K.; Pérez-Luna, J. Examination of plasma-wall interactions in Hall effect thrusters by means of calibrated thermal imaging. J. Appl. Phys. 2007, 102, 023304. [Google Scholar] [CrossRef]
  6. Semenkin, A.V. Investigation of Erosion in Anode Layer Thruster and Elaboration High Life Design Scheme. In Proceedings of the International Electric Propulsion Conference, Seattle, WA, USA, 13–16 September 1993; Volume 23. [Google Scholar]
  7. Kapulkin, A.; Grishkevich, A.D.; Prinsyakov, V. Outside Electric Field Thruster. Space Technol. 1995, 15, 391–394. [Google Scholar] [CrossRef]
  8. Mazouffre, S.; Tsikata, S.; Vaudolon, J. Development and experimental characterization of a wall-less Hall thruster. J. Appl. Phys. 2014, 116, 243302. [Google Scholar] [CrossRef]
  9. Ding, Y.; Peng, W.; Sun, H.; Wei, L. Performance characteristics of No-Wall-Losses Hall Thruster. Eur. Phys. J. 2017, 226, 2945–2953. [Google Scholar] [CrossRef]
  10. Karadag, B.; Cho, S.; Funaki, I.; Hamada, Y.; Komurasaki, K. External Discharge Plasma Thruster. J. Propuls. Power 2018, 34, 1094–1096. [Google Scholar] [CrossRef]
  11. Simmonds, J.; Raitses, Y. Ion acceleration in a wall-less Hall thruster. J. Appl. Phys. 2021, 130, 093302. [Google Scholar] [CrossRef]
  12. Simmonds, J.; Raitses, Y. Mitigation of breathing oscillations and focusing of the plume in a segmented electrode wall-less Hall thruster. Appl. Phys. Lett. 2021, 119, 213501. [Google Scholar] [CrossRef]
  13. Hamo, O.; Lev, D.R.; Rubanovich, M.; Kapulkin, A.; Lefkowitz, J. Experimental investigation of an external discharge very low anode power (≪20 W) hall thruster. J. Electr. Propuls. 2022, 1, 112820. [Google Scholar] [CrossRef]
  14. Ren, L.; Wang, Y.; Jin, L.; Zhou, K.; Fu, Y.; Sun, A.; Ding, W. Effect of radial scaling down on the performance of low-power external discharge plasma thrusters. Vacuum 2023, 216, 112460. [Google Scholar] [CrossRef]
  15. MacDonald-Tenenbaum, N.; Pratt, Q.; Nakles, M.; Pilgram, N.; Holmes, M.; Hargus, W. Background Pressure Effects on Ion Velocity Distributions in an SPT-100 Hall Thruster. J. Propuls. Power 2019, 35, 403–412. [Google Scholar] [CrossRef]
  16. Walker, M.L.R. Effects of Facility Backpressure on the Performance and Plume of a Hall Thruster. Ph.D. Thesis, University of Michigan, Ann Arbor, MI, USA, 2005. [Google Scholar]
  17. Jovel, D.R.; Cabrera, J.D.; Walker, M.L. Current pathways model for hall thruster plumes in ground-based vacuum test facilities: Measurements and observations. J. Electr. Propuls. 2024, 3, 35. [Google Scholar] [CrossRef]
  18. Zhou, J.; Modesti, A.; Ahedo, E. Analysis of the facility effects on the plume expansion of a low power Hall effect thruster. In Proceedings of the 38th International Electric Propulsion Conference, Toulouse, France, 23–28 June 2024. [Google Scholar]
  19. Huang, W.; Gilland, J.H.; Herman, D.; Mullins, C.; Hohman, K. A Facility Effect Characterization Test of the BHT-6000 Hall Thruster. In Proceedings of the AIAA SCITECH 2024 Forum, Orlando, FL, USA, 8–12 January 2024; p. 2366. [Google Scholar]
  20. Karadag, B. External Discharge Plasma Thruster. Ph.D. Thesis, Department of Space and Astronautical Science, The Graduate University for Advanced Studies, Kanagawa, Japan, 2018. [Google Scholar]
  21. Karadag, B.; Cho, S.; Oshio, Y.; Hamada, Y.; Funaki, I.; Komurasaki, K. Preliminary Investigation of an External Discharge Plasma Thruster. In Proceedings of the 52nd AIAA/SAE/ASEE Joint Propulsion Conference, Salt Lake City, UH, USA, 25–27 July 2016. [Google Scholar] [CrossRef]
  22. Ahmed, M.; Karadag, B.; Masillo, S.; Lucca Fabris, A. Development of a modular hollow cathode for ground testing of plasma thrusters. Vacuum 2024, 219, 112653. [Google Scholar] [CrossRef]
  23. Hofer, R.R.; Peterson, P.Y.; Gallimore, A.D. Characterizing Vacuum Facility Backpressure Effects on the Performance of a Hall Thruster. In Proceedings of the International Electric Propulsion Conference, Ann Arbor, MI, USA, 15–19 October 2001. [Google Scholar]
  24. Byrne, M.P.; Roberts, P.J.; Jorns, B.A. Coupling of Electrical and Pressure Facility Effects in Hall Effect Thruster Testing. In Proceedings of the 37th International Electric Propulsion Conference, Massachusetts Institute of Technology, Cambridge, MA, USA, 19–23 June 2022. [Google Scholar]
  25. Diamant, K.; Spektor, R.; Beiting, E.; Young, J.; Curtiss, T. The Effects of Background Pressure on Hall Thruster Operation. In Proceedings of the 48th AIAA/ASME/SAE/ASEE Joint Propulsion Conference & Exhibit, Atlanta, GA, USA, 30 July–1 August 2012. [Google Scholar] [CrossRef]
  26. Munro-O’Brien, T.F.; Ryan, C.N. Performance of a low power Hall effect thruster with several gaseous propellants. Acta Astronaut. 2023, 206, 257–273. [Google Scholar] [CrossRef]
  27. Polk, J.E.; Pancotti, A.; Haag, T.; King, S.; Walker, M.; Blakely, J.; Ziemer, J. Recommended practices in thrust measurements. In Proceedings of the 33rd International Electric Propulsion Conference, Washington, DC, USA, 6–10 October 2013; pp. 2013–2440. [Google Scholar]
  28. Zafran, S.; Kemp, R.F. Colloid microthruster test stand. J. Spacecr. Rocket. 1969, 6, 1144–1147. [Google Scholar] [CrossRef]
  29. Masillo, S.; Stubbing, J.; Swar, K.; Staab, D.; Garbayo, A.; Lucca Fabris, A. Validation of a torsional balance for thrust measurements of Hall effect and microwave-based space propulsion systems. Rev. Sci. Instruments 2022, 93, 114501. [Google Scholar] [CrossRef]
  30. Ahmed, M.; Lucca Fabris, A. Plume characterisation of a low power external discharge plasma thruster. In Proceedings of the 38th International Electric Propulsion Conference, Toulouse, France, 23–28 June 2024. [Google Scholar]
  31. Karadag, B.; Cho, S.; Funaki, I. Thrust performance, propellant ionization, and thruster erosion of an external discharge plasma thruster. J. Appl. Phys. 2018, 123, 153302. [Google Scholar] [CrossRef]
  32. Brown, D.L.; Walker, M.L.R.; Szabo, J.; Huang, W.; Foster, J.E. Recommended Practice for Use of Faraday Probes in Electric Propulsion Testing. J. Propuls. Power 2017, 33, 582–613. [Google Scholar] [CrossRef]
  33. Masillo, S. Experimental Characterisation of a Novel Hall-Type Plasma Thruster for Small Satellite Applications. Ph.D. Thesis, University of Surrey, Guildford, UK, 2023. [Google Scholar]
  34. Satpathy, D.; Kawabata, S.; Sekine, H.; Kawashima, R.; Komurasaki, K.; Koizumi, H. Investigation of correlation between thrust and anode temperature during transient operation of RAIJIN-66. J. Electr. Propuls. 2023, 2, 5. [Google Scholar] [CrossRef]
  35. Magnet Sales. SmCo Grades Data Sheet. Available online: https://magnetsales.co.uk/wp-content/uploads/2023/10/MSS-SmCo-Grades-Data-sheet.pdf (accessed on 10 October 2022).
  36. Simmonds, J. Studies of Thrust Density Limits in Hall Thrusters. Ph.D. Thesis, Princeton University, Princeton, NJ, USA, 2022. [Google Scholar]
Figure 1. The schematic of the stationary plasma thruster (SPT) and external discharge plasma thruster (XPT).
Aerospace 12 00601 g001
Figure 2. The magnetic field topology simulated using FEMM along the anode centreline.
Aerospace 12 00601 g002
Figure 3. External Discharge Plasma Thruster (XPT) cross-section with each key component highlighted, designed for a nominal operational power of 150–200 W.
Aerospace 12 00601 g003
Figure 4. The variation in the radial magnetic field with different axial distances at three different azimuthal positions. Simulated data and measured data included. Here, the position at 0 mm represents the anode and the further forward part of the thruster.
Aerospace 12 00601 g004
Figure 5. A view of the modular hollow cathode showing the zigzag heater assembly and the bias terminals of the assembly.
Aerospace 12 00601 g005
Figure 6. Laser triangulation sensor output for a standard calibration, where the raw single filtered signal and the two steady states are shown.
Aerospace 12 00601 g006
Figure 7. The torsional balance used at the University of Surrey for direct thrust measurements [29]. 1. Balance beam (moving part). 2. Base plate (static part). 3. Vibration-dampening feet. 4. Water-cooled flexure pivot hub. 5. Load cell mounted on linear stage. 6. Piezo-motor to actuate linear stage. 7. Optical fiber displacement sensor. 8. Counterweights. 9. Locking brackets for assembly and safety. 10. Waveguides. 11. Copper disk and neodymium magnet for eddy brake. 12. Static part propellant line bulkheads. 13. Propellant line (single line pictured, capacity of up to 3 lines). 14. Liquid metal electrical connectors. 15. Moving part propellant line bulkheads. 16. Thruster interface plate.
Aerospace 12 00601 g007
Figure 8. The calibration undertaken at the University of Surrey for the torsional thrust balance.
Aerospace 12 00601 g008
Figure 9. An illustration of the dynamic components of the counterbalanced inverted pendulum thrust stand design used within this work.
Aerospace 12 00601 g009
Figure 10. A computer-aided design rendering of the complete inverted pendulum thrust balance. The laser triangulation sensor employed is the ILD1750-10 from MicroEpsilon. The Eddy breaks are simple samarium cobalt permanent magnets and laminated copper plates.
Aerospace 12 00601 g010
Figure 11. A calibration run example undertaken at the University of Southampton, where the applied force is shown to have a linear relationship with the measured displacement.
Aerospace 12 00601 g011
Figure 12. The XPT operating within the large vacuum chamber facility at the University of Southampton.
Aerospace 12 00601 g012
Figure 13. The measured thrust of the XPT whilst operating in the University of Surrey’s vacuum facility.
Aerospace 12 00601 g013
Figure 14. The measured discharge voltage and discharge current of the XPT whilst operating in the University of Surrey’s vacuum facility.
Aerospace 12 00601 g014
Figure 15. The measured thrust of the XPT whilst operating in the University of Southampton’s large vacuum chamber facility.
Aerospace 12 00601 g015
Figure 16. The measured anode discharge voltage and discharge current of the XPT whilst operating in the University of Southampton’s large vacuum chamber facility.
Aerospace 12 00601 g016
Figure 17. In the final test configuration, the thruster was operated at an anode voltage of 330 V with an anode mass flux of 12 sccm. The cathode operation was constant at a 3 sccm xenon mass flux, 6.5 A heater current, and 2.5 A keeper current. The test resulted in an anode power of 550 W, producing a thrust of 11.8 mN, anode efficiency of 9.9%, specific impulse of 1003 s, and thrust-to-power ratio of 20 mN/kW. During the test, the anode was observed to sputter into the plasma, potentially causing a spike in the anode current. In under 30 s, the anode was observed to glow, indicating melting in the top left side of the anode.
Aerospace 12 00601 g017
Figure 18. Measured thrust produced by the XPT at various anode mass fluxes in both the University of Surrey and University of Southampton vacuum chambers.
Aerospace 12 00601 g018
Figure 19. Measured anode efficiency of the XPT across a range of anode mass fluxes in the University of Surrey and University of Southampton facilities.
Aerospace 12 00601 g019
Figure 20. Thrust-to-power ratio versus specific impulse for the XPT at various anode mass fluxes, measured at both the Surrey and Southampton facilities. Here, the dotted iso-lines represent lines of constant anode efficiency.
Aerospace 12 00601 g020
Figure 21. (top) A front view of the thruster after discharge envelope and performance characterisation, showing visible damage to the anode on the top left-hand side of the thruster assembly. The locations of the two magnetic flux density measurement points, P1 and P2, are indicated. (bottom) A comparison of the magnetic flux density at P1 and P2 before and after testing, alongside the simulated magnetic flux density produced in FEMM.
Aerospace 12 00601 g021
Figure 22. On the left are the anode current and chassis temperature as a function of the operational time at 250 V and 6 sccm of anode mass flux for the mini-XPT. On the right, the two temperature measurement points are indicated. The cathode operated at 1 sccm and a 2.5 A constant keeper current.
Aerospace 12 00601 g022
Figure 23. (top) The Faraday sweeps at a 250 V anode voltage for 6 sccm and 8 sccm of anode mass flux for the mini-XPT. (bottom) The discharge and utilisation efficiencies as a function of the anode voltage at 8 sccm of anode mass flux for the mini-XPT. The cathode operated on 1 sccm of cathode xenon mass flux and a 2.5 A constant keeper current.
Aerospace 12 00601 g023
Table 1. Comparison of the University of Surrey’s Daedalus chamber and the University of Southampton’s large vacuum chamber test facilities.
UoSurreyUoSouthampton
Chamber SizeØ1.5 m × 3 mØ2.0 m × 4.5 m
Roughing PumpsE2M2LV140C
Cryo Pumping18,000 L/s21,800 L/s
Turbo PumpingN/A4200 L/s
Total Pumping Speed18,000 L/s26,000 L/s
Base Pressure 6 × 10 6 mbar<9 × 10 8 mbar
Table 2. The statistical results of the calibration run, as seen in Figure 8.
ValueUnitsUoSurrey Calibration
S c a l μm/mN3.78
b c a l μm73.56
N c a l #30
F ¯ c a l mN6.69
σ δ μm1.36
σ F μN358.67
σ S c a l μm/mN0.07
c a l e r r o r -1.86%
Table 3. The statistical results of the calibration run seen in Figure 11.
ValueUnitsUoSouthampton Calibration
S c a l μm/mN5.48
b c a l μm0.41
N c a l #28
F ¯ c a l mN1.56
σ δ μm0.45
σ F μN82.94
σ S c a l μm/mN0.06
c a l e r r o r -1.07%
Table 4. The results of the statistical analysis of the calibration process from both thrust stands prior to testing the XPT thruster. It is worth noting that the calibration offset does not reflect the quality of the calibration but rather is just a zeroing operation. The values that directly contributed to the error bar magnitude are shown in bold face. * The large offset is due to the calibration process at Surrey using the absolute distance from the sensor.
ValueUnitsUoSouthamptonUoSurrey
S c a l μm/mN5.483.78
b c a l μm0.4173.56 *
N c a l #2830
F ¯ c a l mN1.566.69
σ δ μm0.451.35
σ F μN82.95358.67
σ S c a l μm/mN0.0580.071
c a l e r r o r -1.07%1.86%
Disclaimer/Publisher’s Note: The statements, opinions and data contained in all publications are solely those of the individual author(s) and contributor(s) and not of MDPI and/or the editor(s). MDPI and/or the editor(s) disclaim responsibility for any injury to people or property resulting from any ideas, methods, instructions or products referred to in the content.

